Article

Using Computer Vision for Monitoring the Quality of 3D-Printed Concrete Structures

by
Shanmugaraj Senthilnathan
and
Benny Raphael
*
Civil Engineering Department, Indian Institute of Technology Madras, Chennai 600036, India
*
Author to whom correspondence should be addressed.
Sustainability 2022, 14(23), 15682; https://doi.org/10.3390/su142315682
Submission received: 14 October 2022 / Revised: 10 November 2022 / Accepted: 22 November 2022 / Published: 25 November 2022
(This article belongs to the Special Issue Structural Health Monitoring and Sustainable Built Structures)

Abstract

:
Concrete 3D printing has the potential to reduce material and process waste in construction. Thus, it contributes to making the construction industry more sustainable through the use of digital-fabrication technologies. While concrete 3D printing is attractive due to its potential to realize complex designs, practical challenges include an increased chance of defects and deformities. Quality assessment of 3D-printed elements is essential for large-scale implementation. Workability of concrete is known to decrease with printing time and it impacts extrudability. It is usually visible in 3D-printed elements, with the lower layers having a smooth finish, while the top layers have cracks and discontinuities. A computer-vision-based quality assessment method is proposed in this paper using a two-bin Linear Binary Pattern textural analysis. Information entropy is used as the metric for measuring the texture variation within each layer and its changes over the layers are studied. A higher entropy value is found for layers having deformities. Finally, through the error-minimization technique, a threshold entropy value is calculated and, using this, the printed layers can be assessed and corrective actions taken. This paper contributes to developing a non-intrusive quality assessment technique for concrete 3D-printed elements.

1. Introduction

Concrete 3D printing (3DP) is a promising technique that can potentially overcome many challenges in conventional concrete construction. Concrete 3DP is found to reduce waste production by 60%, construction time by 50–70%, and labor costs by 50–80% [1]. It can reduce the construction cost by up to 35% compared to conventional construction [2]. By reducing waste, concrete 3DP has the potential to improve the sustainability of the construction industry. Optimal design of structures in terms of material and topology is another significant advantage of concrete 3D printing [3,4]. Despite a lot of research in this area, the practical application of this technology relies on trial and error and heuristics-based calibration of material parameters [5]. As a result, the output quality of 3D-printed elements is highly variable, resulting in a waste of material, effort, and time.
Conventional concrete construction involves pouring large volumes of concrete designed with sufficient safety factors and utilizes formwork to maintain the geometry. If the structural and durability requirements are met, slight deviations in the concrete mix or other properties will not be a major concern. In the case of concrete 3D printing, thin layers of concrete of about 2.5–5 cm thickness are continuously extruded without any formwork. As a result, even small differences in the print mix and other properties significantly impact the aesthetic and structural quality of the concrete extrudate [6]. As the industry is moving towards optimized construction worldwide, stringent monitoring of the printing process is essential to ensure quality. A methodology to continuously monitor the 3D-printing process helps to take necessary actions on time to avoid wastage of material. By reducing wastage, the sustainability aspects of concrete 3D-printing technology can be improved.
Most recent research has focused on the material properties of 3D-printing concrete in wet and hardened states. Verifying 3D-printed elements for their quality and geometrical accuracy is not given much attention [7]. The quality of the 3D-printing process must be constantly evaluated because it could affect the strength and stability of large-scale concrete 3D printing [8]. A self-sustaining monitoring system is required to continually monitor and assess the quality of the concrete 3D-printing process [9].
The workability of 3D-printed concrete decreases as the open time increases [10]. As a result, the yield stress of the concrete increases and, eventually, extruded concrete through the nozzle shows discontinuities. This is commonly visible in concrete 3D-printed elements, which have a smooth surface texture at the bottom layers and rough granular top layers containing more voids.
The granular texture and small voids forming on the surface are indications of a reduction in the workability and extrudability of the mix. Additional stress must be applied in such conditions to make concrete flow without discontinuities. However, finding the exact point in time when additional stress must be given is difficult to determine. Studies have tried to measure the mix workability while printing is taking place to use it as feedback to control the printing process. However, the measurement of workability in these studies is quantified indirectly by measuring shear stress and yield stress of the mix based on physical measurement devices, such as rheometers [11]; these measurements are difficult to obtain in real time.
Studies based on machine learning (ML) and computer vision (CV) are gaining popularity in almost all industries. Due to their ability to provide solutions for complex problems, ML-based and CV-based solutions are increasingly being adopted in Additive Manufacturing (AM) or the 3D-printing industry [12]. The methodology proposed in this study uses computer vision (CV)-based textural analysis methods to quantify the textural variations on the surface of concrete 3D-printed layers. A 2D camera is used to capture images of the different layers and each layer image is subjected to texture analysis to find the textural pattern within the layers. The contribution of this paper is the application of a texture analysis algorithm and the use of a new metric for quantifying the textural variations in 3D-printed concrete layers.
This work contributes to developing an automated non-intrusive CV-based methodology for quality assessment of concrete 3D-printed layers. The extracted textural patterns could be used as feedback to make corrective actions in the printing process.

2. Materials and Methods

2.1. Previous Studies

Common challenges in concrete 3DP are pumpability, extrudability, buildability, and structuration rate [13]. Pumpability is the ability of the concrete mix to be pumped through the pipes and to facilitate flow under pressure without much change in the initial properties [14]. Extrudability is the property of a 3D-printing concrete to have sufficient properties to pass through a rigid nozzle with high shear and maintain a liquid behavior [15]. Buildability is the ability of the concrete layer to hold the weight of the successive layers without any unusual deformation [16]. If the bottom layers of concrete 3D-printed elements do not have adequate yield stress, the layer thickness tends to reduce or flow away under the weight of the accumulated layers [17].
Rheology is the study of the flow of matter and its deformation under stress. It comprises properties, such as viscosity, yield stress, and thixotropy. Dynamic yield stress is the minimum stress value required at a point in time to initiate flow and is considered an essential aspect of the printed layers’ stability. The material’s dynamic yield stress must be low for the concrete in the 3D-printing hopper to flow out of the nozzle (to be extrudable). The yield stress increases with time and after a specific time, it will render the material non-extrudable [18]. Thixotropy is a reversible phenomenon in which the material develops flocculation, reducing flowability of concrete with time. However, the flowability is reversed when subjected to external stress [9]. Hence, the thixotropy also decreases the flowability of the mix, making the concrete non-extrudable [19]. Since most 3D printers have screw auger mechanisms to extrude the concrete, with the shearing of the material through the blades, the concrete regains its flowability, making it extrudable.
The two main criteria that need to be satisfied to obtain a good printable mix are extrudability and buildability [20]. These can be achieved by adjusting the workability of the mix [10]. Pumpability, extrudability, and buildability properties of concrete are highly dependent on variables such as flowability, rheological properties, and open time [18]. With respect to open time, the workability of 3D-printable thixotropic concrete tends to reduce with time.
Extrudability of concrete 3DP (3D printing) is achieved only if the yield stress of the mix lies in a range of 1.5–2.5 kPa [21]. If the yield stress is less than this value, the concrete lacks sufficient strength to achieve shape stability. If the yield stress exceeds the above value, discontinuities occur and the extrudability is difficult. The yield stress measurement is an indirect measurement of the flow rate/workability of the concrete mix [22]. There have been multiple studies that suggest an optimum range of rheological properties using different tests for the extrudability of different concrete 3D-printing mixes [18,23,24]. Studies have used vane shear apparatus directly connected to the concrete hopper to measure the yield stress as an indirect flow rate measurement, which is used in a feedback loop to control the 3D-printing process [11]. However, all these studies provide a range of workability where the extrudability and buildability aspects are satisfied. None of the above-mentioned studies provide the rate of reduction in workability over time [25]. Studying the workability changes with time will provide valuable information about the rheology and structural change rate of concrete [26]. In a previous study, three tests, namely, slump cone test, flow table test, and penetration test, were used to study the evolution of workability with time [27]. However, these tests cannot be performed during the printing process, so they cannot be used as real-time feedback to the system to make corrective actions. Real-time non-intrusive measurement methods to quantify the changes in workability and extrudability of concrete over time could not be found in the literature.
ML-based studies in the construction industry are becoming popular [4] and there are several studies on its application to concrete 3D printing. For example, Artificial Neural Networks (ANNs) have been used to predict the compressive strength [28] and the tensile strength of 3D-printed concrete [29]. Correlation between the printing parameters and the resulting concrete 3DP extrudate learnt using an ANN model was used to adjust the nozzle-outlet shape to achieve the required extrudate geometry [30].
Computer vision (CV) is an area of ML that uses images or visual data as input. The major advantage of CV-based techniques is that they can be used as continuous quality monitoring and assessment tools for concrete 3DP. Some studies have focused on the deformation analysis of concrete 3D-printed elements. The layer-thickness deformation analysis was performed using CV techniques with input devices, including monocular camera, LiDAR, and LiDAR camera. It was found that low-cost sensors, such as cameras, are faster in acquiring and processing the data in detecting deformations in concrete 3D-printed structures [5,7]. Further, CV-based techniques were used to quantify the layer deformations in concrete 3D printing under different printing variables, such as layer thickness, printing orientation, and printing direction [31]. A 2D camera was used to continuously capture the width of the top layer of printing. The variation in the width of the printed layer was monitored to find over-extrusion or under-extrusion in concrete 3DP [6]. Similarly, 2D-camera images were used to find the layer deformations using Convolutional Neural Networks (CNNs) and other CV methodologies [32]. All the studies mentioned above are quality-assessment studies where CV-based methods are used to detect defects/deformities and improve the overall quality. However, no study has focused on monitoring the continuous workability changes and their impact on the extrudability aspect of concrete 3D-printed elements.
CV-based methods have been used for behavior prediction, defect detection, and quality assessment in additive manufacturing using other materials, such as plastic. Thus, 2D image data have been used as feedback for continuous monitoring and autonomously correcting the 3D-printing parameters for better-quality prints [33]. A layer-by-layer continuous quality monitoring framework was developed for additive-manufacturing-based 3D printing. It used a sample image and compared it with the real-time print image, and the difference images were fed into control charts to monitor the layer-by-layer printing process [34]. Surface roughness prediction using machine learning techniques has also been conducted [35]. Where defects, such as nozzle jamming and layer misalignment, are critical, deep learning methods have been developed to detect the defects [36]. The performance of additive-manufactured parts is highly dependent on the processing parameters, and ML-based techniques can be used to find optimal processing parameters for better-quality output. ML-based methods have also been used to predict the structural performance and fracture of the additive-manufactured parts [37]. A literature review on the number of studies in the monitoring and control of additive manufacturing indicates that there is a total of 200+ studies util the middle 2020 and they are on a continuous increase [38]. It emphasizes the importance given to monitoring and controlling of the additive-manufacturing industry. In comparison, the number of studies on concrete 3DP is minimal and highlights the requirement for more studies in manufacturing and control.
The above studies prove that as printing time increases, workability reduces, leading to voids and discontinuities (reduction in extrudability). The decrease in extrudability has been determined previously using physical tests only. There are no non-intrusive continuous measurements of this phenomenon. Further, the concrete surface may have defects such as void formation and discontinuities due to reduction in workability as a result of reduction in moisture content and cohesion. This current study focuses on indirectly detecting the defects on the surface of concrete 3D-printed elements.

2.2. Objective

The main objective of this study is to investigate the potential of computer vision (CV)-based techniques to assess the quality of concrete 3D-printed elements. Non-intrusive quality assessment in real time during the printing process helps in giving early alerts of possible defects/deformations happening in already printed layers. Appropriate steps could be taken to avoid loss of material and time, for example, stop the printing process or change the printing parameters.
The computer vision technique investigated in this study involves the analysis of textural patterns on the surface of 3D-printed concrete layers using feature-extraction methods. It involves three sub-objectives:
  • Identifying appropriate texture-extraction algorithms.
  • Defining metrics for inferring the textural feature quality of the concrete 3DP element.
  • Defining thresholds or ranges of values of the metrics for decision-making related to rectification actions.

2.3. Image Textural Analysis Methods

Texture, in general, can be referred to as tactile texture and visual texture. The tangible feel of a surface is called tactile texture, whereas the contents and shape of the image are referred to as visual texture [39]. The texture in image analysis is defined as a function of spatial variation in the brightness intensity of pixels. It represents variations in coarseness, smoothness, and irregularity on the surface in different directions [40]. Textural analysis in computer vision has many advantages as it is used in object detection, pattern recognition, surface defect recognition, etc.
Several textural analysis methods were evaluated, and a method that appeared most promising was selected, namely, Local Binary Patterns (LBPs). This texture analysis is used because it can define the local contrast and local spatial structure of a complete image or a part of it. The major advantage of the LBP texture extractor is its robustness to monotonic gray-scale changes, such as illumination changes [41]. It is also computationally simple, making it easy to use for image analysis to obtain real-time data analysis.
In the case of image analysis, every image is a collection of individual pixels and each pixel has an intensity or brightness value that combines to form an image. In LBP, an 8-point neighborhood is considered for analysis for each point in an image. Then the intensity of the central pixel is compared with the intensity values of all the neighbors. If the brightness value of any neighbor pixels is more than the central pixels, the binary pattern of that neighbor is taken as one; otherwise, it is taken as zero. Finally, an LBP value is calculated by computing the binary-weighted sum of values in the extracted binary pattern. Figure 1 shows an example LBP value computation for a particular neighborhood of pixels.
Then, the LBP operator forms different bins for all the image pixels taking a 3 × 3 neighborhood of each pixel and taking the central value as the LBP value. Then the LBP value is converted into binary form and a histogram of these 256 bins is used as a textural representation of an image.
This study uses a modified version of LBP called a two-bin LBP texture extractor [42]. Instead of having an 8-point neighborhood, only the horizontal neighbors of the 2-point neighborhood are considered, taking only the left-hand and right-hand-side neighbors of a particular pixel. Similar to the general LBP methodology, it compares each neighbor with the central pixel and assigns extracted pattern as one or zero. Then it sets the LBP value of the central pixel as 200 only if the right neighbor is having greater value than the left neighbor. If the left neighbor value is greater than the right neighbor value or the left neighbor value is equal to the right neighbor value, the central pixel value is given a value of 100. Hence, the central pixel obtains a value of 200 only if the brightness/intensity increases in the horizontal direction when moved from left to right.
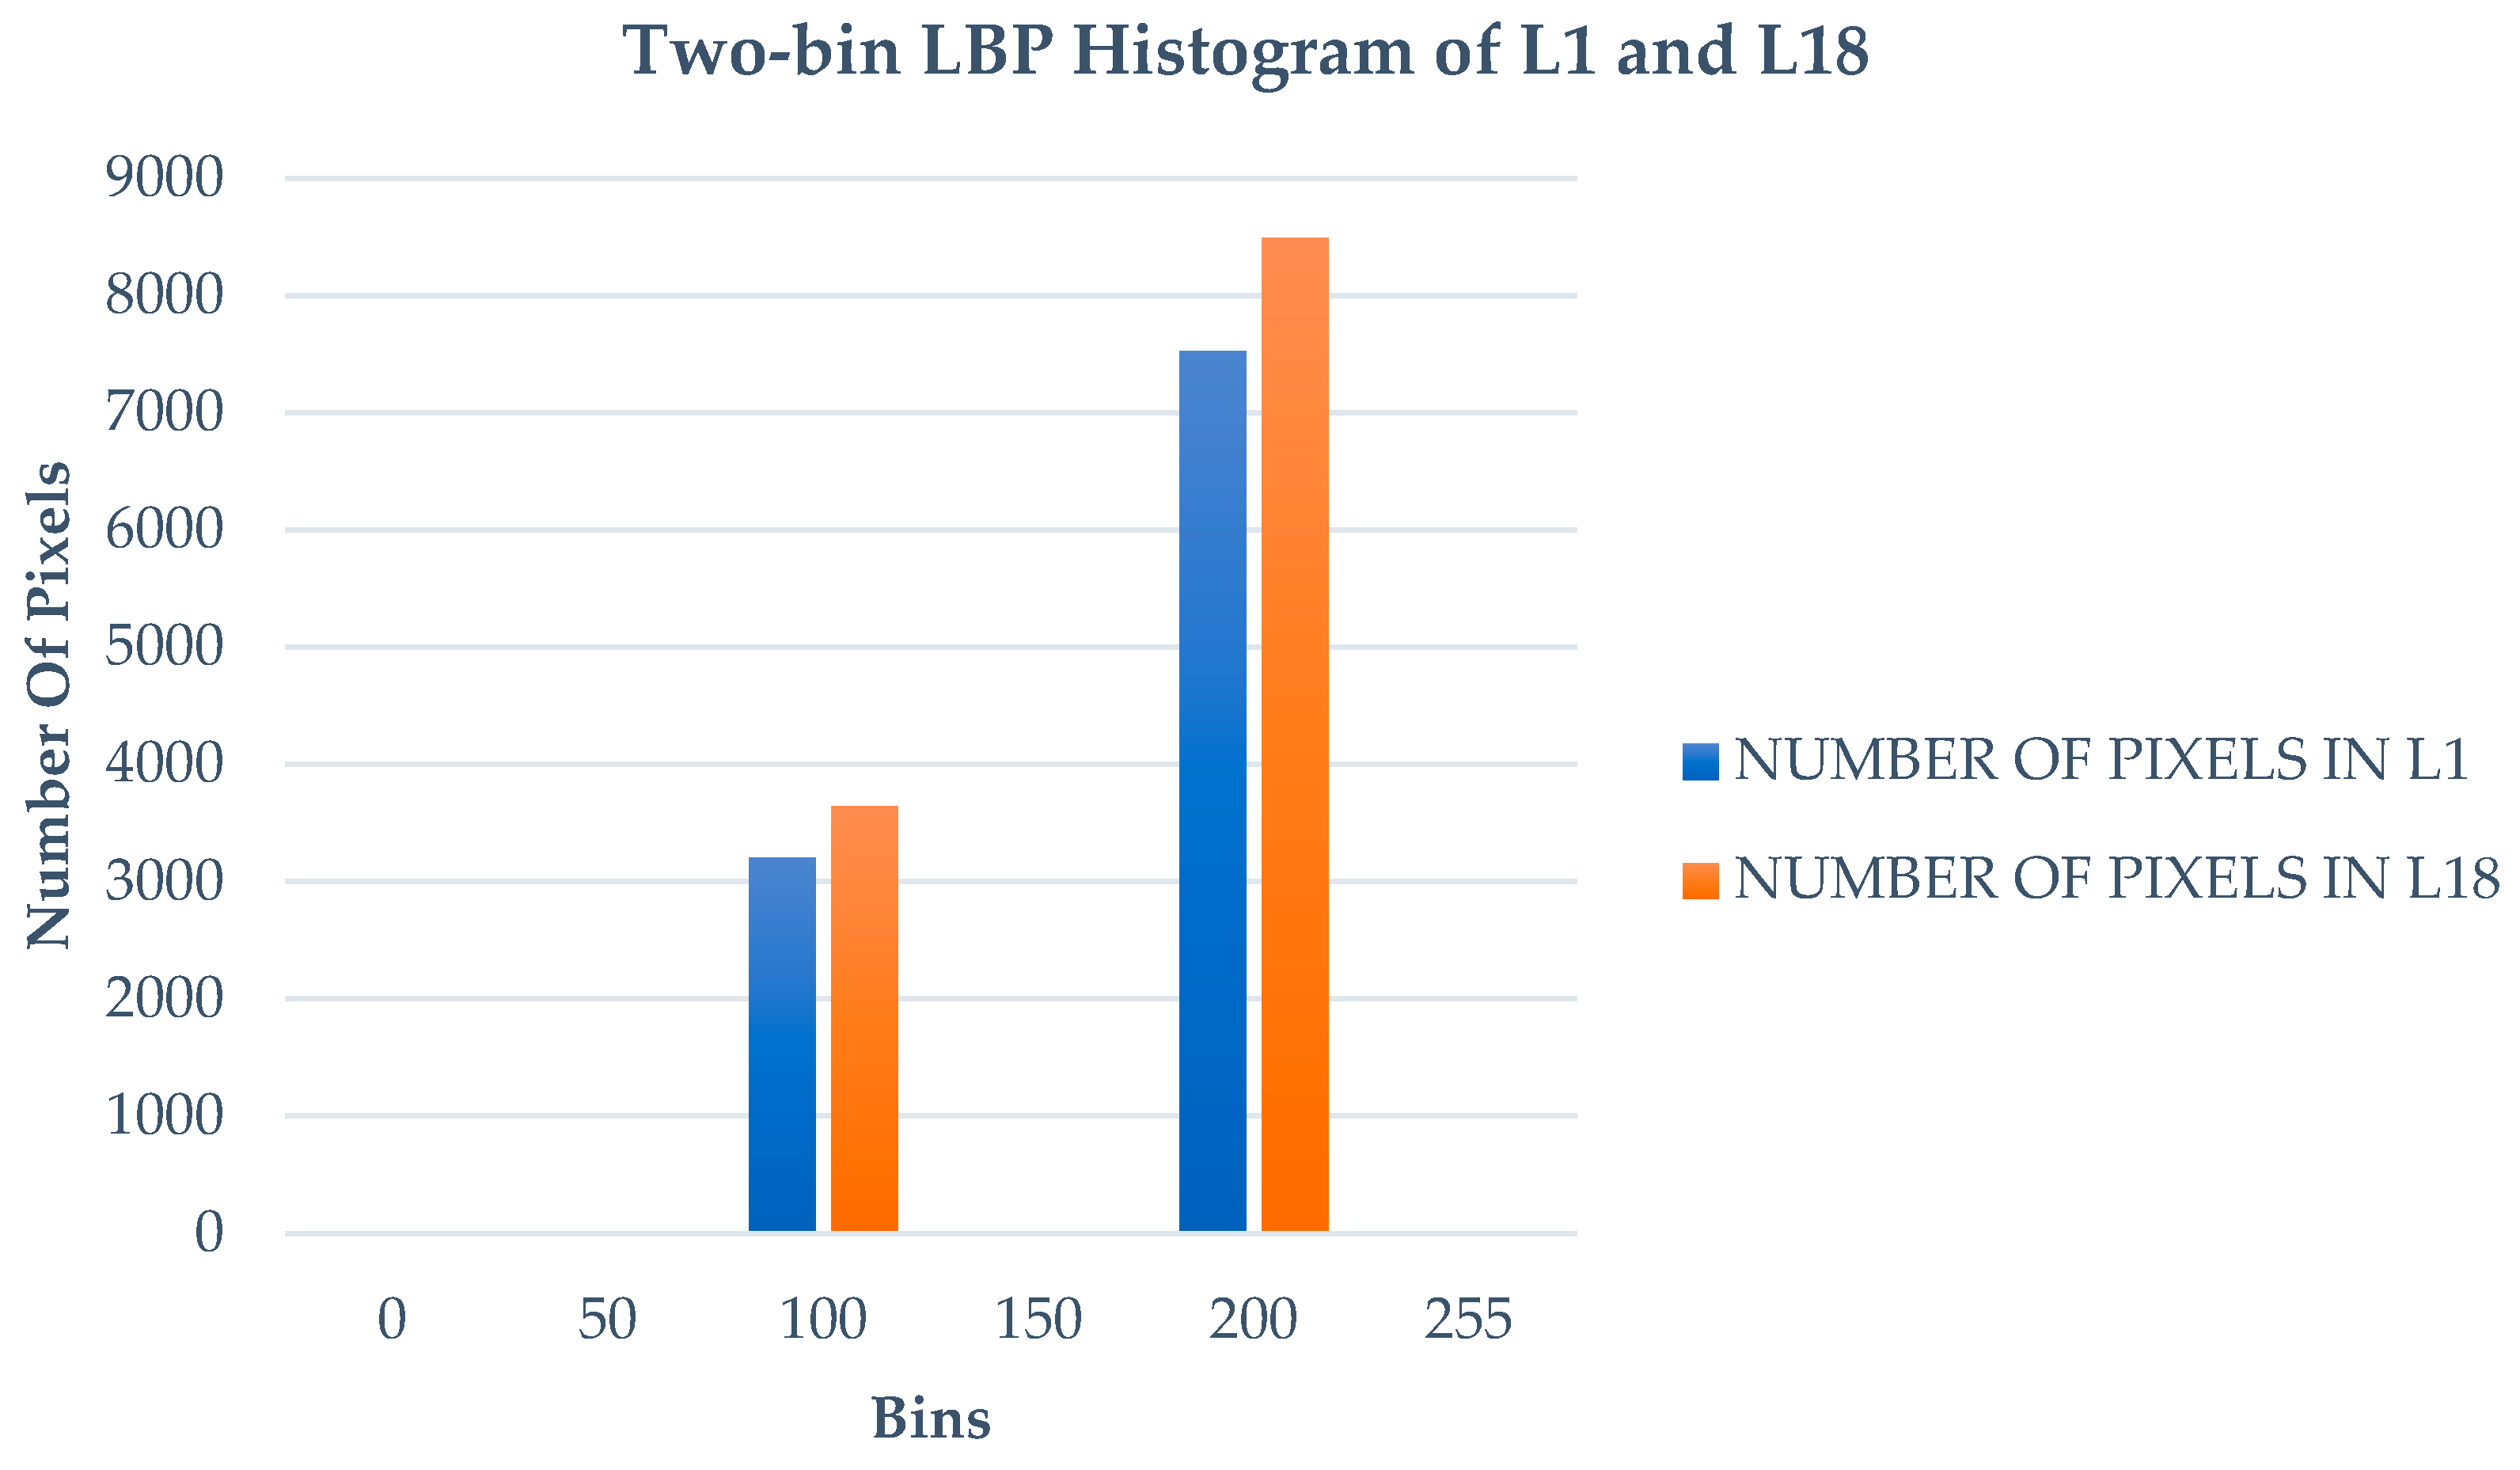
Figure 2 shows a two-bin LBP texture analysis on sample image pixels. Then, a two-bin LBP histogram is plotted with the x-axis as the LBP value bins 100 and 200, and the y-axis contains the number of pixels (frequency) with the corresponding LBP value. Two-bin LBP histogram indirectly measures horizontal gradient from the left to right direction.

2.4. Inferring Texture Feature Quality—A Measure of Variability

It is understood that with an increase in time, the thixotropy of the concrete material increases, ultimately reducing workability. If the same batch of concrete is used for printing multiple layers, the thixotropy of the concrete mix increases with time, leading to the formation of the granular textures on the surface of top concrete 3D-printed layers. Hence, the two-bin LBP texture histogram of a top-layer image will have a different pattern than the bottom-layer image. For better comparison and inference, a single measure of the texture pattern within a single image is needed.
The most common measure to quantify complexity, uncertainty, randomness, and regularity is information entropy [43]. Entropy is considered a function of the Probability Density Function (PDF) [44]. It can be for any signal, and for any given signal X, the entropy can be calculated as,
H(X) = −∫ p(x) log(p(x)) dx
The above formula is for a continuous variable X and the entropy calculation for it is called differential entropy. In the case of integer values of signal, the entropy is given by Shannon entropy as follows,
H(X) = −∑ p(m) log(p(m))
It is best used for discrete distributions and histogram analysis composed of successive bins indexed by an integer m ∈ [1:M], where M is the number of bins in the histogram. Each histogram bin represents an interval/possible value of X and p(m) represents the probability of the variable X to have its value in bin m. Shannon entropy introduced in the information theory is the most common type of entropy used.
Entropy analysis is used in quality-assessment studies in the additive-manufacturing industry. A combination of entropy analysis on the 3D scans of printed elements and the color of the filaments used for 3D printing was used to find the surface irregularities in the additive-manufacturing industry [45]. Another quality-assessment study is based on the local image entropy changes and their variation with additional color adjustment [46]. It works based on the assumption that the entropy value increases for images having surface deformities. Due to its advantages in measuring variability and its profound usage in additive manufacturing, entropy is chosen to be the measure for inferring textural feature quality in this study [45,46].

2.5. Materials Used

The CV-based methodology developed in this study is tested on 3D-printed concrete specimens within a laboratory setup. Printing is conducted using OPC 53-grade cement and Limestone Calcined Clay (LC2) as binders. The aggregate used is manufactured sand of 4.75 mm particle size. For workability, a PCE-based superplasticizer is used and a powdered form of Viscosity-Modified Admixture is used to play with the viscosity of the mix. Three different 3D-printed elements are printed and analyzed for this study. The test specimens were printed in the shape of circular columns of heights 300 mm, 700 mm and 1000 mm. A similar concrete mix design was used for all the 3D-printed elements. Only for the 700 mm high printed column, a chemical-based plasticizer is used which resulted in lot of deformities. The printer used is a gantry-based printer with an extruder capable of printing more than one-meter-height samples. The extrusion speed of the printing process is maintained at 40 mm/s for all the prints. The extrusion speed and the printing speed are not altered during printing.

2.6. Methodology

Figure 3 shows the methodology proposed in this study for processing the textural variations in the concrete 3DP elements using two-bin LBP texture analysis. The entire method is divided into three sections:
(1)
Image Data Collection
(2)
Extraction of textural features using the two-bin LBP analysis
(3)
Inferring print quality based on textural features—calculation of entropy
The methodology is demonstrated and evaluated using 3D-printed concrete elements in the shape of circular columns. Three 3D-printed elements are analyzed to determine the algorithm’s capability to detect possible quality issues. Thus, 2D images of the printed elements were taken immediately after printing to measure the textural changes in the concrete when it is in a fresh state. Hence, this study can be extended to study the variations in textures of the individual layers during the printing process. The printing was carried out in a closed laboratory environment to minimize the impact of temperature and humidity on the concrete 3D printing. Hence, the workability loss in the concrete due to evaporation is not considered in the scope of this study.

2.6.1. Image Data Collection

The concrete 3D-printed element images were taken using a Canon EOS 1300D DSLR camera of 18 MP resolution. The focal line of the camera is kept perpendicular to the outer surface of the concrete 3D-printed element to cover the maximum area of the outer layers of the concrete. Once the images are taken, the image containing the printed element part is divided into three vertical sections and only the central one-third portion is taken for assessment. The reason for this is to minimize the effect of the curved surface of the circular wall on the measurement of textural variations. Further, since analyzing each layer in a one-meter-long circular wall is complex, the central-section image is separated into two vertical images and analyzed separately.
It is difficult to take an image of a one-meter-long printed element with its focal line perpendicular to the printed element. Though two different images of the bottom and top portion of the element can be taken, to avoid any illumination and brightness changes in the entropy analysis, a single image is taken and separated into a top- and bottom-portion image. The images of the 300 mm, 1000 mm, and the 700 mm high 3D-printed elements are shown in the Figure 4, Figure 5 and Figure 6 respectively. The information related to the sections of printed elements considered for the analysis is summarized in Table 1.
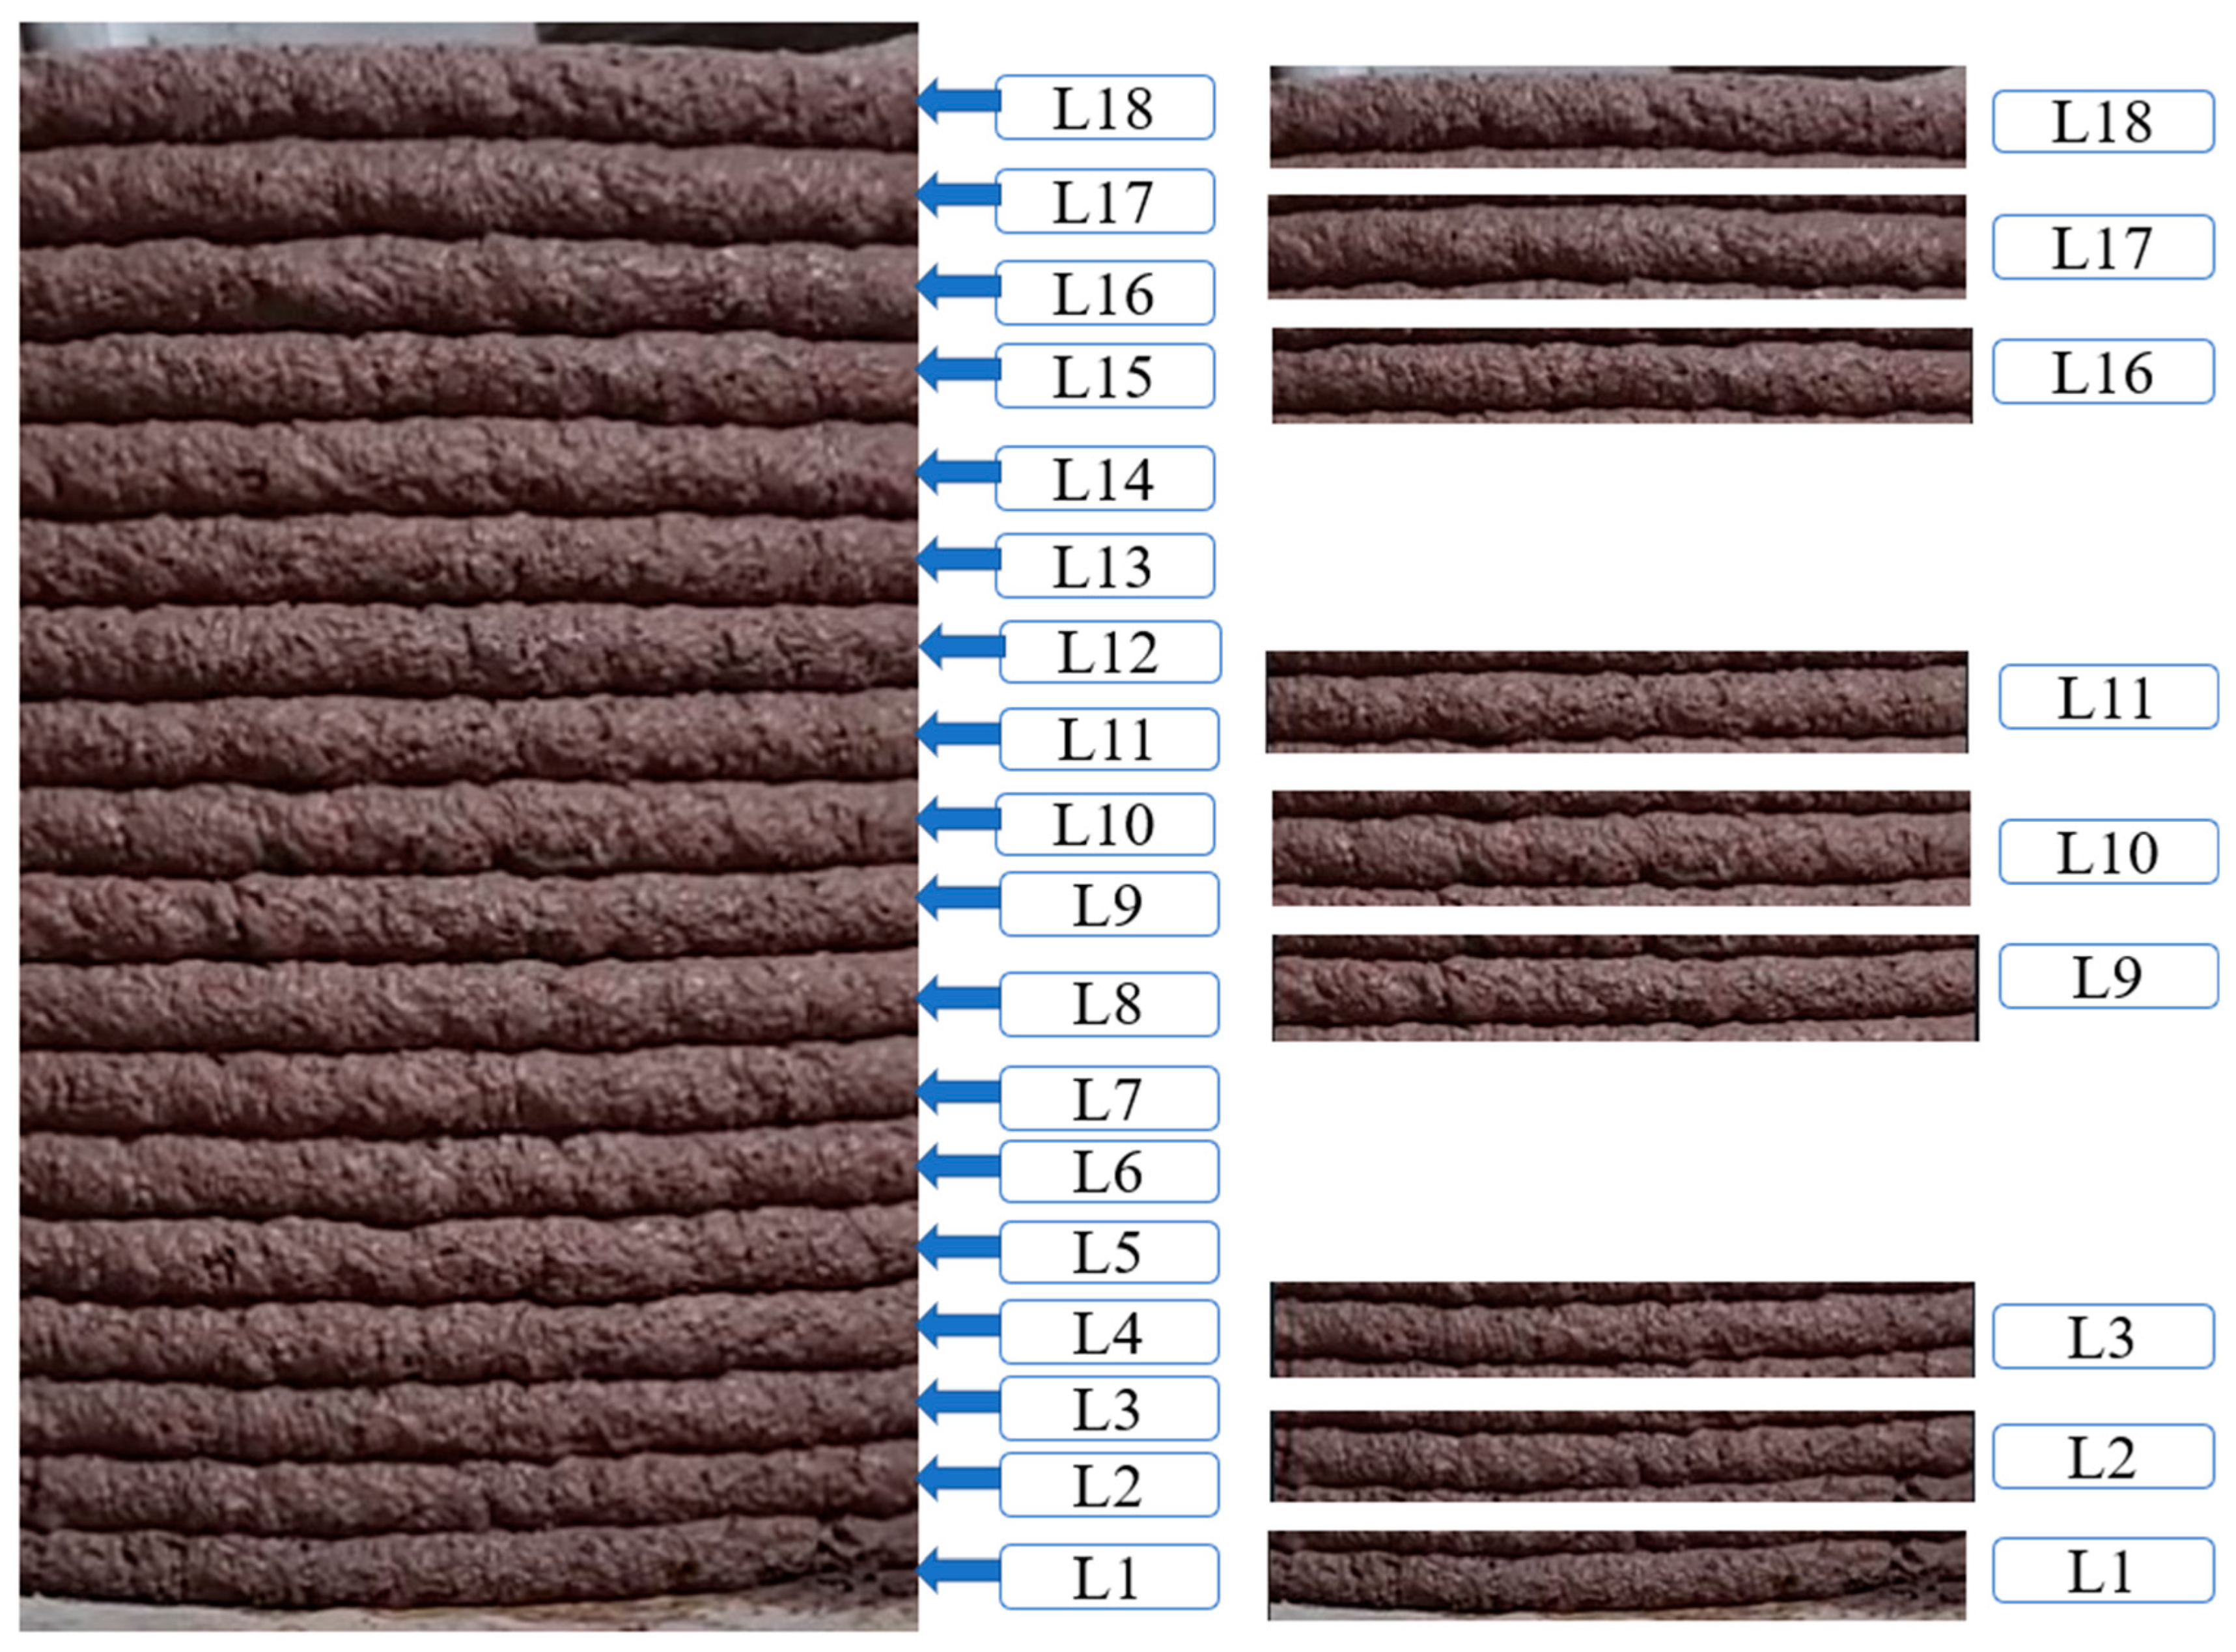
The texture analysis is performed on individual layers of each concrete 3DP element. The individual layer images are manually cropped from the main element images. The bottom-most layer is designated as Layer 1 (L1) and the layer number is increased for the subsequent printed layers. The individual designated layers of element A and a sample of the individual layers used for texture analysis are shown in Figure 7. Similar layer designation and cropping of individual layer images are followed for other Elements—B and C.
Cropping of individual layer images is performed manually in this study. However, it can be automated using image segmentation and individual layer detection methodologies using bounding boxes in computer vision (CV).
Since the main objective of this study is to evaluate the potential for using texture data to detect defects in 3D-printed elements, some sources of errors in the analysis are eliminated as follows: an image of the printed element consisting of multiple layers is taken at a time; this is cropped to separate individual layers and used for CV analysis. Since all the layers of the printed element are subjected to illumination from a single light source, the effects of variation in illumination and noise are substantially controlled. Furthermore, only relative variations among the different layers are used to make inferences; that is, the textural variations among layers of the same printed element are compared to identify parameters that quantify print quality. The relative values and the trends in the evolution of parameters are expected to be less affected by noise. In practice, these activities have to be performed prior to commencing actual printing of elements for automated monitoring.

2.6.2. Extraction of Texture Feature Using Two-Bin LBP Analysis

LBP feature extraction is applied to the images of individual layers of each concrete 3D-printed element—A, B, and C. The type of LBP feature extractor used in this study is a two-bin LBP extractor, which works similar to a horizontal gradient measurement methodology. The two-bin LBP feature extractor is implemented using codes written in the Google Colab platform and it takes the individual layer images as input. The output is a two-bin LBP histogram with an x-axis consisting of bin values ranging from 0 to 255 and a y-axis showing the number of pixels in each bin. Since it is a two-bin histogram, all the values will be concentrated on bins 100 and 200. It accumulates the variations between individual layers into two bins to quickly capture the textural variations. Each layer image of the concrete 3D-printed element generates a two-bin LBP histogram. An example of a two-bin LBP histogram generated for layer L1 and Layer L18 of section A1 is shown in Figure 8. The histogram indicates significant changes in the number of pixels in bins 100 and 200 of L1 and L18. It indicates the textural pattern changes within the concrete 3D-printed layers. The significant increase in the number of pixels in 200 bins in L18 compared to L1 shows high textural variations in the top layer (L18) compared to the bottom layer (L1).

2.6.3. Post-Processing of Two-Bin LBP Histogram to Calculate the Entropy

Entropy calculation is used to measure the textural variations within each layer of images. Entropy is a statistical measure of variations/randomness. The entropy of each two-bin LBP histogram can be generated using the following formula
Entropy = − ∑ Pi * log2 Pi
where Pi—ratio for number of pixels in bin i to the total number of pixels.
The entropy value is calculated for each layer, starting from each element’s bottom-most layer to its top-most layers. The entropy value provides an indirect measure of the textural pattern in each image and studying the variation in entropy over all the layers provides the variation in textural patterns over the layers. The entropy values are tabulated and plotted as graphs to obtain a final understanding of the entropy variations between each layer of concrete 3D-printed elements. The following section will present the entropy variation graphs and the inferences that can be obtained from the textural analysis.

3. Results

The methodology proposed in Section 2.6 is applied to the images of Elements—A, B, and C. The results of each concrete 3DP element are discussed in this section as follows.

3.1. Entropy Variations in Element A

Figure 9 shows the two-bin LBP histogram entropy values of each layer of Element A (Section A1) plotted as a graph. The graph indicates that the entropy value is initially high in the bottom layers and gradually slopes down as the analysis is moved to the top layers. The bottom-most layer (L1) is compressed against the printing platform purposely by giving less layer thickness during printing to act as a base to handle the layers above it. The layers L2 and L3 having considerably high entropy is due to the buildability aspects of concrete 3D printing. The bottom layers tend to reduce in thickness due to the weight of the layers printed above them. However, as the printing moves to the top layers, the thickness variation and the printing flow are regulated, which is indicated by gradually reducing entropy values. However, the entropy value increases later since the concrete loses its workability properties, as the time from the point of mixing the concrete has increased. Beyond layer L13, it rises even further, indicating the formation of a more granular texture on the surface of the layers due to the loss of workability.
Figure 7 indicates that the individual layers of Element A do not have any voids or discontinuities during printing and it was one of the better-quality printing elements achieved. However, the high entropy variations in the top layers of Element A show that the fine granular texture variation that is not observable in the human eye is captured in this methodology. If continued to print, the fine granular texture variations in concrete may increase and result in the formation of voids/discontinuities during concrete extrusion. The continuous monitoring of this entropy change will indicate early signs of extrusion failure, which can be averted.

3.2. Entropy Variations in Element B

Similar to Element A, individual layer images are cropped out from the Element B image for LBP texture analysis. The bottom layer is designated as L1 and the top-most element is represented as L67. Since Element B has a height of 1 m for better analysis purposes, the image is separated into a bottom-portion image (Section B1) and a top-portion image (Section B2), as shown in Figure 10.
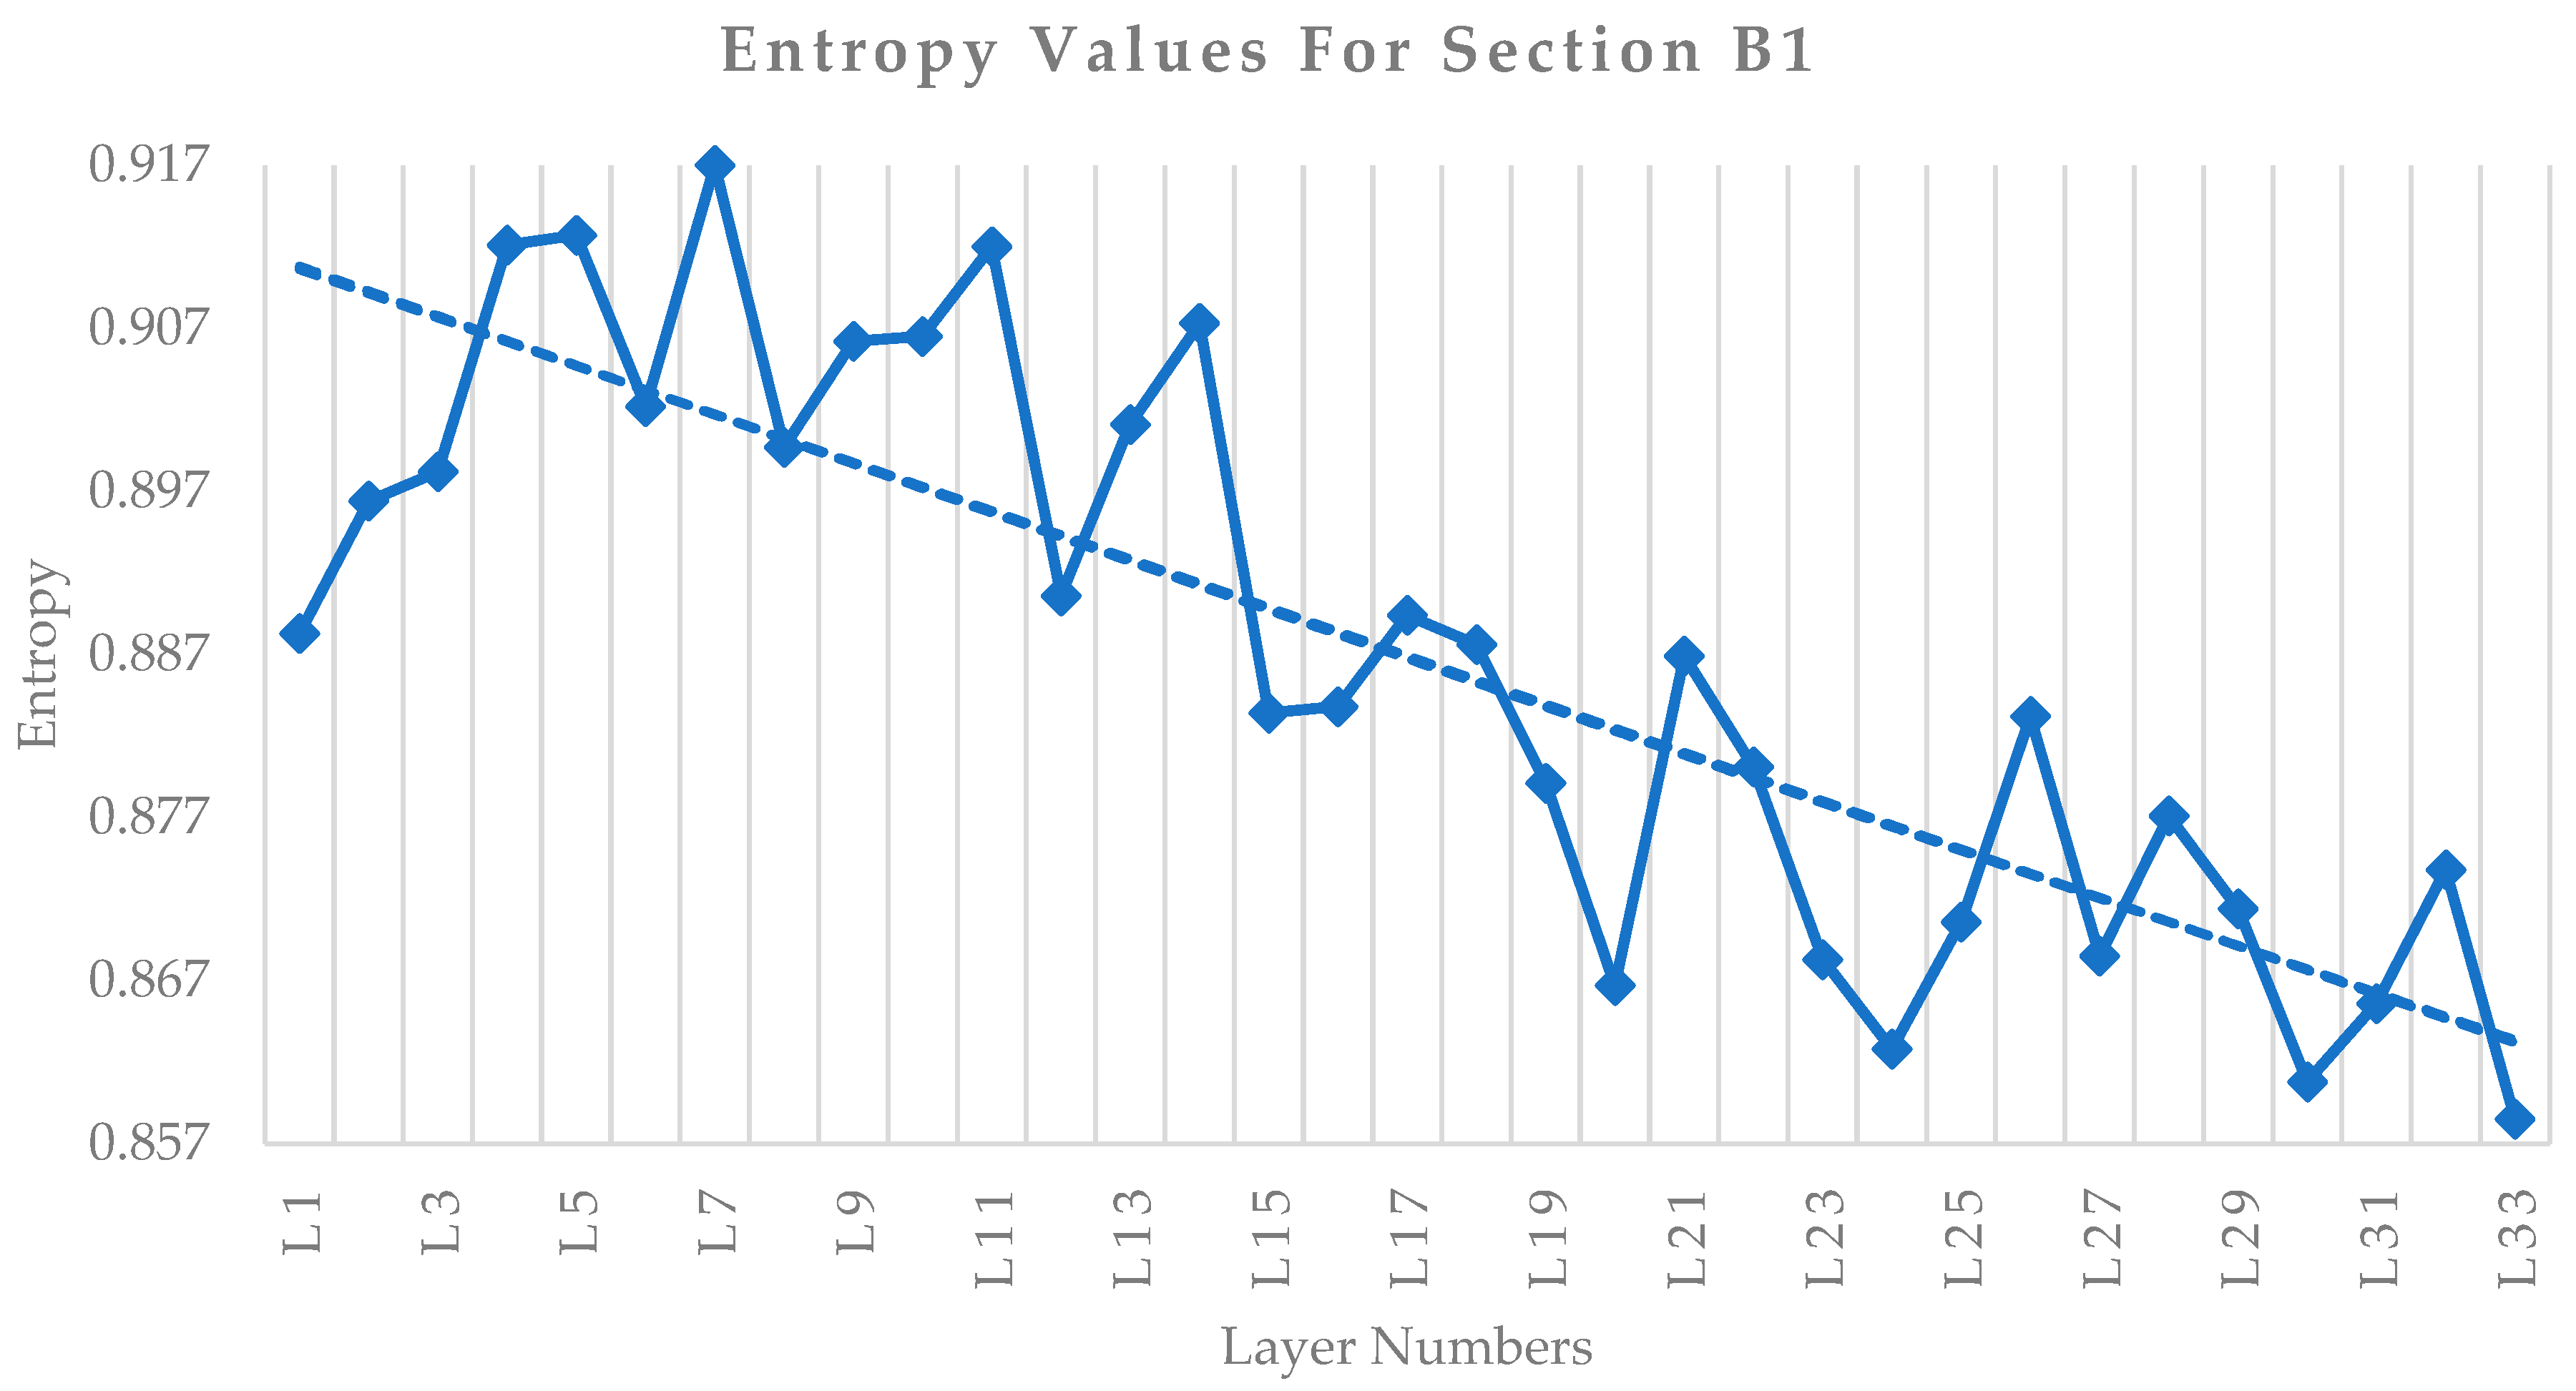
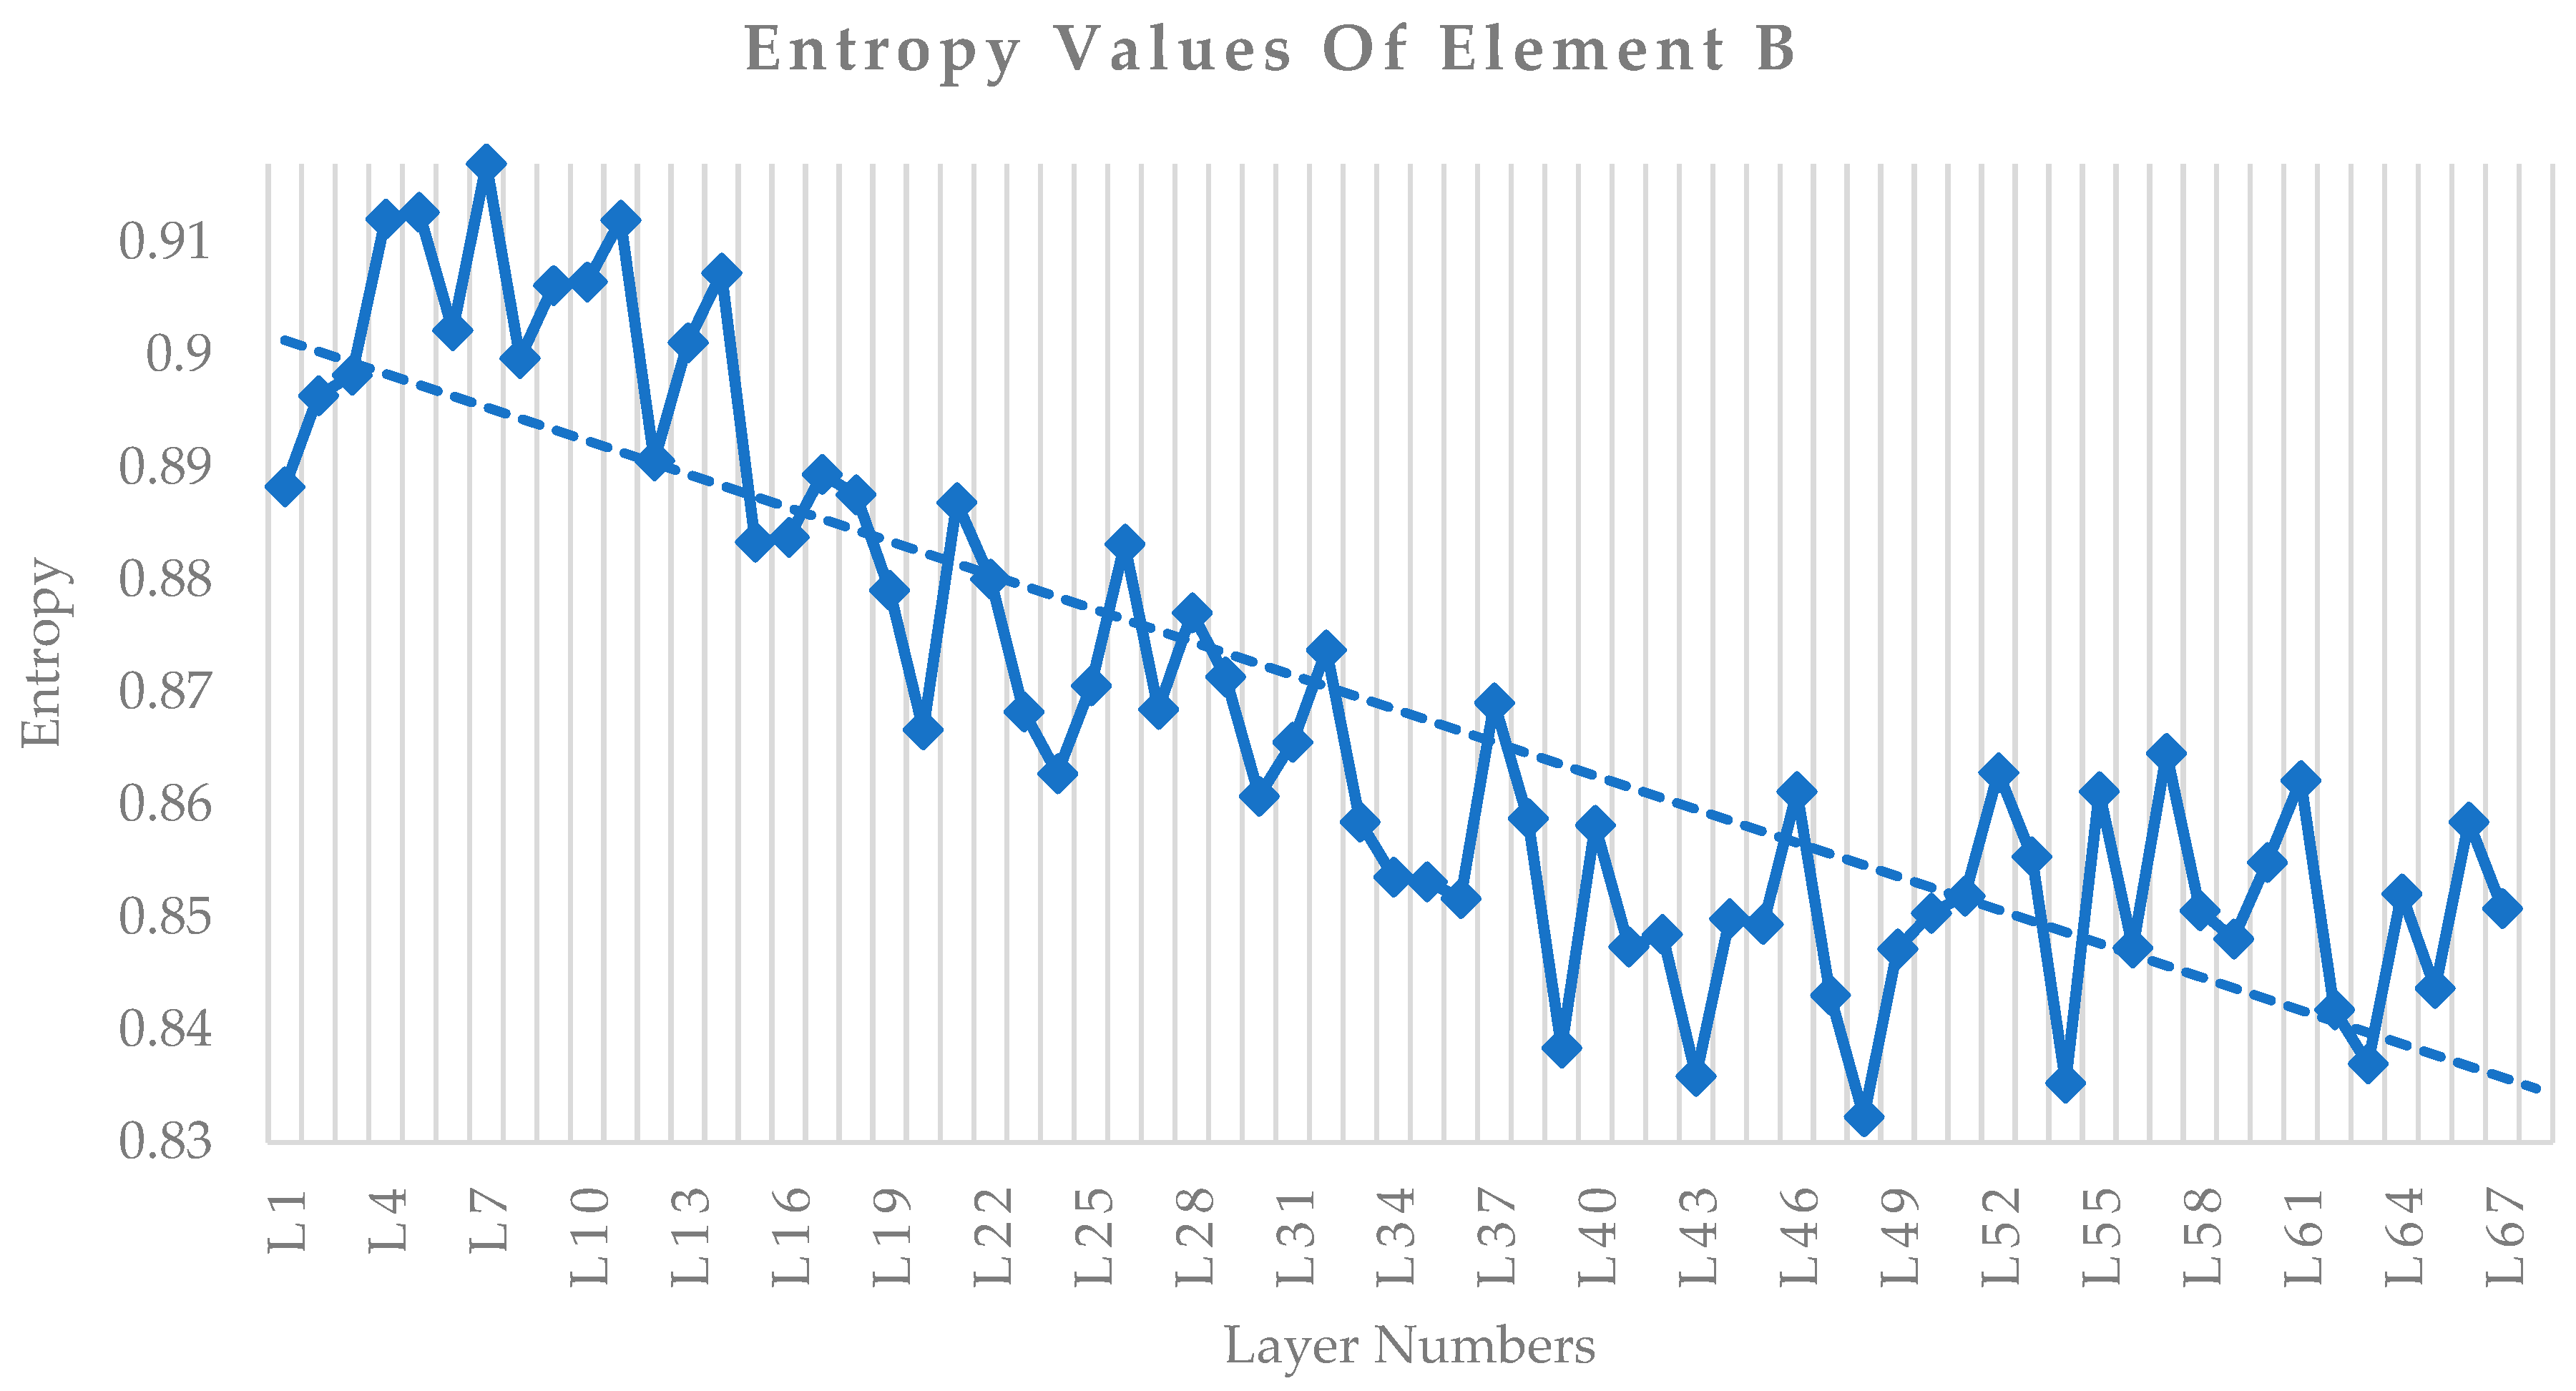
Figure 11 and Figure 12 show the graph generated using the values of entropy obtained from the two-bin LBP histogram of individual layers of Section B1 and Section B2, respectively. Similar to Element A, Figure 11 shows the initial high entropy values. Figure 10a also indicates that the initial layer L1 is highly compressed due to purposeful initial compression during printing to carry the weight of top layers. Layers L2 to L19 show high entropy values, such as Section A1, because of the thickness reduction due to the weight of the layers printed above. Further, layers L2 to L19 show undulations across the image width due to improper movement in the gantry system during the printing process. It is reflected in the entropy variation graph, proving that the two-bin LBP entropy successfully captures the undulations during printing. From L11 to L30, the entropy values fluctuate significantly due to undulations in the ribs observed due to the irregular movement of the robotic gantry system. However, the entropy value has a downward trend, indicating that the printed layers have lesser deformities and lesser granular texture formation within their layers. Overall, a downward trend of entropy values is observed in section B1 from layers L1 to L33.
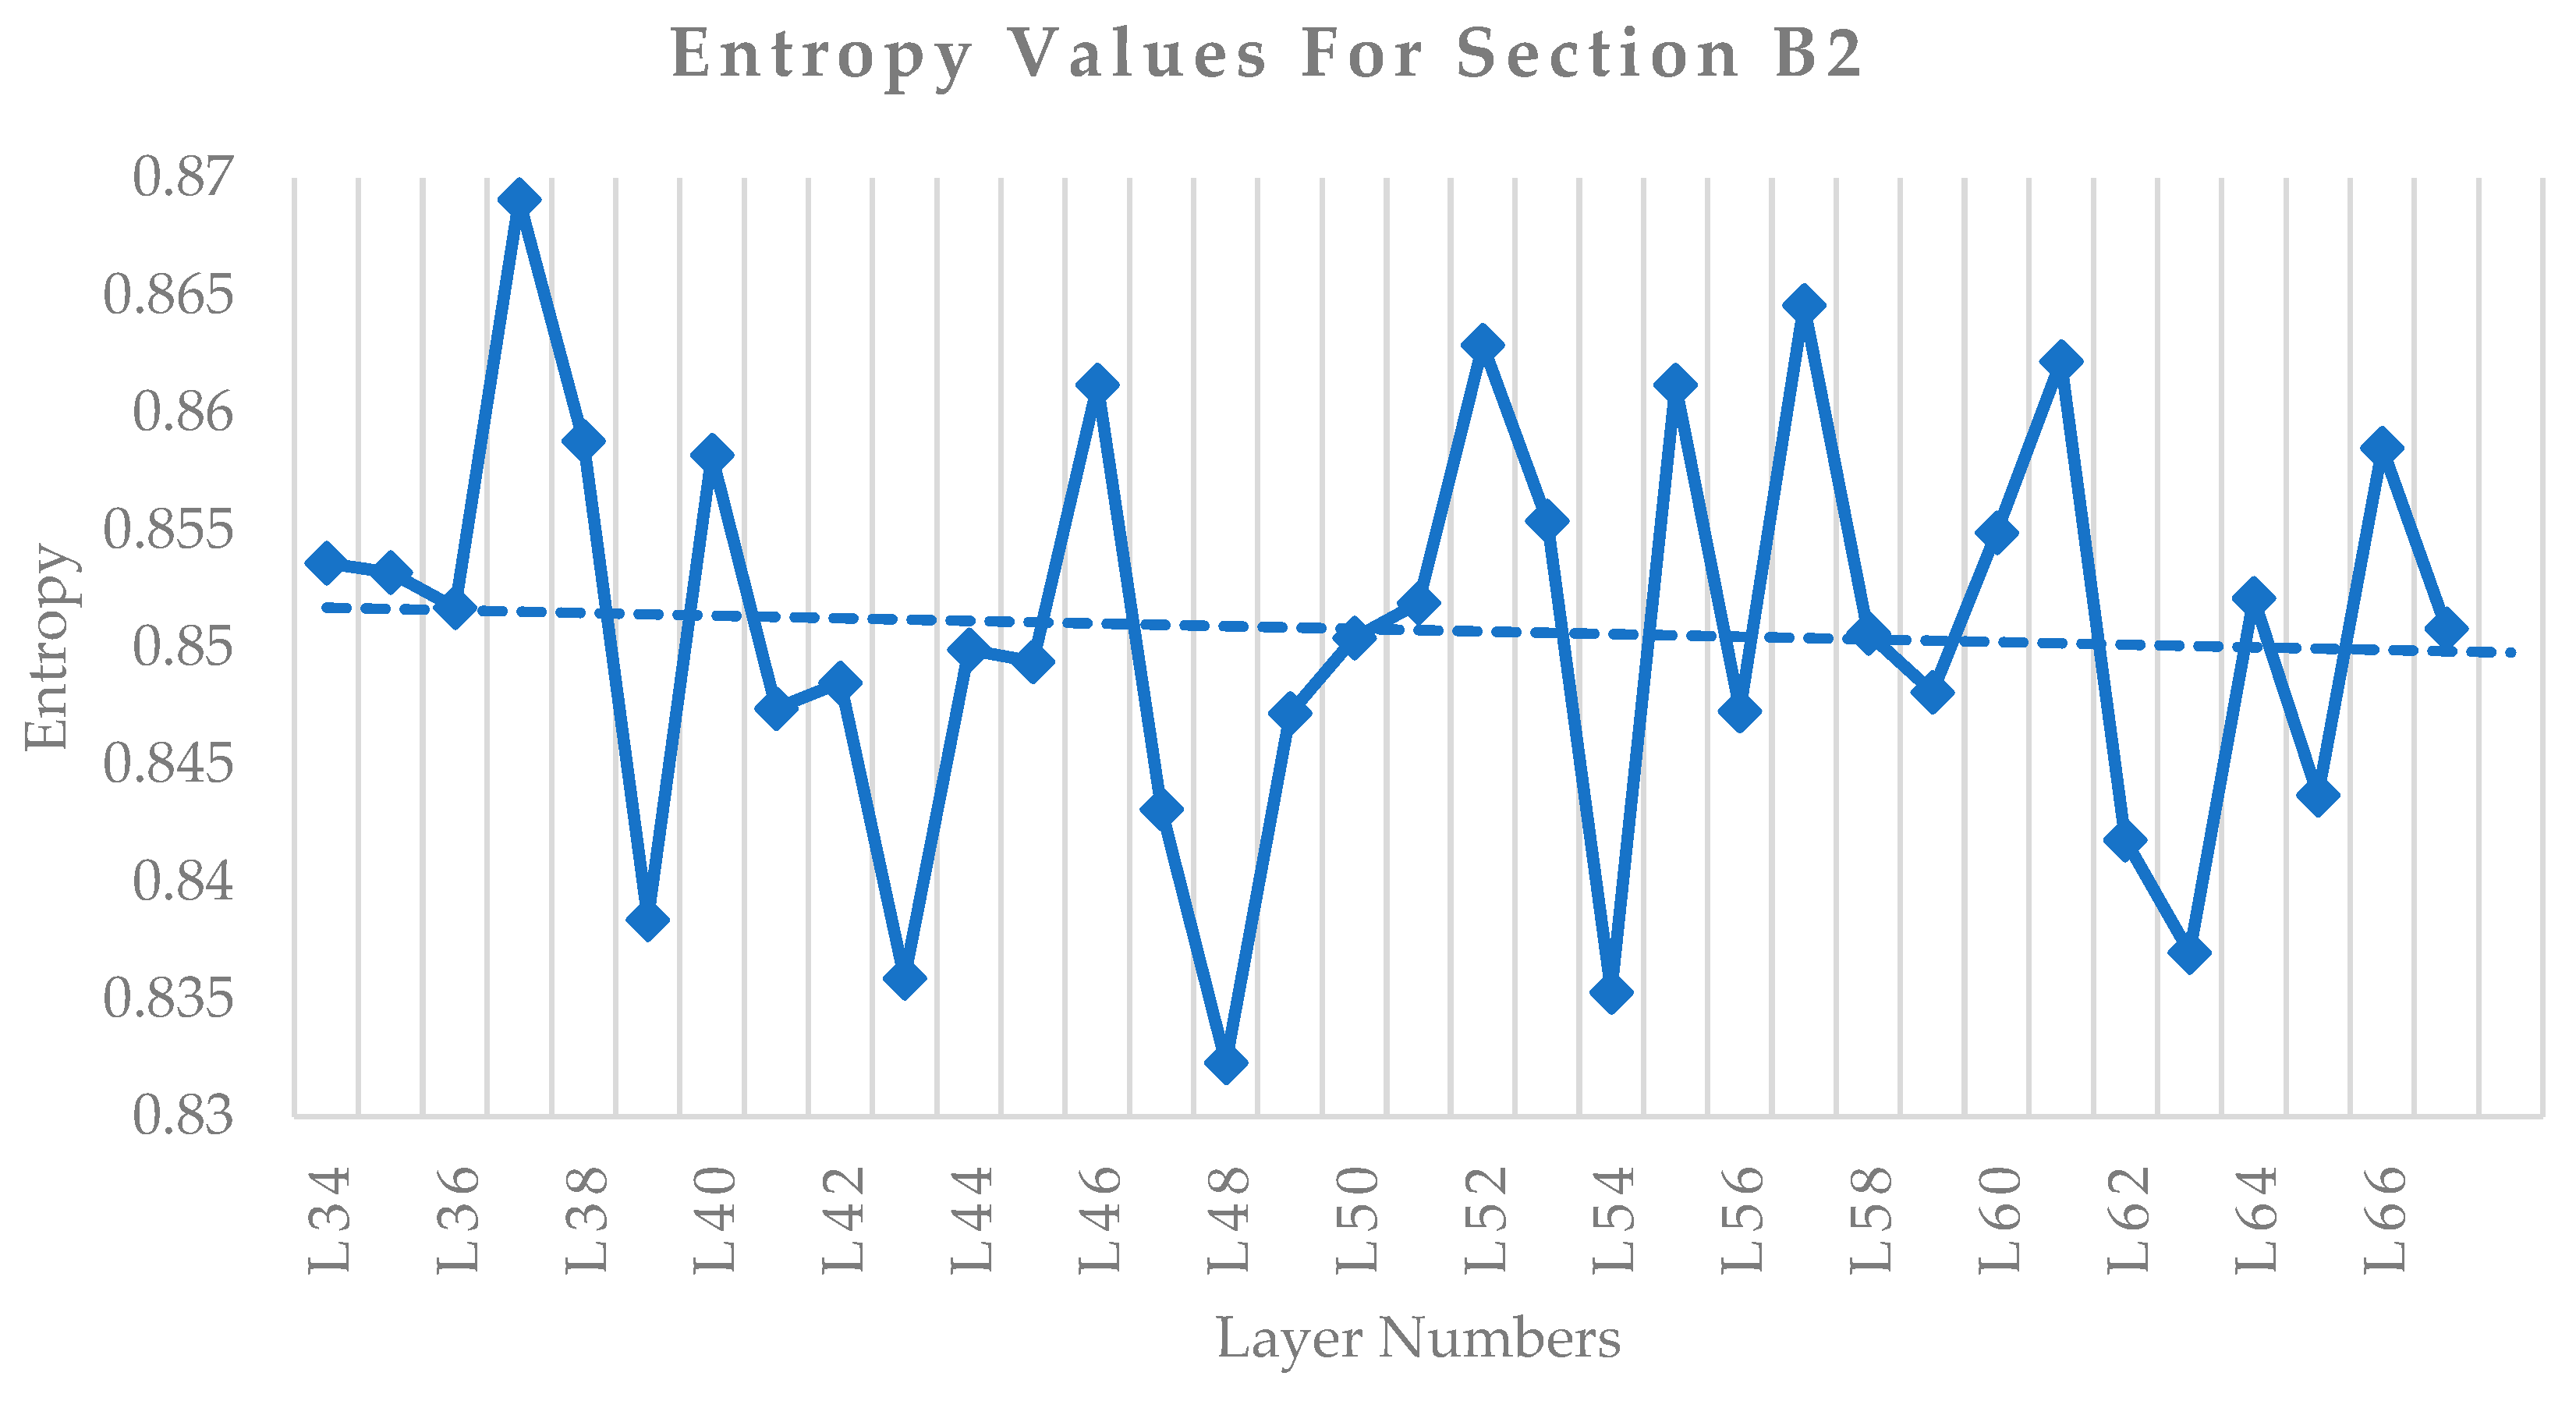
Figure 12 shows the variation in entropy for layers L34 and above in section B2 (Figure 10b) of Element B. Layers L34 and L35 show minor variations in entropy values. L37 and L38 are compressed more than other layers due to the gantry movement failure, creating a visible deformity that is captured by a higher entropy value. Due to the non-uniformity in the gantry operation, the printing process was stopped, rectified, and restarted from L39. However, by that time, the concrete mix had lost considerable workability, making the layer texture look more granular. Hence, the entropy value does not reduce further but follows a flat trend, indicated by its slope line in Figure 12. The entropy values vary drastically beyond L39, matching the formation of small voids. The size of the voids increases and, from layer L54, the size of the voids is found to be significantly increased.
The primary point to note is the slope of the trendline in the graphs—Figure 11 and Figure 12. For section B1, the graph shows a trendline sloping downwards, indicating the reduction in entropy as more layers are printed. It is a positive indication that the printing quality increases after the deformities seen in the initial layers. However, entropy values in section B2 do not follow a downward trend and the trendline is observed to be more flat or horizontal. Further, the entropy values seem to vary drastically and reach higher values regularly, indicating that the print quality is decreasing and uncertain.
Figure 13 shows the entropy variations in all the individual layers of Element B. It also shows that the entropy values are high on the initial layers and reduce until L33, beyond which there is no reduction in values and they are continuously varying.

3.3. Entropy Variations in Element C

Similar to Element B, for the ease of entropy calculations and visualizations, Element C is divided into a bottom portion, designated as section C1, and the top portion of the element is defined as section C2. As shown in Figure 14, the individual layers are represented as L1 for the bottom-most layer and the top-most layer designated as L47. Then, the two-bin LBP texture analysis is performed on the images of section C1 and section C2.
Figure 15 shows the entropy value variations in the individual layers of section C1. The entropy values of initial layers are high, matching the dimensional changes observed generally in the bottom-most layers when handling the weight of the layers printed above them. From Figure 14a, the printed element consists of many voids/discontinuities overall, and the initial bottom-most layers are deformed due to the weight of the top layers. Further, the bottom layers are undulated due to problems with the gantry-system movements. Higher entropy values are obtained for layers L1 to L9, matching with deformities and undulations present. From L10, the thickness variations are reduced, matching the downward trend in entropy values. However, the concrete material mix from the start did not have sufficient workability to have smooth-layer finishes. Hence, the entropy value tends to fluctuate due to the more granular texture.
The variations in the entropy values of the individual layers in Section C2 are shown in Figure 16. The graph indicates that the entropy value changes drastically and reaches higher values, matching the number of voids and granular texture in Figure 14b. The trendline slope for the entropy values from L24 to L46 proves that the entropy values are on an upward trend. It demonstrates that printing quality never increases, and the high values of entropy show the presence of voids in the printed layers.
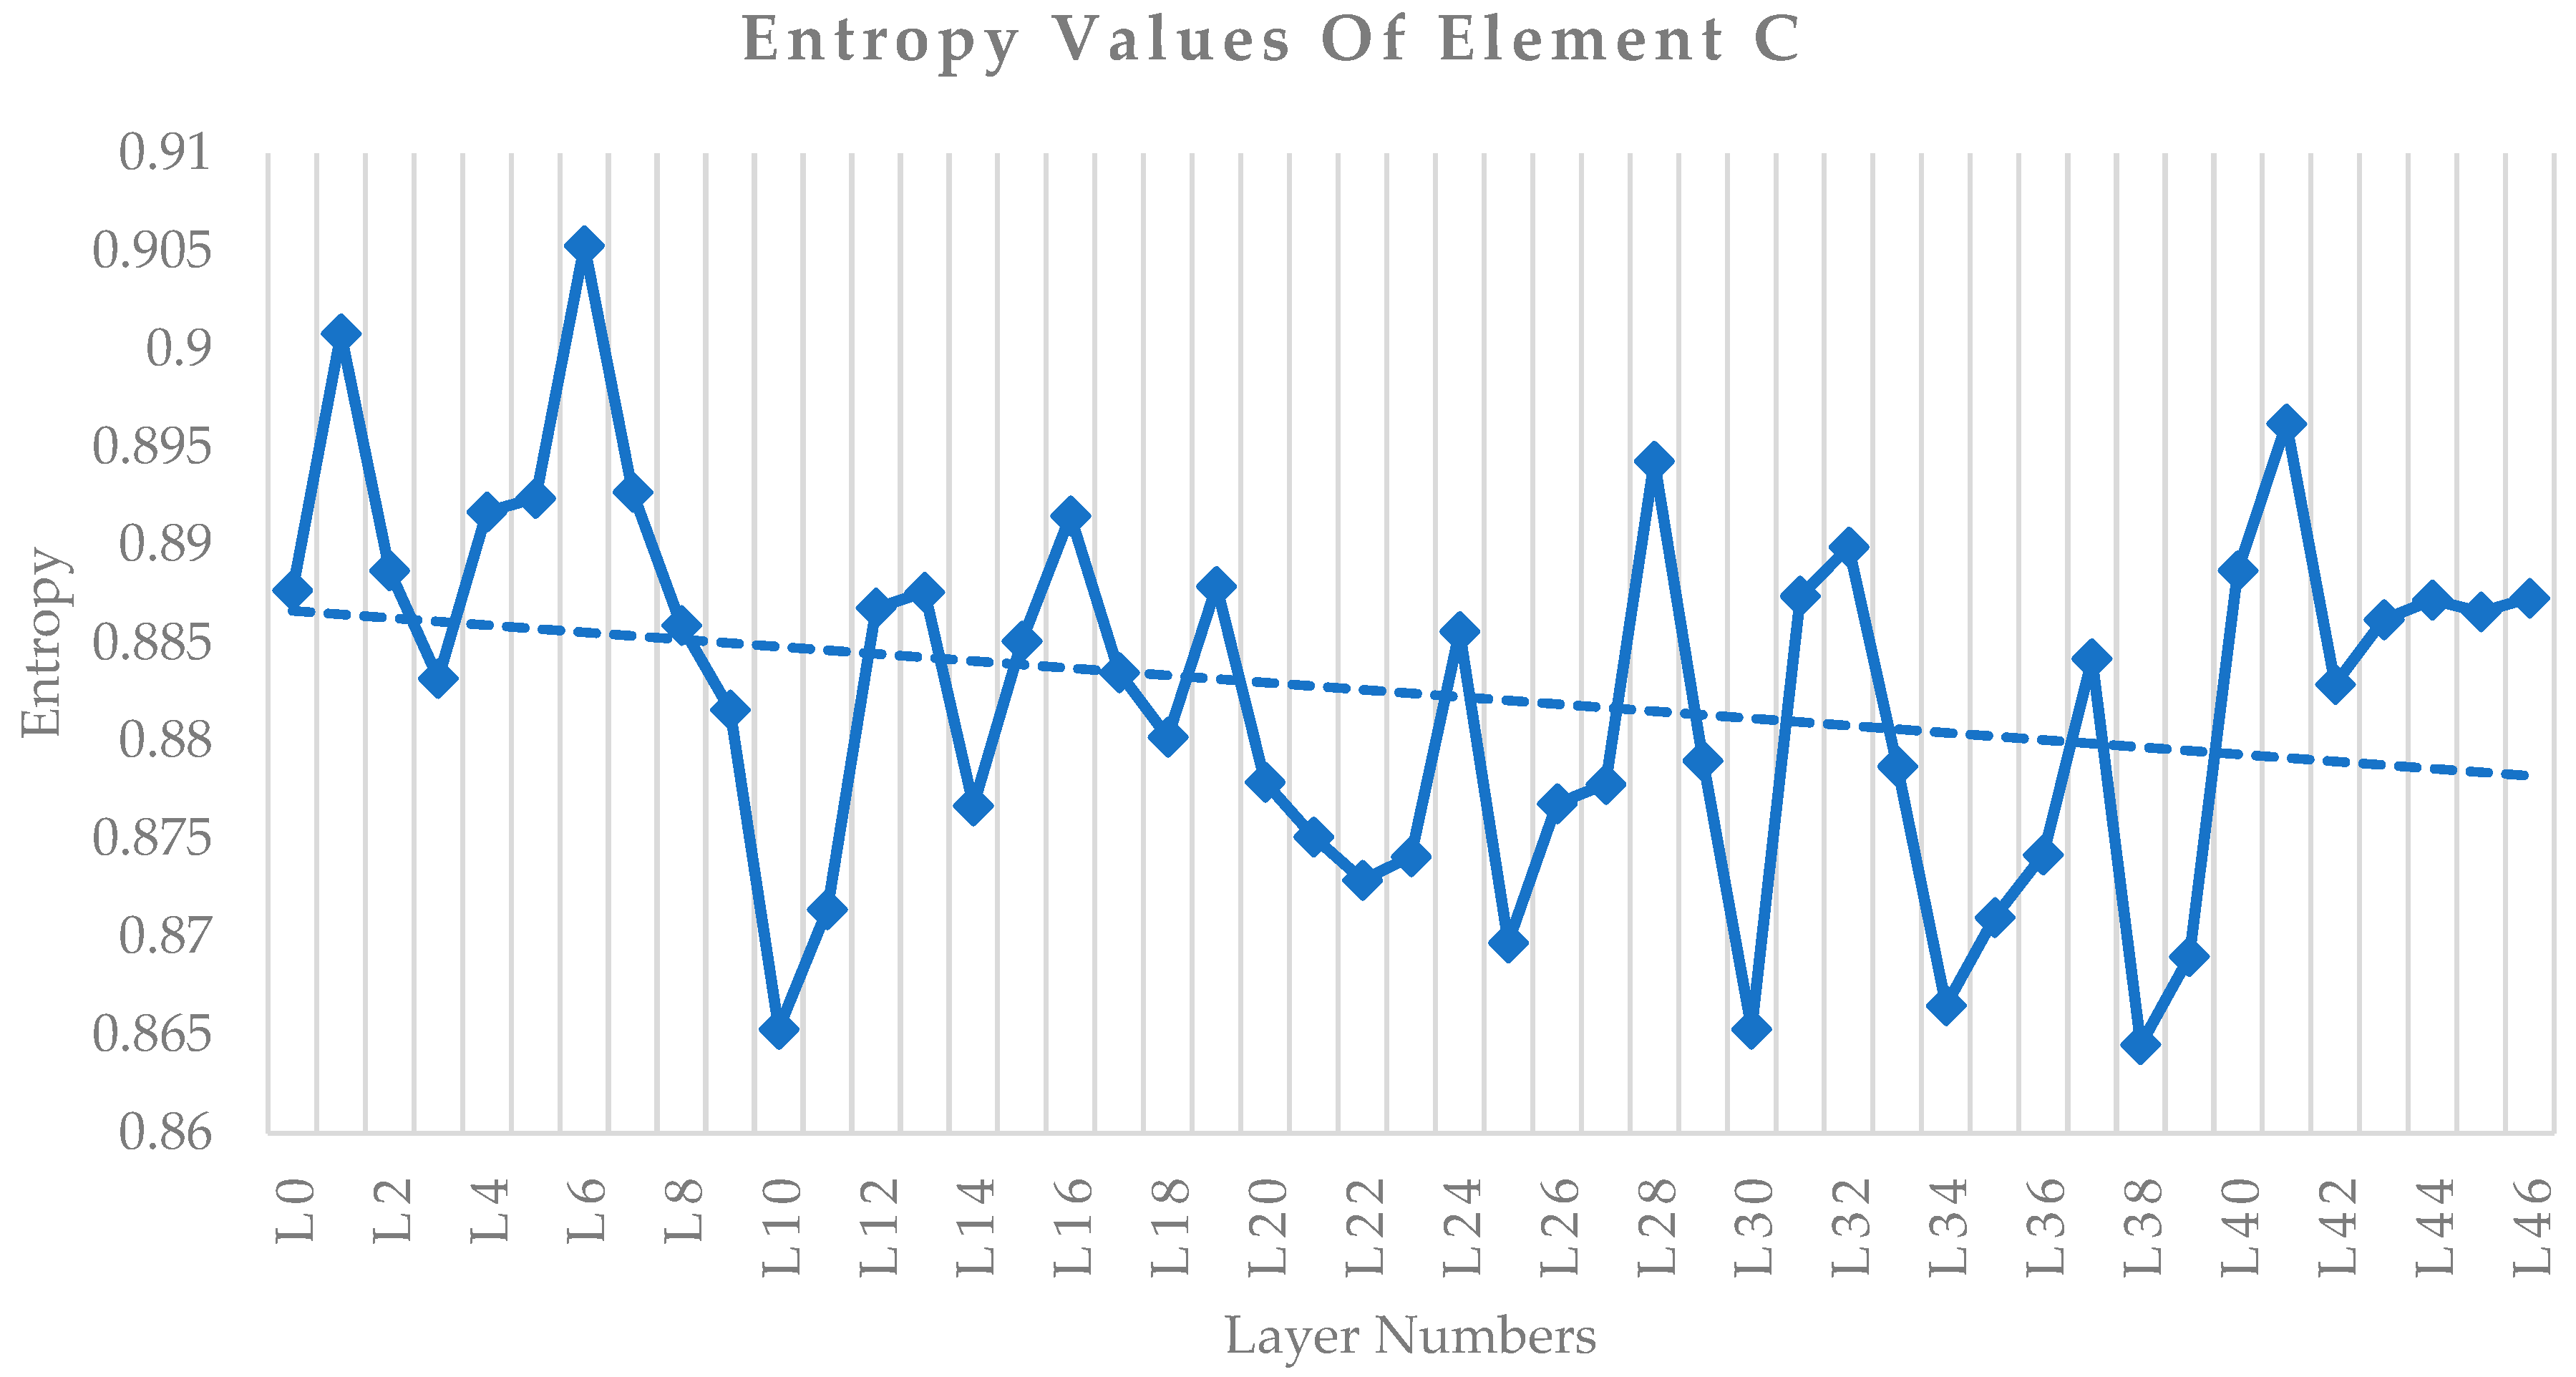
Figure 17 shows the entropy value changes for all the layers in Element C. The overall trendline slope is very low compared with the slope of the entropy measured for Element B in Figure 13. Hence, the trendline slope indirectly signifies the quality of the overall print element.

4. Discussion

4.1. Entropy Value Evolution Study

The entropy graphs of elements A, B, and C show that the entropy values of individual layers have similar variation patterns. Figure 9, Figure 13 and Figure 17 indicate higher values of entropy in the initial layers. Then, the values gradually reduce and, finally, the values tend to increase or fluctuate towards the top layers. The higher entropy values in initial layers are due to the initial layers reducing their thickness due to the weight of the layers printed above them. The reduction in thickness increases the granular texture on the surface of the lower layers. Then, the gradual decrease in entropy values is observed as the thickness variation due to the weight of the above layers is reduced. However, beyond a certain time of printing, the concrete loses its workability, leading to more granular texture formation on the surface of the layers. It is captured by increasing entropy values and making them vary drastically.
On visualization, it is understood that Element A is a good-quality print without any voids. Element C is a bad-quality print due to many voids and discontinuities in the layers. Element B is a medium-quality print with most layers not having bigger voids. The entropy values of Element C layers are substantially high, right from the bottom to the top layers. The entropy values of Element B are initially high and reduce gradually to a lower value, indicating the quality of printed layers is increasing. Further, towards the top layers of Element B, though the entropy values are considerably less, the entropy values vary drastically and constantly reach higher values, indicating void formations at the top layers. Overall, it is clear that the entropy value is inversely proportional to the quality level of the printed layers. Further, it proves that the entropy value evaluation of the two-bin LBP histogram provides a quality assessment by analyzing the textural variations in individual layers without any physical measurement.

4.2. Threshold Value Calculation

Layers having deformities have higher entropy values than those with good-quality prints. A threshold needs to be computed to determine which are bad-quality prints. This is illustrated below.
The threshold value is computed by comparing the actual and predicted quality of each layer. The actual quality measurement of individual layers is performed by subjective visual assessment, taking the layers having thickness variation due to the weight of the top layers, undulations due to gantry movement, and minor and major voids as a bad-quality print. The bad-quality prints are assigned a value of −1 and the good-quality ones are given values of +1. Then, a graph containing the entropy values obtained from all the data points on the x-axis and the visual quality assessment value on the y-axis is plotted, as shown in Figure 18.
The graph shows that most individual layer entropy values in bad-quality prints lie in a higher-entropy-value region. Figure 19 shows the methodology involved in determining a threshold entropy value. An initial threshold value is assumed and all the individual layer entropy values beyond that value are predicted as bad-quality print. The difference between each layer’s actual and predicted quality value is computed as an error.
The threshold entropy value is continuously adjusted to find minimum misclassifications between the actual and predicted quality (error percentage) of all layers, thereby having maximum accuracy. From the analysis, an entropy threshold value of 0.869, represented as a red line in Figure 18, separates the majority of the data points into the good-quality and bad-quality regions. There are some outliers found and the minimum error percentage is achieved as 19.55%. It is the minimum error percentage that can be obtained, since the number of data points is minimum. Thus, the threshold analysis achieves a significant accuracy of 80.45% for the minimum number of data points obtained during this study. This study proves the practical applicability of this methodology in quality assessment, which can be extended to multiple prints to obtain an even higher accuracy value.
The proposed methodology can be implemented for continuous monitoring of layers during printing. If the layers are found to have continuous trends of high entropy values reaching near and beyond the threshold, the printing process can be stopped and corrective actions can be taken. One such corrective action can be increasing the extrusion speed of the printing process. The reason for this is because the concrete mix will have higher yield stress due to the reduction in workability. By increasing the extrusion speed, the material will be sheared to reduce the flocculation structure formed. Thereby, a continuous flow can be achieved. Future studies are planned to be taken up in this direction.

5. Conclusions

A methodology utilizing computer vision (CV) to continuously monitor the quality of 3D-printed concrete structures is presented in this study. Continuous monitoring of the printing process will help find the defects and help the system make necessary corrections, avoiding material wastage and improving the sustainability of the technology. Variations in the surface texture of concrete 3D-printed layers due to decreased workability with printing time are analyzed. Entropy follows a downward trend at the start of printing, but it changes to an upward trend as the workability of the concrete reduces. The surface texture variation is captured by extracting the image texture variations in 2D-camera images of the 3D-printed elements. The major conclusions from the study are as follows:
The CV-based technique developed in this study is able to assess the quality of 3D-printed concrete specimens with reasonable accuracy.
  • A continuous, non-intrusive measurement of buildability changes over time is achieved in this study. Workability reduction over time is indirectly quantified using vision-based techniques. The characterization of the mix is not within the scope of this study.
  • LBP texture-extraction methods chosen in this study are immune to brightness or illumination changes in image pixels. Hence, this methodology can be applied to any environmental conditions without significant changes.
  • The layer thickness reduction due to the weight of the top layers was captured indirectly through the entropy of the surface texture.
  • The methodology is also able to detect other deformations, such as undulations of concrete layers, happening due to errors in robotic gantry movements.
  • Using the error-minimization method, a threshold entropy value beyond which most printed layers have defects/deformities is identified. Higher entropy values beyond the threshold can be used to trigger corrective actions in the 3D-printing process to avoid defects or deformities.
Results from this study show that automated monitoring of the concrete 3D-printing process is possible using advanced CV-based methodologies. Corrective actions can be taken by changing the printing parameters, such as increasing the extrusion speed. A higher extrusion speed will help make the concrete flow, making the mix flow without voids and discontinuities. As a result, the changes in the entropy value can act as a feedback value in the system to make corrective actions, thereby achieving high-quality output and avoiding material wastage. This study opens many opportunities to extract useful information from monitoring techniques to improve the sustainability aspects of the 3D-printing technology.

Author Contributions

Methodology, S.S.; Investigation, S.S.; Writing—original draft, S.S.; Writing—review & editing, B.R.; Supervision, B.R. All authors have read and agreed to the published version of the manuscript.

Funding

This project was funded by the Science and Engineering Research Board (SERB), India, through the grant IMP/2018/000224. The Institute of Eminence Research Initiative Project on Technologies for Low-Carbon Lean-Construction (TLC2) also provided financial support for this research. The Ministry of Human Resource Development (MHRD) India supported the first author with a PhD scholarship.

Data Availability Statement

Not applicable.

Acknowledgments

The authors would like to acknowledge the support provided by Shantanu Bhattacharjee, Research scholar, IIT Madras, India, for the help in concrete material mix designs. Tvasta Manufacturing Solutions Pvt. Ltd., India, is thanked by the authors for their support in providing 3D printers for the study.

Conflicts of Interest

The authors declare no conflict of interest.

References

  1. Zhang, J.; Wang, J.; Dong, S.; Yu, X.; Han, B. A review of the current progress and application of 3D printed concrete. Compos. Part A Appl. Sci. Manuf. 2019, 125, 105533. [Google Scholar] [CrossRef]
  2. Tobi, A.L.M.; Omar, S.A.; Yehia, Z.; Al-Ojaili, S.; Hashim, A.; Orhan, O. Cost viability of 3D printed house in UK. IOP Conf. Ser. Mater. Sci. Eng. 2018, 319, 012061. [Google Scholar] [CrossRef]
  3. Vantyghem, G.; de Corte, W.; Shakour, E.; Amir, O. 3D printing of a post-tensioned concrete girder designed by topology optimization. Autom. Constr. 2020, 112, 103084. [Google Scholar] [CrossRef]
  4. Martens, P.; Mathot, M.; Bos, F.; Coenders, J. Optimising 3D printed concrete structures using topology optimisation, in: High Tech Concrete: Where Technology and Engineering Meet. In Proceedings of the 2017 Fib Symposium, Maastricht, The Netherlands, 12–16 June 2017; pp. 301–309. [Google Scholar] [CrossRef]
  5. Villacres, J.; Guaman, R.; Menendez, O. Auat Cheein, 3D Printing Deformation Estimation Using Artificial Vision Strategies for Smart-Construction. In Proceedings of the IECON (Industrial Electronics Conference), Online Conference, 13–16 October 2021. [Google Scholar] [CrossRef]
  6. Kazemian, A.; Yuan, X.; Davtalab, O.; Khoshnevis, B. Automation in Construction Computer vision for real-time extrusion quality monitoring and control in robotic construction. Autom. Constr. 2019, 101, 92–98. [Google Scholar] [CrossRef]
  7. Buswell, R.; Kinnell, P.; Xu, J.; Hack, N.; Kloft, H.; Maboudi, M.; Gerke, M.; Massin, P.; Grasser, G.; Wolfs, R.; et al. Inspection Methods for 3D Concrete Printing. In RILEM Bookseries; Springer: Berlin/Heidelberg, Germany, 2020; Volume 28, pp. 790–803. [Google Scholar] [CrossRef]
  8. Lim, S.; Buswell, R.A.; Valentine, P.J.; Piker, D.; Austin, S.A.; de Kestelier, X. Modelling curved-layered printing paths for fabricating large-scale construction components. Addit. Manuf. 2016, 12, 216–230. [Google Scholar] [CrossRef] [Green Version]
  9. Panda, B.; Lim, J.H.; Tan, M.J. Mechanical properties and deformation behaviour of early age concrete in the context of digital construction. Compos. B Eng. 2019, 165, 563–571. [Google Scholar] [CrossRef]
  10. Le, T.T.; Austin, S.A.; Lim, S.; Buswell, R.A.; Gibb, A.G.F.; Thorpe, T. Mix design and fresh properties for high-performance printing concrete. Mater. Struct. Mater. Constr. 2012, 45, 1221–1232. [Google Scholar] [CrossRef]
  11. Panda, B.; Lim, J.H.; Mohamed, N.A.N.; Paul, S.C.; Tay, Y.W.D.; Tan, M.J. Automation of robotic concrete printing using feedback control system. In Proceedings of the ISARC 2017—Proceedings of the 34th International Symposium on Automation and Robotics in Construction, Taipei, Taiwan, 28 June–1 July 2017; pp. 276–280. [Google Scholar] [CrossRef] [Green Version]
  12. Goh, G.D.; Sing, S.L.; Yeong, W.Y. A Review on Machine Learning in 3D Printing: Applications, Potential, and Challenges; Springer: Dordrecht, The Netherlands, 2021. [Google Scholar] [CrossRef]
  13. Nair, A.; Aditya, S.D.; Adarsh, R.N.; Nandan, M.; Dharek, M.S.; Sreedhara, B.M.; Prashant, S.C.; Sreekeshava, K.S. Additive Manufacturing of Concrete: Challenges and opportunities. IOP Conf. Ser. Mater. Sci. Eng. 2020, 814, 012022. [Google Scholar] [CrossRef]
  14. Jolin, M.; Burns, D.; Bissonnette, B.; Gagnon, F.; Bolduc, L.-S. Understanding the pumpability of concrete. In Proceedings of the Shotcrete for Underground Support XI Engineering Conferences International, Davos, Switzerland, 7–10 June 2009; pp. 193–207. [Google Scholar]
  15. Tay, Y.W.D.; Qian, Y.; Tan, M.J. Printability region for 3D concrete printing using slump and slump flow test. Compos. B Eng. 2019, 174, 106968. [Google Scholar] [CrossRef]
  16. Bos, F.; Wolfs, R.; Ahmed, Z.; Salet, T. Additive manufacturing of concrete in construction: Potentials and challenges of 3D concrete printing. Virtual Phys. Prototyp. 2016, 11, 209–225. [Google Scholar] [CrossRef] [Green Version]
  17. Reiter, L.; Wangler, T.; Roussel, N.; Flatt, R.J. The role of early age structural build-up in digital fabrication with concrete. Cem. Concr. Res. 2018, 112, 86–95. [Google Scholar] [CrossRef]
  18. Zhang, Y.; Zhang, Y.; She, W.; Yang, L.; Liu, G.; Yang, Y. Rheological and harden properties of the high-thixotropy 3D printing concrete. Constr. Build Mater. 2019, 201, 278–285. [Google Scholar] [CrossRef]
  19. Zhang, Y.; Zhang, Y.; Liu, G.; Yang, Y.; Wu, M.; Pang, B. Fresh properties of a novel 3D printing concrete ink. Constr. Build. Mater. 2018, 174, 263–271. [Google Scholar] [CrossRef]
  20. Roussel, N. Rheological requirements for printable concretes. Cem. Concr. Res. 2018, 112, 76–85. [Google Scholar] [CrossRef]
  21. Rahul, A.V.; Santhanam, M.; Meena, H.; Ghani, Z. 3D printable concrete: Mixture design and test methods. Cem. Concr. Compos. 2019, 97, 13–23. [Google Scholar] [CrossRef]
  22. Jayathilakage, R.; Sanjayan, J.; Rajeev, P. Direct shear test for the assessment of rheological parameters of concrete for 3D printing applications. Mater. Struct. /Mater. Constr. 2019, 52, 1–13. [Google Scholar] [CrossRef]
  23. Malaeb, Z.; Hachem, H.; Tourbah, A.; Maalouf, T.; el Zarwi, N.; Hamzeh, F. 3D Concrete Printing: Machine and Mix Design. Int. J. Civ. Eng. Technol. 2015, 6, 14–22. [Google Scholar]
  24. Ma, G.; Li, Z.; Wang, L. Printable properties of cementitious material containing copper tailings for extrusion based 3D printing. Constr. Build Mater. 2018, 162, 613–627. [Google Scholar] [CrossRef]
  25. Moeini, M.A.; Hosseinpoor, M.; Yahia, A. Effectiveness of the rheometric methods to evaluate the build-up of cementitious mortars used for 3D printing. Constr. Build Mater. 2020, 257, 119551. [Google Scholar] [CrossRef]
  26. Mazhoud, B.; Perrot, A.; Picandet, V.; Rangeard, D.; Courteille, E. Underwater 3D printing of cement-based mortar. Constr. Build Mater. 2019, 214, 458–467. [Google Scholar] [CrossRef]
  27. Ahmed, S.; Yehia, S. Evaluation of Workability and Structuration Rate of Locally Developed 3D Printing Concrete Using Conventional Methods. Materials 2022, 15, 1243. [Google Scholar] [CrossRef]
  28. Izadgoshasb, H.; Kandiri, A.; Shakor, P.; Laghi, V.; Gasparini, G. Predicting compressive strength of 3D printed mortar in structural members using machine learning. Appl. Sci. 2021, 11, 10826. [Google Scholar] [CrossRef]
  29. Zhang, J.; Wang, P.; Gao, R.X. Deep learning-based tensile strength prediction in fused deposition modeling. Comput. Ind. 2019, 107, 11–21. [Google Scholar] [CrossRef]
  30. Lao, W.; Li, M.; Tjahjowidodo, T. Variable-geometry nozzle for surface quality enhancement in 3D concrete printing. Addit. Manuf. 2021, 37, 101638. [Google Scholar] [CrossRef]
  31. Ashrafi, N.; Duarte, J.P.; Nazarian, S.; Meisel, N.A. Evaluating the relationship between deposition and layer quality in large-scale additive manufacturing of concrete. Virtual Phys. Prototyp. 2019, 14, 135–140. [Google Scholar] [CrossRef]
  32. Davtalab, O.; Kazemian, A.; Yuan, X. Khoshnevis, Automated inspection in robotic additive manufacturing using deep learning for layer deformation detection. J. Intell. Manuf. 2020, 33, 771–784. [Google Scholar] [CrossRef]
  33. Jin, Z.; Zhang, Z.; Gu, G.X. Autonomous in-situ correction of fused deposition modeling printers using computer vision and deep learning. Manuf. Lett. 2019, 22, 11–15. [Google Scholar] [CrossRef]
  34. Bisheh, M.N.; Chang, S.I.; Lei, S. A layer-by-layer quality monitoring framework for 3D printing. Comput. Ind. Eng. 2021, 157, 107314. [Google Scholar] [CrossRef]
  35. Wu, D.; Wei, Y.; Terpenny, J. Predictive modelling of surface roughness in fused deposition modelling using data fusion. Int. J. Prod. Res. 2019, 57, 3992–4006. [Google Scholar] [CrossRef]
  36. Zhang, Z.; Fidan, I. Failure detection of fused filament fabrication via deep learning. In Proceedings of the Solid Freeform Fabrication 2019: Proceedings of the 30th Annual International Solid Freeform Fabrication Symposium—An Additive Manufacturing Conference, SFF, Austin, TX, USA, 12–14 August 2019; pp. 2156–2164. [Google Scholar]
  37. Nasiri, S.; Khosravani, M.R. Machine learning in predicting mechanical behavior of additively manufactured parts. J. Mater. Res. Technol. 2021, 14, 1137–1153. [Google Scholar] [CrossRef]
  38. Oleff, A.; Küster, B.; Stonis, M.; Overmeyer, L. Process monitoring for material extrusion additive manufacturing: A state-of-the-art review. Prog. Addit. Manuf. 2021, 6, 705–730. [Google Scholar] [CrossRef]
  39. Armi, L.; Fekri-Ershad, S. Texture image analysis and texture classification methods—A review. Texture Image Anal. 2019, 2, 1–29. [Google Scholar]
  40. Tuceryan, M.; Jain, A.K. Chapter 2.1 texture analysis. In Handbook of Pattern Recognition and Computer Vision; World Scientific: Singapore, 1993; pp. 235–276. [Google Scholar]
  41. Huang, D.; Shan, C.; Ardabilian, M.; Wang, Y.; Chen, L. Local binary patterns and its application to facial image analysis: A survey, IEEE Transactions on Systems. Man. Cybern. Part C Appl. Rev. 2011, 41, 765–781. [Google Scholar] [CrossRef] [Green Version]
  42. Arsho, Local Binary Patterns implementation using Python 3. 2017. Available online: https://github.com/arsho/local_binary_patterns (accessed on 13 October 2022).
  43. Chen, B.; Wang, J.; Zhao, H.; Principe, J.C. Insights into entropy as a measure of multivariate variability. Entropy 2016, 18, 196. [Google Scholar] [CrossRef] [Green Version]
  44. Gandrillon, O.; Gaillard, M.; Espinasse, T.; Garnier, N.B.; Dussiau, C.; Kosmider, O.; Sujobert, P. Entropy as a measure of variability and stemness in single-cell transcriptomics. Curr. Opin. Syst. Biol. 2021, 27, 100348. [Google Scholar] [CrossRef]
  45. Fastowicz, J.; Grudziński, M.; Tecław, M.; Okarma, K. Objective 3D printed surface quality assessment based on entropy of depth maps. Entropy 2019, 21, 97. [Google Scholar] [CrossRef] [Green Version]
  46. Okarma, K.; Fastowicz, J. Improved quality assessment of colour surfaces for additive manufacturing based on image entropy. Pattern Anal. Appl. 2020, 23, 1035–1047. [Google Scholar] [CrossRef]
Figure 1. Computation of LBP value for a sample neighborhood of pixels.
Sustainability 14 15682 g001
Figure 2. Computation of two-bin LBP value for a neighborhood of pixels.
Sustainability 14 15682 g002
Figure 3. Methodology for measuring the entropy of the individual layers of concrete 3DP element.
Sustainability 14 15682 g003
Figure 4. (a) ELEMENT A—concrete 3DP element of 300 mm height, (b) central section considered for analysis—Section A1.
Sustainability 14 15682 g004
Figure 5. (a) ELEMENT B—concrete 3DP element of 1000 mm height, (b) bottom section considered for analysis—Section B1, (c) top section considered for analysis—Section B2.
Sustainability 14 15682 g005
Figure 6. (a) ELEMENT C—concrete 3DP element of 700 mm height, (b) bottom section considered for analysis—Section C1, (c) top section considered for analysis—Section C2.
Sustainability 14 15682 g006
Figure 7. Element A—individual layer designation and a sample representation of the individual—cropped layers subjected to texture analysis.
Sustainability 14 15682 g007
Figure 8. Two-bin LBP histogram of Layer 1 and Layer 18 of Section A1.
Sustainability 14 15682 g008
Figure 9. Two-bin LBP histogram entropy values of Element A (Section A1).
Sustainability 14 15682 g009
Figure 10. (a) Bottom portion of Element B—Section B1, (b) top portion of Element B—Section B2.
Sustainability 14 15682 g010
Figure 11. Two-bin LBP histogram entropy values for individual layers in section B1.
Sustainability 14 15682 g011
Figure 12. Two-bin LBP histogram values for individual layers in section B2.
Sustainability 14 15682 g012
Figure 13. Two-bin LBP histogram entropy values of each layer in the entire Element B.
Sustainability 14 15682 g013
Figure 14. (a) Bottom portion of Element C—Section C1, (b) top portion of Element C—Section C2.
Sustainability 14 15682 g014
Figure 15. Two-bin LBP histogram entropy values for the individual layers of Section C1.
Sustainability 14 15682 g015
Figure 16. Two-bin LBP histogram entropy values for the individual layers for Section C2.
Sustainability 14 15682 g016
Figure 17. Two-bin LBP histogram entropy values for the individual layers of entire Element C.
Sustainability 14 15682 g017
Figure 18. Visual quality assessment of individual layers and their entropy values.
Sustainability 14 15682 g018
Figure 19. Methodology to find threshold entropy value by comparing the actual and predicted quality of each layer.
Sustainability 14 15682 g019
Table 1. Details of the 3D-printed elements.
Sl. No.Element No.Concrete 3D-Printed ElementSection under AnalysisFigure No.Section No. Designation
1Element A300 mm high circular columnEntire lengthFigure 4bSection A1
2Element B1000 mm high circular columnTop portionFigure 5bSection B1
3Element B1000 mm high circular columnBottom portionFigure 5cSection B2
4Element C700 mm high circular columnTop portionFigure 6bSection C1
5Element C700 mm high circular columnBottom portionFigure 6cSection C2
Publisher’s Note: MDPI stays neutral with regard to jurisdictional claims in published maps and institutional affiliations.