

Cultivation of Desmodesmus multivariabilis for the Treatment of Cosmetic Wastewater


Abstract
:1. Introduction
2. Materials and Methods
2.1. Microlagal Culture Source and Preparation
2.2. Cosmetic Wastewater Source and Preparation
2.3. Carbon Dioxide Source and Preparation
2.4. Experimental Design and Planning
2.5. Sampling and Methods of Analysis
2.6. Definition of Data Metrics
2.7. Wastewater Characterization and Initial Growth Profiles
3. Results and Discussion
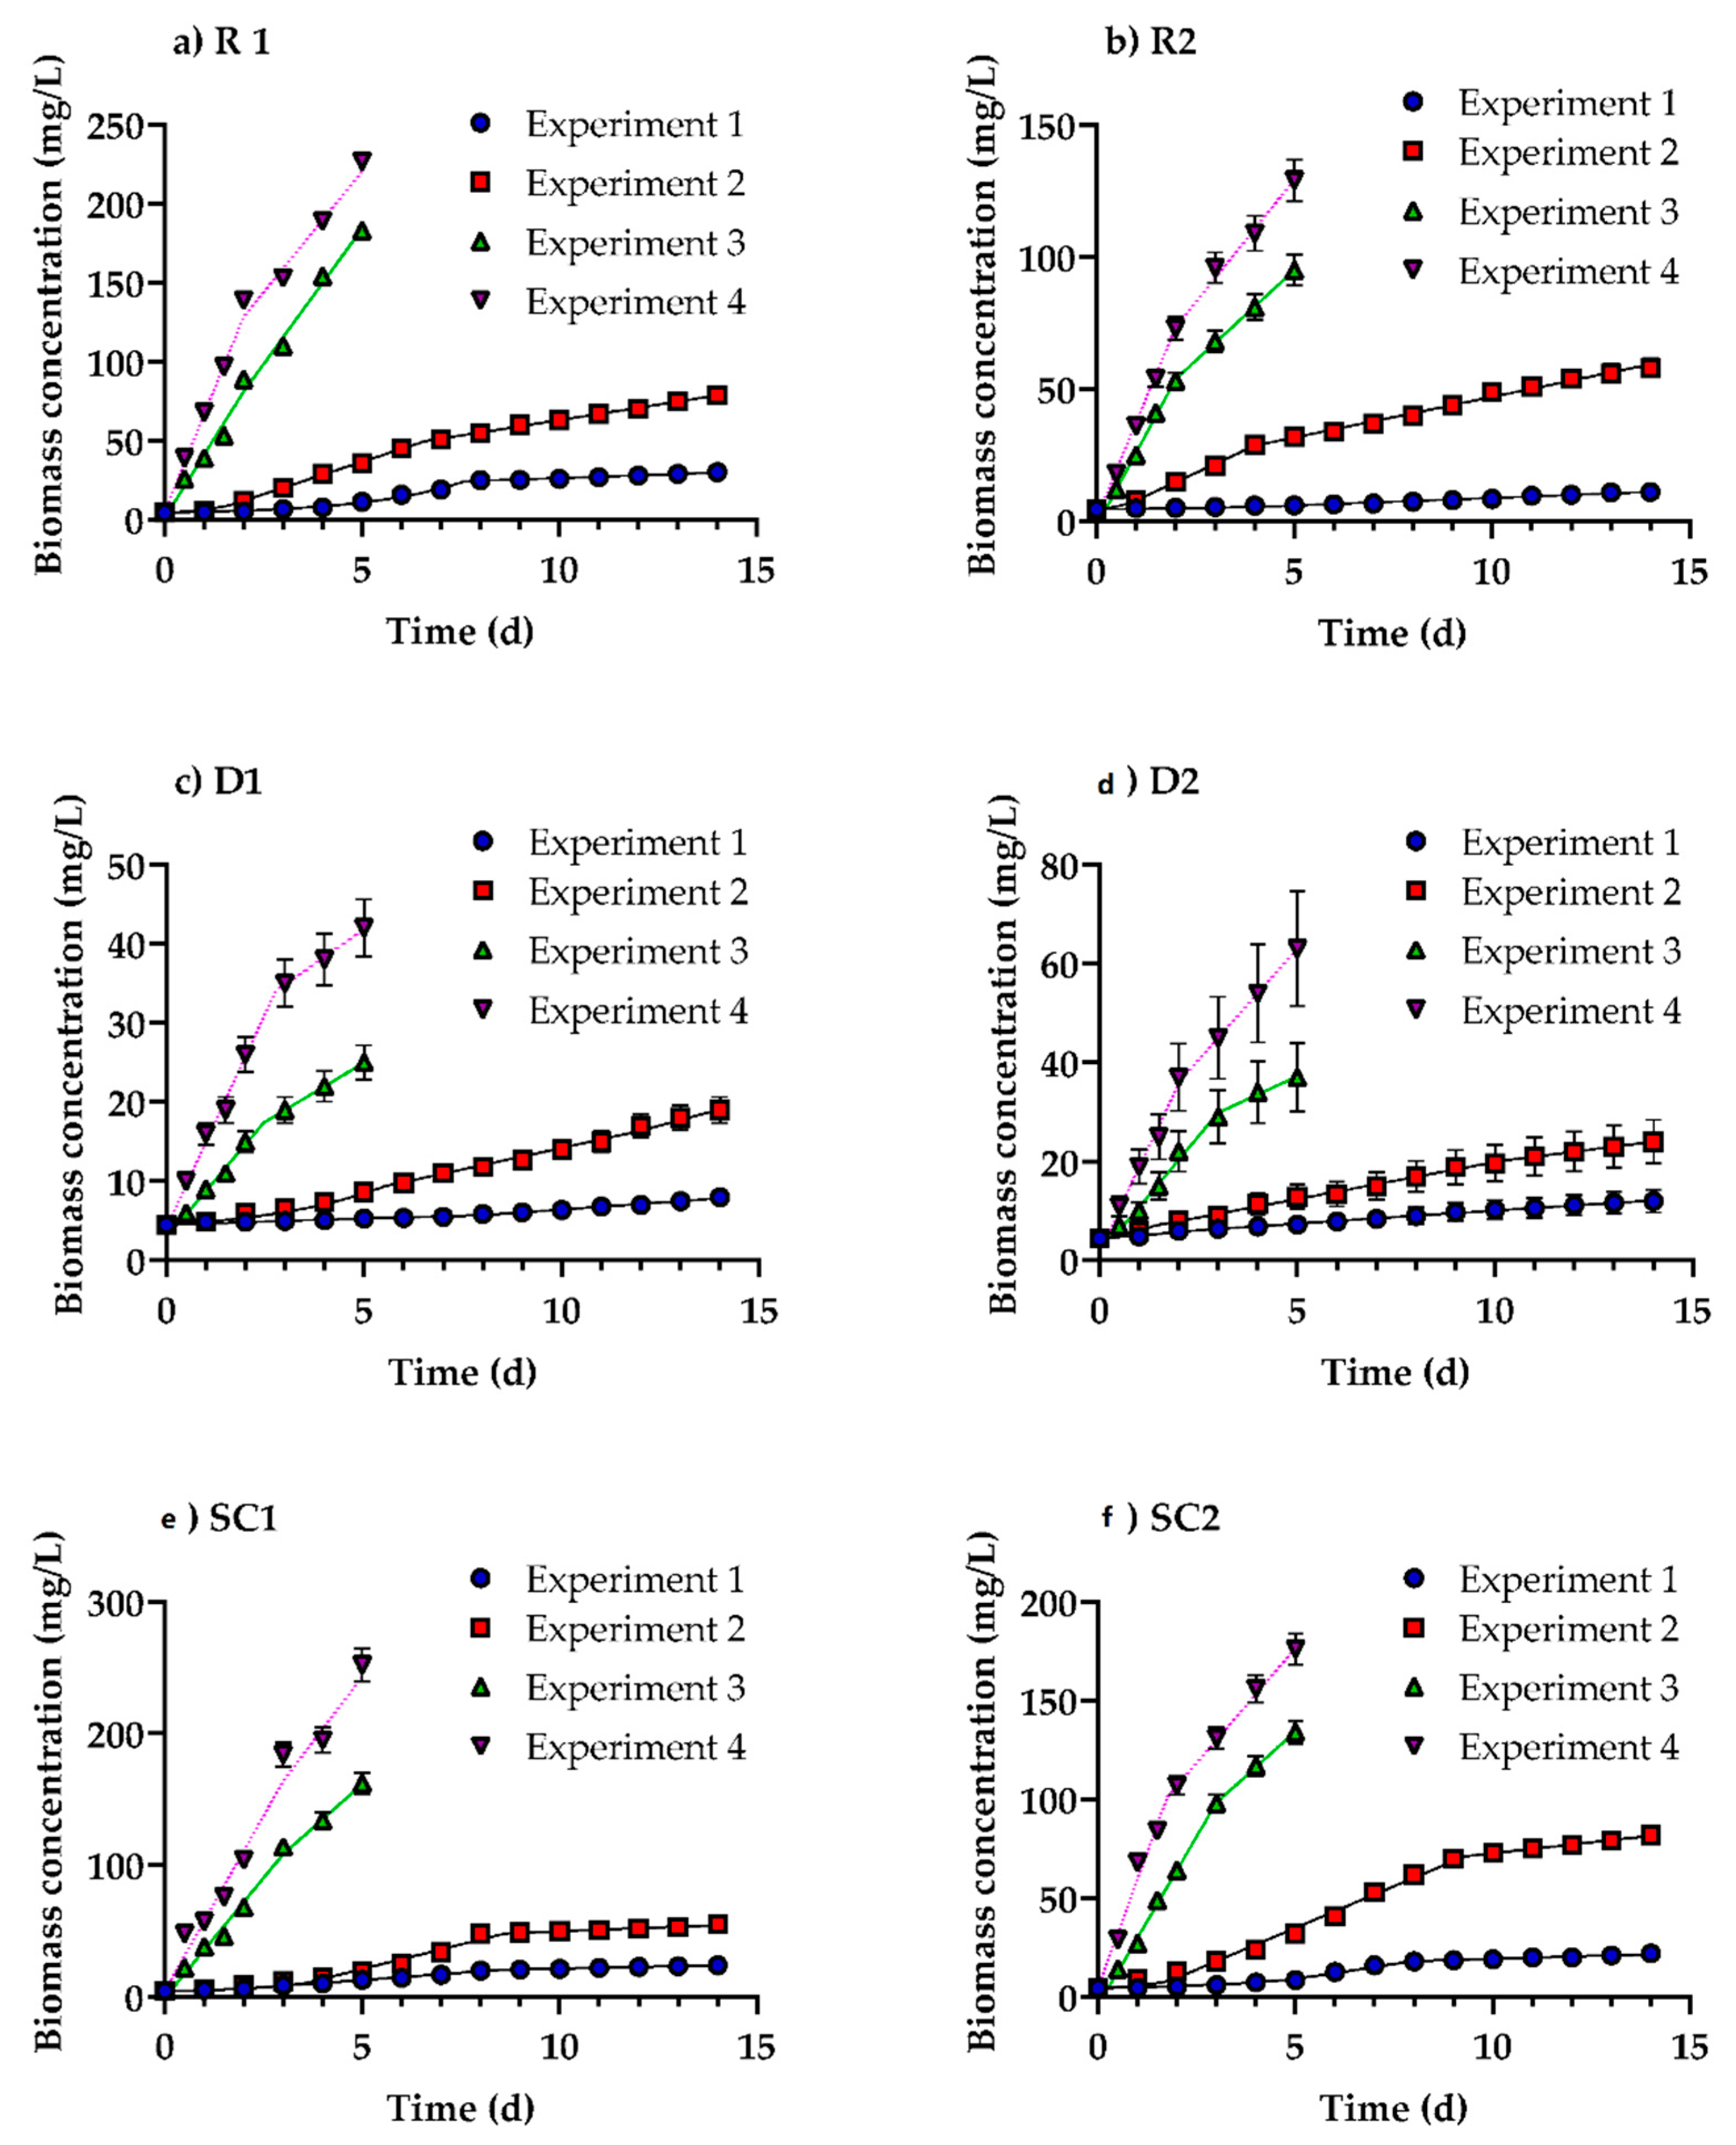
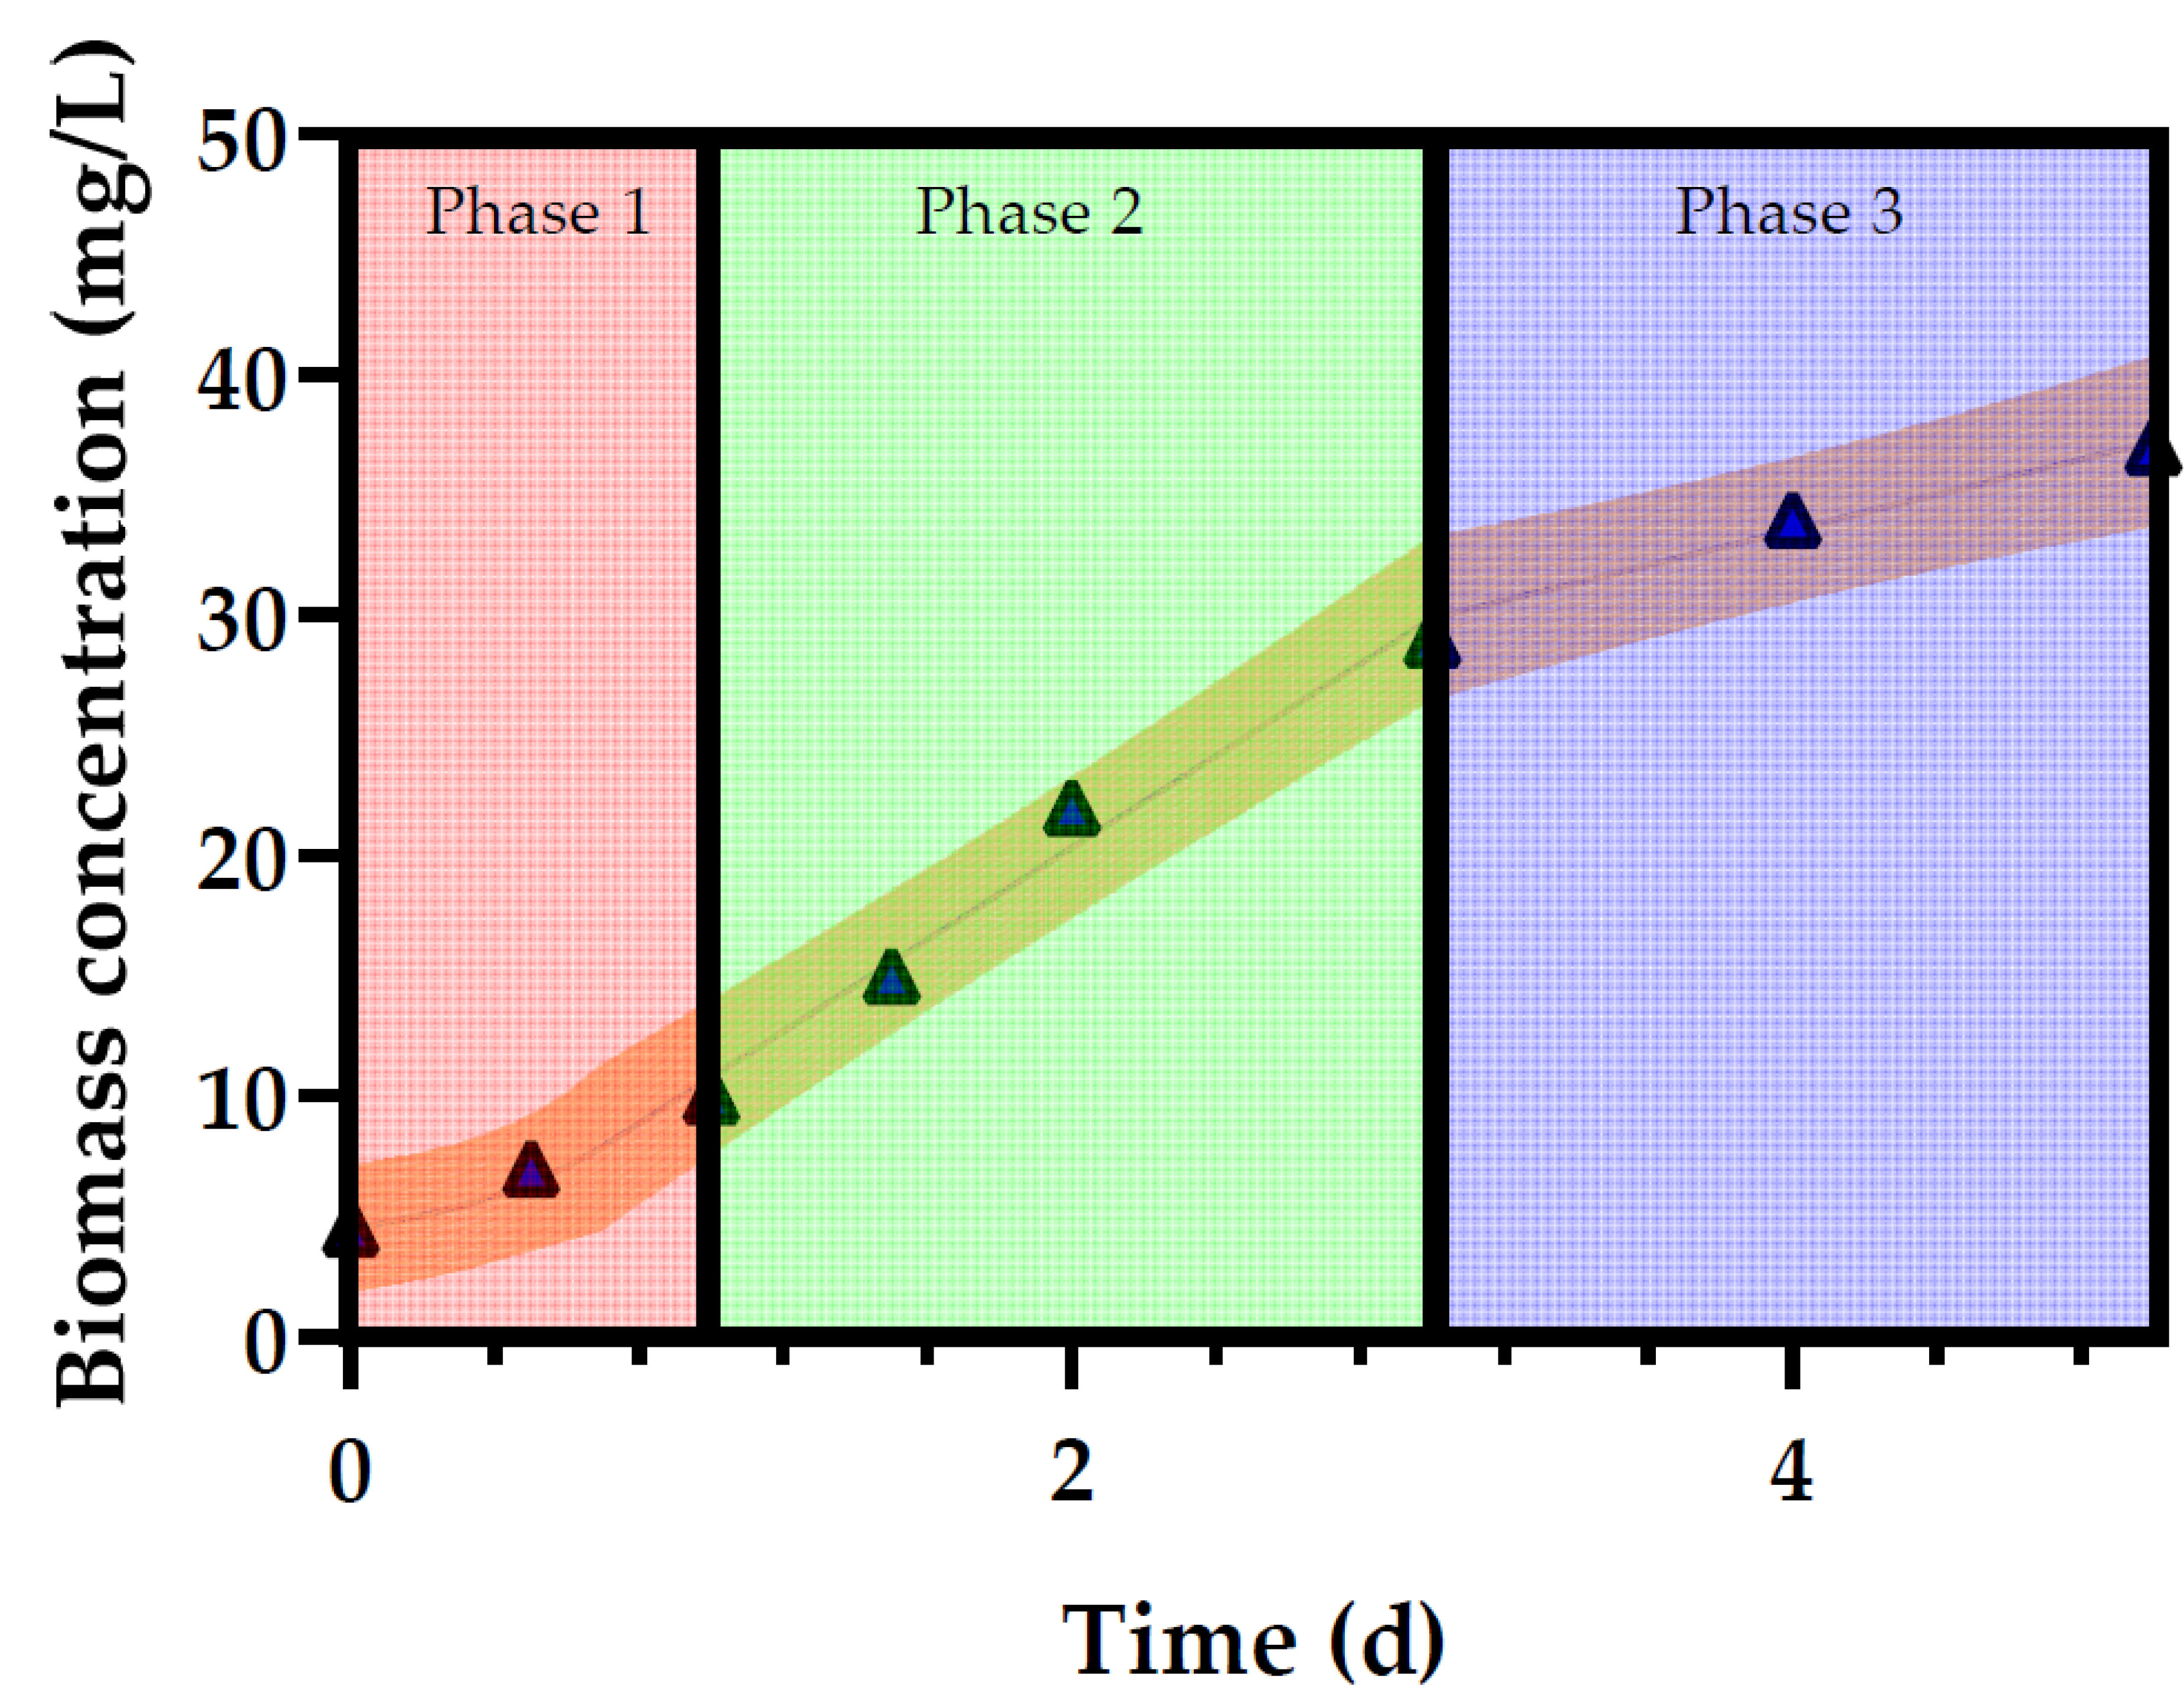
3.1. Growth of Profiles of Desmodesmus multivariabilis in Cosmetic Wastewater
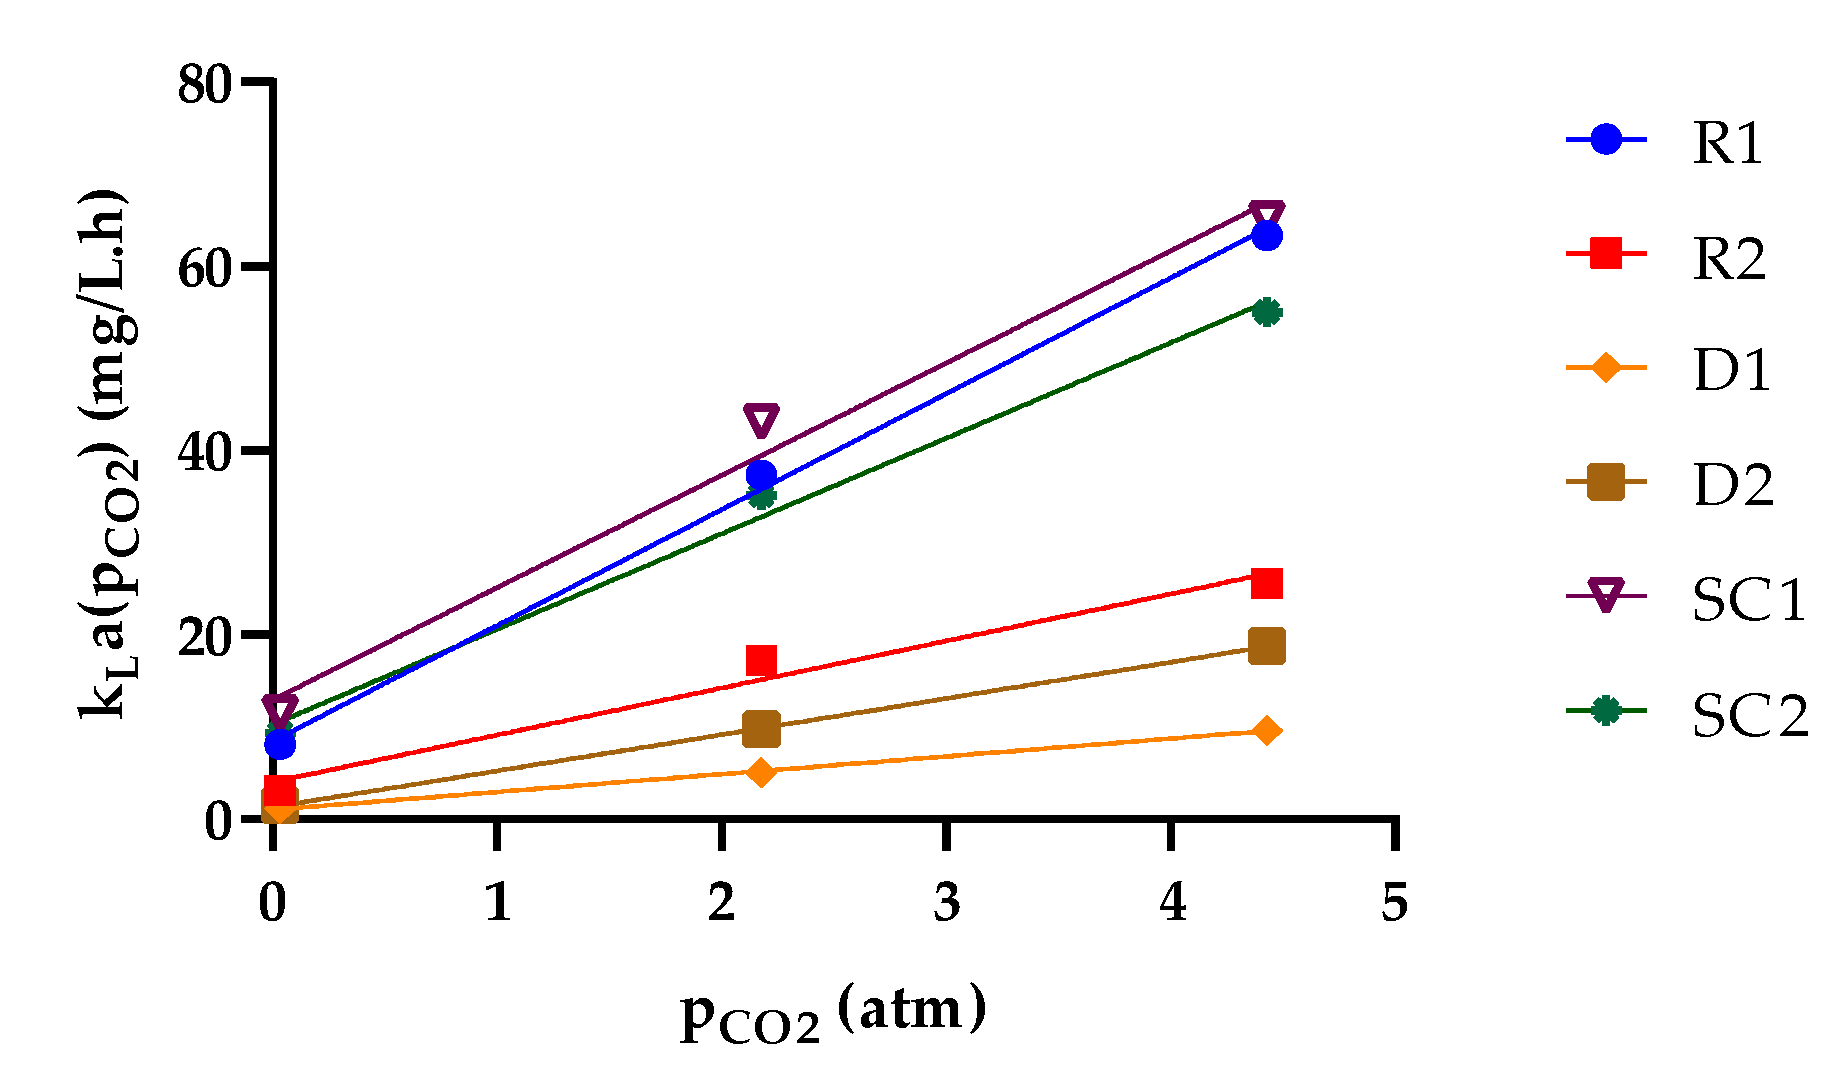
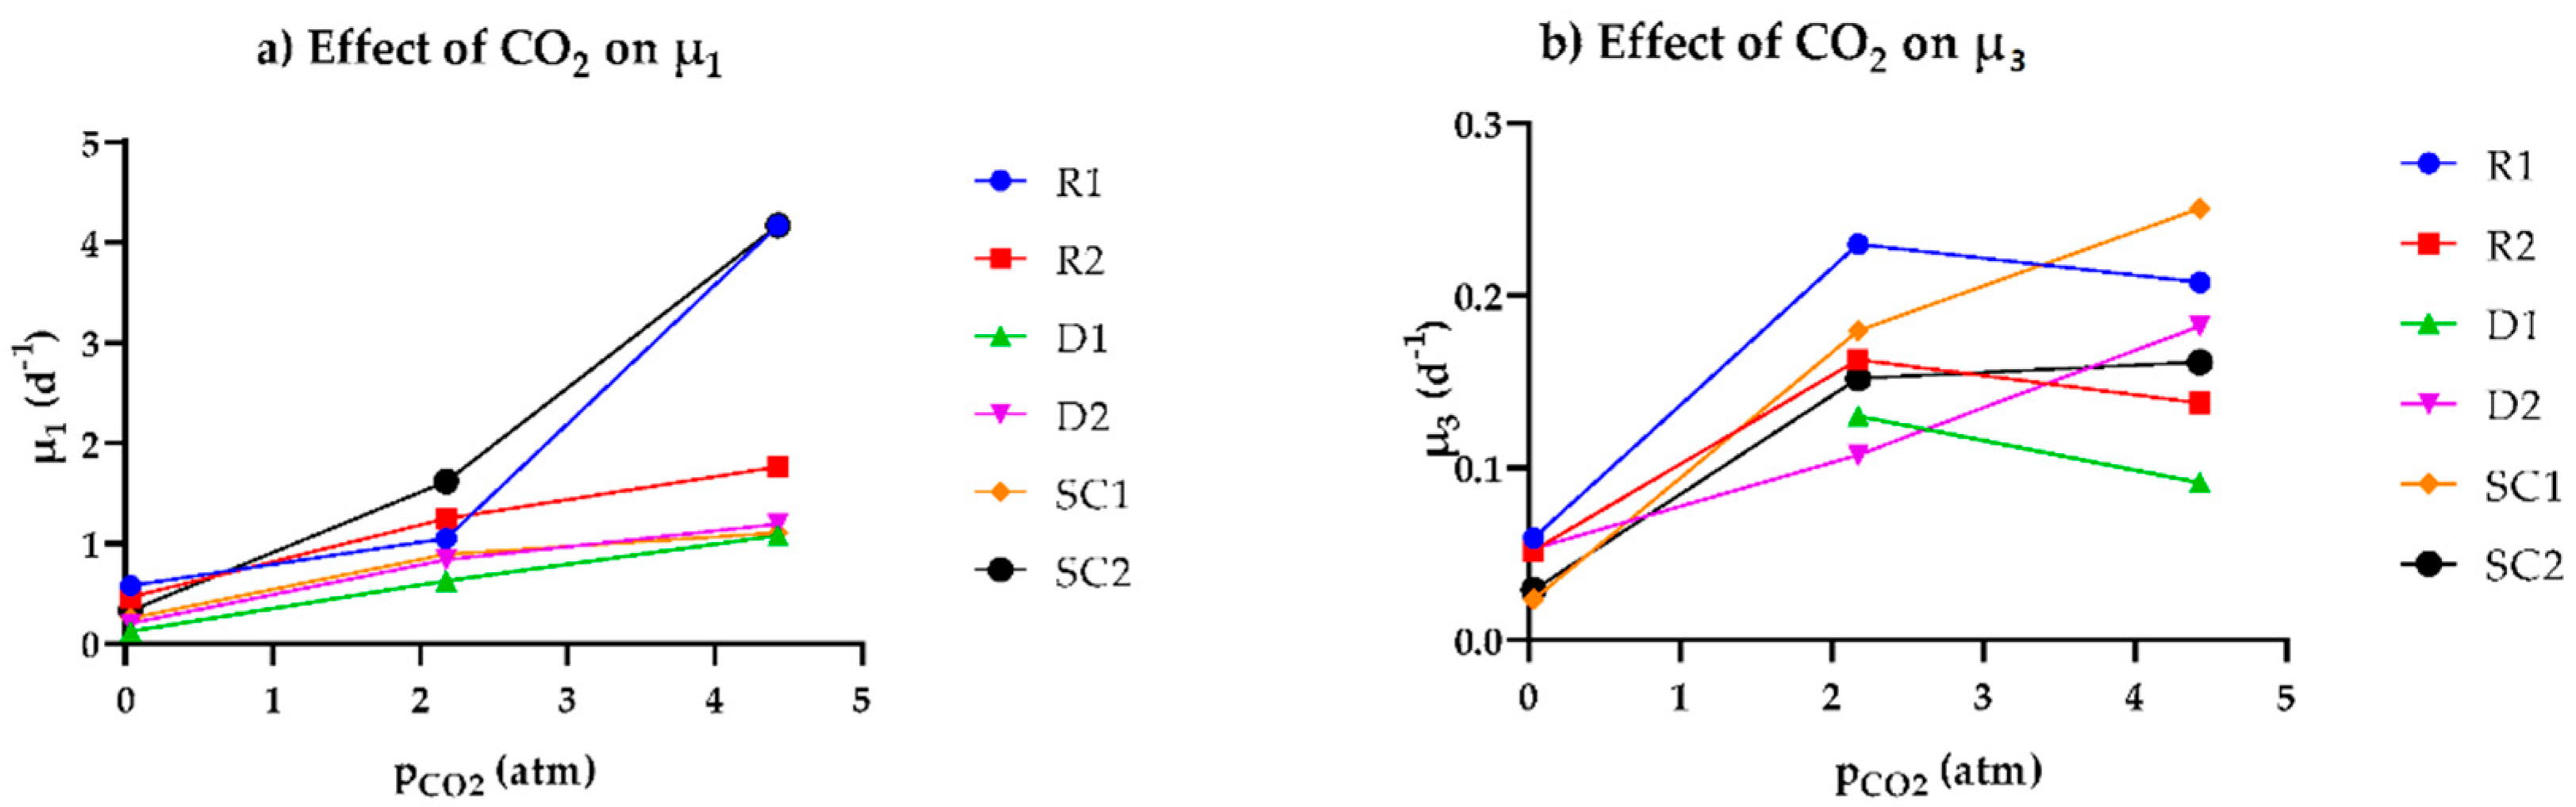
3.2. Relationship between the Observed Specific Growth Rate and CO2 Availability
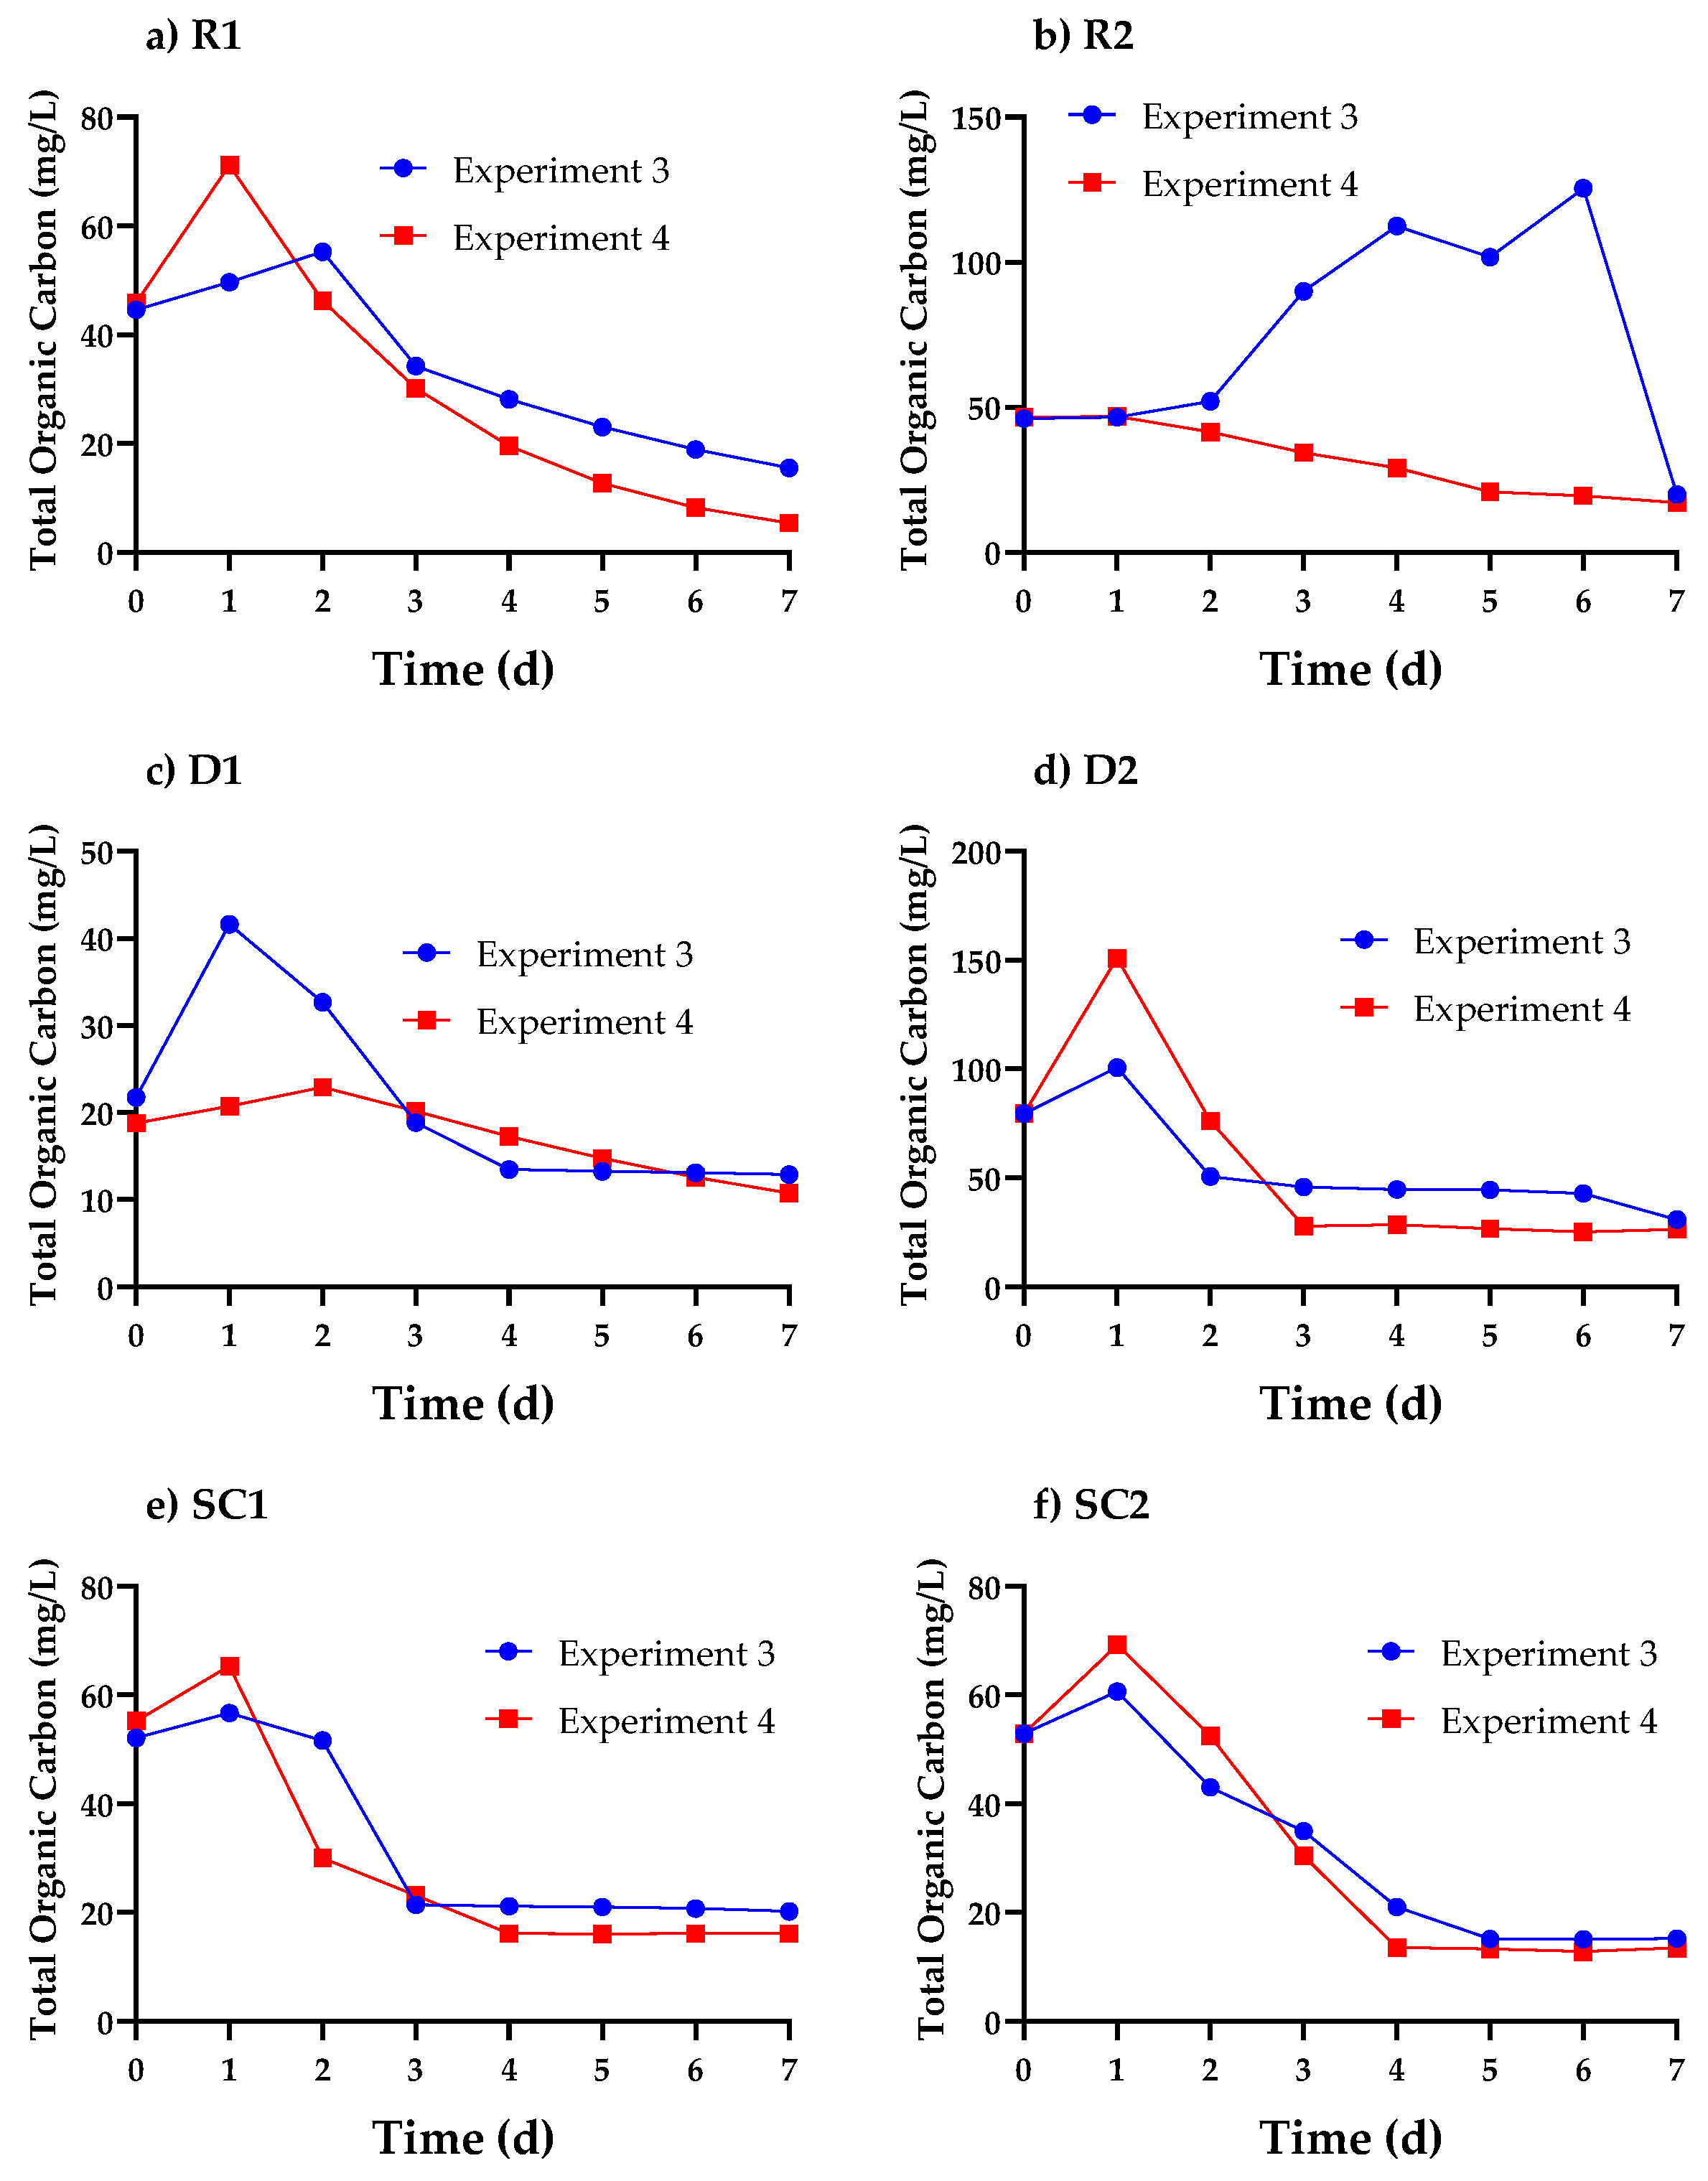
3.3. Cell Organics Concentration Profiles in Cosmetic Wastewater
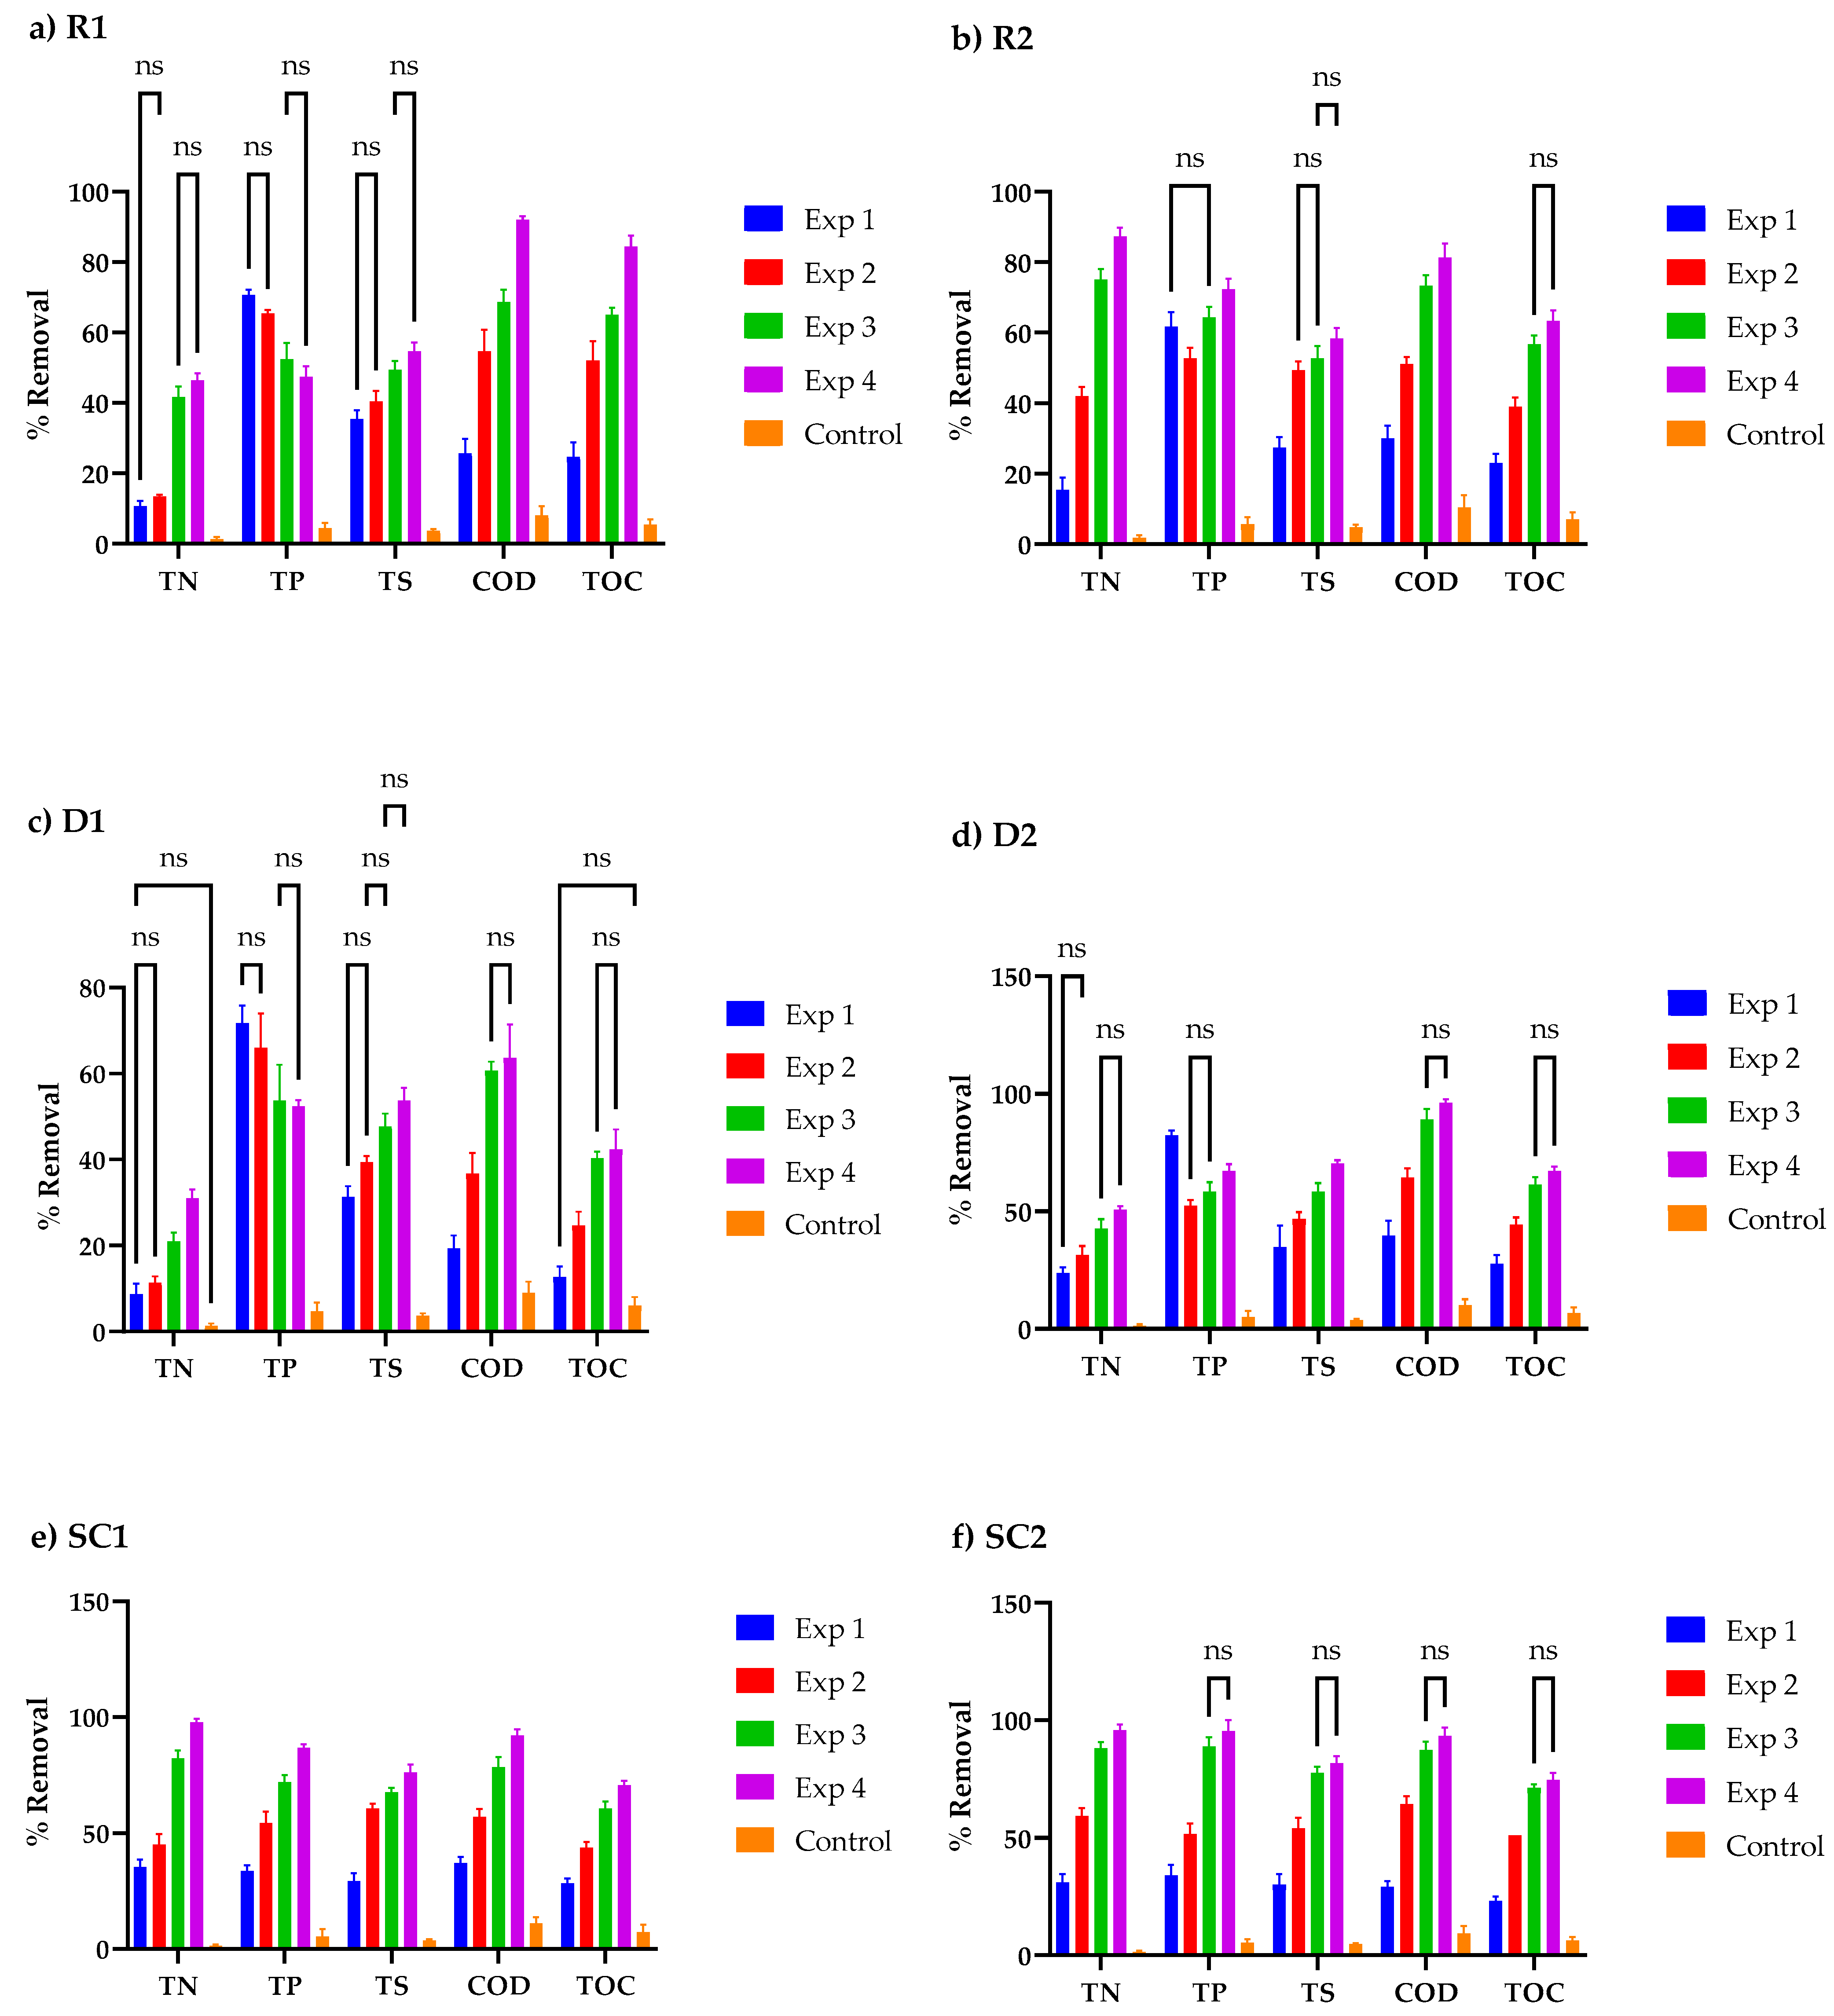
3.4. Nutrient Concentration Profiles in Cosmetic Wastewater
3.5. Relationship between Cell Organics, Biomass Growth, and Nutrient Uptake in Cosmetic Wastewater
4. Conclusions
Author Contributions
Funding
Institutional Review Board Statement
Informed Consent Statement
Data Availability Statement
Acknowledgments
Conflicts of Interest
References
- Azrina Yaakob, M.; Maya Saphira Radin Mohamed, R.; Al-Gheethi, A.; Aswathnarayana Gokare, R.; Rao Ambati, R. Influence of Nitrogen and Phosphorus on Microalgal Growth, Biomass, Lipid, and Fatty Acid Production: An Overview. Cells 2021, 10, 393. [Google Scholar] [CrossRef] [PubMed]
- Pancha, I.; Chokshi, K.; Ghosh, T.; Paliwal, C.; Maurya, R.; Mishra, S. Bicarbonate supplementation enhanced biofuel production potential as well as nutritional stress mitigation in the microalgae Scenedesmus sp. CCNM 1077. Bioresour. Technol. 2015, 193, 315–323. [Google Scholar] [CrossRef]
- Chen, H.; Qiu, T.; Rong, J.; He, C.; Wang, Q. Microalgal biofuel revisited: An informatics-based analysis of developments to date and future prospects. Appl. Energy 2015, 155, 585–598. [Google Scholar] [CrossRef]
- Gao, F.; Yang, H.L.; Li, C.; Peng, Y.Y.; Lu, M.M.; Jin, W.H.; Bao, J.J.; Guo, Y.M. Effect of organic carbon to nitrogen ratio in wastewater on growth, nutrient uptake and lipid accumulation of a mixotrophic microalgae Chlorella sp. Bioresour. Technol. 2019, 282, 118–124. [Google Scholar] [CrossRef] [PubMed]
- Vasconcelos Fernandes, T.; Shrestha, R.; Sui, Y.; Papini, G.; Zeeman, G.; Vet, L.E.M.; Wijffels, R.H.; Lamers, P. Closing Domestic Nutrient Cycles Using Microalgae. Environ. Sci. Technol. 2015, 49, 12450–12456. [Google Scholar] [CrossRef] [PubMed]
- Moheimani, N.R. Tetraselmis suecica culture for CO2 bioremediation of untreated flue gas from a coal-fired power station. J. Appl. Phycol. 2016, 28, 2139–2146. [Google Scholar] [CrossRef]
- Doucha, J.; Straka, F.; Lívansk´y, K.L. Utilization of flue gas for cultivation of microalgae (Chlorella sp.) in an outdoor open thin-layer photobioreactor. J. Appl. Phycol. 2005, 17, 403–412. [Google Scholar] [CrossRef]
- Irfan, M.; Zhao, Z.Y.; Rehman, A.; Ozturk, I.; Li, H. Consumers’ intention-based influence factors of renewable energy adoption in Pakistan: A structural equation modeling approach. Environ. Sci. Pollut. Res. 2021, 28, 432–445. [Google Scholar] [CrossRef] [PubMed]
- Irfan, M.; Zhao, Z.Y.; Li, H.; Rehman, A. The influence of consumers’ intention factors on willingness to pay for renewable energy: A structural equation modeling approach. Environ. Sci. Pollut. Res. 2020, 27, 21747–21761. [Google Scholar] [CrossRef] [PubMed]
- Brown, L.M. Uptake of carbon dioxide from flue gas by microalgae. Energy Convers. Manag. 1996, 37, 1363–1367. [Google Scholar] [CrossRef]
- Borkenstein, C.G.; Knoblechner, J.; Frühwirth, H.; Schagerl, M. Cultivation of Chlorella emersonii with flue gas derived from a cement plant. J. Appl. Phycol. 2011, 23, 131–135. [Google Scholar] [CrossRef]
- Cantrell, K.B.; Ducey, T.; Ro, K.S.; Hunt, P.G. Livestock waste-to-bioenergy generation opportunities. Bioresour. Technol. 2008, 99, 7941–7953. [Google Scholar] [CrossRef] [PubMed]
- de Godos, I.; Blanco, S.; García-Encina, P.A.; Becares, E.; Muñoz, R. Influence of flue gas sparging on the performance of high rate algae ponds treating agro-industrial wastewaters. J. Hazard. Mater. 2010, 179, 1049–1054. [Google Scholar] [CrossRef] [PubMed]
- Yadav, G.; Mathimani, T.; Sekar, M.; Sindhu, R.; Pugazhendhi, A. Strategic evaluation of limiting factors affecting algal growth—An approach to waste mitigation and carbon dioxide sequestration. Sci. Total Environ. 2021, 796, 149049. [Google Scholar] [CrossRef]
- Moheimani, N.R.; Borowitzka, M.A. Increased CO2 and the effect of pH on growth and calcification of Pleurochrysis carterae and Emiliania huxleyi (Haptophyta) in semicontinuous cultures. Appl. Microbiol. Biotechnol. 2011, 90, 1399–1407. [Google Scholar] [CrossRef]
- Nirmalakhandan, N.; Selvaratnam, T.; Henkanatte-Gedera, S.M.; Tchinda, D.; Abeysiriwardana-Arachchige, I.S.A.; Delanka-Pedige, H.M.K.; Munasinghe-Arachchige, S.P.; Zhang, Y.; Holguin, F.O.; Lammers, P.J. Algal wastewater treatment: Photoautotrophic vs. mixotrophic processes. Algal Res. 2019, 41, 101569. [Google Scholar] [CrossRef]
- Qiu, R.; Gao, S.; Lopez, P.A.; Ogden, K.L. Effects of pH on cell growth, lipid production and CO2 addition of microalgae Chlorella sorokiniana. Algal Res. 2017, 28, 192–199. [Google Scholar] [CrossRef]
- Schediwy, K.; Trautmann, A.; Steinweg, C.; Posten, C. Microalgal kinetics—A guideline for photobioreactor design and process development. Eng. Life Sci. 2019, 19, 830–843. [Google Scholar] [CrossRef] [PubMed] [Green Version]
- Lubbe, F.V.F.V.; Brink, H.G.H.G. CaCO3 supplementation of low-carbon wastewaters for the cultivation of microalgae: A Study with Desmodesmus multivariabilis. Chem. Eng. Trans. 2019, 74, 1465–1470. [Google Scholar] [CrossRef]
- Nielsen, A. Treatment of Wastewater with Microalgae under Mixotrophic Growth; Umea University: Umea, Sweden, 2015. [Google Scholar]
- Rinanti, A.; Dewi, K.; Astuti, D.I.; Halomoan, N. Preliminary Study on Biomitigation Green House Gas Carbon Dioxide in Closed System Bubble Photobioreactor: Relationship Among the Mass Transfer Rate and CO2 Removal Efficiency in High Level of CO2. J. Teknol. 2014, 69, 93–99. [Google Scholar] [CrossRef]
- Spijkerman, E.; de Castro, F.; Gaedke, U. Independent Colimitation for Carbon Dioxide and Inorganic Phosphorus. PLoS ONE 2011, 6, e28219. [Google Scholar] [CrossRef] [Green Version]
- Greenwell, H.C.; Laurens, L.M.L.; Shields, R.J.; Lovitt, R.W.; Flynn, K.J. Placing microalgae on the biofuels priority list: A review of the technological challenges. J. R. Soc. Interface 2010, 7, 703–726. [Google Scholar] [CrossRef] [PubMed] [Green Version]
- Bautista, P.; Mohedano, A.F.; Gilarranz, M.A.; Casas, J.A.; Rodriguez, J.J. Application of Fenton oxidation to cosmetic wastewaters treatment. J. Hazard. Mater. 2007, 143, 128–134. [Google Scholar] [CrossRef] [PubMed]
- Maifadi, S.; Mhlanga, S.D.; Nxumalo, E.N.; Motsa, M.M.; Kuvarega, A.T. Analysis and pretreatment of beauty hair salon wastewater using a rapid granular multimedia filtration system. J. Water Process Eng. 2020, 33, 101050. [Google Scholar] [CrossRef]
- Bogacki, J.; Naumczyk, J.; Marcinowski, P.; Kucharska, M. Treatment of cosmetic wastewater using physicochemical and chemical methods. Chemik 2011, 65, 94–97. [Google Scholar]
- Gkika, D.A.; Mitropoulos, A.C.; Lambropoulou, D.A.; Kalavrouziotis, I.K.; Kyzas, G.Z. Cosmetic wastewater treatment technologies: A review. Environ. Sci. Pollut. Res. 2022, 29, 75223–75247. [Google Scholar] [CrossRef] [PubMed]
- Huisman, I. Optimising UF for wastewater treatment through membrane autopsy and failure analysis. Filtr. Sep. 2004, 41, 26–27. [Google Scholar] [CrossRef]
- Friha, I.; Karray, F.; Feki, F.; Jlaiel, L.; Sayadi, S. Treatment of cosmetic industry wastewater by submerged membrane bioreactor with consideration of microbial community dynamics. Int. Biodeterior. Biodegradation 2014, 88, 125–133. [Google Scholar] [CrossRef]
- Onyancha, F.; Lubbe, D.; Brink, H.G. Enhancing low-carbon wastewaters with flue gas for the optimal cultivation of desmodesmus multivariabilis. Chem. Eng. Trans. 2021, 86, 355–360. [Google Scholar] [CrossRef]
- Birungi, Z.S.; Chirwa, E.M.N. Bioreduction of thallium and cadmium toxicity from industrial wastewater using microalgae. Chem. Eng. Trans. 2017, 57, 1183–1188. [Google Scholar] [CrossRef]
- CCAP (Culture Collection of Algae and Protozoa) 3N-BBM+V (Bold Basal Medium with 3-Fold Nitrogen and Vitamins; Modified). Available online: https://www.ccap.ac.uk/wp-content/uploads/MR_3N_BBM_V.pdf (accessed on 27 September 2022).
- Nguyen, L.N.; Aditya, L.; Vu, H.P.; Johir, A.H.; Bennar, L.; Ralph, P.; Hoang, N.B.; Zdarta, J.; Nghiem, L.D. Nutrient Removal by Algae-Based Wastewater Treatment. Curr. Pollut. Reports 2022, 1, 1–15. [Google Scholar] [CrossRef]
- Fair Labor Association Fair Labor Code. Available online: https://www.fairlabor.org/accountability/standards/manufacturing/mfg-code/ (accessed on 17 November 2022).
- Andersen, R.A. Algal Culturing Techniques, 1st ed.; Andersen, R.A., Ed.; Elsevier: Amsterdam, The Netherlands, 2004; ISBN 9780080456508. [Google Scholar]
- Roestorff, M.M.; Chirwa, E.M.N. Cr(VI) mediated hydrolysis of algae cell walls to release TOC for enhanced biotransformation of Cr(VI) by a culture of Cr(VI) reducing bacteria. J. Appl. Phycol. 2019, 31, 3637–3649. [Google Scholar] [CrossRef]
- Mokwatlo, S.C.; Nicol, W.; Brink, H.G. Internal mass transfer considerations in biofilms of succinic acid producing Actinobacillus succinogenes. Chem. Eng. J. 2021, 407, 127220. [Google Scholar] [CrossRef]
- Kraakman, N.J.R.; Rocha-Rios, J.; van Loosdrecht, M.C.M. Review of mass transfer aspects for biological gas treatment. Appl. Microbiol. Biotechnol. 2011, 91, 873–886. [Google Scholar] [CrossRef] [PubMed] [Green Version]
- Barton, J.W.; Davison, B.H.; Klasson, K.T.; Gable, C.C. Estimation of mass transfer and kinetics in operating trickle-bed bioreactors for removal of VOCS. Environ. Prog. 1999, 18, 87–92. [Google Scholar] [CrossRef]
- Lee, E.; Jalalizadeh, M.; Zhang, Q. Growth kinetic models for microalgae cultivation: A review. Algal Res. 2015, 12, 497–512. [Google Scholar] [CrossRef]
- Muñoz, R.; Guieysse, B. Algal–bacterial processes for the treatment of hazardous contaminants: A review. Water Res. 2006, 40, 2799–2815. [Google Scholar] [CrossRef]
- Sharma, J.; Kumar, V.; Kumar, S.S.; Malyan, S.K.; Mathimani, T.; Bishnoi, N.R.; Pugazhendhi, A. Microalgal consortia for municipal wastewater treatment—Lipid augmentation and fatty acid profiling for biodiesel production. J. Photochem. Photobiol. B Biol. 2020, 202, 111638. [Google Scholar] [CrossRef]
- Kamyab, H.; Md Din, M.F.; Tin, C.L.; Ponraj, M.; Soltani, M.; Mohamad, S.E.; Roudi, A.M. Micro-Macro Algal Mixture as a Promising Agent for Treating POME Discharge and its Potential Use as Animal Feed Stock Enhancer. J. Teknol. 2014, 68, 1–4. [Google Scholar] [CrossRef] [Green Version]
- Haynes, W. Tukey’s Test. In Encyclopedia of Systems Biology; Springer: New York, NY, USA, 2013; pp. 2303–2304. [Google Scholar]
- Pavlić, Ž.; Vidaković-Cifrek, Ž.; Puntarić, D. Toxicity of surfactants to green microalgae Pseudokirchneriella subcapitata and Scenedesmus subspicatus and to marine diatoms Phaeodactylum tricornutum and Skeletonema costatum. Chemosphere 2005, 61, 1061–1068. [Google Scholar] [CrossRef]
- Hussain, F.; Shah, S.Z.; Zhou, W.; Iqbal, M. Microalgae screening under CO2 stress: Growth and micro-nutrients removal efficiency. J. Photochem. Photobiol. B Biol. 2017, 170, 91–98. [Google Scholar] [CrossRef] [PubMed]
- Serejo, M.L.; Farias, S.L.; Ruas, G.; Paulo, P.L.; Boncz, M.A. Surfactant removal and biomass production in a microalgal-bacterial process: Effect of feeding regime. Water Sci. Technol. 2020, 82, 1176–1183. [Google Scholar] [CrossRef] [PubMed]
- Peña-Castro, J.M.; Martínez-Jerónimo, F.; Esparza-García, F.; Cañizares-Villanueva, R.O. Phenotypic plasticity in Scenedesmus incrassatulus (Chlorophyceae) in response to heavy metals stress. Chemosphere 2004, 57, 1629–1636. [Google Scholar] [CrossRef] [PubMed]
- Lellis, B.; Fávaro-Polonio, C.Z.; Pamphile, J.A.; Polonio, J.C. Effects of textile dyes on health and the environment and bioremediation potential of living organisms. Biotechnol. Res. Innov. 2019, 3, 275–290. [Google Scholar] [CrossRef]
- Roy, R.; Fakhruddin, A.; Khatun, R.; Islam, M.; Ahsan, M.; Neger, A. Characterization of Textile Industrial Effluents and its Effects on Aquatic Macrophytes and Algae. Bangladesh J. Sci. Ind. Res. 2010, 45, 79–84. [Google Scholar] [CrossRef]


| Routine | Products | 1FLA Numbers |
|---|---|---|
| R1 | Dark and Lovely Superior Moisture Plus Kit Relaxer, shampoo, and conditioner | 1185566 02, 8900 SA2, 43122 SA7, 43123 SA3 |
| R2 | Wave Nouveau perm | 42172 SS6, 42180 SS9, 42098 SS4 |
| D1 | Inoa black Dye | 1094875, 1071397 |
| D2 | Majirel red Dye | 1162585, 178914 U |
| SC1 | Au Naturale Moisture-Replenishing Shampoo and Knot-Out Conditioner | 42914 SS1, 42913 SS5 |
| SC2 | Mizani Scalp Care Shampoo and conditioner Mizani Scalp Care Conditioner | 42517 SS6, 42518 SS5 |
| Experiment | Wastewater | Aeration | Inoculation | Period | Repeats |
|---|---|---|---|---|---|
| 1 | Raw | 0% CO2 | 15 mL | 14 days | 3 |
| 2 | Pre-treated | 0% CO2 | 15 mL | 14 days | 3 |
| 3 | Pre-treated | 2.5% CO2 | 15 mL | 5 days | 3 |
| 4 | Pre-treated | 5% CO2 | 15 mL | 5 days | 3 |
| Control | Pre-treated | 0% CO2 | 0 mL | 14 days | 3 |
| Description | Parameter | Unit | Equation/Definition | |
|---|---|---|---|---|
| Average biomass growth rate | mg/(L.d) | (1) | ||
| Specific growth rate | 1/d | (2) | ||
| TOC removal efficiency | %TOC | % | (3) | |
| COD removal efficiency | %COD | % | (4) | |
| N removal efficiency | %N | % | (5) | |
| P removal efficiency | %P | % | (6) | |
| S removal efficiency | %S | % | (7) |
| Parameter | R1 | R2 | D1 | D2 | SC1 | SC2 |
|---|---|---|---|---|---|---|
| R2 | 0.8179 | 0.9672 | 0.9648 | 0.9434 | 0.9503 | 0.9316 |
| Slope | 140.75 | 139.62 | 39.303 | 39.121 | 71.281 | 39.241 |
| Intercept | 4.773 | 5.9393 | 3.2167 | 8.7563 | 2.851 | 6.627 |
| Parameter | Unit | R1 | R2 | D1 | D2 | SC1 | SC2 | |
|---|---|---|---|---|---|---|---|---|
| Experiment 1 | COD | mg/L | 2483 | 4670 | 14,586 | 9968 | 1379 | 2498 |
| TOC | mg/L | 45 | 47 | 22 | 71 | 53 | 50 | |
| TN | mg/L | 61 | 7.1 | 51 | 44 | 43 | 14 | |
| TS | mg/L | 179 | 248 | 1238 | 239 | 52 | 87 | |
| TPO | mg/L | 45 | 6 | 51 | 70.8 | 66 | 70 | |
| pH | - | 10.07 | 9.03 | 9.3 | 9.55 | 7.24 | 7.81 | |
| Control, Experiments 2–4 | COD | mg/L | 1983 | 4120 | 11,102 | 9662 | 1296 | 2296 |
| TOC | mg/L | 42 | 33 | 18 | 67 | 56 | 46 | |
| TN | mg/L | 58 | 6.0 | 16.6 | 39.2 | 41.3 | 10 | |
| TS | mg/L | 124 | 163 | 1170 | 216 | 37.5 | 70 | |
| TPO | mg/L | 39 | 5.5 | 78.4 | 65.4 | 57 | 61 | |
| pH | - | 10.07 | 9.03 | 9.3 | 9.55 | 7.24 | 7.81 |
| Parameter | Exp 1,2 | R1 | R2 | D1 | D2 | SC1 | SC2 |
|---|---|---|---|---|---|---|---|
| Biomass concentration (mg dry Biomass/L) | 1 | 30 ± 0.52 | 11 ± 0.69 | 8 ± 0.70 | 12 ± 2.27 | 24 ± 1.19 | 12 ± 0.54 |
| 2 | 79 ± 1.38 | 58 ± 3.55 | 19 ± 1.66 | 24 ± 4.42 | 55 ± 5.15 | 82 ± 3.61 | |
| 3 | 183 ± 3.17 | 95 ± 5.79 | 25 ± 2.18 | 37 ± 6.87 | 162 ± 7.92 | 134 ± 5.92 | |
| 4 | 283 ± 4.89 | 129 ± 7.88 | 42 ± 3.63 | 63 ± 11.64 | 252 ± 12.33 | 176 ± 7.78 | |
| , (mg/(L.day)) | 1 | 1.3 ± 0.02 | 0.5 ± 0.03 | 0.4 ± 0.03 | 0.6 ± 0.10 | 1.1 ± 0.05 | 0.5 ± 0.02 |
| 2 | 3.2 ± 0.06 | 2.4 ± 0.14 | 1.0 ± 0.07 | 1.0 ± 0.18 | 4.3 ± 0.21 | 3.3 ± 0.15 | |
| 3 | 25.3 ± 0.44 | 13.0 ± 0.80 | 3.5 ± 0.30 | 5.2 ± 0.95 | 22.3 ± 1.09 | 18.5 ± 0.82 | |
| 4 | 40.7 ± 0.70 | 18.5 ± 1.13 | 6.0 ± 0.52 | 9.1 ± 1.67 | 36.3 ± 1.77 | 25.3 ± 1.12 |
| Parameter | Exp 1 | R1 | R2 | D1 | D2 | SC1 | SC2 |
|---|---|---|---|---|---|---|---|
| μ1 (d−1) | 1 | 0.1365 | 0.06784 | 0.03742 | 0.1355 | 0.2193 | 0.1613 |
| 2 | 0.5806 | 0.4655 | 0.1251 | 0.2055 | 0.2574 | 0.331 | |
| 3 | 1.05 | 1.248 | 0.6277 | 0.8407 | 0.8919 | 1.62 | |
| 4 | 4.168 | 1.765 | 1.081 | 1.195 | 1.105 | 4.168 | |
| (g.L−1. d−1) | 1 | 4.208 | - | - | 0.5556 | 2.388 | 3.104 |
| 2 | 8.049 | 3.123 | 1.163 | 1.489 | 11.51 | 9.397 | |
| 3 | 37.52 | 17.25 | 5.056 | 9.747 | 43.08 | 35.17 | |
| 4 | 74.97 | 29.01 | 9.655 | 18.78 | 65.04 | 55.01 | |
| μ3 (d−1) | 1 | 0.03523 | - | - | 0.04561 | 0.03241 | 0.02813 |
| 2 | 0.05944 | 0.05222 | - | 0.05303 | 0.02374 | 0.02915 | |
| 3 | 0.2298 | 0.1629 | 0.1302 | 0.1074 | 0.1796 | 0.1519 | |
| 4 | 0.2076 | 0.1377 | 0.09136 | 0.1825 | 0.2506 | 0.1613 | |
| R2 | 1 | 0.9984 | 0.9879 | 0.9645 | 0.9971 | 0.9976 | 0.9959 |
| 2 | 0.9992 | 0.9926 | 0.997 | 0.9966 | 0.9988 | 0.999 | |
| 3 | 0.9905 | 0.998 | 0.9964 | 0.9956 | 0.9941 | 0.9991 | |
| 4 | 0.9978 | 0.9964 | 0.9967 | 0.9964 | 0.9833 | 0.9963 |
| Parameter | R1 | R2 | D1 | D2 | SC1 | SC2 |
|---|---|---|---|---|---|---|
| kLa (g.L−1.atm−1.d−1) | 12.58 | 5.102 | 1.933 | 3.935 | 12.19 | 10.36 |
| R2 | 0.9975 | 0.9739 | 0.9989 | 0.9999 | 0.9865 | 0.9920 |
| Parameter | Experiment 1,2 | R1 | R2 | D1 | D2 | SC1 | SC2 |
|---|---|---|---|---|---|---|---|
| TOC | 1 | 0.79 | 0.77 | 0.20 | 1.40 | 1.08 | 0.83 |
| 2 | 1.67 | 1.30 | 0.38 | 2.26 | 1.65 | 1.85 | |
| 3 | 5.86 | 5.31 | 1.79 | 8.72 | 6.45 | 7.17 | |
| 4 | 7.93 | 5.92 | 1.88 | 9.52 | 7.46 | 7.51 | |
| Control | 0.17 | 0.23 | 0.09 | 0.33 | 0.27 | 0.23 | |
| COD | 1 | 46 | 100 | 201 | 285 | 37 | 52 |
| 2 | 97 | 167 | 379 | 458 | 56 | 114 | |
| 3 | 340 | 684 | 1777 | 1769 | 219 | 445 | |
| 4 | 460 | 763 | 1861 | 1913 | 254 | 465 | |
| Control | 14 | 35 | 92 | 69 | 10 | 17 |
| Parameter | Experiment 1,2 | R1 | R2 | D1 | D2 | SC1 | SC2 |
|---|---|---|---|---|---|---|---|
| TN | 1 | 0.05 | 0.08 | 0.32 | 0.74 | 1.09 | 0.31 |
| 2 | 0.06 | 0.21 | 0.41 | 0.98 | 1.38 | 0.59 | |
| 3 | 0.51 | 1.07 | 2.14 | 3.75 | 7.05 | 2.46 | |
| 4 | 0.57 | 1.24 | 3.16 | 4.46 | 8.40 | 2.68 | |
| Control | 0.01 | 0.01 | 0.05 | 0.05 | 0.05 | 0.02 | |
| TS | 1 | 4.52 | 4.84 | 27.71 | 5.92 | 1.09 | 1.86 |
| 2 | 5.16 | 8.74 | 34.78 | 7.97 | 2.25 | 3.36 | |
| 3 | 17.66 | 26.12 | 118.02 | 27.88 | 7.04 | 13.51 | |
| 4 | 19.57 | 28.93 | 132.88 | 33.62 | 7.94 | 14.21 | |
| Control | 0.47 | 0.84 | 3.57 | 0.76 | 0.18 | 0.27 | |
| TP | 1 | 0.30 | 1.98 | 5.04 | 4.16 | 1.59 | 1.70 |
| 2 | 0.28 | 1.69 | 4.64 | 2.65 | 2.56 | 2.58 | |
| 3 | 0.63 | 5.79 | 10.57 | 8.26 | 9.50 | 12.41 | |
| 4 | 0.57 | 6.51 | 10.31 | 9.49 | 11.44 | 13.35 | |
| Control | 0.02 | 0.18 | 0.34 | 0.27 | 0.27 | 0.26 |
| Exp 1,2 | R1 | R2 | D1 | D2 | SC1 | SC2 |
|---|---|---|---|---|---|---|
| 1 | 12.07 ± 0.22 | 8.20 ± 0.05 | 9.60 ± 0.15 | 9.88 ± 0.17 | 10.16 ± 0.09 | 9.62 ± 0.09 |
| 2 | 10.80 ± 0.16 | 10.65 ± 0.03 | 10.74 ± 0.17 | 10.56 ± 0.00 | 11.84 ± 0.05 | 10.34 ± 0.10 |
| 3 | 6.90 ± 0.08 | 6.93 ± 0.02 | 7.10 ± 0.08 | 7.00 ± 0.08 | 6.63 ± 0.05 | 6.72 ± 0.08 |
| 4 | 6.47 ± 0.05 | 6.35 ± 0.09 | 6.83 ± 0.12 | 6.57 ± 0.05 | 6.33 ± 0.12 | 6.37 ± 0.10 |
| Control | 11.88 ± 0.03 | 8.92 ± 0.06 | 8.91 ± 0.04 | 9.44 ± 0.05 | 7.13 ± 0.05 | 7.58 ± 0.06 |
Publisher’s Note: MDPI stays neutral with regard to jurisdictional claims in published maps and institutional affiliations. |
© 2022 by the authors. Licensee MDPI, Basel, Switzerland. This article is an open access article distributed under the terms and conditions of the Creative Commons Attribution (CC BY) license (https://creativecommons.org/licenses/by/4.0/).
Share and Cite
Onyancha, F.M.; Haneklaus, N.H.; Brink, H.G. Cultivation of Desmodesmus multivariabilis for the Treatment of Cosmetic Wastewater. Sustainability 2022, 14, 15665. https://doi.org/10.3390/su142315665
Onyancha FM, Haneklaus NH, Brink HG. Cultivation of Desmodesmus multivariabilis for the Treatment of Cosmetic Wastewater. Sustainability. 2022; 14(23):15665. https://doi.org/10.3390/su142315665
Chicago/Turabian StyleOnyancha, Faith M., Nils H. Haneklaus, and Hendrik G. Brink. 2022. "Cultivation of Desmodesmus multivariabilis for the Treatment of Cosmetic Wastewater" Sustainability 14, no. 23: 15665. https://doi.org/10.3390/su142315665
APA StyleOnyancha, F. M., Haneklaus, N. H., & Brink, H. G. (2022). Cultivation of Desmodesmus multivariabilis for the Treatment of Cosmetic Wastewater. Sustainability, 14(23), 15665. https://doi.org/10.3390/su142315665