Abstract
The beef cattle industry is pivotal in China’s livestock industry and is important for meeting people’s needs for a better life in the new era. It is strategically important for prospering the frontier, enriching people, and revitalizing the countryside. Because of the national “double carbon” target, there will be an impact on the development of the meat cattle industry, which has a relatively high carbon emission level. The scientific measurement of carbon emission levels in the beef cattle industry, clarifying its main impact factors, are particularly critical. This study measured the carbon emissions from China’s beef cattle industry from 2008 to 2020, using provincial data and the life cycle method, and investigated its influencing factors using a spatial econometric model. The study is of great practical significance for accurately understanding the carbon emissions of the beef cattle industry and for promoting low carbon emission reductions and the transformational development of the beef cattle industry.
1. Introduction
As global warming continues, and the world’s population is expected to reach 9.2 billion by 2075, agricultural development’s main challenges are environmental degradation and population growth [1]. Climate change is of international concern, and countries must urgently fulfill their obligations to reduce greenhouse gas (GHG) emissions. It is estimated that livestock, the largest source of emissions from agricultural systems, accounts for 70% of total agricultural emissions and approximately 18% of total global anthropogenic GHG emissions [2,3]. A total of 75% of CO2 emissions from livestock originate from ruminants, which emit GHGs directly through respiration, enteric fermentation, and excretion [4,5]. By estimating the amount of GHGs emitted from livestock and poultry product production, Lesschen and Llonch found that the beef and dairy industries emit significant amounts of GHG emissions, accounting for 41% and 20% of GHG emissions from the livestock industry, respectively, much higher than the hog and poultry industries [6,7]. As a developing country, China has seen an increasing demand for beef and other animal products from both urban and rural residents in recent years, along with population growth and increased urbanization. However, according to statistics from China’s National Bureau of Statistics, the domestic beef supply has been maintained at 6–7 million tons for many years, the contradiction between supply and demand in the market is more prominent, and the trade deficit is gradually increasing, endangering industrial security. Carbon emissions from animal husbandry threaten ecological security and hinder the realization of the “carbon peaking and carbon neutrality goals”. Based on this, the future of China’s beef cattle industry to achieve sustainable development and low carbon emission reduction is worthy of in-depth consideration and research.
There are lots of studies about the carbon emissions from the beef cattle industry. To account for carbon emissions, Mogensen et al. (2015) estimated beef production systems in Denmark and Sweden using the life cycle evaluation method [8], and Alemu et al. (2017) similarly measured GHG emissions from a typical cattle farm in western Canada for eight years using the life cycle evaluation method [9]. Gao et al. (2014) used the emission factor method to calculate the Chinese CH4 and N2O emissions from enteric fermentation and manure management in dairy and beef cattle between 1961 and 2010 [10]. To measure the carbon emissions of dairy cows more accurately, Baek et al. (2014) selected a dairy farm in central Korea as a case study to analyze carbon emissions based on a life cycle assessment approach combined with the Intergovernmental Panel on Climate Change’s (IPCC) GHG emission calculation formula, and comprehensively considered carbon emissions from dairy cows in terms of feed composition, growth stages, gastrointestinal fermentation, and manure management [11]. Kanemoto et al. (2013) argued that an accurate estimation of GHGs in China’s beef cattle industry would help the government to improve its decision-making capacity [12]. In recent years, scholars in China have also focused on carbon emissions from the country’s livestock industry. Wang et al. (2012) analyzed the GHG emissions of large-scale dairy farms in the suburbs of Xi’an using the life cycle assessment method combined with the current situation of dairy farming [13]. Based on the perspective of the whole industry chain and considering the carbon sink system, Li et al. (2022) used the life cycle method to measure the carbon emissions of the dairy industry and designed a high-quality forage-diet emission reduction scenario [14].
Scholars have conducted relevant studies to further explore the factors influencing carbon emissions. Zou et al. (2016) constructed a restricted Tobit random effects panel model to analyze the influencing factors affecting the environmental efficiency of the livestock industry, considering four factors: the level of economic development, the industrial structure, the education level of the labor force, and the amount of livestock and poultry raised [15]. Yao et al. (2017) used the Log Mean Divisia Index Method to divide the causes affecting carbon emissions from livestock industry into five major factors: livestock production efficiency, agricultural production restructuring, agricultural production returns per unit of agricultural population, urbanization, and total population growth, revealing the driving effects of carbon emissions from livestock industry at the time and space levels [16]. Kong et al. (2016) used a fixed effects model to analyze the effects of seven factors, namely pork consumption, industrial structure, foreign trade level, road density, rural labor price, government regulation, and energy use efficiency, on carbon emissions from the hog industry in Jiangxi Province [17]. The existing literature provides an important reference for this study, but there are still shortcomings. Most existing studies focus on gastrointestinal fermentation and manure management, which account for a large proportion of carbon emissions in the beef cattle industry. However, the carbon emissions from feed grain production and transportation, beef cattle feeding, and beef processing in the beef industry are neglected. In addition, most existing studies focus on the influence mechanism of economic development, industrial structure, labor efficiency, urbanization level, and other factors on carbon emissions and lack the structural characteristics that accurately portray the spatial correlation of carbon emissions in the beef cattle industry.
Therefore, this paper attempts to answer the question of how carbon emissions from the Chinese beef cattle industry have changed over the study period. Further, the results of the empirical study were used to identify how the level of economic development, the scale of beef cattle breeding, the degree of mechanization, the intensity of environmental pollution control, the education level of breeders, the level of breeding expertise, the urban–rural income gap, and the dependence on beef imports affect the carbon emissions of the beef cattle industry. To make up for the existing research, this article adopts a method suitable for the research idea of the article, uses Chinese provincial panel data from 2008 to 2020 under the perspective of the whole industry chain, chooses the life cycle evaluation method to estimate the carbon emissions from China’s beef cattle industry from 2008 to 2020, and chooses a spatial econometric model to analyze the main factors affecting the carbon emissions of the beef cattle industry. The article is structured as follows: Section 2 introduces the material and methods involved in the study of carbon emission measurement and influence factors of the beef cattle industry. The third section presents the empirical analysis. The last section presents the research conclusions and policy recommendations.
2. Material and Methods
2.1. Material
This study used panel data from 31 provinces in China (excluding Hong Kong, Macao, and Taiwan) from 2008 to 2020. The data included the measurement of carbon emissions from the beef cattle industry and an analysis of the main factors affecting the carbon emissions of the beef cattle industry. This study had two main aspects.
- (1)
- Calculation of carbon emissions from the beef cattle industry
This study used data from the IPCC (2006) and IPCC revised version (2019) to measure the carbon emissions of the beef cattle industry more accurately, since there is no official standard animal husbandry carbon emission conversion coefficient for China. Additionally, we referenced the Guidelines for Compilation of Provincial Greenhouse Gas Inventories, published by the National Development and Reform Commission in 2011, and the existing literature to determine the carbon emission coefficient (Table 1).

Table 1.
Greenhouse gas emission coefficient of each link of the beef cattle industry.
The data on beef cattle stock and annual beef production from all provinces in China from 2008 to 2020, which are needed in the process of calculating carbon emissions, were from the China Rural Statistical Yearbook and the Statistical Bulletin of National Economic and Social Development of the People’s Republic of China. Data on the quantity of grain consumed per beef cow, the output of main products, and electricity and coal costs were obtained from the National Compilation of Agricultural Product Cost and Income Data. The coefficient needed to calculate carbon emissions has been widely referred to in the statistical yearbooks of various provinces and cities, such as the China Population and Employment Statistical Yearbook, the China Statistical Yearbook, the China Statistical Yearbook on Environment, and the statistical annual reports of China’s ecological environment.
- (2)
- Factors influencing carbon emissions in the beef cattle industry
The index calculation process of the selected data came from the statistical yearbooks of provinces and cities, as well as the Chinese population and employment statistics yearbooks, such as the China Statistical Yearbook, the China Statistical Yearbook on Environment, the China Ecological Environment Statistical Yearbook, the China Animal Husbandry and Veterinary Yearbook, and the China Rural Statistical Yearbook.
2.2. Carbon Emission Calculation of Beef Cattle Industry
Compared with other livestock species in the animal industry, beef cattle have a longer production cycle and feed is mixed for daily feeding [24]. This study adopted a life cycle approach to improve the accuracy of the measurement results and to account for the carbon footprint from the perspective of the whole industrial chain of beef cattle, based on the definition of system boundaries (Figure 1). The beef cattle industry was divided into three links: front-end planting, middle-end breeding, and back-end processing. The carbon emissions from the beef cattle industry were measured according to the main emission segments: feed grain planting, feed grain transportation and processing, beef cattle gastrointestinal fermentation, manure management system, beef cattle feeding energy consumption, and beef product processing. The carbon emissions from each link were calculated separately and the total carbon emissions of the beef cattle industry were summarized. The GHG emitted from the beef cattle industry mainly include CO2, CH4, and N2O; all GHG emissions were converted into CO2-eq according to the global warming potential (GWP) in this study.
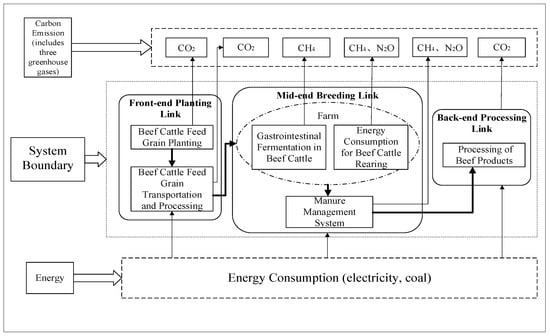
Figure 1.
Main sources and system boundaries of carbon emissions in the beef cattle industry.
2.2.1. Front-End Planting Link
(1) Feed grain cultivation: The feed for beef cattle includes roughage and concentrates. The main components of the concentrate are corn, soybean meal, bran, and minerals. The forage is mainly composed of corn silage and straw. Since soybean meal and bran in the concentrated feed are by-products of soybean and wheat, they are formed after the first processing. The mineral content in the concentrated feed was low and the carbon emissions were very low. The carbon emissions from corn cultivation in the feed were calculated as follows:
where is the CO2 emissions from the beef cattle feed grain planting process; is the annual beef output (unit: ton); is the grain consumption coefficient of the unit beef product, that is, the amount of grain consumed per beef cattle and the output of the main products ratio (unit: kg/kg); is the proportion of u-type grains in the beef cattle feed formula (the composition of the mixed concentrate was calculated according to 70% corn, 20% oil cake fodder, 5% bran, and 5% minerals [23]); is the CO2 emission coefficient in the process of u-type grain planting.
(2) Feed grain transportation and processing: Harvested raw feed materials such as corn, soybeans, and wheat are processed into feed for feeding beef cattle after a series of steps, such as transportation, cleaning, crushing, batching, mixing, and pelleting. The GHG emissions from the energy consumed during these processes are calculated as follows:
where is the CO2 emissions from the transportation and processing of beef cattle feed grain; is the annual beef output (ton); is the grain consumption coefficient of the unit beef product (unit: kg/kg); is the beef cattle feed (the proportion of u-type grains in the formula, including corn, soybean, and wheat); is the CO2 emission coefficient during the transportation and processing of u-type grains; is the distribution coefficient of u-type grains. Soybean meal and wheat bran are the only by-products of soybean and wheat production, respectively. Therefore, the GHG emissions of soybean and wheat during transportation and processing should be allocated to soybean meal and wheat bran, according to the emission distribution coefficient. The distribution coefficients of soybean and wheat were 0.6 and 0.1. Corn does not need to be allocated and has a coefficient of 1.
2.2.2. Mid-End Breeding Link
(1) Gastrointestinal fermentation in beef cattle: the intestines of livestock and poultry function under anaerobic conditions; beef cattle are ruminants and their rumen fermentation produces a large amount of CH4 gas, which is the main source of CH4 accumulation.
where is the CH4 emission produced by the gastrointestinal fermentation of beef cattle and is the average annual feeding amount of beef cattle. Because the feeding period of beef cattle is greater than or equal to one year, the amount of beef cattle in stock at the end of the year is the average annual feeding amount (unit: head); is the CH4 emission coefficient of beef cattle gastrointestinal fermentation; is the CH4 global warming potential.
(2) Manure management systems: The accumulated CH4 emissions from this process come from the degradation of beef cattle manure under anaerobic conditions to produce CH4 gas and the CH4 that is released during the management and storage of the manure. Simultaneously, the nitrogen contained in the feces undergoes nitrification and denitrification and the nitrogen contained in the protein in the feces is converted into N2O gas. The calculation of carbon emissions from the manure management system of the beef cattle industry consists of two steps.
where are the CH4 and N2O emissions generated by the manure management system, respectively; is the average annual feeding amount of beef cattle (unit: head); are the manure management system’s CH4 and N2O emission factors; is the CH4 global warming potential; is the N2O global warming potential.
(3) Energy consumption for beef cattle rearing: During the process of beef cattle breeding, a large amount of electricity, coal, and other energy sources will be consumed to: ventilate and dissipate heat when the temperature is high; prevent cold in the barn when the temperature is low; maintain the operation of daily manure treatment, automatic feeding, and other processes. This directly or indirectly increases carbon dioxide emissions.
where is the CO2 emissions from the energy consumption link of beef cattle feeding; is the annual average feeding volume of beef cattle (unit: head); are the electricity and coal consumption per head of beef cattle (unit: CNY/head); and are the unit price of electricity and coal cost for beef cattle raising, respectively; are electricity consumption and coal combustion, respectively, CO2 emission factor.
2.2.3. Back-End Processing Link
Processing of beef products: Beef cattle are transported from farms to slaughterhouses and must be processed into beef products through sterilization, packaging, and other processes before they can be sold in the market as commodities. The CO2 consumed in this process is calculated as follows.
where is the CO2 emissions from the processing of beef products; is the annual output of beef (unit: ton); is the energy consumption coefficient per unit of beef product processing; is the heat energy generated by consuming one kilowatt-hour of electricity; is the CO2 emission factor from electricity consumption.
2.2.4. Summary of Carbon Emissions of Beef Cattle Industry
According to the life cycle approach, the formula for calculating the total carbon emissions of the beef cattle industry is
where is the total carbon emission of the beef cattle industry (unit: ton CO2 equivalent); are: the beef cattle feed grain planting process, beef cattle feed grain transportation and processing, beef cattle gastrointestinal fermentation, manure management system, beef cattle feeding energy consumption, and carbon emissions from beef product processing (unit: ton CO2 equivalent); is CH4 global warming potential value, 21; is the N2O global warming potential value, 310.
2.3. Influencing Factors’ Analysis of Carbon Emission in the Beef Cattle Industry
2.3.1. Exploratory Spatial Data Analysis
This method is a model that explains the spatial dependence, spatial correlation, or spatial correlation related to the spatial location and to test the distribution state. It mainly includes two types of tests: a test of global spatial autocorrelation and a test of local spatial correlation. In this study, an exploratory spatial data analysis method that included the Moran index and the Moran scatter plot was used to test and analyze the carbon emissions of various provinces and cities in China’s beef cattle industry.
2.3.2. Spatial Durbin Model
Spatial econometrics mainly include three forms: the spatial Durbin model (SDM), the spatial lag model (SLM), and the spatial error model (SEM). There were clear spatial interaction effects between the three models. The SAE focuses on the existence of spatial spillover effects of variables in a certain region, whereas the main research content of the SEM is the influence of various factors in adjacent regions. Because SDM can conduct a good investigation of both endogenous and exogenous interaction effects and can obtain unbiased coefficients, this study mainly focuses on the application of SDM. The basic form of this equation is as follows:
where is the explained variable vector; is the explanatory variable vector; is the spatial weight matrix; is the spatial autoregressive coefficient; is the parameter to be estimated; is the coefficient of the exogenous interaction effect; is the residual difference term; is the influence of the explanatory variable in the region on the explained variable; is the spatial lag term, reflecting the influence of the explained variable in the neighboring region on the explained variable in the region; is the explanatory variable in the neighboring region. When = , it is the SEM; when = 0, it is the SLM.
3. Results and Analysis
3.1. Spatial and Temporal Characteristics of Carbon Emissions from the Beef Cattle Industry
3.1.1. Time Characteristics
From the perspective of total emissions (Figure 2) from 2008 to 2020, the total carbon emissions from the beef cattle industry across the country experienced a three-stage change process of “fluctuation rising–slight decline–recovery to growth”.
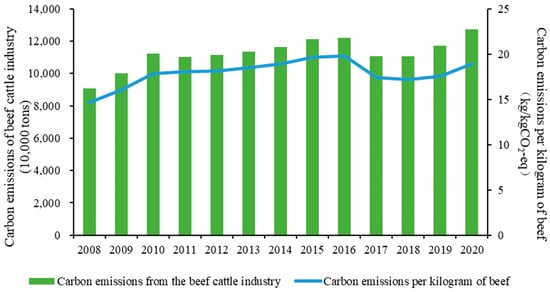
Figure 2.
Trend of carbon emissions from the national beef cattle industry from 2008 to 2020.
(1) During the fluctuating and rising stages (2008–2015), the carbon emissions of the beef cattle industry increased from 90.626 million tons to 121.0658 million tons, an increase of 33.59%. Driven by the rapid growth of the national economy, the consumption structure of livestock products for urban and rural residents has developed, resulting in an increase in the consumption of protein-rich livestock products. This rapidly increasing demand has driven the continuous expansion of the beef cattle breeding industry, causing the total carbon emissions of the national beef cattle industry to show an increasing trend during this period.
(2) During the slight decline stage (2016–2018), carbon emissions from the beef cattle industry decreased from 122.0353 million tons to 110.7951 million tons, a decrease of 9.21%. The rapid development of animal husbandry during the previous stage may have caused this decline. Uncontrolled grazing affects the development of grasslands, damaging them, and disrupting the balance between grass and livestock. Therefore, to protect the development of grasslands, the feeding amount of grass-fed livestock has been reduced, resulting in a substantial reduction in carbon emissions from the gastrointestinal and manure management systems of beef cattle.
(3) In the recovery growth stage (2019–2020), carbon emissions from the beef cattle industry in the country increased from 116.9789 million tons to 127.0831 million tons, an increase of 8.64%. Affected by the African swine fever epidemic of 2019, consumers abandoned pork consumption during this stage. The switch to beef and other meats increased beef demand, beef cattle inventory, and beef production, causing increased carbon emissions. In addition, farmers’ non-agricultural income has gradually become the main source of household income; therefore, the daily demand for animal products has increased.
The change in carbon emissions per kilogram of beef from 2008 to 2020 is consistent with the fluctuation of carbon emissions from the beef cattle industry, showing a change process of “fluctuation increased–slightly decreased–somewhat rebounded”. From 2008 to 2015, carbon emissions per kilogram of beef increased from 14.67 kg/kgCO2-eq to 19.62 kg/kgCO2-eq, an increase of 33.76%; from 2016 to 2018, carbon emissions per kilogram of beef decreased from 19.78 kg/kgCO2-eq; from 2019 to 2020, the carbon emission per kilogram of beef increased from 17.53 kg/kgCO2-eq to 18.90 kg/kgCO2-eq, a year-on-year increase of 7.81%.
3.1.2. Spatial Feature
Table 2 shows the total carbon emissions and emission intensity of the beef cattle industry in each province of the country in 2008 and 2020. In 2020, the top five provinces in terms of carbon emissions from the beef cattle industry were Yunnan, Qinghai, Inner Mongolia, Sichuan, and Tibet; all exceeded 8 million tons, accounting for 38.3% of the total national carbon emissions of the beef cattle industry. The five provinces with the lowest carbon emissions were Fujian, Jiangsu, Zhejiang, Beijing, and Shanghai, with cumulative carbon emissions accounting for only 0.63% of the national total [25,26]. Compared with 2008, nine provinces showed a decreasing trend in carbon emissions from beef cattle in 2020. Henan Province had the largest decrease of 58.01%, followed by Guangxi and Shandong provinces, with decreases of 64.55% and 34.33%, respectively. In contrast, 22 provinces had increased carbon emissions from beef cattle in 2020 compared with 2008. Yunnan Province had the largest increase in carbon emissions with an increase of 55.52%, followed by Hunan and Guizhou provinces. Compared with 2008, the carbon emission intensity of the beef cattle industry across the country changed significantly in 2020, showing the characteristics of “high in the north and low in the south” and “high in the west and low in the east”. Provinces with high carbon emission intensity from the beef cattle industry were mostly located in the northeast and western regions. Among them, the carbon emission intensity of the Xinjiang beef cattle industry was the highest, with an intensity of 1.435 tons per CNY 10,000, while that of Shanghai was the lowest, with only 0.05 tons per CNY 10,000, a difference of nearly 29 times.
Table 2.
Total carbon emissions and intensity of the beef cattle industry in 31 provinces (autonomous regions and municipalities) in China in 2008 and 2020.
The elliptical spatial distribution of carbon emissions and the trend of the center of gravity movement in China’s beef cattle industry for 2008, 2012, 2016, and 2020 were plotted using ArcGIS 10.2 software to study the spatial evolution trend of carbon emissions in China’s beef cattle industry more accurately [27]. As shown in Figure 3 and Table 3, the center of gravity of the carbon emission ellipse of China’s beef cattle industry from 2008 to 2020 moved between 109°7′50″–107°1′31″ E and 34°57′2″–34°57′23″ N at each characteristic time point. Compared with the geometric center of China (103° E, 36° N), the center of gravity shifted to the southeast, indicating that the carbon emissions of the beef cattle industry in the eastern and southern regions of China are on average higher than those in the western and northern regions. The turning angle θ shows a gradually increasing trend, but the change is small, indicating that the direction of carbon emission dispersion in China is relatively stable. In terms of the length of the half-axis, the length of the long half-axis shrank from 1460.14 km in 2008 to 1420.85 km in 2020, and the length of the short half-axis expanded from 905.12 km in 2008 to 1043.07 km in 2020, indicating that the carbon emissions from the beef cattle industry in China’s provincial units show a centralized concentration in the northeast-southwest direction and a dispersion in the northwest-southeast direction. The southeast direction shows a trend of dispersion. As seen from Table 3, the center of gravity of the standard deviation ellipse in 2020 was located in the southwest direction in 2008, and the distance of the center of gravity movement increases year by year. The center of gravity of the ellipse from 2008 to 2012 moved in the southeast direction, with a distance of 10,159 m and a speed of 2539.75 m/a; the center of gravity of the ellipse from 2012 to 2016 moved in the southwest direction, and the distance of movement increased. The elliptical center of gravity moved to the northwest from 2016 to 2020, with a distance of 173,296 m and a speed of 43,324 m/a. The distance and speed of the elliptical center of gravity of carbon emissions in the beef cattle industry show a trend of increasing yearly, which can reflect the degree of variation in the development of carbon emissions in the beef cattle industry in China. From 2008 to 2012, the carbon emission development of China’s beef cattle industry tended to be in the southeast, which laterally indicates that the carbon emissions from beef cattle raised in the southeast are higher than those in the northwest, the economic growth in the southeast coastal region is higher than that in the northwest inland provinces, and a higher consumption level will increase the consumption of meat products, especially beef. From 2012 to 2020, the carbon emission development of China’s beef cattle industry tended to be in the western and northern regions, possibly due to factors such as abundant natural forage resources, labor quality, and comparative advantages of animal husbandry in northwestern China. To further determine the causes of the differences in carbon emissions between the geographic regions in China’s beef cattle industry, research is needed to determine which specific factors influence the changes in carbon emissions.
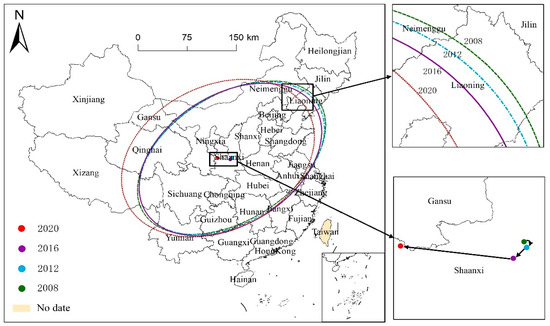
Figure 3.
Transfer path of carbon emissions from the national beef cattle industry from 2008 to 2020.
Table 3.
Elliptical shift parameters of carbon emission standard deviation of the Chinese beef cattle industry.
Plan approval number: GS (2019) No. 1822 (produced by the Ministry of Natural Resources); the base map has not been modified; data from Hong Kong, Macao, and Taiwan are not included.
3.1.3. Structural Feature
Table 4 shows the total carbon emissions of China’s beef cattle industry, the emissions of each link, and their share of the total carbon emissions from 2008 to 2020. PCP, PGP, PEF, PMM, PDH, and PMP represent the carbon emissions generated from six major segments: beef cattle feed grain cultivation, beef cattle feed grain transportation and processing, beef cattle gastrointestinal fermentation, manure management system, beef cattle feeding energy consumption, and beef product processing, respectively. Gastrointestinal fermentation and manure management of beef cattle contributed more carbon emissions during the study period, accounting for about 69% and 18% of the total carbon emissions of the beef cattle industry, respectively. The annual growth rates of all six segments of carbon emissions in the beef cattle industry were positive; therefore, the total carbon emissions of the industry showed a fluctuating upward trend. Among them, the average annual growth rate of carbon emissions of the beef cattle feed grain transportation and processing link, the beef cattle gastrointestinal fermentation link, and the manure management system link were 3.56%, 3.22%, and 3.22%, respectively.
Table 4.
Carbon emissions in each link of the beef cattle industry from 2008 to 2020 (Unit: 10,000 tons CO2-eq).
As shown in Figure 4, the gastrointestinal fermentation link and the manure management link of beef cattle are the two highest carbon emission links, followed by the beef cattle feed grain growing link, the beef cattle feeding energy consumption link, and the beef cattle feed grain transportation and processing link. The beef product processing link had the smallest emission. Therefore, it is necessary to pay special attention to carbon emissions from the physiological emissions of beef cattle, to optimize manure storage methods, to reasonably change feed structure, and to improve diet digestibility.
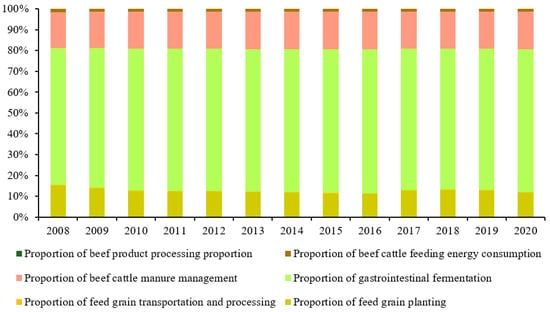
Figure 4.
The proportion of carbon emissions in each link of the national beef cattle industry from 2008 to 2020.
3.2. Influencing Factors of Carbon Emissions in the Beef Cattle Industry and its Spatial Spillover Effect
3.2.1. Spatial Correlation Test
- (1)
- Global autocorrelation test
As indicated by the changes of Moran’s I values, there is a significant positive spatial correlation between carbon dioxide emissions from the beef cattle industry in all provinces in China from 2008to 2020 (Table 5), indicating that carbon emissions from the beef cattle industry in all provinces in China show high- or low-spatial clustering. Provinces surrounding provinces with high carbon emissions also had high carbon emissions, and the provinces with low carbon emissions had neighboring provinces with low carbon emissions. The global Moran’s I index steadily increases from 0.221 in 2008 to 0.47 in 2020, further indicating that the spatial autocorrelation of carbon emissions in the beef cattle industry showed a significant and substantial increase. However, the global Moran’s I index cannot show the specific provinces and regions in which the geographic clustering of high (or low) observed values of carbon emissions occurs, and cannot portray the local geographic clustering and local spatial autocorrelation characteristics of carbon emissions from the provincial beef cattle industry. Therefore, the following Moran scatter plots for 2008, 2012, 2016, and 2020 are used to further explain the local spatial autocorrelation of carbon emissions from the provincial beef cattle industry and find high–high and low–low clustering areas.
Table 5.
Global autocorrelation Moran’s I index and test value of carbon emissions of the beef cattle industry in China from 2008 to 2020.
- (2)
- Local autocorrelation tests
To analyze the spatial distribution pattern of carbon emissions from the beef cattle industry in each province of China, Moran scatter plots for 2008, 2012, 2016, and 2020 were compared and analyzed (Figure 5). The provinces in the first quadrant of the Moran scatter diagram have high carbon emissions from the beef cattle industry and the carbon emissions from neighboring provinces are also high. This is a high–high aggregation region (H-H). The second quadrant indicates that the carbon emissions from the beef cattle industry in this region are lower than those from other neighboring provinces, which is a low–high aggregation region (L-H). The third quadrant indicates that the carbon emissions from the provinces in this region and other neighboring provinces are both low, which is a low–low aggregation region (L-L). The fourth quadrant of the Moran scatter diagram indicates that the carbon emissions of the cattle industry in this region are higher than those of other neighboring provinces, which is a high–low aggregation region (H-L).
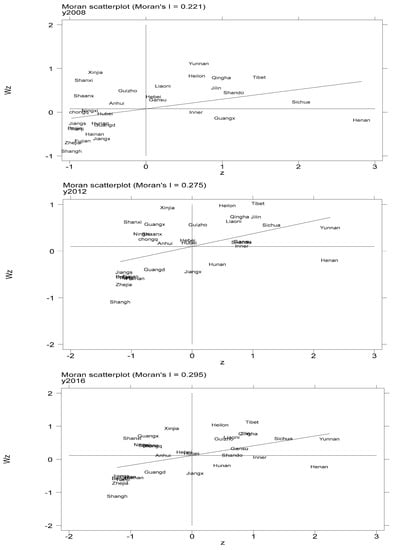
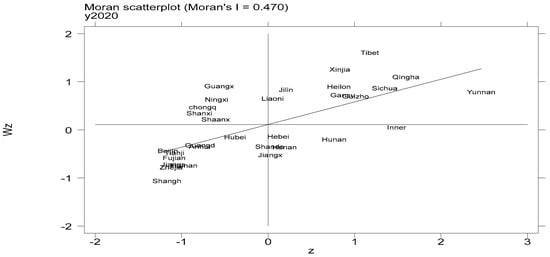
Figure 5.
Moran’s I index scatter plots of carbon emissions in each province (autonomous region and municipality) of China’s beef cattle industry in 2008, 2012, 2016, and 2020.
From 2008 to 2020, the spatial agglomeration characteristics of carbon emissions from the beef cattle industry in all the provinces remained stable. In 2008, 2012, 2016, and 2020, the proportion of provinces in the H-H and L-L quadrants accounted for 77.42%, 58.06%, 58.06%, and 64.52%, respectively (Table 6). Liaoning, Heilongjiang, Jilin, Gansu, Qinghai, and Tibet were in the first quadrant in the Moran scatter plots in 2008, 2012, 2016, and 2020, indicating that the H-H aggregation areas were mainly distributed in the northwest and northeast regions. Beijing, Tianjin, Shanghai, Hainan, Jiangsu, Zhejiang, Fujian, and Guangdong were always in the third quadrant, indicating that low-aggregation areas were distributed close to the eastern and southern coastal areas. Compared with other neighboring provinces, the carbon emissions of the beef cattle industry in cities were lower. These provinces and cities have the characteristics of a relatively developed economy, a high level of urbanization, a large degree of openness to the outside world, and a relatively dense population, which have a certain impact on low carbon emissions. Moran’s scatter plots of the above four representative years further illustrate the stability of the positive spatial correlation of carbon emissions from the beef cattle industry in various provinces.
Table 6.
Provincial distribution of carbon emissions from the beef cattle industry in Moran’s scatter plots.
3.2.2. Variable Selection
Based on the data availability, this study selected the panel data of 31 provinces in the country from 2008 to 2020 as the sample space and the carbon emissions of the beef cattle industry as the explained variable. This study examined the carbon emissions of the beef cattle industry in terms of the level of economic development, the scale of beef cattle breeding, the degree of mechanization, the intensity of environmental pollution control, the level of education of breeders, the level of breeding expertise, the income gap between urban and rural areas, and the dependence on beef imports. The specific calculation methods and data sources for each indicator are presented in Table 7.
Table 7.
Influencing factors of carbon emissions in the beef cattle industry.
3.2.3. Empirical Analysis of the Durbin Model
During the study period, the Moran’s I value of carbon emissions from China’s beef cattle industry passed the significance test at the 1% level and there was a significant spatial correlation of carbon emissions. Based on this, a spatial econometric model was used in this study. First, the Hausman test found that all factors affecting carbon emissions from the beef cattle industry passed the 1% significance level test, which means that the data in this study are suitable for a fixed benefit model. Secondly, according to the lag model (LM) test results, the LM error, LM lag, R-LM error, and R-LM lag were positive and passed the 1% significance level test; that is, the tests confirmed the auto-correlation in the residual space estimated by the model. Finally, the LR and Wald tests revealed that the LR spatial error, the LR spatial lag, the Wald spatial error, and the Wald spatial lag all passed the 1% significance level test (Table 8), indicating that the spatial Durbin model (SDM) is more suitable for this study than the spatial lag model (SLM) or the spatial error model (SEM).
Table 8.
The results of the spatial panel econometric model test.
Table 9 reports the estimation results of the three fixed effects models of the Durbin model (SDM) of the factors influencing the carbon emissions from China’s beef cattle industry under the adjacency matrix. The estimated values of the spatial autoregressive coefficients ρ in the individual fixed effects model, the time fixed effects model, and the dual fixed effects model all passed the significance test. By comparing each model’s coefficients of determination (R-sq), the goodness of fit is higher for the time fixed effects model and lower for the individual fixed effects model and the dual fixed effects models.
Table 9.
Regression results of the spatial Durbin model.
The estimation results of the spatial Durbin model with time fixed effects show that import dependence did not pass the 10% significance level test. The elasticity coefficients of the level of economic development, the degree of scale of beef cattle breeding, the degree of mechanization, the strength of environmental protection, the education level of breeders, the level of breeding expertise, and the urban–rural income gap on carbon emissions of the beef cattle industry were −0.002, 0.233, 20.617, −9015.956, −127.382, 85.829, and 243.644, respectively, all of which passed the 10% significance test. This shows that an increase in the economic development, a greater investment in environmental protection, and a high level of education of breeders will suppress carbon emissions to some extent. With the continuous improvement of the economic development level in each province, sufficient funds are gradually accumulated in the beef cattle industry, thus promoting the improvement of beef cattle breeds and the optimization of industrial structure layout, which, to some extent, suppresses the carbon emission of the beef cattle industry. The general improvement in education will promote the cultural literacy of beef cattle farmers, who will be more familiar with environmental protection and low-carbon awareness and will apply such ideas to the actual beef cattle breeding process, thus reducing the carbon emissions of the beef cattle industry. The expansion of the scale of beef cattle breeding, the improvement in mechanization, the improvement in the level of breeding expertise, and the widening of the income gap between urban and rural areas will promote the generation of carbon emissions. It may be that an increase in the scale of the beef cattle breeding process will generate more waste in a short period, which will put more pressure on the environment to dissipate, thus increasing carbon emissions. The increase in mechanization input, due to the introduction of machinery not adapted to local farming conditions, coupled with the lack of local machinery innovation level and the consumption of diesel and fossil fuels during the use of machinery prompted an increase in carbon emissions. Second, the income gap between urban and rural areas has increased, the young and strong labor force with higher literacy has entered cities and towns to work, and those engaged in beef cattle breeding are mostly older and less-educated middle-aged and elderly, with slower learning abilities, lower efficiency of beef cattle breeding, and increased carbon emissions.
3.2.4. Empirical Analysis of Spatial Spillover Effects
As can be seen from Table 10, the indirect effect coefficients of the level of economic development, the degree of scale of beef cattle breeding, the degree of education of breeders, and the beef import dependence are −0.004, −0.049, −110.856, and 256.434, respectively, all of which pass the significance test at the 10% level. The improvement in the economic development level will reduce carbon emissions from beef cattle in the neighboring provinces. Rapid economic development will promote the continuous optimization of breed structure and industrial layout of beef cattle breeding and improve the utilization of resource efficiency, which will lead to the high-quality development of the beef cattle industry in the neighboring provinces and the reduction of carbon emissions. The education level of breeders has a negative spillover effect on carbon emissions in the neighboring provinces, probably considering that the overall improvement in education level will promote stronger communication and learning with the surrounding neighboring areas and drive the application of low-carbon breeding technology in the neighboring areas. In addition, the increase in the scale of beef cattle breeding has a negative spillover effect on carbon emissions in neighboring areas. Acceleration the scaling process will provide scientific feeding technology and complete manure treatment facilities, which will reduce carbon emissions to a certain extent. The positive spillover effect of import dependence on neighboring provinces may be because imported beef and related products can transfer part of the carbon emissions from the breeding stage. However, it will lead to a large amount of crowding out in neighboring areas, and the carbon emissions from the beef cattle breeding link will increase after crowding out.
Table 10.
Decomposition of spatial spillover effect based on the adjacency matrix.
4. Conclusions and Policy Recommendations
The main objective of this study is to measure the carbon emissions of China’s beef cattle industry and to determine the influencing factors that affect carbon emissions. Firstly, using the life cycle evaluation method, the carbon emissions of the beef cattle industry were measured and its spatial characteristics were analyzed from the perspective of the entire industrial chain, dividing the beef cattle industry into front-end breeding, middle-end cultivation, and back-end processing. Second, the factors affecting the carbon emissions from China’s beef cattle industry were analyzed by constructing a spatial econometric model test. The findings of the study verified the previous research hypothesis. Carbon emissions from the beef cattle industry in China during the study period experienced three stages from 2008 to 2020: fluctuating rise (2008–2015), slight decline (2016–2018), and recovery growth (2019–2020). Beef cattle gastrointestinal fermentation and excrement management system were responsible for 69% and 18% of the total industry carbon emissions, respectively. In exploring the factors influencing the carbon emissions of China’s beef cattle industry, we found that faster economic development in the region, greater investment in environmental protection, and higher education levels of beef cattle breeders would slow the release of carbon emissions from the beef cattle industry. In addition, this study finds that the carbon emissions from China’s beef cattle industry are influenced by spatial units with strong spatial correlation, along with the flow of production factors between regions, economic development interactions, and expansion of inter-regional trade. The development of the beef cattle industry in this province will have a positive or negative spillover effect on carbon emissions from the beef cattle industry in the surrounding provinces.
First of all, the current beef consumption market in China is still robust and there is still a large gap between beef supply and demand. In the context of global low-carbon emission reduction, the beef cattle industry should achieve carbon emission reduction while taking industrial development as a prerequisite, so it is recommended that the government formulate carbon emission reduction policies with the objective of healthy industrial development [28]. Secondly, for the gastrointestinal fermentation link and the manure management link of the beef cattle industry, which produces more carbon dioxide and methane, the investment in environmental pollution prevention and control should be continuously increased and environmental treatment funds should be included in the financial budget to ensure the use of funds. The motivation for the normalized and clean tube production of livestock and poultry breeding should be stimulated in the form of subsidies, special funds should be invested in the treatment of livestock and poultry manure, and efforts should be made to fight the hard battle of pollution prevention and control [29,30]. Thirdly, the environmental resources and carrying capacity of beef cattle breeding areas in each province should be fully considered and high-quality development of animal husbandry should be the main line to scientifically plan the layout of beef cattle breeding, to adhere to the development concept of “grass for livestock”, and to accelerate the combination of breeding and rearing. In view of the impact of carbon emissions from the beef cattle industry between neighboring provinces, we suggest that provinces with low carbon emissions should play a leading role in reducing carbon emissions. These provinces could establish low-carbon beef cattle breeding demonstration areas to promote imitation and learning of beef cattle breeding in neighboring provinces through talent exchange, experiential learning, and low-carbon technology promotion, thus playing a positive driving role.
In this study, spatial factors are taken into account when analyzing the factors influencing the carbon emissions of China’s beef cattle industry, as well as the level of economic development, the degree of scale of beef cattle breeding, the degree of mechanization, the strength of environmental pollution control, the education level of breeders, the level of breeding expertise, the urban–rural income gap, and the dependence on beef imports. However, various factors affect the actual carbon emissions of the beef cattle industry in each province of China and complex links exist between the influencing factors. Therefore, in future research, it is necessary to analyze the carbon emissions of the beef cattle industry and the influencing factors in different regions and farming modes more carefully, and to deeply explore the interaction mechanism of each influencing factor.
Author Contributions
Conceptualization, Y.S.; methodology, Y.S. and C.Y.; software, Y.S.; validation, Y.S.; formal analysis, Y.S.; investigation, Y.S. and X.X.; resources, Y.S.; data curation, Y.S. and X.L.; writing—original draft preparation, Y.S.; writing—review and editing, Y.S., C.Y. and X.X.; visualization, Y.S. and X.L.; supervision, C.Y. and M.W.; project administration, C.Y.; funding acquisition, C.Y. and M.W. All authors have read and agreed to the published version of the manuscript.
Funding
This research was funded by the National Natural Science Foundation (72033009), Science and Technology Innovation Project of Chinese Academy of Agricultural Sciences (ASTIP-IAED-2022-01), Animal Husbandry Economic Research Fund of National Animal Husbandry Station (MYJJ2022-1).
Institutional Review Board Statement
Not applicable.
Informed Consent Statement
Not applicable.
Data Availability Statement
The data used to support the findings of this study are available from the corresponding author upon reasonable request.
Conflicts of Interest
The authors declare no conflict of interest.
References
- Food and Agriculture Organization of the United Nations (FAO). World Agriculture: Towards 2030/2050; Interim Report: Rome, Italy, 2006. [Google Scholar]
- Panchasara, H.V.; Samrat, N.H.; Islam, N. Greenhouse Gas Emissions Trends and Mitigation Measures in Australian Agriculture Sector—A Review. Agriculture 2021, 11, 85. [Google Scholar] [CrossRef]
- Steinfeld, H.; Hann, O.; Black Burn, H. Livestock-Environment Interactions, Issues and Options; Food and Agriculture Organization of United Nations: Québec, QC, Canada, 2013. [Google Scholar]
- Musa, A.A. Contribution of Livestock Production to Global Greenhouse Gas Emission and Mitigation Strategies. J. Zool. Res. 2020, 1, 3. [Google Scholar] [CrossRef]
- Prasad, J.R.; Sourie, J.S.; Cherukuri, V.; Fita, L.; Merera, E.C. Global Warming: Genesis, Facts and Impacts on Livestock Farming and Mitigation Strategies. Int. J. Agric. Innov. Res. 2015, 3, 1595–1604. [Google Scholar]
- Lesschen, J.P.; van den Berg, M.V.; Westhoek, H.J.; Witzke, H.P.; Oenema, O. Greenhouse gas emission profiles of European livestock sectors. Anim. Feed. Sci. Technol. 2011, 166, 16–28. [Google Scholar] [CrossRef]
- Llonch, P.; Haskell, M.J.; Dewhurst, R.J.; Turner, S.P. Current available strategies to mitigate greenhouse gas emissions in livestock systems: An animal welfare perspective. Anim. Int. J. Anim. Biosci. 2017, 11, 274–284. [Google Scholar] [CrossRef]
- Mogensen, L.; Kristensen, T.; Nielsen, N.; Spleth, P.; Henriksson, M.; Swensson, C.; Hessle, A.; Vestergaard, M. Greenhouse gas emissions from beef production systems in Denmark and Sweden. Livest. Sci. 2015, 174, 126–143. [Google Scholar] [CrossRef]
- Alemu, A.W.; Janzen, H.H.; Little, S.M.; Hao, X.; Thompson, D.J.; Baron, V.S.; Iwaasa, A.D.; Beauchemin, K.A.; Kröbel, R. Assessment of grazing management on farm greenhouse gas intensity of beef production systems in the Canadian Prairies using life cycle assessment. Agric. Syst. 2017, 158, 1–13. [Google Scholar] [CrossRef]
- Gao, Z.; Lin, Z.; Yang, Y.; Ma, W.; Liao, W.; Li, J.; Cao, Y.; Roelcke, M. Greenhouse gas emissions from the enteric fermentation and manure storage of dairy and beef cattle in China during 1961–2010. Environ. Res. 2014, 135, 111–119. [Google Scholar] [CrossRef]
- Baek, C.; Lee, K.; Park, K. Quantification and control of the greenhouse gas emissions from a dairy cow system. J. Clean. Prod. 2014, 70, 50–60. [Google Scholar] [CrossRef]
- Kanemoto, K.; Moran, D.D.; Lenzen, M.; Geschke, A. International trade undermines national emission reduction targets: New evidence from air pollution. Glob. Environ. Chang.-Hum. Policy Dimens. 2014, 24, 52–59. [Google Scholar] [CrossRef]
- Wang, X.Q.; Liang, D.L.; Wang, X.D.; Peng, S.; Zheng, J.Z. Using life cycle assessment method to assess greenhouse gas emissions from dairy farming systems. Chin. J. Agric. Eng. 2012, 28, 179–184. [Google Scholar]
- Li, T.Y.; Xiong, H.; Wang, M.L. How to develop my country’s dairy industry under the “double carbon” goal: A study on the carbon emissions of dairy industry from the perspective of the whole industry chain. Agric. Econ. Issues 2022, 2, 17–29. [Google Scholar]
- Zou, J.; Xiang, C.Y. A Study on Environmental Efficiency Measurement and Influencing Factors of Animal Husbandry in Mainland China. Environ. Pollut. Prev. 2016, 38, 90–96. [Google Scholar]
- Yao, C.S.; Qian, S.S.; Mao, Y.H.; Li, Z.T. Decomposition of influencing factors and spatial differentiation of carbon emission changes in China’s livestock industry. J. Agric. Eng. 2017, 33, 10–19. [Google Scholar]
- Kong, F.B.; Wang, Z.P.; Pan, D. Spatial and temporal characteristics analysis of greenhouse gas emissions in pig industry based on LCA method--Taking Poyang Lake Ecological Economic Zone as an example. Enterp. Econ. 2016, 09, 157–163. [Google Scholar]
- Tian, Y.; Zhang, J.B. Study on the Differentiation of Net Carbon Effects of Agricultural Production in China. J. Nat. Resour. 2013, 28, 1298–1309. [Google Scholar]
- FAO. Livestock Long Shadow; FAO: Rome, Italy, 2006; pp. 97–110. [Google Scholar]
- Intergovernmental Panel on Climate Change (IPCC). 2019 Refinement to the 2006 IPCC Guidelines for National Greenhouse Gas Inventories; IPCC: Geneva, Switzerland, 2019. [Google Scholar]
- Department of Climate Change Response, National Development and Reform Commission. Guidelines for Compilation of Provincial Greenhouse Gas Inventories; China Environment Press: Beijing, China, 2011.
- Meng, X.H.; Cheng, G.Q.; Zhang, J.B.; Wang, Y.B.; Zhou, H.C. Analysis on the spatiotemporal characteristics of greenhouse gas emissions in the whole life cycle of animal husbandry in China. China Environ. Sci. 2014, 34, 2167–2176. [Google Scholar]
- Sun, Y.N.; Liu, J.J.; Ma, Z.H. Assessment of greenhouse gas emissions from large-scale dairy farms. Chin. J. Agric. Eng. 2010, 26, 296–301. [Google Scholar]
- Ma, Z.H.; Wang, M.Z.; Ding, L.Y.; Liu, J.J. Life cycle assessment of greenhouse gas emissions from large-scale beef cattle feedlots. J. Agric. Environ. Sci. 2010, 29, 2244–2252. [Google Scholar]
- Wu, G.Y.; Chen, Y.; Sun, X.J. Regional Differences, Dynamic Evolution and Convergence Analysis of Carbon Offset Rates in China’s Planting Industry. Chin. J. Ecol. Agric. 2021, 29, 1774–1785. [Google Scholar]
- Tian, Y.; Yin, H. Re-estimation of China’s agricultural carbon emissions: Basic status, dynamic evolution and spatial spillover effects. China Rural. Econ. 2022, 03, 104–127. [Google Scholar]
- Liu, H.J.; Shao, M.J.; Ji, Y.M. The spatial pattern and distribution of carbon emissions in China: An empirical study based on county carbon emissions data. Geogr. Sci. 2021, 41, 1917–1924. [Google Scholar]
- Chen, Q.H.; Zhang, Y.Y. The evolution of China’s animal husbandry carbon emission reduction policy—Based on the analysis of 452 policy texts. J. Huazhong Agric. Univ. 2022, 01, 10–23. [Google Scholar] [CrossRef]
- Tian, Y.; Lin, Z.J. Coupling coordination between China’s provincial agricultural carbon emission efficiency and economic growth. China Popul. Resour. Environ. 2022, 32, 13–22. [Google Scholar]
- Jin, S.Q.; Lin, Y.; Niu, K.Y. Driving the Green Transformation of Agriculture with Low Carbon: Characteristics of China’s Agricultural Carbon Emissions and Its Emission Reduction Path. Reform 2021, 5, 29–37. [Google Scholar]
Publisher’s Note: MDPI stays neutral with regard to jurisdictional claims in published maps and institutional affiliations. |
© 2022 by the authors. Licensee MDPI, Basel, Switzerland. This article is an open access article distributed under the terms and conditions of the Creative Commons Attribution (CC BY) license (https://creativecommons.org/licenses/by/4.0/).