Article

Dominant Fungal Communities Aggregate in the Shallow Rhizosphere Soil of Anabasis aphylla

1
Department of Forestry, Agricultural College, Shihezi University, Road of North 4th, Shihezi 832003, China
2
Department of Grass, Grassy College, Xinjiang Agricultural University, Road of No. 42 Nanchang, Shayibak District, Urumqi 830091, China
3
Department of Tourism and Geography, Science College, Shihezi University, Road of North 4th, Shihezi 832003, China
*
Authors to whom correspondence should be addressed.
Sustainability 2022, 14(22), 15423; https://doi.org/10.3390/su142215423
Submission received: 5 October 2022 / Revised: 4 November 2022 / Accepted: 17 November 2022 / Published: 20 November 2022

Abstract

:
Rhizosphere soil microorganisms are significant factors affecting plant growth, especially that of saline–alkali tolerant plants in the desert ecosystem. We performed high-throughput sequencing in order to identifying the fungal community structures and their relationships to the physicochemical properties of different soil layers for the desert plant, Anabasis aphylla, in its natural environment. The number of unique operational taxonomic units (OTUs) found in the bulk soil of the 0–20 cm layer contributed to the biggest percentage (24.13%) of the overall amount of unique OTUs. Despite the fact that there was a rather large variety of fungi in the bulk soil of A. aphylla, the number of dominating fungi, which included Ascomycota, Microascus, and Arachnomyces, was found to be in quite high abundance in the rhizosphere soil. In the 20–40 cm layer of rhizosphere soil, the phylum Ascomycota accounted for 84.78% of the total phyla identified, whereas the species Microascus and Arachnomyces accounted for 24.72% and 37.18%, respectively, of the total species identified. In terms of the soil physicochemical properties, electric conductivity was the primary environmental component influencing the dominant fungi. The findings of this research enhance our comprehension of dominant fungi distributions and relevant environmental factors affecting the saline–alkali tolerant desert plant, A. aphylla. The results also provide a theoretical basis to help elucidate fungi adaptation mechanisms to the saline–alkali environment and methods for their isolation and screening.

1. Introduction

Soil microorganisms are important for the geochemical cycle, which includes soil element cycling, organic matter decomposition, and soil mineralization, as well as the soil material cycle, and they participate in the maintenance of soil health and productivity [1]. As the main life form in soil, soil microorganisms are widely regarded as an important index by which to evaluate ecosystem health [2] and an ecosystem medium that can be used to promote the restoration of degraded land [3]. In addition, soil microorganisms are also key factors that affect plant growth, especially for saline–alkali tolerant plants in desert ecosystems [4,5]. Fungi are a significant component of the community of microorganisms that live in soil [6], and they may be classified into three groups according to the roles that they play: saprophytic, pathogenic, and mycorrhizal symbiotic [7]. Amongst these, the fungi beneficial for host plants are actively selected. Apparently, these play a significant role in maintaining the host plant’s processes and functions [8]. For example, when compared with soil bacteria, soil saprophytic fungi possess a stronger ability to decompose stubborn plant residues and are therefore pivotal drivers in the regulation of nutrient cycling [9]. Research on soil microorganisms has mainly focused on soil bacteria, and there are few reports on the community structures of soil fungi.
The rhizosphere is a dynamic and complex micro-habitat formed by interactions between plant roots and microorganisms, and is affected by root exudates and microorganisms [10]. The rhizosphere is also the first interface of the root absorption microbes which, having been deposited, root through the rhizosphere to choose a specific microbial community and thus they produce differently from the bulk soil microbial community [11]. They maintain or enhance soil health, improve plant growth, induce plant resistance for a system, and improve the adverse environmental conditions of stress tolerance [12]. The positive effects of beneficial fungi that are enriched in the rhizosphere on plant growth have been confirmed [13,14]. These fungi can not only inhibit pathogenic fungi, but also promote plant growth in various ways, including nutrient competition, and the antagonism and induction of systemic resistance [15]. However, most studies of fungi present in the rhizosphere soil have focused on the effects of stress treatments such as drought or low temperature on fungal community structures. There have only been a few of studies conducted on the fungal species compositions that exist in the rhizosphere soil of plants that exhibit high levels of tolerance to stress when placed in their natural habitat.
Soil salinization is a major challenge limiting agricultural development worldwide. Desertification, as well as soil salinization, are, for example, expanding in many ecosystems in China [16,17] and the Mediterranean basin [18,19]. During the process of long-term adaptation and evolution, plant groups growing in saline–alkali soils form unique resistance mechanisms to cope with the adverse effects. In addition to the coping mechanisms of plants themselves, rhizosphere soil microorganisms also play an important role [20]. Studies have shown that inoculation with beneficial microorganisms such as arbuscular mycorrhizal fungi in the rhizosphere of halophytes on non-halophytes can effectively alleviate the negative effects caused by saline–alkali stress, and this has a positive impact on the growth, nutrient absorption, and soil quality improvement of non-halophytes in a saline–alkali environment [20,21,22]; furthermore, this method is also safe for the environment. A. aphylla (Chenopodiaceae) is a shrub that grows in arid and semi-arid areas [23], with strong saline–alkali tolerance, drought resistance, and sand control [24]. It is mostly found in salinized soils in desert areas and is the dominant species in this harsh environment [25]. During the formation of saline–alkali desert vegetation, A. aphylla plays a major role in building communities, maintaining ecological stability, and preventing desertification and other natural disasters [26]. While the geographical distribution [24] and physiological ecology [26] of A. aphylla has been the focus of recent studies, few studies have analyzed its microbial communities [27]. Specifically, there are few reports on the fungal community structures in the rhizosphere soil of A. aphylla. Such a study in natural desert areas will help shed light on the ways by which the plant has adapted to the saline–alkali environment and also offer a conceptual underpinning for the subsequent steps of isolating and screening saline–alkali resistant fungi.
We performed high-throughput sequencing with the aim of investigating the fungal population structures in the rhizosphere, as well as the bulk soil (different soil layers) of A. aphylla in the natural environment, and their interactions with soil environmental factors. The objective of this study is to investigate the distribution of dominant fungi in A. aphylla as well as the environmental variables that influence such dissemination. The findings might give a theoretical foundation for the gathering of dominant fungi, which may aid in the improvement of microbial agents in saline–alkali soils. In this study, it is assumed that: (1) there are substantial distinctions in the fungal species structures present in rhizosphere and bulk soil; (2) the dominant fungi are mainly distributed in the 0–20 cm layer of rhizosphere soil; and (3) the main environmental factors affecting the dominant fungi are soil pH and electrical conductivity.

2. Materials and Methods

2.1. Collection of Soil Samples

A variety of soil samples were collected from the Gurbantunggut Desert in the Junggar Basin, Xinjiang, China. In this area, the average annual temperature, precipitation, and evaporation is 8 ℃, 105.3 mm, and 3545 mm, respectively. Seasons are unevenly distributed, and rainfall received in the summer season accounts for approximately 70% of the annual rainfall. Therefore, many types of drought- and salt-tolerant plants, such as Haloxylon ammodendron, Reaumuria songarica, and A. aphylla, are found in this region [26].
In October 2018, five representative plants of A. aphylla with good growth conditions and consistent height were selected in the study area (Figure S1). A one-meter-deep profile was dug at each plant sample site, and the samples of the rhizosphere and bulk soil at 0–20, 20–40, 40–60, and 60–80 cm were collected in duplicate and packed into 4 mL threaded bottles. The word “rhizosphere soil” refers to soil that is connected to the root zone, meanwhile the term “bulk soil” refers to soil that is around 15 cm away from the root zone [28]. Samples taken from the soil layer at 0–20 cm and 20–40 cm were considered to be from shallow soil, whilst samples taken from depths of 40–60 cm and 60–80 cm were considered to be from deep soil. After being collected, soil samples were sent to the laboratory in a cold storage container (an ice bag) as soon as possible. A part of each soil sample was kept at a temperature of −80 °C for the purpose of extracting genomic DNA, whilst the remainder was kept at a temperature of 25 °C for the purpose of determining its physicochemical properties.

2.2. Analysis of Physicochemical Properties of Soil

The soil water content (SWC) was measured at 105 °C utilizing the drying process (BPG-9050AH). The pH of the soil was determined by applying a pH meter (PHS-3C) after 10 g of fresh soil and 25 milliliters of distilled water were mixed together and agitated at a temperature of 25 °C for thirty minutes. A device referred to as an electrical conductivity meter (DDS-307A) was used in order to determine the electric conductivity (EC) of the soil. The alkali hydrolysis diffusion technique was used in order to ascertain the available nitrogen (AN) level in the soil. The available phosphorus (AP) level of the soil was quantified through the application of a visible spectrophotometer (752UV) using the 0.5 mol/L NaHCO3-molybdenum-antimony resistance colorimetric method. The concentration of the available potassium (AK) in the soil was determined using an NH4Ac flame photometer (FP6400).

2.3. DNA Extraction and High-Throughput Sequencing of the ITS1-5F Region

Samples of soil were treated with either cetyltrimethylammonium bromide (CTAB) or sodium dodecyl sulfate (SDS) for the aim of obtaining the total genomic DNA. The CTAB lysate (1000 μL), lysozyme, and soil sample were placed in a 2.0 mL tube and incubated in a water bath at 65 °C. The tubes were mixed several times by an upside-down motion during the incubation period. On 1% agarose gels, the DNA concentration and the DNA’s purity were analyzed. The DNA extracts were mixed with sterile water in order to achieve a concentration of 1 ng/L. For the purpose of amplification of the ITS1-5F region, the following specific primers with barcodes were utilized: ITS5-1737F (5′-GGAAGTAAAAGTCGTAACAAGG-3′) and ITS2-2043R (5′-GCTGCGTCTTCATCGATGC-3′). The amplification products were then examined on 2% agarose gels after being combined with equal quantities of 1x loading buffer containing SYB green. After that, the products of the amplification were combined in proportions of density that were equivalent to one another and then the GeneJETTM gel extraction kit (Thermo Scientific, Waltham, MA, USA) was used in the process of purifying the products (Thermo Scientific). The sequence library was produced with the help of the Ion Plus Fragment Library Kit (Thermo Scientific), and the process was carried out in accordance with the guidelines provided by the manufacturer. A Qubit® 2.0 fluorometer (Thermo Scientific) was used in order to determine the library’s overall level of quality. The platform known as Ion S5TM XL was employed in order to conduct the sequencing of the library.

2.4. Statistical Analysis

The raw sequence data were spliced and filtered to obtain clean data and ensure accuracy and reliability of the results. Grouping of operational taxonomic units (OTUs) and species identification were performed based on clean data. Sequences with ≥97% similarity were considered as belonging to the same OTU. For further description, the representative sequences of each OTU were analyzed. The unweighted pair-group method with arithmetic mean (UPGMA) cluster tree was established through the manipulation of the clustering analysis of samples. The linear discriminant analysis Effect Size (LEfSe) technique was utilized in order to determine whether or not there was a significant difference between the sample groups in terms of the species composition and community structure. The data of canonical correspondence analysis (CCA) and soil physicochemical properties were combined to identify those properties that notably influence community differences amongst groups.

3. Results

3.1. Diversity as Well as Composition of Soil Fungal Community

The amount of common OTUs and total unique OTUs from all soil samples were 412 and 659, respectively (Figure 1). The total amount of distinct OTUs found in rhizosphere soil (R20–R80) was 274 (41.58%), whereas the number found in bulk soil (B20–B80) was 385 (58.42%). Amongst the different soil layers, the soil layer that ranged from 0 to 20 cm had the largest number of distinct OTUs (39.76%), followed by the soil layers that ranged from 20 to 40 cm (37.18%), 60 to 80 cm (14.42%), and 40 to 60 cm (8.65%) (Figure 1). The depth of the soil layer had little effect on soil fungal diversity; however, the variety of fungi found in bulk soil was greater within the same soil layer (Figure S2). The results show that bulk soil possesses higher fungal diversity compared to the rhizosphere soil.
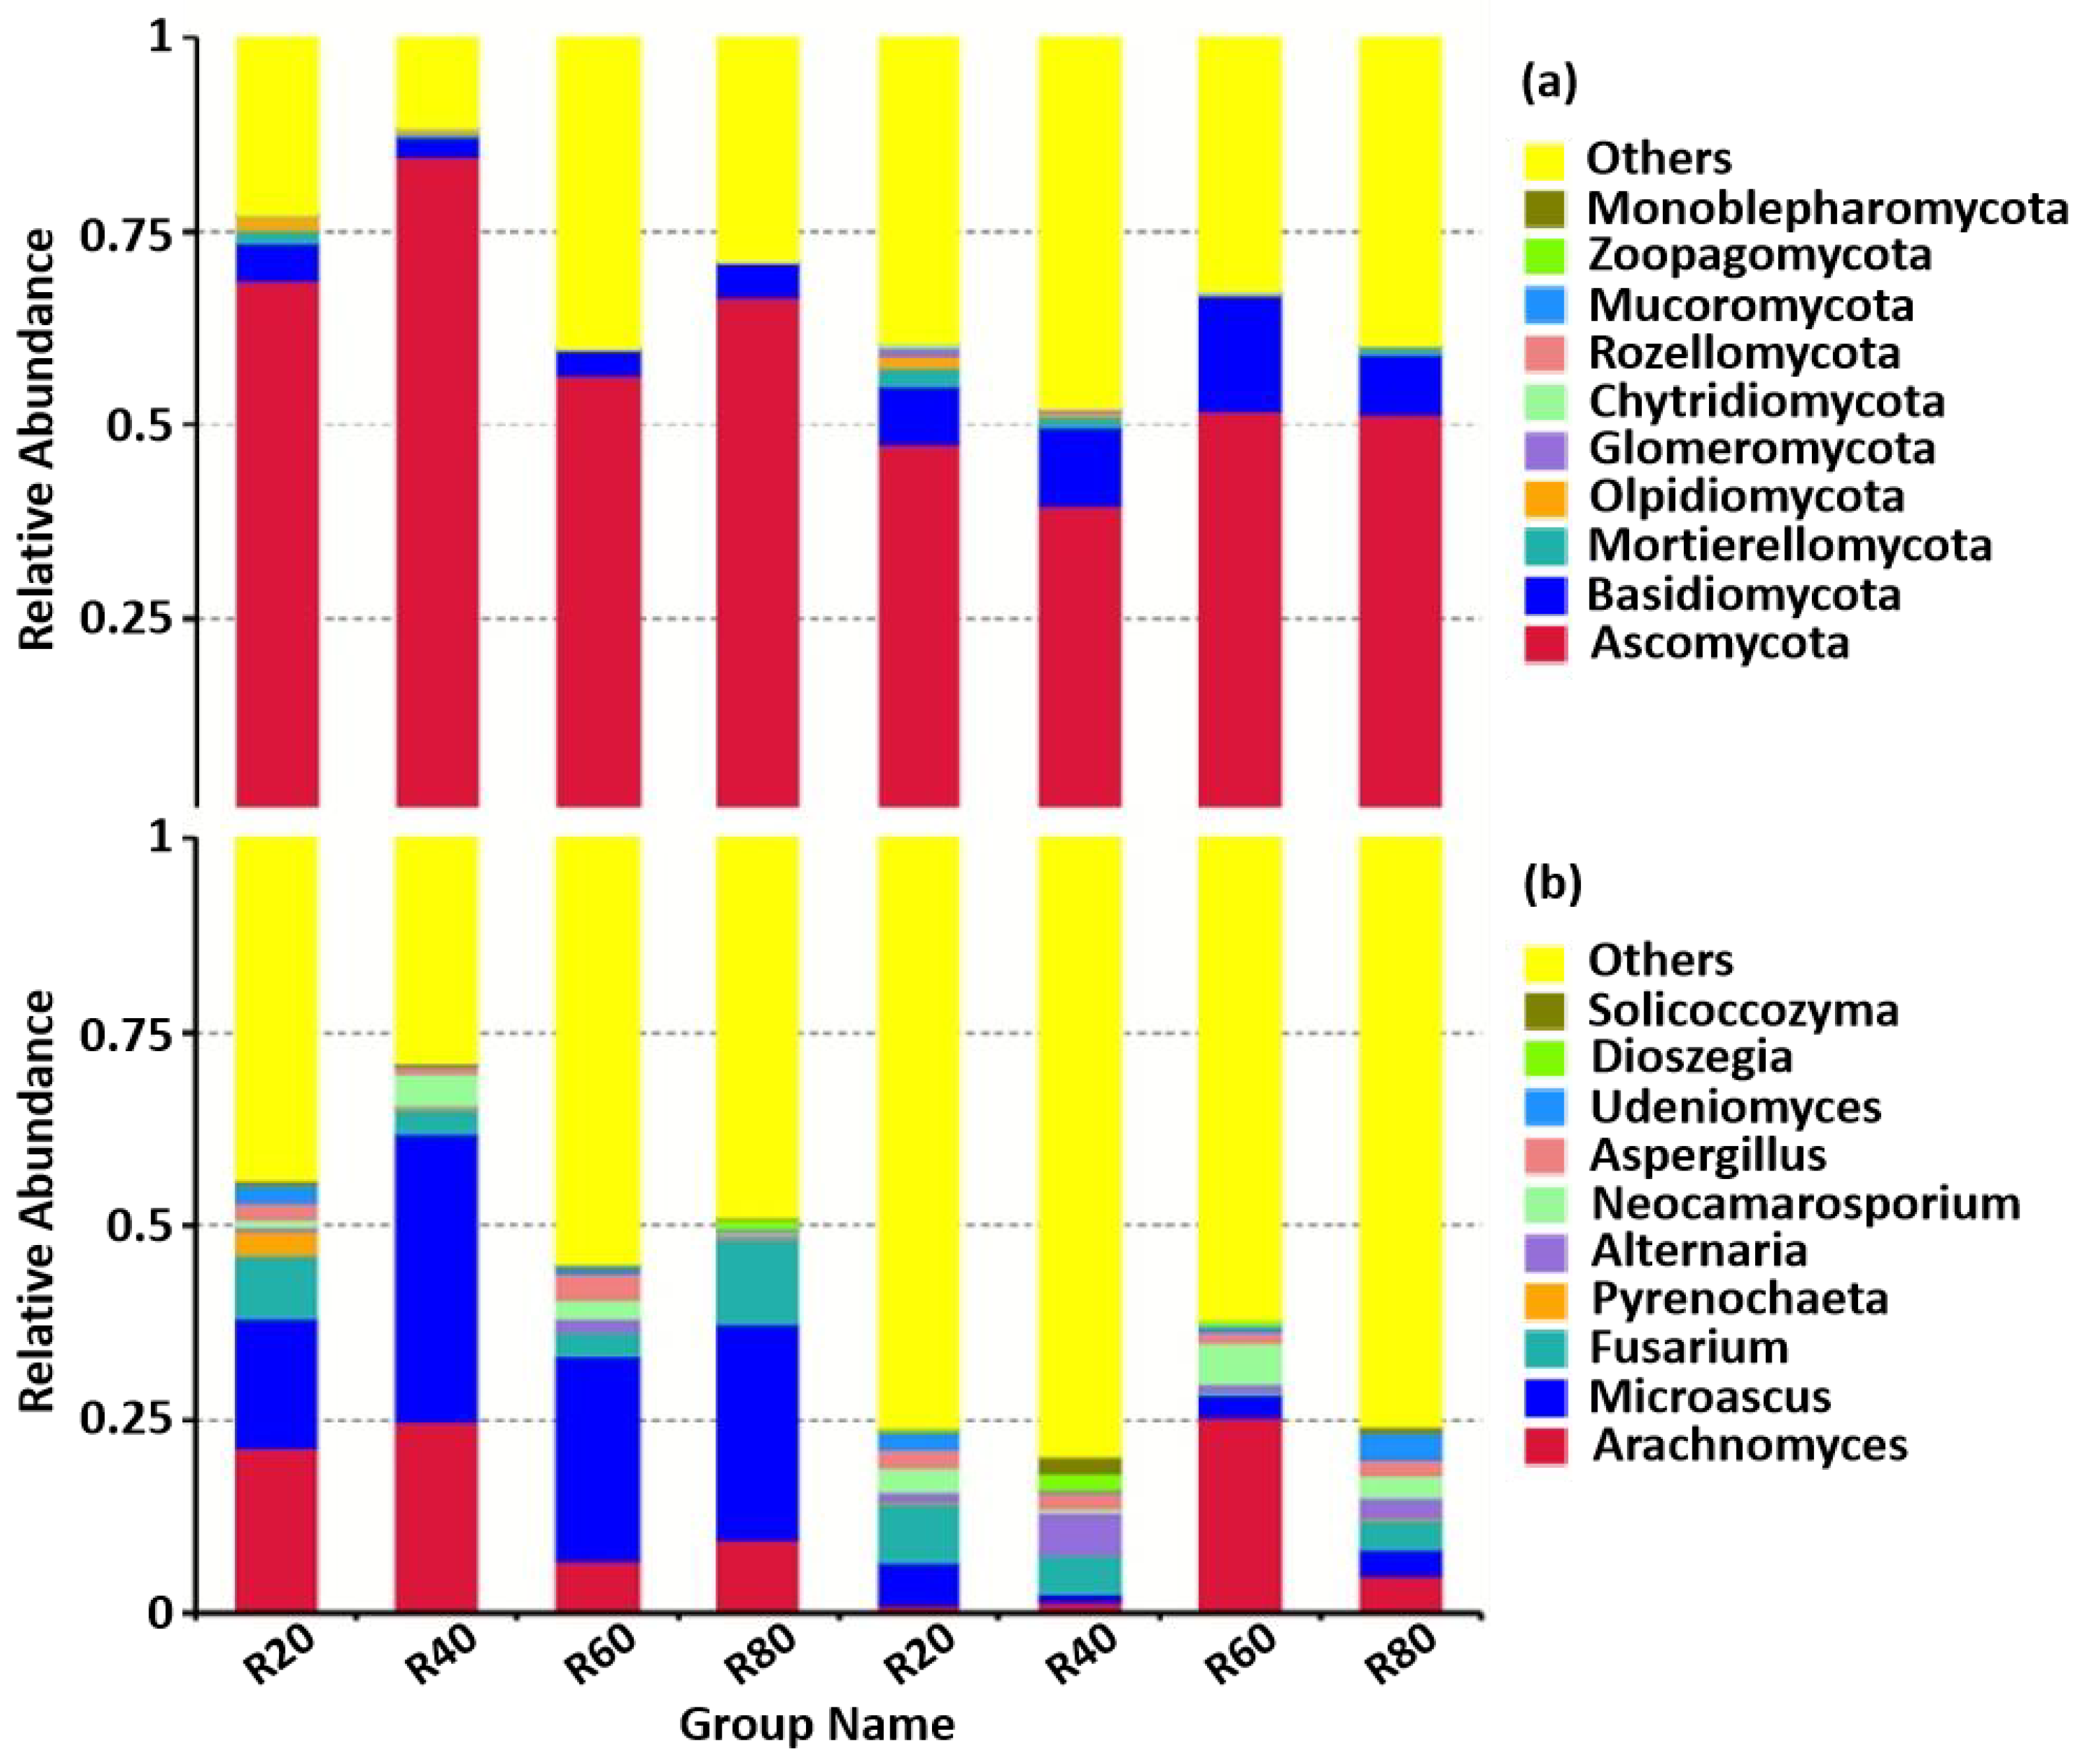
The top 10 phyla of soil fungus contained Ascomycota, Basidiomycota, Mortierellomycota, Olpidiomycota, Glomeromycota, Chytridiomycota, Rozellomycota, Mucoromycota, Zoopagomycota, and Monoblepharomycota (Figure 2a). Ascomycota as well as Basidiomycota were predominant in all soil samples (R20–R80 and B20–B80). In rhizosphere soil samples, Ascomycota and Basidiomycota accounted for 56.40–84.78% and 2.45–4.86% of the total phyla identified, respectively. Moreover, in bulk soil samples, Ascomycota and Basidiomycota accounted for 39.57–51.79% and 7.38–14.99% of the total phyla identified, respectively.
The top 10 species of soil fungus included Arachnomyces, Microascus, Fusarium, Pyrenochaeta, Alternaria, Neocamarosporium, Aspergillus, Udeniomyces, Dioszegia, and Solicoccozyma (Figure 2b). Amongst these, Microascus and Arachnomyces were responsible for 16.79–37.18% and 6.74–24.72% of the species that were discovered in the samples taken from the rhizosphere soil, respectively. In addition, the proportion of Microascus and Arachnomyces found in bulk soil (B20–B80) was significant lesser than that found in rhizosphere soil (R20–R80).

3.2. Discrepancies in the Community of Soil Fungi

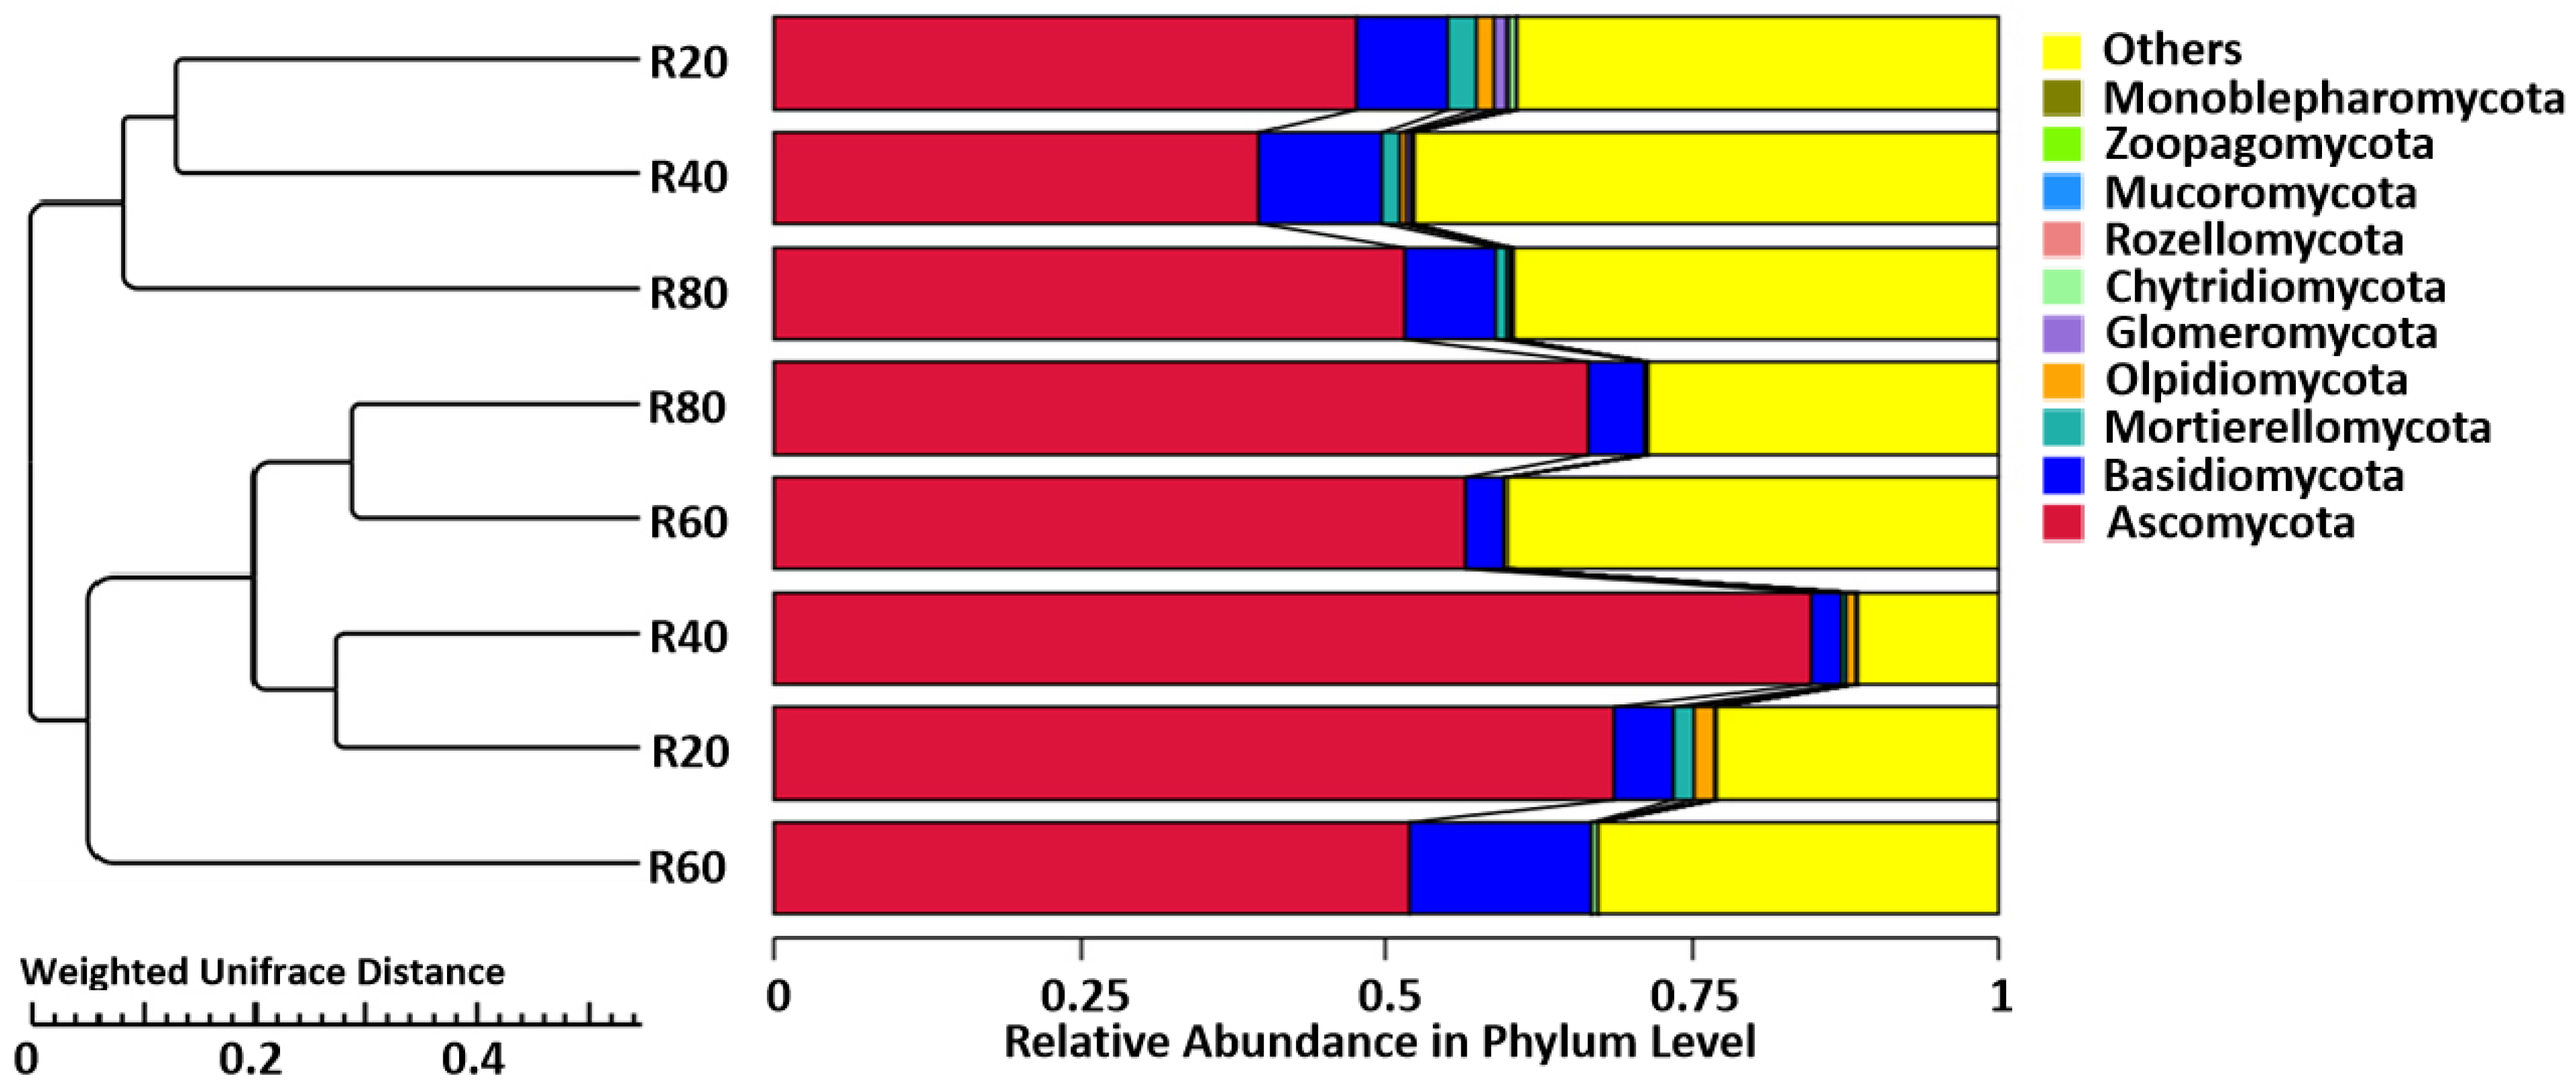
The fungal community structures of R40 and R20 were highly similar (Figure 3). Furthermore, it can be observed from the quantity of branches in rhizosphere soil that the impact of depth on the fungal population was much stronger in rhizosphere soil compared to bulk soil. It suggested that there were substantial variations between soil fungal communities discovered in rhizosphere soil (R20–R80) and those discovered in bulk soil (B20–B80).
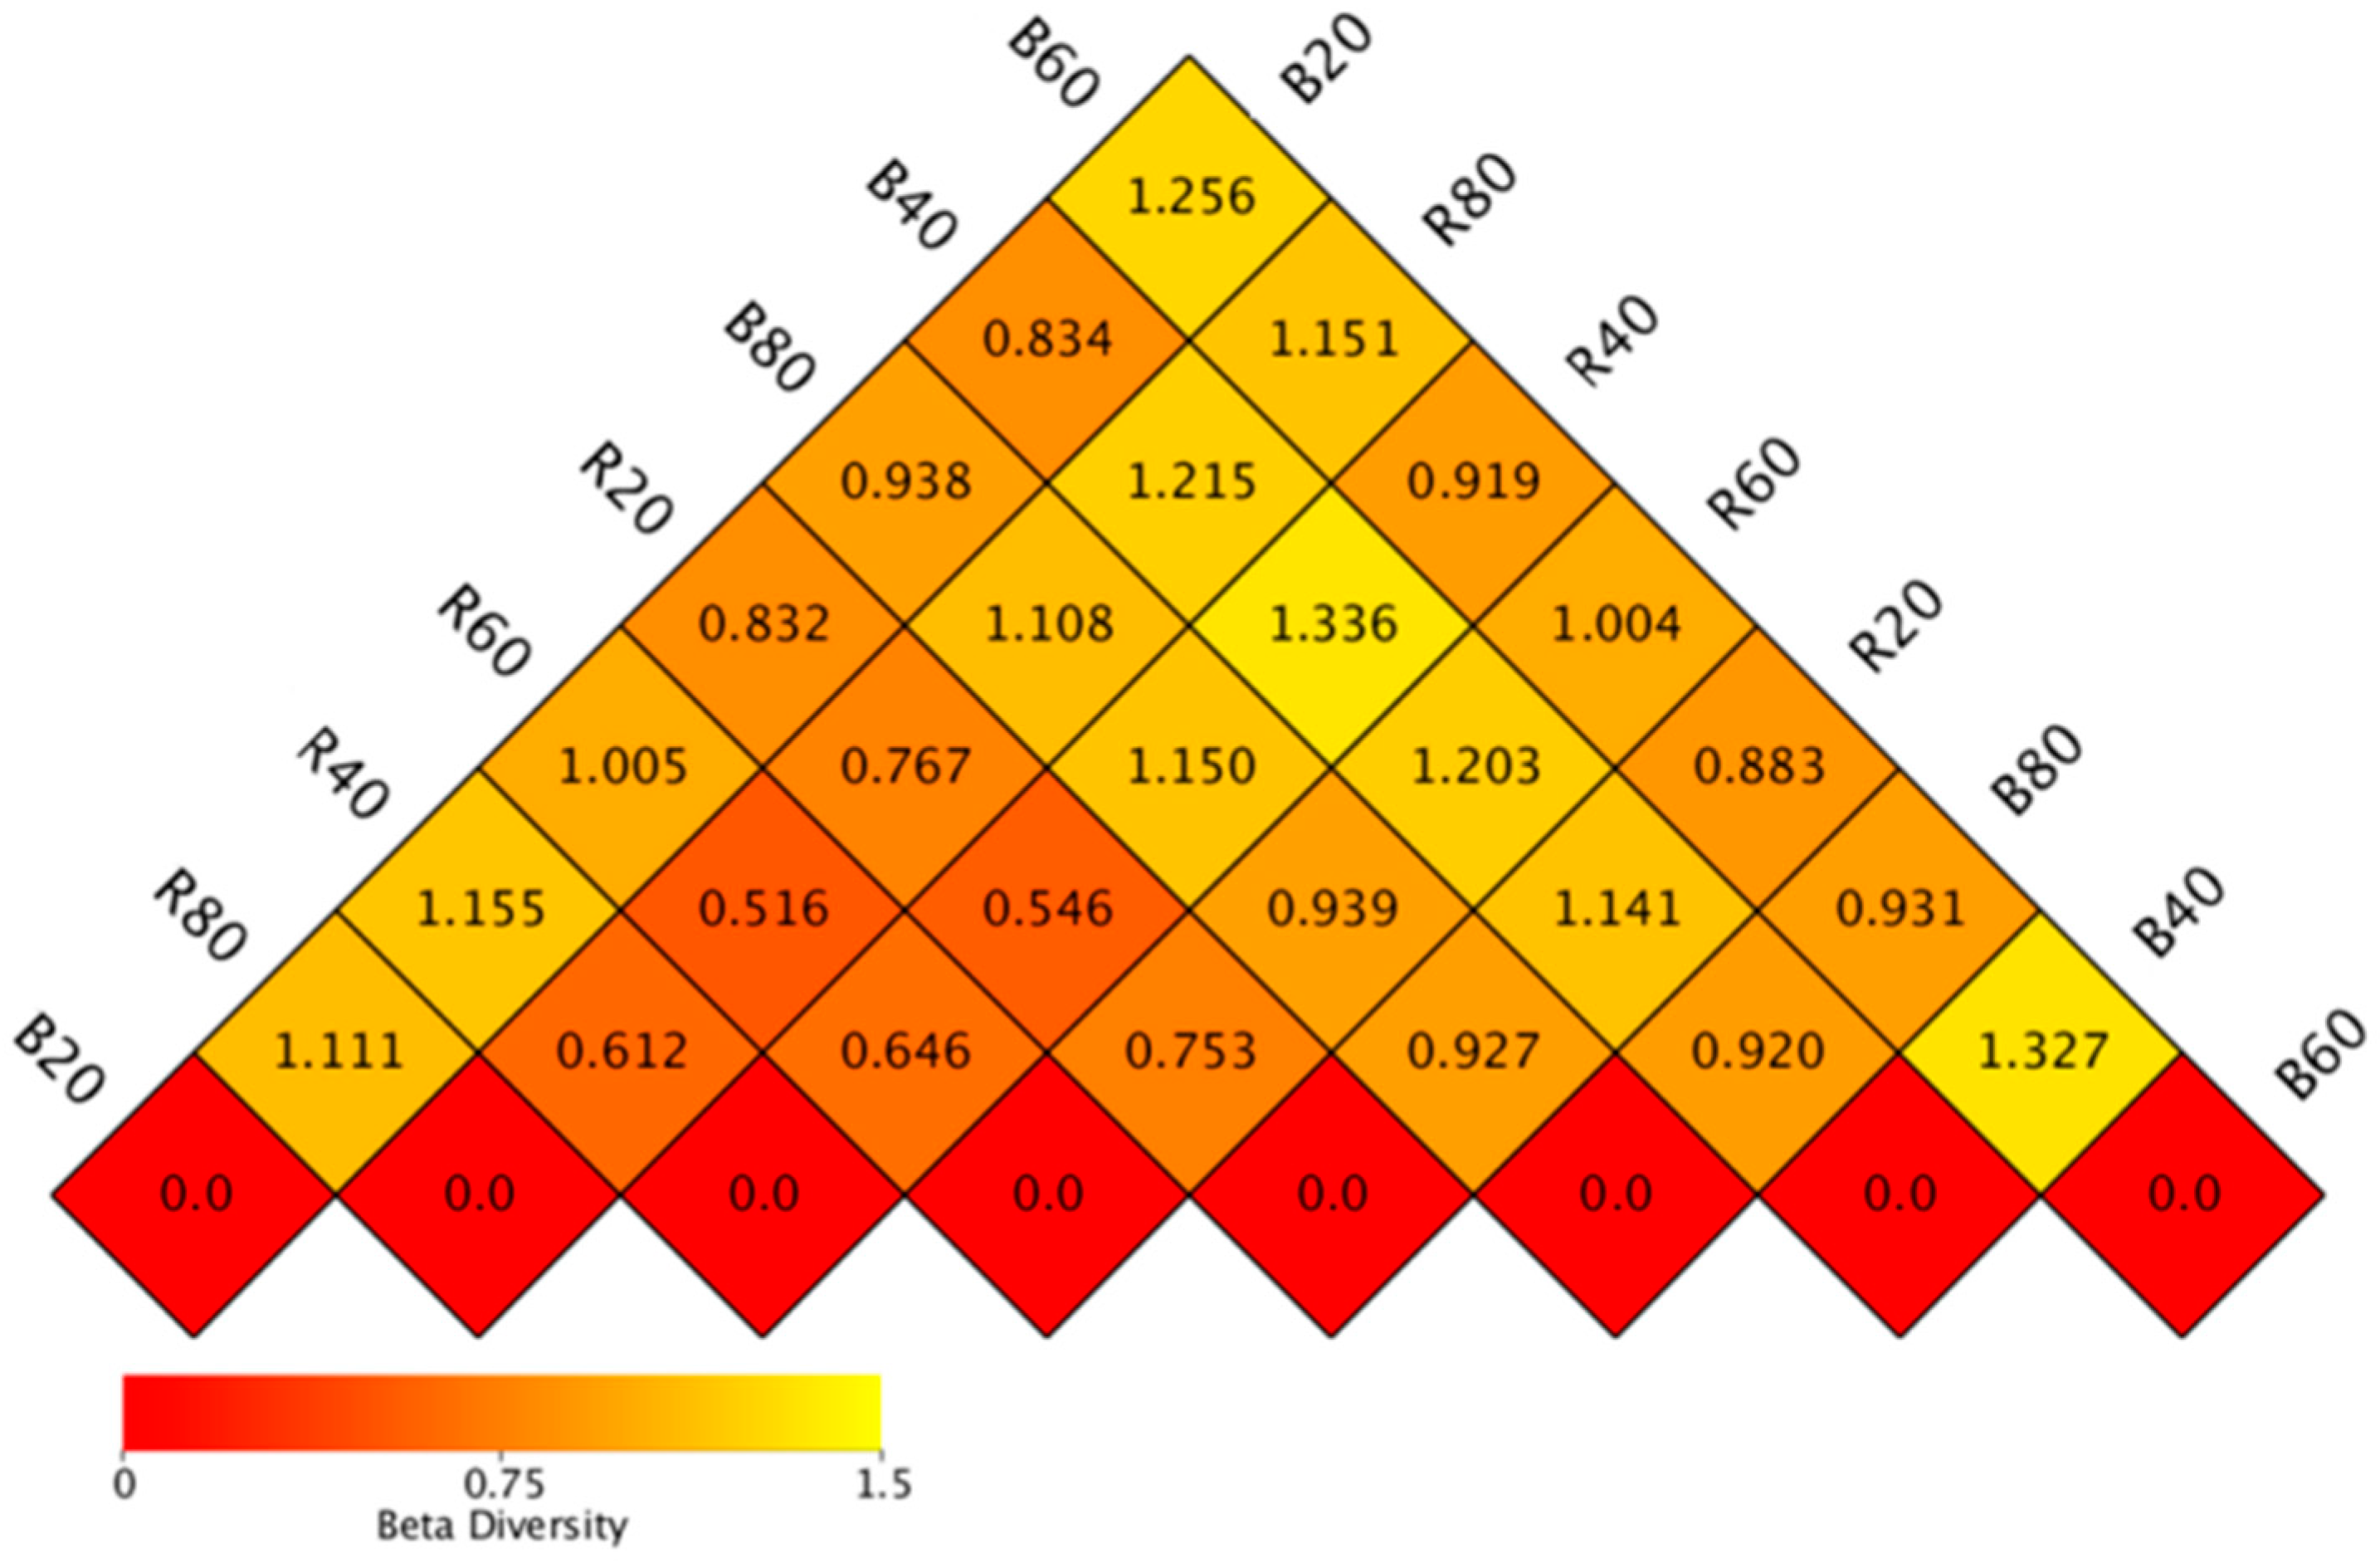
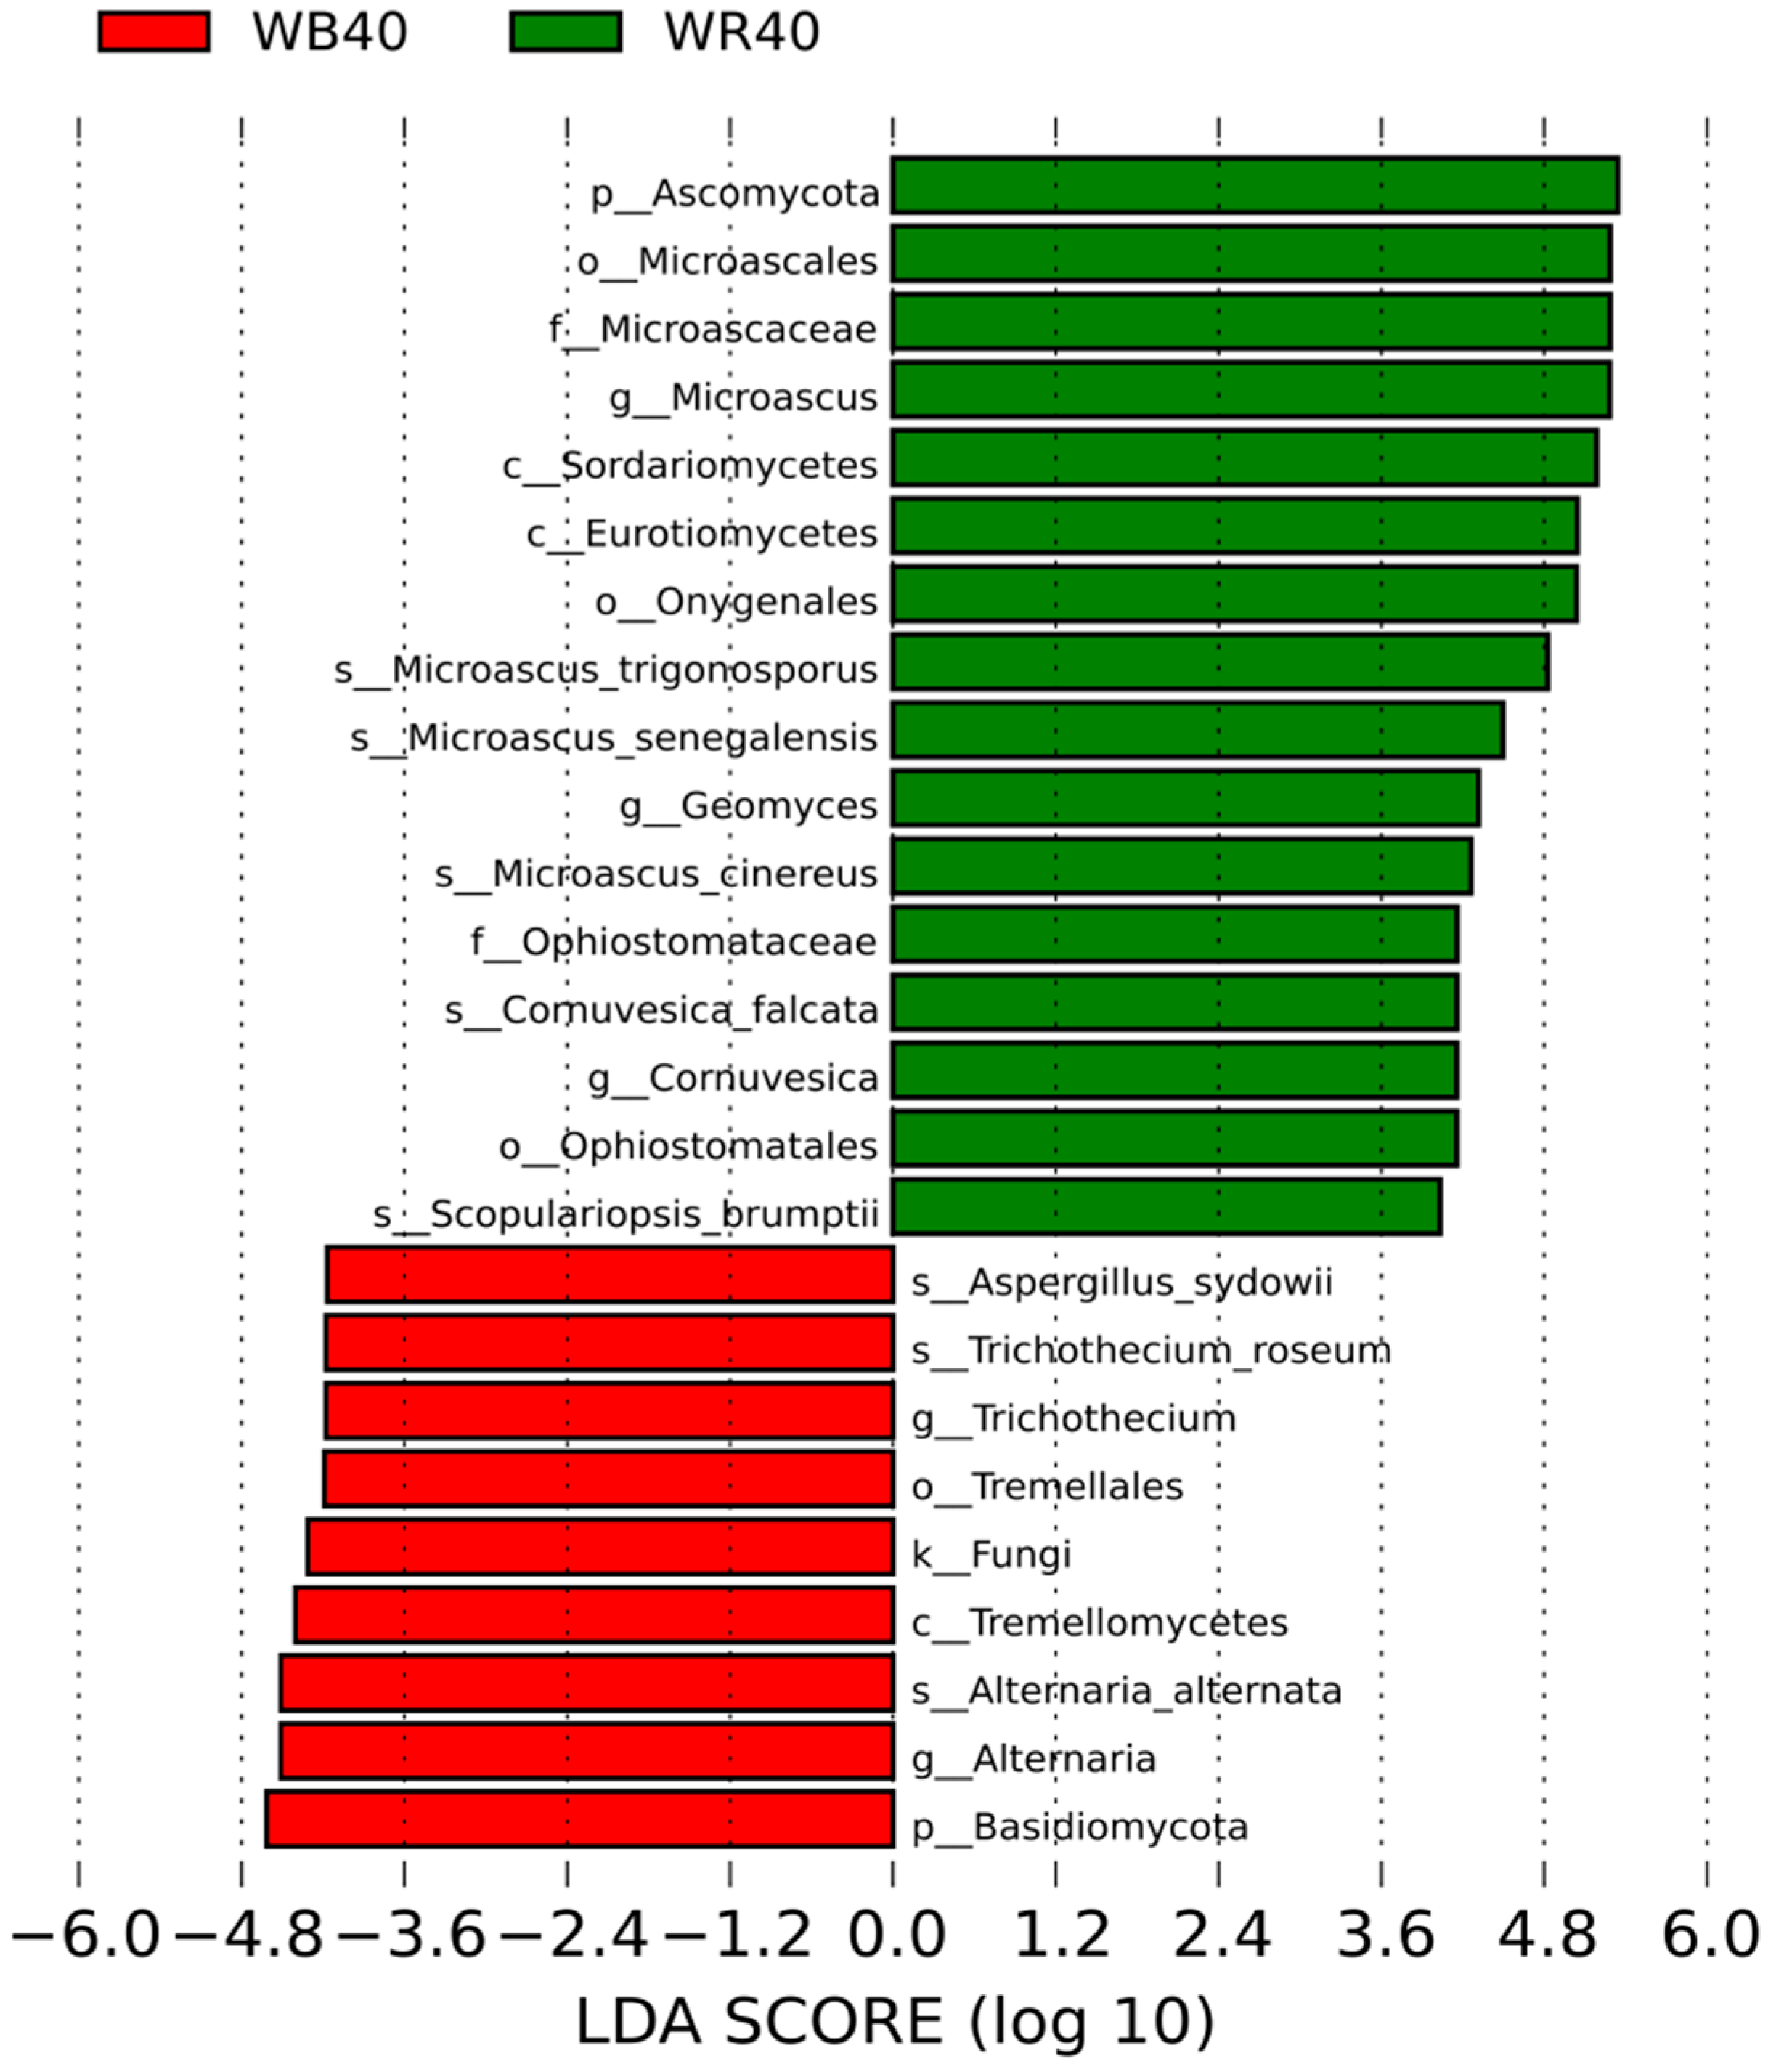
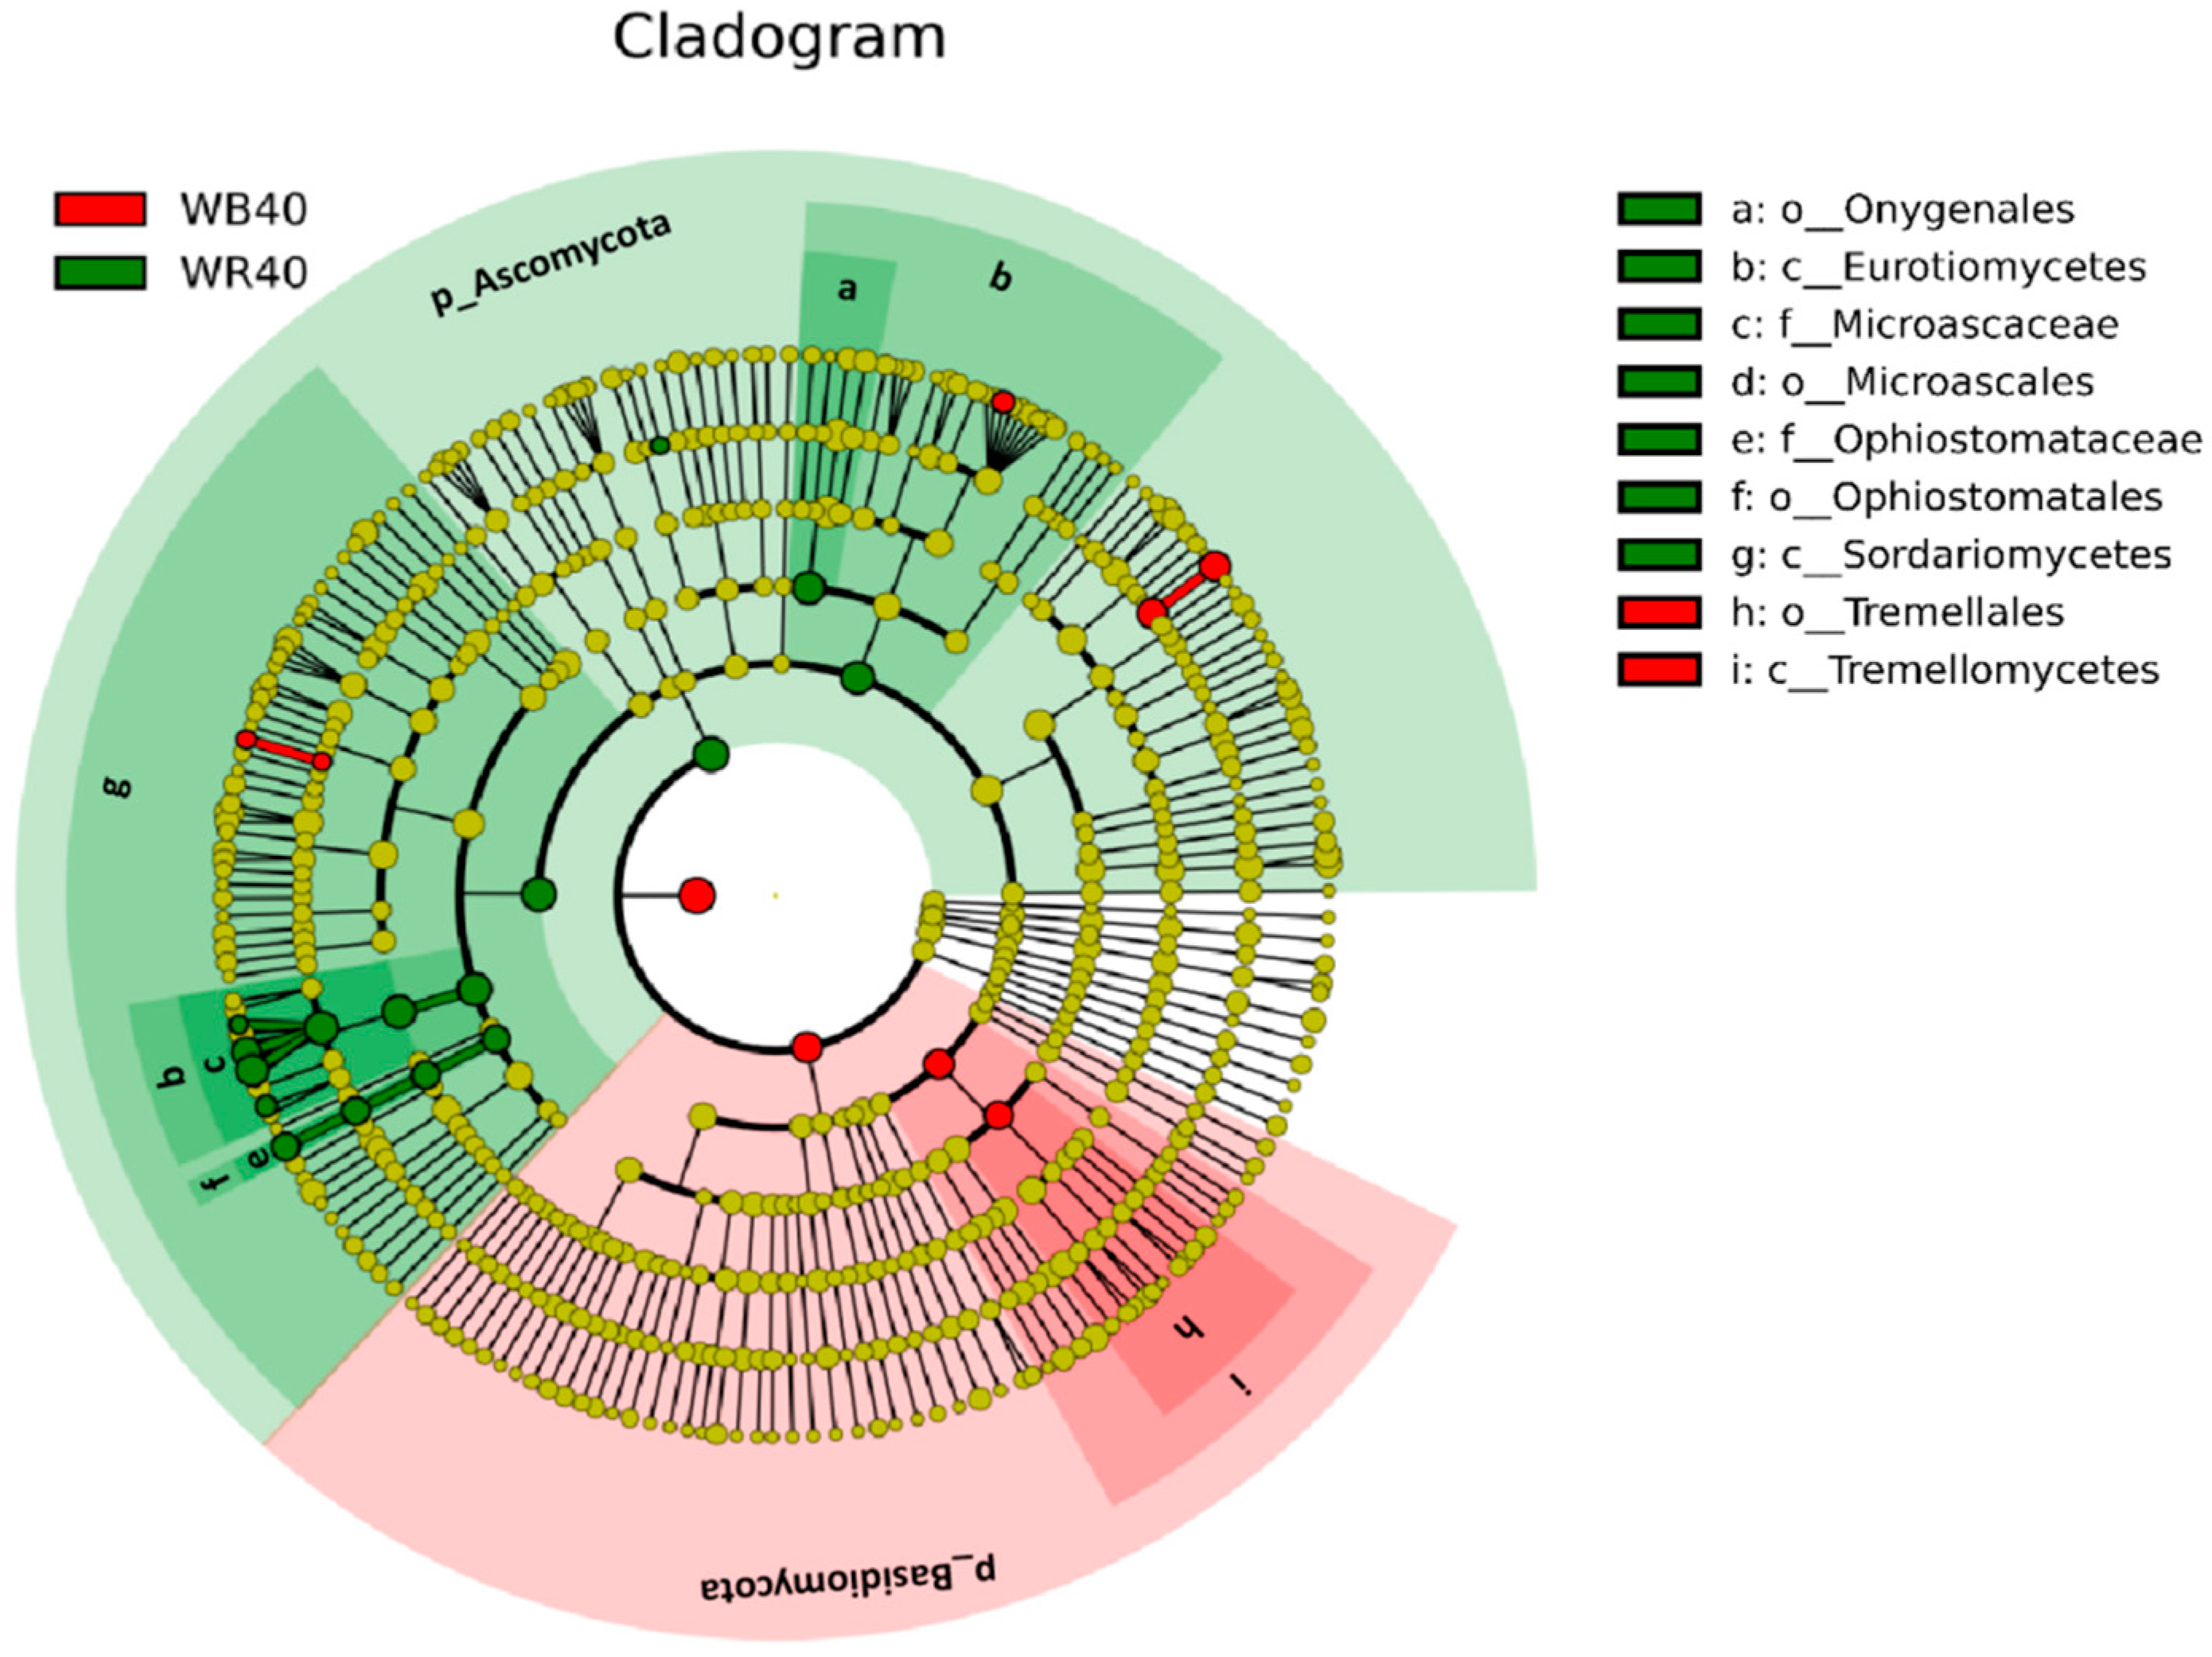
Comparing the various soil layers (0–20, 20–40, 40–60, and 60–80 cm), the difference coefficients between the fungal community of rhizosphere soil (R20–R80) and that of bulk soil (B20–B80) were 0.832, 1.336, 1.004, and 1.108, respectively (Figure 4). The research found the highest disparity in the fungal communities that existed between R40 and B40. Histogram of the distribution of LDA values and evolutionary branching diagram of A. aphylla further confirmed this finding (Figure 5, Figure 6 and Figures S3–S5) and showed that predominant among the fungal species in the rhizosphere soil that were responsible for this difference were Ascomycetes, whereas the bulk soil was dominated by Basidiomycetes (Figure 5 and Figure 6). Meanwhile, the difference in coefficients between rhizosphere and bulk soils (R20 and B20, R60 and B60, R80 and B80) is reduced with the lowering of soil depth (Figure 4).

3.3. Influences of Soil Physicochemical Parameters on Fungal Community Structure

According to the investigation’s findings concerning the physicochemical characteristics of the soil, the AN and EC of rhizosphere soil (R20–R80) were found to be higher than those of bulk soil (B20–B80). Moreover, the AN and EC of “shallow soil” (0–40 cm) were discovered to be higher than those of “deep soil “(40–80 cm) (Table S1). The AP and AK of soil at depths of 40–80 cm were found to be greater than those found in soil at depths of 0–40 cm, and the AP and AK of rhizosphere soil (R20–R80) were found to be greater than those discovered in bulk soil (B20–B80). Rhizosphere soil (R20–R80) had a higher pH value contrasted to the bulk soil (B20–B80). EC of R20 was found to be statistically substantially greater than that of other samples (R40–R80 and B20–B80) (p < 0.05). Rhizosphere soil pH was found to be significantly greater in R20 than that in R40 (p < 0.05). Moreover, the pH value of R80 is obviously higher than that of B80 (p < 0.05). It was found that the AK of R80 also had a considerably greater value than that of B80 (p < 0.05). An analysis of variance revealed that the different soil type (rhizosphere soil/bulk soil) and depth (different soil layers) both had substantial impacts on the EC of the soil, while the different types of soil also had substantial effects on the pH, AP, and AK of the soil (p < 0.05) (Table S1).
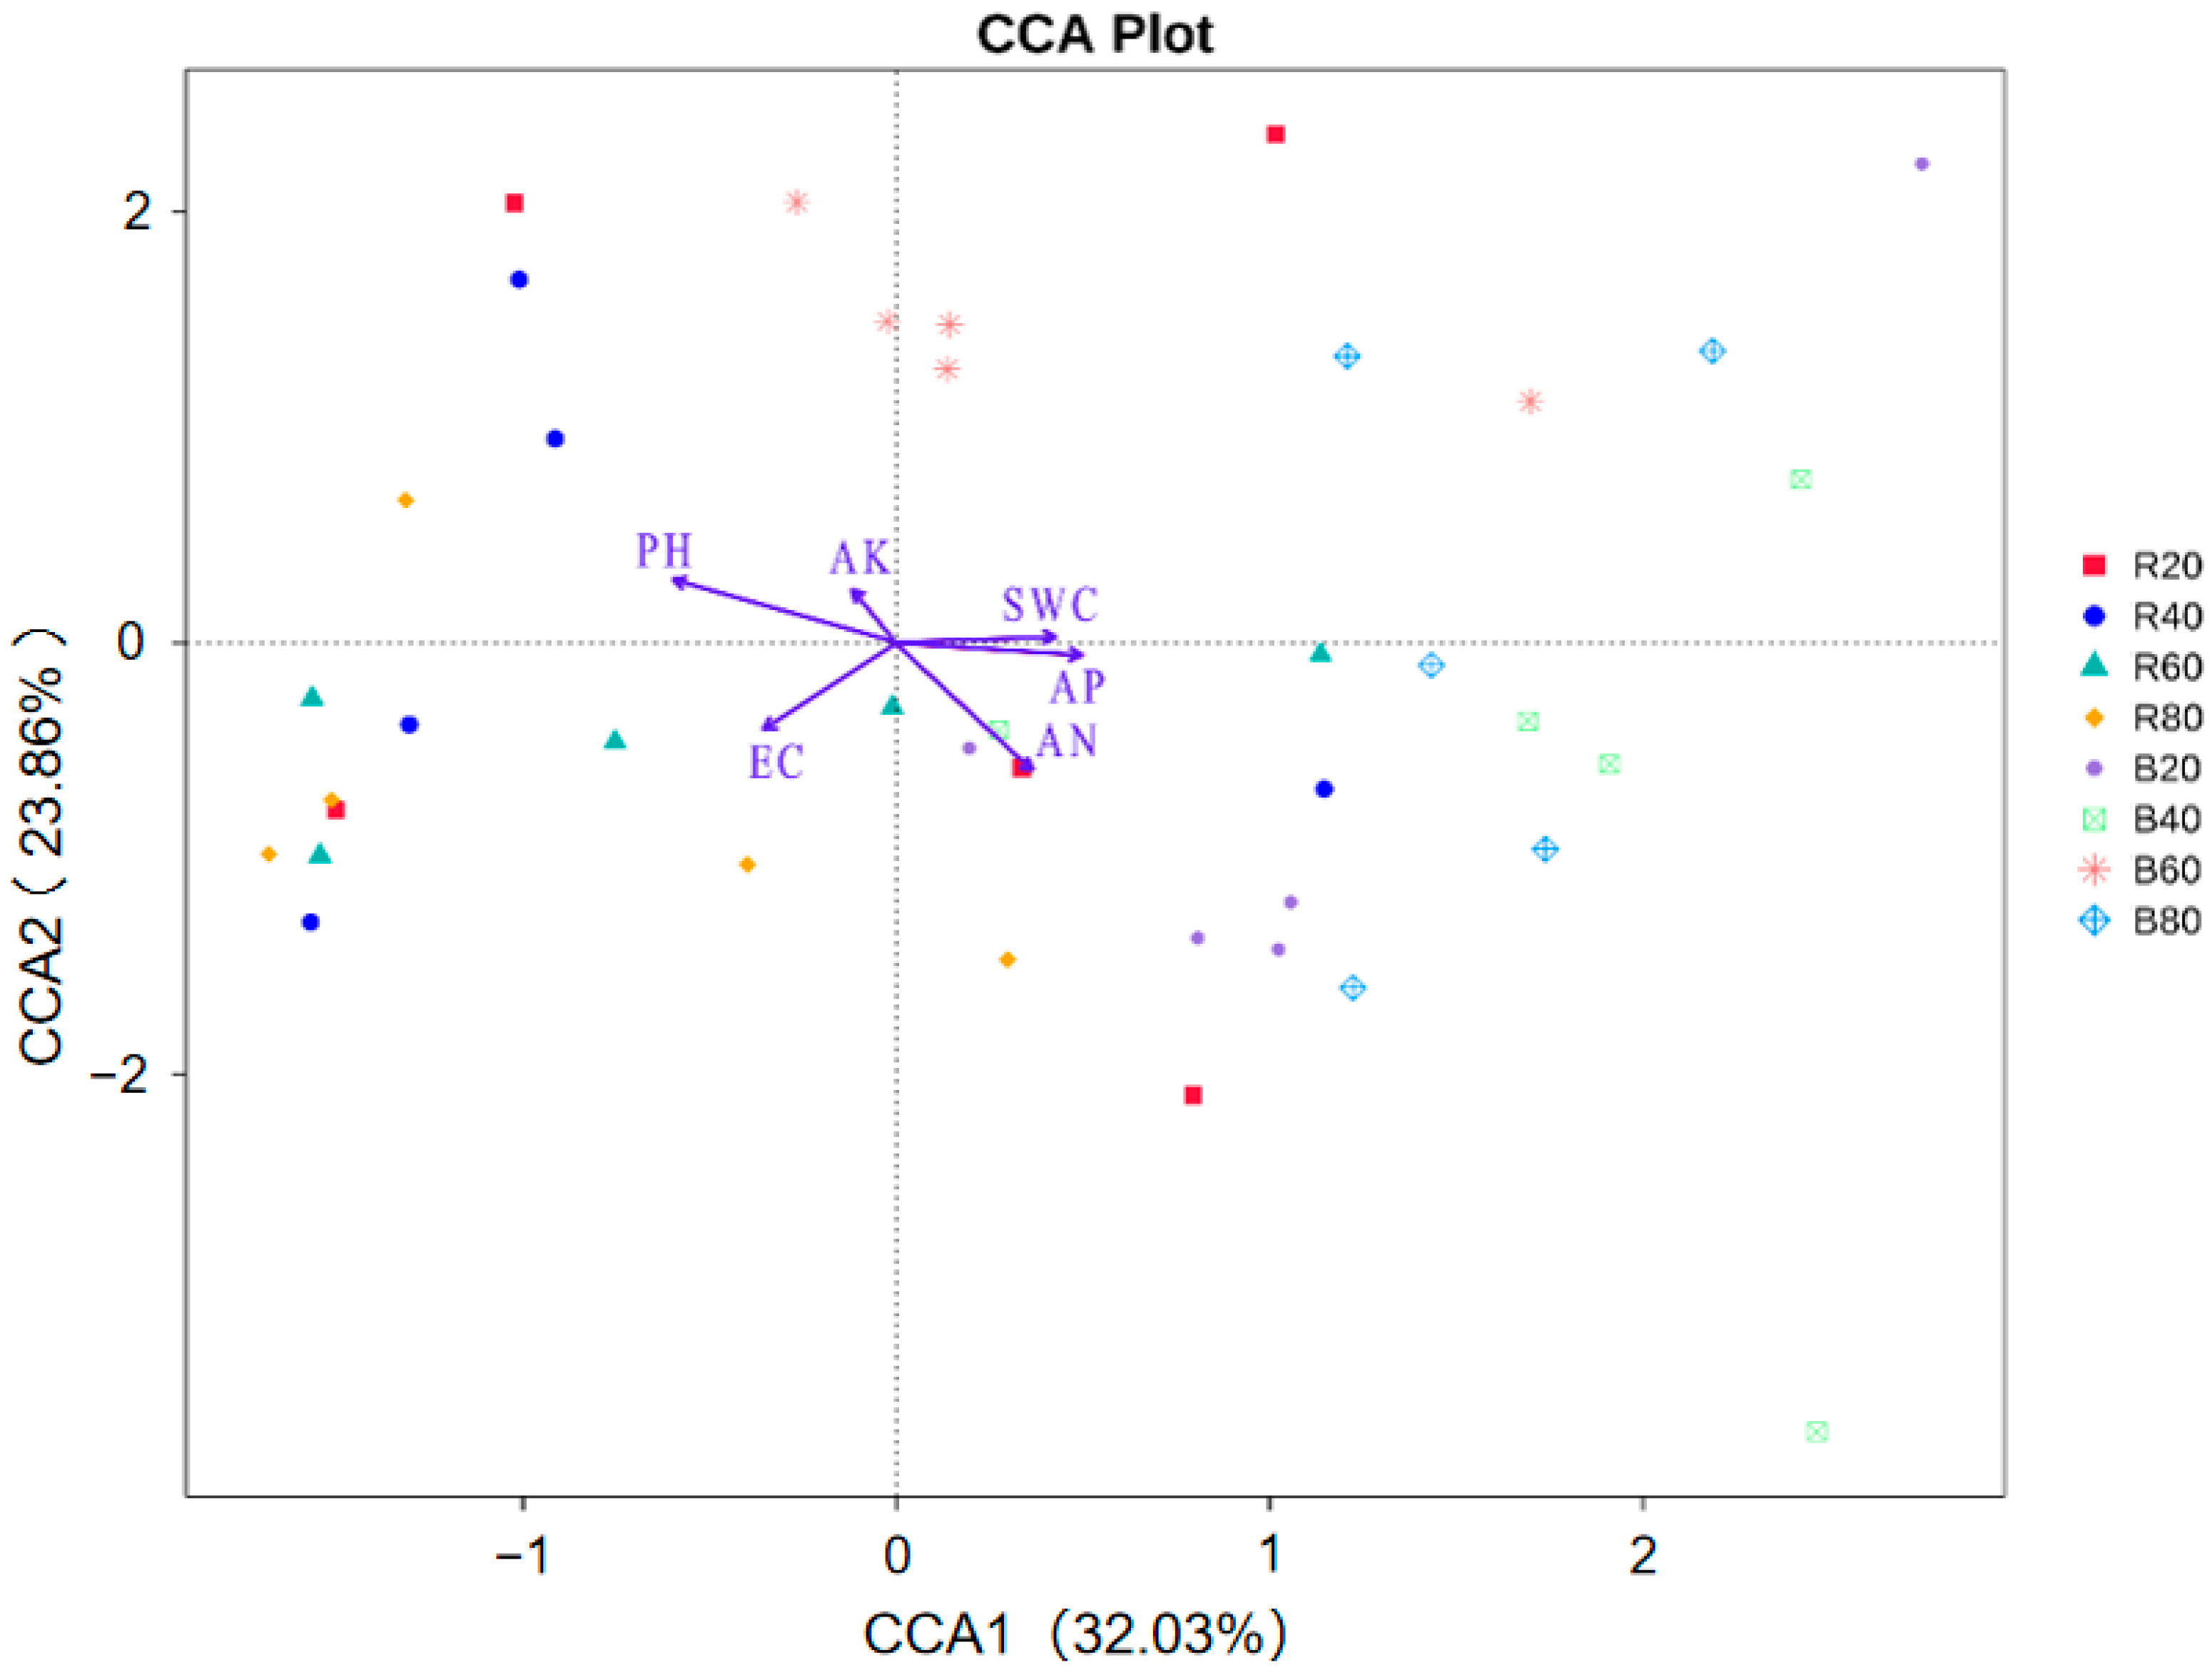
According to the CCA’s findings, the key parameters that influence the communities of fungi found in rhizosphere soil (R20–R80) and bulk soil (B20–B80) are pH, EC, AN, and AP. The pH had the greatest impact in ensuring the makeup of soil fungal community structure (Figure 7). Moreover, both AP and AN were shown to have a great influence on the species of fungi found in rhizosphere soil (R20–R80) and bulk soil (B20, B40 and B80), whereas EC substantially affected the rhizosphere soil (R20–R80) fungal communities.
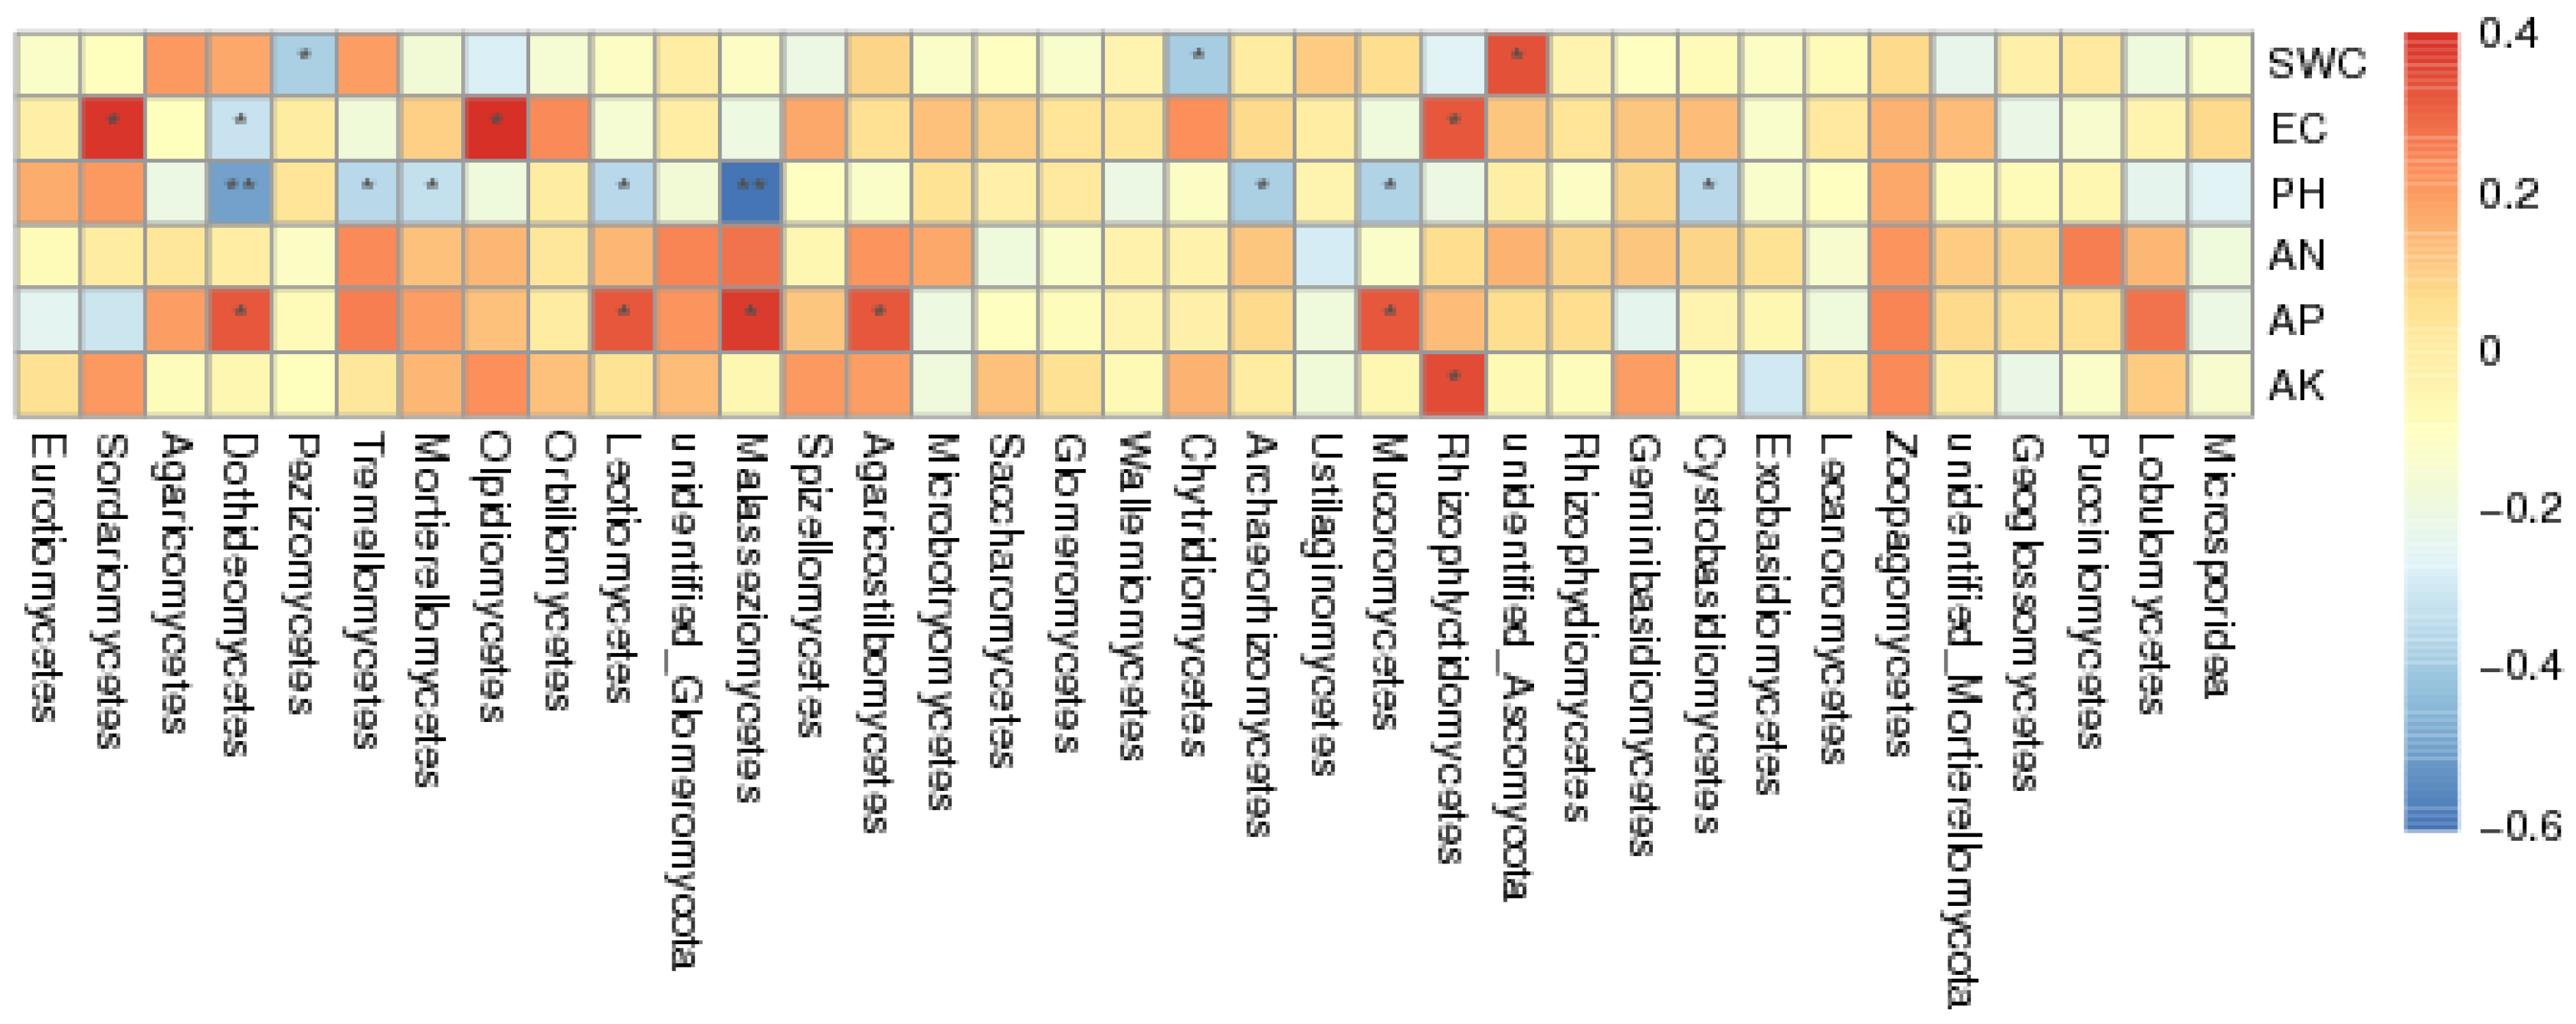
The heat map of correlations between the 35 primary fungal classes and soil physicochemical properties indicated that AN, AP, and AK of the soil had important positive associations with the multitude of the classes, whereas pH was negatively correlated with some classes (Figure 8).

4. Discussion

4.1. Fungal Diversity Is Greatest in the Shallow (0–20 cm) Bulk Soil

Previous research has demonstrated that bacterial diversity and richness found in rhizosphere soil are much greater than those found in bulk soil. On the contrary, the fungal diversity found in rhizosphere soil is substantially lower than that found in bulk soil [29].
In a similar manner, we discovered that the diversity of fungi in rhizosphere soil is much smaller compared to that seen in bulk soil (Figure S2), and this confirms our first hypothesis. This pattern has also been observed in Arabidopsis thaliana [30], Oryza sativa [31], Gossypium spp. [32], Triticum aestivum [33], and poplar [34], which indicates that the plant species has little effect on this pattern. Higher fungal diversity in the bulk soil is a common phenomenon. There are some pathogens in the fungal community that are not conducive to plant growth. Therefore, even though the rhizosphere soil has a higher nutrient content and is more suitable for its growth, the selective nature of plant roots [35] will actively filter out fungi that are not conducive to its growth, resulting in a lower diversity and richness of rhizosphere fungi [36,37]. This provides some guidance as to how to isolate and screen for beneficial fungi which can promote plant growth.
In addition to the influence of the rhizosphere and bulk soils, species diversity also commonly decreases with increasing soil depth and is most enriched at a depth of 20 cm [38]. In this study, we observed that both rhizosphere and bulk soils showed higher fungal diversity and richness in the shallow soil (0–40 cm), and the 0–20 cm layer of bulk soil had the highest fungal diversity and richness (Figure S2). The amount of unique OTUs found in the bulk soil of the 0–20 cm soil layer was the greatest, making up 24.13% of the total unique OTUs (Figure 1). This may be due to the higher amount of available N in the shallow soil (Table S1), as the conditions are more attractive to more types of fungi. The soil fungal community was affected by litter characteristics [39], soil nutrients [40], soil moisture [41], pH [42], and climate [43]. Studies have shown that the presence of water and nitrogen can enhance the activity of soil fungal communities and increase their diversity and composition [44].

4.2. Abundance of the Dominant Fungi Was Highest in the Shallow (20–40 cm) Rhizosphere Soil

In contrast to the second hypothesis, the dominant fungi of A. aphylla were mostly dispersed in the 20–40 cm layer of the rhizosphere soil according to the findings. The plant root system can actively select microbial species, and this influences the community structure of the rhizosphere soil microorganisms [45] This mechanism promotes the reproduction of beneficial microbial populations and limits the harmful ones, thus gradually forming a rhizosphere soil microbial community beneficial to the plant [46]. In addition, host plants can shape rhizosphere microbial communities beneficial to their growth and metabolism through complex changes to the rhizosphere secretion components [47,48]. The resistance or tolerance of plants to saline–alkali, drought, cold, and other stresses is thus not solely due to the plant itself, but also to the rhizosphere soil microorganisms which have a positive effect on the hosts adaptation to stress [49,50,51]. Therefore, it is particularly important to identify the areas with the highest abundance of dominant microorganisms selected by the host plants. In our research, Ascomycota, Basidiomycota, Microascus, and Arachnomyces were the dominant fungi, and had a higher prevalence in rhizosphere soil. Amongst these, the prevalence of Ascomycota and Microascus was highest in the 20–40 cm layer of the rhizosphere soil, and this layer showed the most significant disparity between the rhizosphere soil and the bulk soil in terms of the abundance of Ascomycota and Microascus (Figure 2). This may be because the rhizosphere soil is more susceptible than the bulk soil to the effects of rhizosphere exudates and rhizosphere selectivity.
Ascomycetes are the main decomposers of organic matter in soil [52]. Ascomycota is the dominant fungus at the phylum level; it can account for ≥90% of the total number of fungal species [53,54]. Our results showed that Ascomycota was the most abundant dominant phylum in A. aphylla (Figure 2), accounting for 56.4–84.8% of the rhizosphere soil fungi and 39.6–51.8% of the bulk soil fungi. These values were lower than those of previous studies, and this was probably due to the role of Ascomycetes in the degradation of organic matter. The organic substrates in sandy soils are much lower than those in vegetation soils. As a result, the demand for Ascomycetes decreases and, consequently, so does its abundance. Basidiomycota, the other dominant fungus phylum in this study, includes, like Ascomycetes, typical saprophytic species [55], which are environment-loving and decompose organic matter [56], especially residues with a high lignin content [57]. However, unlike Ascomycetes, Basidiomycetes are more abundant in the bulk soil, and the most likely explanation for this is competition between Ascomycetes and Basidiomycetes, which is negatively correlated with their relative abundances [57]. In addition, Microascus and Arachnomyces also accounted for a significant fraction in the rhizosphere soil of A. aphylla, indicating that these two genera were also independently selected by A. aphylla, especially in the 20–40 cm layer of the rhizosphere soil at a high abundance level (Microascus 24.72% and Arachnomyces 37.18%) (Figure 2). These findings indicate that the 20–40 cm layer of the rhizosphere soil may have a key impact in the development of A. aphylla. Soil fungi in this region may also play a role in dealing with external environmental stresses, such as saline–alkali stress, but further research is required. Beneficial microorganisms in the rhizosphere soil excavated from saline–alkali tolerant plants such as A. aphylla may be a potential source of effective biological inoculants to produce saline–alkali tolerant plants or to cultivate microbial agents with the purpose of improving saline–alkaline soil.

4.3. EC Is the Main Environmental Factor Affecting Dominant Fungi in the A. aphylla Rhizosphere

The most significant environmental element that had an effect on the dominant fungi of A. aphylla was EC, which provides some supportive evidence for the third hypothesis. The rhizosphere soil has a much lower diversity of fungus in comparison to the bulk soil (Figure S2). Nevertheless, in the rhizosphere soil, the prevalence of the predominant fungal population was much greater than in the bulk soil (Figure 2). This is due to the selective effect of plants, which results in lower fungal diversity but a higher abundance of dominant fungi in rhizosphere soil [28]. The soil microbial community is a bridge between the plants and the soil environment, and is directly affected by both. In addition to the influence of plants themselves, the soil environment also plays a significant role in fungal communities. We found that the available nutrient content, pH, and EC of rhizosphere soil were typically greater than those of bulk soil (Table S1), and these conditions were conducive to increasing the soil fungi abundance [40,41,42].
In arid regions, the salinized soil has shown a high salt/alkali concentration and a low nutrient content, all of which are detrimental to the development and multiplication of soil microbes [21,58]. However, for saline–alkali tolerant plants, saline–alkali may enhance the variety and abundance of the rhizosphere soil microbes [59], which may be related to the activation of the proliferation of salt-tolerant or halophilic microorganisms in salinized soil [4]. A previous study showed that salt stress might have a significant impact on the diversity of the microbial population in the rhizosphere soil. In salt-sensitive cucumber varieties, the application of reduced salt levels resulted in a greater diversity of microorganisms in the rhizosphere soil, whereas salt-tolerant cucumber varieties presented higher richness levels with the high salt treatment [60]. In this research, based on the association between the soil physicochemical characteristics and the species composition of fungi, pH is the most important component that influences the organization of the fungal community in the bulk soil, whereas in the rhizosphere soil, EC is the most important factor (Figure 7). These findings reveal the correlation between salt content and fungal community. In addition, according to the findings of our study, the EC of the soil in the rhizosphere’s shallow layer (0–20 and 20–40 cm) was higher than that of the bulk soil (Table S1), and the number of dominant fungi was comparatively abundant in both of these soil layers (Figure 2). This indicates that EC has a substantial role in determining the number of dominant fungi in the rhizosphere soil of A. aphylla.

5. Conclusions

High-throughput sequencing was employed to ascertain the differences, and the mechanisms that are driving those differences, in the fungal species composition that occurs between rhizosphere soil (R20–R80) and bulk soil (B20–B80) of A. aphylla from the Gurbantunggut Desert in the Junggar Basin, Xinjiang, China. According to our findings, there was a notable disparity between the community structures of soil fungus found in rhizosphere soil (R20–R80) and those found in bulk soil (B20–B80). To be more explicit, bulk soil had a pretty great fungal diversity, and the 0–20 cm layer of bulk soil (B20) contained the largest amount of distinct OTUs, contributing to 24.13% of the overall number of distinct OTUs. There was a significant quantity of dominating fungus (Ascomycota: 84.78%; Microascus: 24.72%; Arachnomyces: 37.18%) in R40. EC was recognized as the main environmental condition affecting the dominant fungus in rhizosphere soil (R20–R80) of A. aphylla. This research will assist us in gaining a deeper comprehension of dominant fungal distribution in connection with desert plant, A. aphylla, as well as the environmental conditions that govern their dispersion. Furthermore, the findings will give a theoretical framework for the gathering of dominant fungi, which could be utilized to improve microbial agents in saline–alkali soils.

Supplementary Materials

The following supporting information can be downloaded at: https://www.mdpi.com/article/10.3390/su142215423/s1, Figure S1: Collection of rhizosphere and bulk soil of Anabasis aphylla. The figure (a) shows the soil profile of Anabasis aphylla. The figure (b) shows the collection of bulk soil of Anabasi. Figure S2: Box diagram of soil fungi alpha diversity index among groups. The Figure represents Shannon index, Simpson index, chao1 index and ACE index, respectively. The box chart can directly reflect the median, discrete degree, maximum, minimum and outlier of species diversity in the group. R: rhizosphere; B: bulk soil; numbers 20–80 represent the lower depth of the soil layers (0–20, 20–40, 40–60, and 60–80 cm). Figure S3: LDA value distribution bar chart and LEfSe evolutionary cladistic diagram of rhizosphere and bulk soil fungal communities in 20 cm soil layer. Figure S4: LDA value distribution bar chart and LEfSe evolutionary cladistic diagram of rhizosphere and bulk soil fungal communities in 60 cm soil layer. R: rhizosphere; the number 60 indicates that the depth of the soil layer is 40–60 cm. Figure S5: LDA value distribution bar chart and LEfSe evolutionary cladistic diagram of rhizosphere and bulk soil fungal communities in 80 cm soil layer. R: rhizosphere; B: bulk soil; the number 80 indicates that the depth of the soil layer is 60–80 cm. Figure S6: LDA value distribution bar chart and LEfSe evolutionary cladistic diagram of rhizosphere fungal communities in different soil layers. R: rhizosphere; numbers 20 and 80 represent the lower depth of the soil layers (0–20 and 60–80 cm). Figure S7: LDA value distribution bar chart and LEfSe evolutionary cladistic diagram of bulk soil fungal communities in different soil layers. B: bulk soil; numbers 20–80 represent the lower depth of the soil layers (0–20, 40–60 and 60–80 cm). Table S1: Soil properties in Anabasis aphylla.

Author Contributions

Y.W. designed and performed the research, analyzed the data, as well as wrote the manuscript; Y.J. took part in the whole procedure of the experiment and delivered significant efforts to the experiment; G.C. was involved in the process of conceiving of the research; Z.Y. participated in the data analysis with constructive discussions; and M.W. provided numerous significant suggestions throughout the examination of the manuscript. All authors have read and agreed to the published version of the manuscript.

Funding

National Natural Science Foundation of China [Grant Nos. 31660194, 31570595] and Scientific Research Foundation of China West Normal University [Grant Number 18Q045] provided financial support for this research.

Institutional Review Board Statement

This article does not contain any studies with human participants or animals performed by any of the authors.

Informed Consent Statement

We obtained permission from the forestry and grassland work station of Xinjiang production and Construction Corps to collect the plant and soil samples.

Data Availability Statement

The data of the investigation were uploaded to the NCBI Sequence Read Archive, where they were given the accession number SRA PRJNA778026. The raw data of sequencing have been made available on the NCBI website (https://www.ncbi.nlm.nih.gov/bioproject/PRJNA778026 (accessed on 5 November 2021)). The environment data have been uploaded to figshare (https://figshare.com/ (accessed on 28 July 2022)) and downloaded from https://doi.org/10.6084/m9.figshare.20388375.v1.

Conflicts of Interest

The authors declare that they have no conflict of interest.

References

  1. Carini, P.; Marsden, P.J.; Leff, J.W.; Morgan, E.E.; Strickland, M.S.; Fierer, N. Relic DNA is abundant in soil and obscures estimates of soil microbial diversity. Nat. Microbiol. 2017, 2, 16242. [Google Scholar] [CrossRef] [PubMed]
  2. Fierer, N.; Wood, S.A.; Mesquita, C.P. How microbes can, and cannot, be used to assess soil health. Soil Biol. Biochem. 2021, 153, 108111. [Google Scholar] [CrossRef]
  3. Coban, O.; De Deyn, G.B.; Ploeg, M. Soil microbiota as game changers in restoration of degraded lands. Science 2022, 375, 990. [Google Scholar] [CrossRef] [PubMed]
  4. Yang, H.; Hu, J.X.; Long, X.H.; Liu, Z.P.; Rengel, Z. Salinity altered root distribution and increased diversity of bacterial communities in the rhizosphere soil of Jerusalem artichoke. Sci. Rep. 2016, 6, 20687. [Google Scholar] [CrossRef] [PubMed] [Green Version]
  5. Liu, A.L.; Li, Y.X.; Wang, Q.Q.; Zhang, X.R.; Xiong, J.; Li, Y.; Lei, Y.H.; Sun, Y.F. Analysis of microbial diversity and community structure of rhizosphere soil of Cistanche salsa from different host plants. Front. Microbiol. 2022, 13, 971228. [Google Scholar] [CrossRef]
  6. Zhang, Y.P.; Li, W.; Lu, P.; Xu, T.Y.; Pan, K. Three preceding crops increased the yield of and inhibited clubroot disease in continuously monocropped Chinese cabbage by regulating the soil properties and rhizosphere microbial community. Microorganisms 2022, 10, 799. [Google Scholar] [CrossRef]
  7. Bello, A.; Wang, B.; Zhao, Y.; Yang, W.; Ogundeji, A.; Deng, L.T.; Egbeagu, U.U.; Yu, S.; Zhao, L.Y.; Li, D.T.; et al. Composted biochar affects structural dynamics, function and co-occurrence network patterns of fungi community. Sci. Total Environ. 2021, 775, 145672. [Google Scholar] [CrossRef]
  8. Balami, S.; Vašutová, M.; Košnar, J.; Karkic, R.; Khadkab, C.; Tripathid, G.; Cudlínb, P. Soil fungal communities in abandoned agricultural land has not yet moved towards the seminatural forest. For. Ecol. Manag. 2021, 491, 119181. [Google Scholar] [CrossRef]
  9. Hagenbo, A.; Alday, J.G.; Aragon, J.M.; Castano, C.; De-Miguel, S.; Bonet, J.A. Variations in biomass of fungal guilds are primarily driven by factors related to soil conditions in Mediterranean Pinus pinaster forests. Biol. Fertil. Soils 2022, 58, 487–501. [Google Scholar] [CrossRef]
  10. Vidal, C.; González, F.; Santander, C.; Perez, R.; Gallardo, V.; Santos, C.; Aponte, H.; Ruiz, A.; Cornejo, P. Management of rhizosphere microbiota and plant production under drought stress: A comprehensive review. Plants 2022, 11, 2437. [Google Scholar] [CrossRef]
  11. Edwards, J.A.; Santos-Medellin, C.M.; Liechty, Z.S.; Nguyen, B.; Lurie, E.; Eason, H.; Phillips, G.; Sundaresan, V. Compositional shifts in root-associated bacterial and archaeal microbiota track the plant life cycle in fifield-grown rice. PLoS Biol. 2018, 16, e2003862. [Google Scholar] [CrossRef] [PubMed] [Green Version]
  12. Alzandi, A.A.; Naguib, D.M. Effect of Yeast Application on soil health and root metabolic status of corn seedlings under drought stress. Arch. Microbiol. 2022, 204, 233. [Google Scholar] [CrossRef] [PubMed]
  13. Tarroum, M.; Ben Romdhane, W.; Ali, A.A.M.; Al-Qurainy, F.; Al-Doss, A.; Fki, L.; Hassairi, A. Harnessing the rhizosphere of the halophyte grass Aeluropus littoralis for halophilic plant-growth-promoting fungi and evaluation of their biostimulant activities. Plants 2021, 10, 784. [Google Scholar] [CrossRef] [PubMed]
  14. Zhang, H.H.; Xi, J.S.; Lv, Q.; Wang, J.W.; Yu, K.; Zhao, F.Y. Effect of aerated irrigation on the growth and rhizosphere soil fungal community structure of greenhouse grape seedlings. Sustainability 2022, 14, 12719. [Google Scholar] [CrossRef]
  15. Cai, J.; Zhang, J.; Ding, Y.; Yu, S.; Lin, H.X.; Yuan, Z.Q.; Li, K.M.; Ou, W.J.; Chen, S.B. Different fertilizers applied alter fungal community structure in rhizospheric soil of cassava (Manihot esculenta Crantz) and increase crop yield. Front. Microbiol. 2021, 12, 3781. [Google Scholar] [CrossRef]
  16. Goomaral, A.; Iwase, K.; Undarmaa, J.; Matsumoto, T.; Yamato, M. Communities of arbuscular mycorrhizal fungi in Stipa krylovii (Poaceae) in the Mongolian steppe. Mycoscience 2013, 54, 122–129. [Google Scholar] [CrossRef]
  17. Guo, X.; Gong, J. Difffferential effffects of abiotic factors and host plant traits on diversity and community composition of root-colonizing arbuscular mycorrhizal fungi in a salt-stressed ecosystem. Mycorrhiza 2014, 24, 79–94. [Google Scholar] [CrossRef]
  18. Estrada, B.; Beltrán-Hermoso, M.; Palenzuela, J.; Iwase, K.; Ruiz-Lozano, J.M.; Barea, J.M.; Oehl, F. Diversity of arbuscular mycorrhizal fungi in the rhizosphere of Asteriscus maritimus Less., a representative plant species in arid and saline Mediterranean ecosystems. J. Arid Environ. 2013, 97, 170–175. [Google Scholar] [CrossRef]
  19. Torrecillas, E.; Torres, P.; Alguacil, M.M.; Querejeta, J.I.; Roldan, A. Influence of habitat and climate variables on arbuscular mycorrhizal fungus community distribution, as revealed by a case study of facultative plant epiphytism under semiarid conditions. Appl. Environ. Microbiol. 2013, 79, 7203–7209. [Google Scholar] [CrossRef] [Green Version]
  20. Chandrasekaran, M.; Boughattas, S.; Hu, S.J.; Oh, S.H.; Sa, T.M. A meta-analysis of arbuscular mycorrhizal effects on plants grown under salt stress. Mycorrhiza 2014, 24, 611–625. [Google Scholar] [CrossRef]
  21. Bencherif, K.; Boutekrabt, A.; Fontaine, J.; Laruelle, F.; Dalpe, Y.; Sahraoui, A.L.H. Impact of soil salinity on arbuscular mycorrhizal fungi biodiversity and microflora biomass associated with Tamarix articulata Vahll rhizosphere in arid and semi-arid Algerian areas. Sci. Total Environ. 2015, 533, 488–494. [Google Scholar] [CrossRef] [PubMed]
  22. Baum, C.; El-Tohamy, W.; Gruda, N. Increasing the productivity and product quality of vegetable crops using arbuscular mycorrhizal fungi: A review. Sci. Hortic. 2015, 187, 131–141. [Google Scholar] [CrossRef]
  23. Chang, Y.L.; Peng, M.W.; Chu, G.M.; Wang, M. Genome-wide assessment of population structure and genetic diversity for Anabasis aphylla based on specific length amplification fragment sequencing. J. Plant Interact. 2020, 15, 75–82. [Google Scholar] [CrossRef] [Green Version]
  24. Chang, Y.L.; Xia, Y.; Peng, M.W.; Chu, G.M.; Wang, M. Maxent modelling for predicting impacts of climate change on the potential distribution of Anabasis aphylla in Northwestern China. Appl. Ecol. Environ. Res. 2020, 18, 1637–1648. [Google Scholar] [CrossRef]
  25. Zhang, L.J.; Yue, M.; Zhang, Y.D.; Gu, F.X.; Pan, X.L. Characteristics of plant community species diversity of oasis desert ecotone in Fukang, Xinjiang. Sci. Geogr. Sin. 2003, 23, 229–333. (In Chinese) [Google Scholar]
  26. Chu, G.M.; Wang, M.; Zhang, S.X. Spatial patterns and associations of dominant woody species in desert–oasis ecotone of South Junggar Basin, NW China. J. Plant Interact. 2014, 9, 738–744. [Google Scholar] [CrossRef]
  27. Jiao, Y.L.; Chu, G.M.; Yang, Z.A.; Wang, Y.; Wang, M. Bacterial Diversity in the rhizosphere of Anabasis aphylla in the Gurbantunggut Desert, China. Curr. Microbiol. 2020, 77, 3750–3759. [Google Scholar] [CrossRef] [PubMed]
  28. Zhang, B.G.; Zhang, J.; Liu, Y.; Guo, Y.Q.; Shi, P.; Wei, G.H. Biogeography and ecological processes affecting root-associated bacterial communities in soybean fields across China. Sci. Total Environ. 2018, 627, 20–27. [Google Scholar] [CrossRef]
  29. Ge, Y.L.; Sun, T. Soil microbial community structure and diversity of potato in rhizosphere and non-rhizosphere soil. Ecol. Environ. Sci. 2020, 29, 141–148. [Google Scholar]
  30. Shakya, M.; Quince, C.; Campbell, J.H.; Yang, Z.M.K.; Schadt, C.W.; Podar, M. Comparative metagenomic and rRNA microbial diversity characterization using archaeal and bacterial synthetic communities. Environ. Microbiol. 2013, 15, 1882–1899. [Google Scholar] [CrossRef]
  31. Lundberg, D.S.; Lebeis, S.L.; Paredes, S.H.; Yourstone, S.; Gehring, J.; Malfatti, S.; Tremblay, J.; Engelbrektson, A.; Kunin, V.; del Rio, T.G.; et al. Defining the core Arabidopsis thaliana root microbiome. Nature 2012, 488, 86–90. [Google Scholar] [CrossRef] [PubMed] [Green Version]
  32. Qiao, Q.H.; Zhang, J.X.; Ma, C.L.; Wang, F.R.; Chen, Y.; Zhang, C.Y.; Zhang, H.; Zhangid, J. Characterization and variation of the rhizosphere fungal community structure of cultivated tetraploid cotton. PLoS ONE 2019, 14, e0207903. [Google Scholar] [CrossRef] [PubMed]
  33. Gqozo, M.P.; Bill, M.; Siyoum, N.; Labuschagne, N.; Korsten, L. Fungal diversity and community composition of wheat rhizosphere and non-rhizosphere soils from three different agricultural production regions of South Africa. Appl. Soil Ecol. 2020, 151, 103543. [Google Scholar] [CrossRef]
  34. Edwards, J.; Johnson, C.; Santos-Medellín, C.; Lurie, E.; Podishetty, N.K.; Bhatnagar, S.; Eisen, J.A.; Sundaresan, V. Structure, variation, and assembly of the root-associated microbiomes of rice. Proc. Natl. Acad. Sci. USA 2015, 112, 911–920. [Google Scholar] [CrossRef] [Green Version]
  35. Rodriguez, P.A.; Rothballer, M.; Chowdhury, S.P.; Nussbaumer, T.; Gutjahr, C.; Falter-Braun, P. Systems biology of plant-microbiome interactions. Mol. Plant 2019, 12, 804–821. [Google Scholar] [CrossRef] [Green Version]
  36. Fonseca-Garcia, C.; Coleman-Derr, D.; Garrido, E.; Visel, A.; Tringe, S.G.; Partida-Martinez, L.P. The cacti microbiome: Interplay between habitat-filtering and host-specificity. Front. Microbiol. 2016, 7, 150. [Google Scholar] [CrossRef] [Green Version]
  37. Taschen, E.; Amenc, L.; Tournier, E.; Deleporte, P.; Malagoli, P.; Fustec, J.; Bru, D.; Philippot, L.; Bernard, L. Cereal-legume intercropping modifies the dynamics of the active rhizospheric bacterial community. Rhizosphere 2017, 3, 191–195. [Google Scholar] [CrossRef]
  38. Luo, Y.F.; Wang, Z.K.; He, Y.L.; Li, G.F.; Lv, X.H.; Zhuang, L. High-throughput sequencing analysis of the rhizosphere arbuscular mycorrhizal fungi (AMF) community composition associated with Ferula Sink. BMC Microbiol. 2020, 20, 335. [Google Scholar] [CrossRef]
  39. Abu Hanif, M.; Guo, Z.M.; Moniruzzaman, M.; He, D.; Yu, Q.S.; Rao, X.Q.; Liu, S.P.; Tan, X.P.; Shen, W.J. Plant taxonomic diversity better explains soil fungal and bacterial diversity than functional diversity in restored forest ecosystems. Plants Basel 2019, 8, 479. [Google Scholar] [CrossRef] [Green Version]
  40. Yang, W.; Zhang, D.; Cai, X.W.; Xia, L.; Luo, Y.Q.; Cheng, X.L.; An, S.Q. Significant alterations in soil fungal communities along a chronosequence of Spartina alterniflora invasion in a Chinese Yellow Sea coastal wetland. Sci. Total Environ. 2019, 693, 133548. [Google Scholar] [CrossRef]
  41. Urbanová, M.; Šnajdr, J.; Baldrian, P. Composition of fungal and bacterial communities in forest litter and soil is largely determined by dominant trees. Soil Biol. Biochemistry 2015, 84, 53–64. [Google Scholar] [CrossRef]
  42. Maestre, F.T.; Delgado-Baquerizo, M.; Jeffries, T.C.; Eldridge, D.J.; Ochoa, V.; Gozalo, B.; Quero, J.L.; Garcia-Gomez, M.; Gallardo, A.; Ulrich, W.; et al. Increasing aridity reduces soil microbial diversity and abundance in global drylands. Proc. Natl. Acad. Sci. USA 2015, 112, 15684–15689. [Google Scholar] [CrossRef] [PubMed]
  43. Tedersoo, L.; Bahram, M.; Polme, S.; Koljalg, U.; Yorou, N.S.; Wijesundera, R.; Ruiz, L.V.; Vasco-Palacios, A.M.; Thu, P.Q.; Suiga, A.; et al. Global diversity and geography of soil fungi. Science 2014, 346, 1256688. [Google Scholar] [CrossRef] [PubMed] [Green Version]
  44. Poole, P.; Ramachandran, V.; Terpolilli, J. Rhizobia: From saprophytes to endosymbionts. Nat. Rev. Microbiol. 2018, 16, 291–303. [Google Scholar] [CrossRef] [PubMed]
  45. Kowalchuk, G.A.; Buma, D.S.; Boer, W.; Klinkhamer, P.G.L.; Veen, J.A. Effects of above-ground plant species composition and diversity on the diversity of soil-borne microorganisms. Antonie Van Leeuwenhoek Int. J. Gen. Mol. Microbiol. 2002, 81, 509–520. [Google Scholar] [CrossRef] [Green Version]
  46. Ziegler, M.; Engel, M.; Welzl, G.; Schloter, M. Development of a simple root model to study the effects of single exudates on the development of bacterial community structure. J. Microbiol. Methods 2013, 94, 30–36. [Google Scholar] [CrossRef]
  47. Chen, C.F.; Wu, S.R.; Qin, L.; Fan, Y.C.; Tan, L.; Guo, W.F. Soil microbial carbon source utilization and functional diversity of typical native broadleaved plantations in south subtropical Asia. Chin. J. Ecol. 2016, 35, 1132–1139. (In Chinese) [Google Scholar]
  48. Sessitsch, A.; Weilharter, A.; Gerzabek, M.H.; Kirchmann, H.; Kandeler, E. Microbial population structures in soil particle size fractions of a long-term fertilizer field experiment. Appl. Environ. Microbiol. 2001, 67, 4215–4224. [Google Scholar] [CrossRef] [Green Version]
  49. Wang, L.Y.; Zhou, G.N.; Zhu, X.Y.; Gao, B.J.; Xu, H.D. Effects of litter on soil organic carbon and microbial functional diversity. Acta Ecol. Sin. 2021, 41, 2709–2718. (In Chinese) [Google Scholar]
  50. Hao, X.X.; Han, X.Z.; Li, L.J.; Zou, W.X.; Lu, X.C.; Qiao, Y.F. Profile distribution and storage of soil organic carbon in a black soil as affected by land use types. Chin. J. Appl. Ecol. 2015, 26, 965–972. (In Chinese) [Google Scholar]
  51. Gao, L.Q.; Zhao, Y.G. Qin, N.Q.; Zhang, G.X. Effects of biological soil crust on soil erodibility in Hilly Loess Plateau Region of Northwest China. Chin. J. Appl. Ecol. 2013, 24, 105–112. (In Chinese) [Google Scholar]
  52. Yelle, D.J.; Ralph, J.; Lu, F.; Hammel, K.E. Evidence for cleavage of lignin by a brown rot basidiomycete. Environ. Microbiol. 2008, 10, 1844–1849. [Google Scholar] [CrossRef]
  53. Wu, X.; Zhang, T.; Zhao, J.; Wang, L.L.; Yang, D.L.; Li, G. Variation of soil bacterial and fungal communities from Fluvo-Aquic soil under chemical fertilizer reduction combined with organic materials in North China plain. J. Soil Sci. Plant Nutr. 2020, 21, 349–363. [Google Scholar] [CrossRef]
  54. Yang, L.; Yang, Y.Q.; Shen, F.; Tian, D.; Zeng, Y.M.; Yang, G.; Zhang, Y.Z.; Deng, S.H. Partitioning biochar properties to elucidate their contributions to bacterial and fungal community composition of purple soil. Sci. Total Environ. 2019, 648, 1333–1341. [Google Scholar]
  55. Guo, J.J.; Liu, W.B.; Zhu, C.; Luo, G.W.; Kong, Y.L.; Ling, N.; Wang, M.; Dai, J.Y.; Shen, Q.R.; Guo, S.W. Bacterial rather than fungal community composition is associated with microbial activities and nutrient-use efficiencies in a paddy soil with short-term organic amendments. Plant Soil 2018, 424, 335–349. [Google Scholar] [CrossRef]
  56. Liu, G.Y.; Chen, L.L.; Shi, X.R.; Yuan, Z.Y.; Yuan, L.Y.; Lock, T.R.; Kallenbach, R.L. Changes in rhizosphere bacterial and fungal community composition with vegetation restoration in planted forests. Land Degrad. Dev. 2019, 30, 1147–1157. [Google Scholar] [CrossRef]
  57. Ye, G.P.; Lin, Y.X.; Luo, J.F.; Di, H.J.; Lindsey, S.; Liu, D.; Fan, J.; Ding, W. Responses of soil fungal diversity and community composition to long-term fertilization: Field experiment in an acidic Ultisol and literature synthesis. Appl. Soil Ecol. 2020, 145, 103305. [Google Scholar] [CrossRef]
  58. Ibekwe, A.M.; Poss, J.A.; Grattan, S.R.; Grieve, C.M.; Suarez, D. Bacterial diversity in cucumber (Cucumis sativus) rhizosphere in response to salinity, soil pH, and boron. Soil Biol. Biochem. 2010, 42, 567–575. [Google Scholar] [CrossRef]
  59. Nie, M.; Zhang, X.D.; Wang, J.Q.; Jiang, L.F.; Yang, J.; Quan, Z.X.; Cui, X.H.; Fang, C.M.; Li, B. Rhizosphere effects on soil bacterial abundance and diversity in the Yellow River Deltaic ecosystem as influenced by petroleum contamination and soil salinization. Soil Biol. Biochem. 2009, 41, 2535–2542. [Google Scholar] [CrossRef]
  60. Zhang, L.F.; Wu, F.Z.; Zhou, X.G.; Yang, P. Effects of ucumber root exudates on soil nutrients and enzyme activities under salt stress. China Veg. 2009, 14, 6–11. (In Chinese) [Google Scholar]
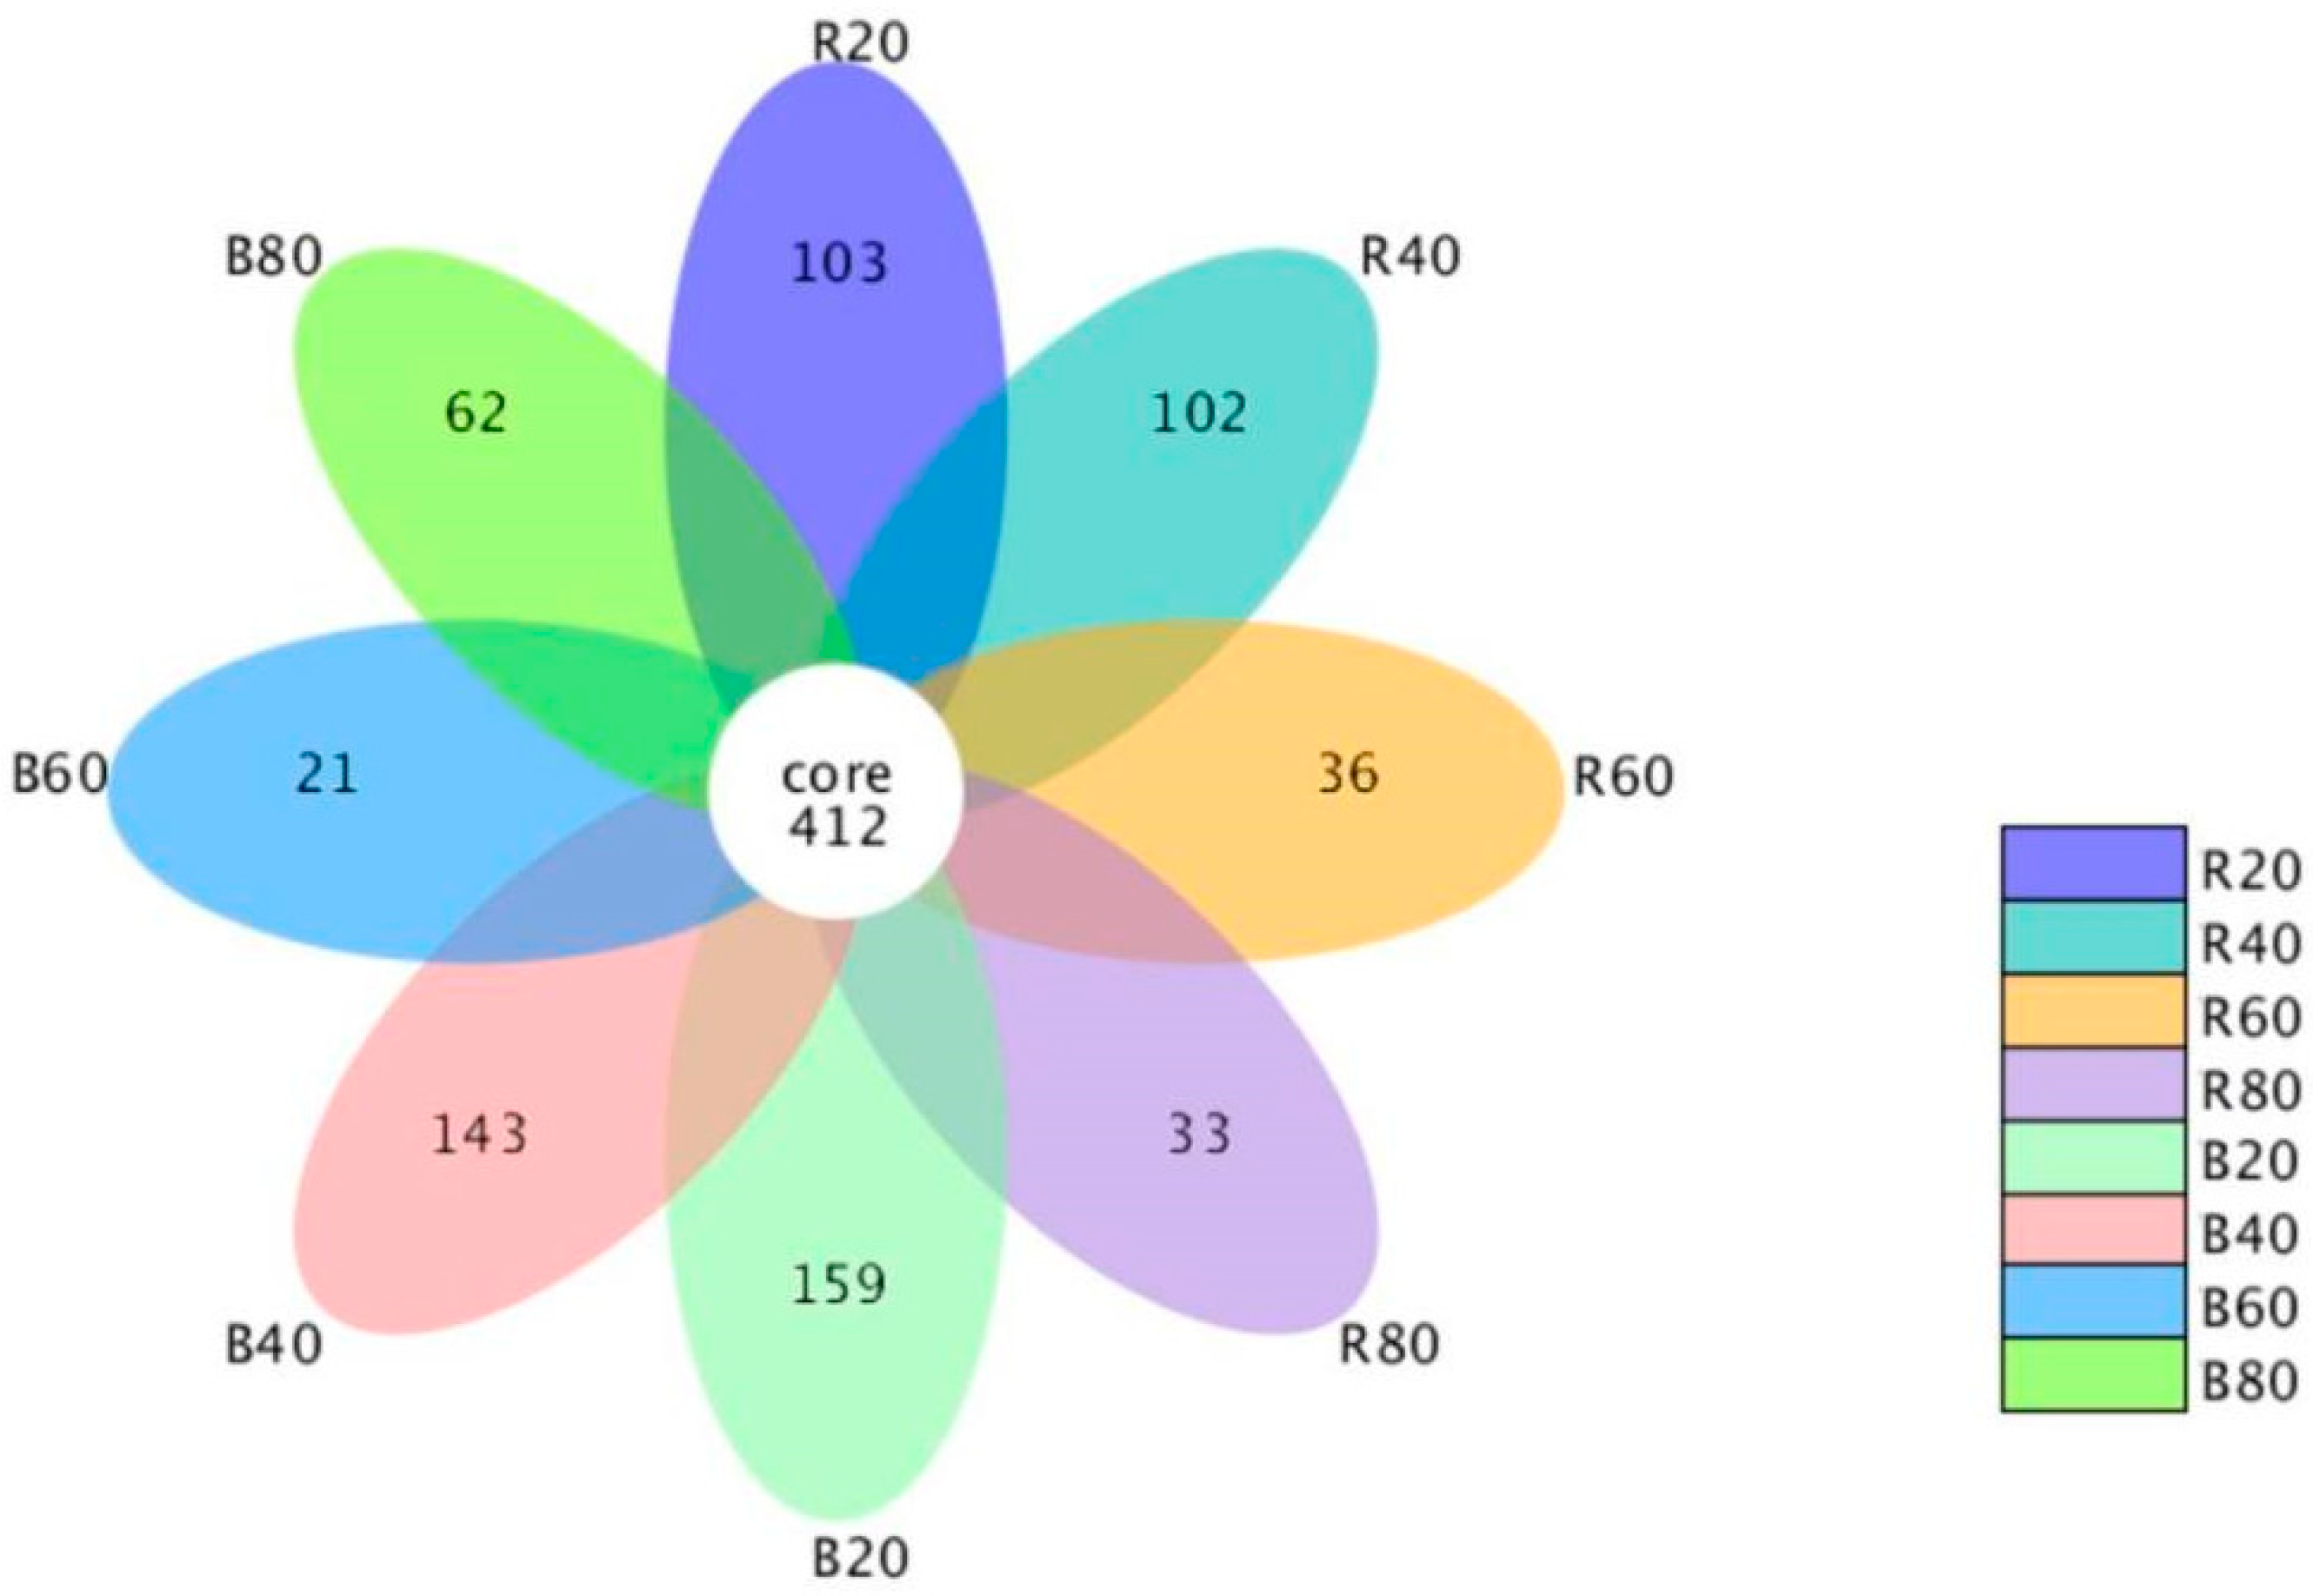
Figure 1. The OTUs flower diagram of rhizosphere soil (R20–R80) and bulk soil (B20–B80) of A. aphylla. Each petal indicates a sample; petals of different colors indicate different samples. The digit in the center of this flower indicates the quantity of OTUs public to all soil samples whereas the digit on each petal indicates the quantity of unique OTUs in each soil sample. The numbers 20, 40, 60, and 80 (headed by either R or B) each represent the soil layer (0–20, 20–40, 40–60, and 60–80 cm).
Sustainability 14 15423 g001
Figure 2. Relative abundance of soil fungus in rhizosphere soil (R20–R80) as well as bulk soil (B20–B80) of A. aphylla in fungal phylum level (a) and fungal genus level (b). The soil samples’ name is shown by the abscissa, and the relative abundance is indicated by the ordinate. The term ‘Others’ refers to the total relative abundances of all fungi, with the ten most abundant fungi at each phylum level being excluded from this calculation. The numbers 20, 40, 60, and 80 (headed by either R or B) each represent the soil layer (0–20, 20–40, 40–60, and 60–80 cm).
Sustainability 14 15423 g002
Figure 3. The UPGMA cluster tree of the soil fungal community (left) and relative abundance of the soil fungal community in phylum level (right) in rhizosphere soil (R20–R80) and bulk soil (B20–B80) of A. aphylla. The numbers 20, 40, 60, and 80 (headed by either R or B) each represent the soil layer (0–20, 20–40, 40–60, and 60–80 cm).
Sustainability 14 15423 g003
Figure 4. Heat map of beta diversity index among fungal communities in rhizosphere soil (R20–R80) and bulk soil (B20–B80) of A. aphylla. The numbers 20, 40, 60, and 80 (preceded by R or B) indicate the soil layer (0–20, 20–40, 40–60, and 60–80 cm).
Sustainability 14 15423 g004
Figure 5. Histogram of the distribution of LDA values of A. aphylla. Discrepancies are shown by the coloration of the most luxuriant taxa (red indicating bulk soil of 20–40 cm soil layer and blue indicating rhizosphere soil of 20–40 cm soil layer).
Sustainability 14 15423 g005
Figure 6. Evolutionary branching diagram of A. aphylla. Discrepancies are shown by the coloration of the most luxuriant taxa (red indicating bulk soil of 20–40 cm soil layer and blue indicating rhizosphere soil of 20–40 cm soil layer).
Sustainability 14 15423 g006
Figure 7. The canonical correspondence analysis (CCA) comparing the community structure of soil fungus and physicochemical parameters in rhizosphere soil (R20–R80) and bulk soil (B20–B80) of A. aphylla. The arrows represent the soil physicochemical parameters, and the distance of the arrows shows the level of association between the soil physicochemical parameters and the fungal community structure. The numbers 20, 40, 60, and 80 (headed by either R or B) each represent the soil layer (0–20, 20–40, 40–60, and 60–80 cm).
Sustainability 14 15423 g007
Figure 8. The heat map of correlations between the 35 main fungal classes and soil physicochemical properties. The corresponding value (r) on the heat map falls somewhere in the range of −1 to 1. When r is greater than zero, it suggests a positive relationship, and when it is less than zero, it signifies a negative correlation; a standard * indicates significance at p < 0.05, and a standard ** means significance at p < 0.01.
Sustainability 14 15423 g008
Publisher’s Note: MDPI stays neutral with regard to jurisdictional claims in published maps and institutional affiliations.