Article

Standard Identification Certificate for Legal Legislation of a Unique Gene Pool of Thai Domestic Elephants Originating from a Male Elephant Contribution to Breeding

by
Nattakan Ariyaraphong
1,2,3,†,
Dung Ho My Nguyen
1,2,3,†,
Worapong Singchat
1,3,‡,
Warong Suksavate
1,3,
Thitipong Panthum
1,3,4,
Warangkhana Langkaphin
5,
Saran Chansitthiwet
5,
Taweepoke Angkawanish
5,
Arphorn Promking
6,
Kantapon Kaewtip
6,
Kitipong Jaisamut
1,3,
Syed Farhan Ahmad
1,3,7,
Suchin Trirongjitmoah
6,
Narongrit Muangmai
1,3,8,
Orasa Taesumrith
5,
Suratchai Inwiset
5,
Prateep Duengkae
1,3 and
Kornsorn Srikulnath
1,2,3,4,7,9,*,‡
1
Animal Genomics and Bioresources Research Unit (AGB Research Unit), Faculty of Science, Kasetsart University, 50 Ngamwongwan, Chatuchak, Bangkok 10900, Thailand
2
Laboratory of Animal Cytogenetics and Comparative Genomics (ACCG), Department of Genetics, Faculty of Science, Kasetsart University, 50 Ngamwongwan, Chatuchak, Bangkok 10900, Thailand
3
Special Research Unit for Wildlife Genomics (SRUWG), Department of Forest Biology, Faculty of Forestry, Kasetsart University, 50 Ngamwongwan, Chatuchak, Bangkok 10900, Thailand
4
Interdisciplinary Graduate Program in Bioscience, Faculty of Science, Kasetsart University, Chatuchak, Bangkok 10900, Thailand
5
National Elephant Institute, Forest Industry Organization, Lampang 52190, Thailand
6
Department of Electrical and Electronics Engineering, Faculty of Engineering, Ubon Ratchathani University, 85 Sathonlamark, Warinchamrab, Ubon Ratchathani 34190, Thailand
7
The International Undergraduate Program in Bioscience and Technology, Faculty of Science, Kasetsart University, Chatuchak, Bangkok 10900, Thailand
8
Department of Fishery Biology, Faculty of Fisheries, Kasetsart University, Chatuchak, Bangkok 10900, Thailand
9
Amphibian Research Center, Hiroshima University, Kagamiyama, Higashihiroshima 739-8526, Japan
*
Author to whom correspondence should be addressed.
These authors contributed equally to this work.
These authors joint last author.
Sustainability 2022, 14(22), 15355; https://doi.org/10.3390/su142215355
Submission received: 24 September 2022 / Revised: 1 November 2022 / Accepted: 8 November 2022 / Published: 18 November 2022

Abstract

:
Illegal wildlife trade is a major threat to global biodiversity. Asian elephants (Elephas maximus) are highly valued by various cultures as religious symbols and tourist attractions, which has led to a high demand for captive elephants. Owing to the unviability of captive breeding programs, several captive elephant populations are maintained by illegally obtaining wild Asian elephants. Morbidity and mortality rates among captive populations are high, whereas reproduction is low. In this study, we examined the genetic diversity among elephants using microsatellite genotyping and mitochondrial D-loop sequences of three captive elephant populations. The study results showed very low nucleotide diversity D-loop sequences and high variations in microsatellite genotyping, with an extensive variation of the gene pool estimates from different populations. This suggests that the optimal male selection during breeding could aid in maintaining the genetic diversity among captive populations. Forward genetic simulation revealed a decreasing genetic diversity in the fixed state within 50 generations. However, largely different gene pools can be effectively used to infer original elephant sources; this would facilitate the development of an identification certificate integration with machine learning and image processing to prevent illegal legislation owing to registration fraud between wild and domestic elephants. Implementing the proposed approaches and recommendations would aid in the mitigation of the illegal capture and domestic trade of wild elephants in Thailand and contribute to the success of future conservation plans in the blueprint of sustainable development goals.

1. Introduction

The Asian elephant (Elephas maximus, Linnaeus, 1758) [1] is the largest terrestrial mammal in Asia and has a high ecological significance for soil features, landscape patchiness, and plant biomass and diversity [2,3,4]. Asian elephant populations cover the West to South and Southeast Asia [5,6,7], and currently accounts for 15% of its historical range with total population size estimates of 40,000–50,000 as fragmented populations, owing to anthropogenic impacts, including poaching, habitat loss, and conflicts with humans [8]. The Asian elephant is listed as an ‘endangered’ species in the International Union for Conservation of Nature (IUCN) red list [9] and effective conservation management is urgently needed to prevent further population decline. Manual action plans require information on population sizes, age structure, and genetic diversity [10,11]. In 2017, the total elephant population in Thailand was estimated to range from 6000 to 7000, with 3500 to 3800 being captive and 3000 to 3700 in 69 protected areas throughout the country [9,12,13]. However, this population is declining; the loss of forest habitat in forest reserve areas, due to agriculture and illegal logging, and illegal poaching for ivory and elephant calves have exposed elephant subpopulations to threats, such as human exploitation and human-elephant conflict situations [14].
Conflicts between humans and wild elephants have increased, owing to habitat overlaps, resulting in an exponential increase in the elephant mortality rate [15]. Both wild and captive elephants have unique sets of legal regulations in Thailand that differ from those of other countries [16]. Wild Asian elephants are now protected under the Wildlife Protection Act of 1992, which is updated regularly [16]; capturing, killing, and injuring elephants are prohibited. However, the illegal capture and trade of wild elephants within Thailand and in other countries to support tourism in Thailand, continues to be a significant concern [16,17,18]. The elephants are smuggled and sold to tourist elephant camps and management programs for captive-born elephants in Thailand [19]. Thailand is currently the center of elephant tourism and large numbers of captive elephants are utilized [20]. According to the National Institute of Elephant Research and Health Service, in collaboration with the Department of Livestock Development, there were 2700 elephants in 250 tourist venues throughout the country in 2017 [16,21]. To prevent the illegal capture of wild elephants to cater to the Thai tourism industry, the Department of Livestock Development, Ministry of Agriculture and Cooperatives, the Department of Provincial Administration, Ministry of Interior, and the Department of National Parks, Wildlife and Plant Conservation, Ministry of Natural Resources have agreed to jointly create a register, conduct a census, assign microchips, and collect DNA fingerprints for all captive elephants [16]. This has compelled tourist camps to maintain elephant numbers. The aforementioned system entails recording the general appearance of each elephant on a registration card with a microchip number. However, the inefficient management of the system has facilitated the falsification of elephant records and transfer of microchips among both wild and captive elephants. Furthermore, the cost of microchip implantation is high [16,22]. Owing to registration fraud with respect to wild and domesticated elephants, there are approximately 2900 captive elephants in Thailand, despite the current number of related microchips being 3825 [23,24]. Assuming the parents of the calves are dead, means that the existing elephants are born to captive female elephants. This presents a significant discrepancy with respect to the status of the wild elephant in that their sex and physical appearances are inconsistent with the information in their identification certificates [23]. For the captive adult elephant, fraudulent identification can be caused by assigning the unsurrendered identification of a dead elephant. Therefore, reliable and practical regulatory measures, such as DNA fingerprinting, should be adopted to mitigate the reduction of the elephant population. Remarkably, machine learning (ML) has been previously adopted in several wildlife management activities [25,26,27]. ML models are trained by collecting, cataloging, or labeling animal images to learn to recognize individuals by developing machine learning and computer vision. This ML approach can be used to register elephants in Thailand.
In addition to illegal capture, inbreeding has caused a reduction in elephant numbers in Thailand; low birth weight, high mortality rate at birth, and low fertility at puberty are prevalent among elephants [28,29]. The proportion of relatively old elephants in captive populations is high, while the rate of reproduction is increasingly dropping [12]. Toin et al. [30] found that the reproductive rates of captive elephants in Northern Thailand range between <1 and 3.5 elephants per year, and observed a high mortality rate, particularly among male elephants [12]. Many elephants from captive camps are sub-fertile and only a few are used for mating in each camp and are occasionally transferred to other camps for mating and reproduction [12,31]. This is postulated to increase the probability of inbreeding. However, a high genetic diversity, with significant transfer rates among tourist camps, was observed among captive elephants [28,32,33]. This implies the frequent transfer of elephants among tourist camps and indicates the significance of the frequent assessment of the genetic diversity for the evaluation of breeding programs and to support legal legislation [28,34,35,36]. Genetic research and the development of techniques for conservation and camp management are urgently required to develop a practical action plan for preventing registration fraud and to allow for image processing and deep learning. To investigate the genetic variability in captive populations, the monitoring of captive elephant populations in several camps was addressed by screening genetic variations, using a combination of microsatellite genotyping and mitochondrial D-loop (mt D-loop) sequencing. We tested the following hypotheses: (1) high genetic variables are observed among captive elephant populations in tourist camps, owing to the significant rate of elephant transfers among camps and (2) effective parental stocks distributed across camps result in a low genetic variation among captive individuals. High inbreeding coefficients should be derived from the second hypothesis. Diversity, population structure, historic demography, forward genetic simulation, and paternity testing were investigated to provide references for future management activity. Individual identification, using genetic tools and ML was then implemented as the pilot model to create identification certificates with legal legislation for more optimized comparison of different elephant individuals.

2. Materials and Methods

2.1. Specimen Collection and DNA Extraction

A total of 158 individual elephant were sampled in three captive camps. The detailed information on the sampled individuals is presented in Table S1. Blood samples were collected from the jugular vein of the captive elephants registered by the National Elephant Institute of Thailand (NEI, Lampang; 18°21′35.5″ N 99°14′52.9″ E), Maetaeng Elephant Park (MEP, Chiang Mai; 19°11′54.2″ N 98°53′14.9″ E), and Baan Chang Elephant Park (BCEP, Chiang Mai; 19°07′29.0″ N 98°53′38.7″ E) between October 2020 and November 2021, using an 18-gauge needle attached to a 5 mL disposable syringe containing 10 mM ethylenediaminetetraacetic acid. MEP and BCEP are tourist camps with large numbers of elephants. The owners determined the number of specimens that could be obtained from each camp. Total genomic DNA was extracted from the blood following the standard phenol-chloroform-isoamylalcohol protocol, described by Srikulnath et al. [37], and used as the template for microsatellite genotyping and mt D-loop sequencing. The sex of each individual was identified by morphological observation [38]. Permission was granted by Kasetsart University, NEI (approval no. 1400/476), MEP (no. 6501.0901/3349), and BCEP (no. 6501.0901/3968). Animal care and all experimental procedures were approved by the Animal Experiment Committee, Kasetsart University (Bangkok, Thailand; Approval No. ACKU63-SCI-017), and conducted in accordance with the Regulations on Animal Experiments at Kasetsart University.

2.2. Microsatellite Genotyping

Eighteen microsatellite primer sets were sourced from the studies conducted by Comstock et al. [39] and Archie et al. [40], having been originally developed from Loxodonta africana africana (Table S2). The cross-species amplification of microsatellite primers is frequently performed in conservation and in genetic and biodiversity research [40,41,42,43,44,45,46,47]. The 5′-end of the forward primer of each set of primers was labeled with a fluorescent dye (6-FAM or HEX; Macrogen Inc., Seoul, Korea). The polymerase chain reaction (PCR) amplification was performed using 15 μL of 1× ThermoPol buffer containing 1.5 mM MgCl2, 0.2 mM dNTPs, 5.0 μM primers, 0.5 U Taq polymerase (Apsalagen Co., Ltd., Bangkok, Thailand), and 25 ng genomic DNA. The PCR protocol was as follows: initial denaturation at 94 °C for 3 min, followed by 35 cycles of 94 °C for 30 s, 52–61 °C for 30 s, and 72 °C for 30 s, with a final extension at 72 °C for 10 min (Table S2). The PCR products were detected by electrophoresis in 1% agarose gel. To decrease the influence of false alleles, the PCR amplification was performed at least three times for each sample. The absence of PCR products was also checked, using 1% agarose gel electrophoresis after the PCR. The fluorescent DNA fragment length analysis was subsequently performed using an ABI 3730XL automatic sequencer (Applied Biosystems, Foster City, CA, USA) at the DNA sequencing service of Macrogen Inc. The allelic size was determined using Peak Scanner software version 1.0 (Applied Biosystems). The genotypic data generated in this study were deposited in the Dryad Digital Repository Dataset: https://datadryad.org/stash/share/dg2SMl_JQlGgjz6pOWuCRiaOr2C29QZanghBB0t5iBc (accessed on 10 August 2022).

2.3. Microsatellite Data Analysis

We followed the same approaches as those used in our previous study on other animals [40,44,45,46,47]. The allelic frequency, the number of alleles (A), the effective number of alleles (Na), the observed heterozygosity (Ho), the expected heterozygosity (He), the linkage equilibrium, the deviations from the Hardy–Weinberg equilibrium, Welch’s t-test, the allelic richness (AR), the mean number of the effective alleles, the identified null allelic markers, the polymorphic information content (PIC), Shannon’s information index (I), and the fixation index (F) were calculated for each locus of the population. The effective population size (Ne) was estimated as the number of breeding individuals that contributed to the population, using the linkage disequilibrium method. The details were previously described by Jangtarwan et al. [45]. To consider the possibility of siblings or parent-offspring pairs in the captive population, we determined whether the Asian elephants were more related than random unrelated individuals. The relatedness values (r) were calculated for all pairs (comprising female-female, male-male, and male-female pairs), and mean pairwise r values, based on the allelic frequencies in the population, were calculated in captivity using GenAlEx version 6.5 [48]. The distributions of the pairwise r values between all pairs from the sampled captivities were compared by a bootstrap version of the Kolmogorov–Smirnov test to provide relationships [49], using the “ks.test” function in the package stats of R version 4.1.2 [50]. The same approach was adopted for the comparison of the inbreeding coefficients (FIS) among captivities and the individual and overall FIS, with 95% confidence intervals (CIs). The parentage analysis determined the probability of two individuals sharing the same genotype. Individuals who shared alleles from their putative parents at all loci, were considered actual offspring of the pair. Cases in which the pairing failed to match any of the two alleles of the putative parents at two or more loci, were considered new wild individuals. The details of the methods used were previously described by Jangtarwan et al. [45].
The pairwise genetic distances among populations were calculated, based on the infinite allele model (IAM), using FST in Arlequin version 3.5.2.2. with the corrected p values, and the stepwise mutation model (SMM) using RST in FSTAT version 2.9.3 [51]. To consider the possible influences of null alleles on the genetic differentiation estimates, the FreeNA program [52] was run, thereby providing the pairwise FSTENA values with the ENA correction for the null alleles. To elucidate the group structure, an analysis of molecular variance (AMOVA) was performed using Arlequin 3.5.2.2. Unlike FST, this algorithm identifies the subgroup hierarchical structure and does not require a priori assumption of the Hardy–Weinberg equilibrium. Nei’s genetic distances between the groups were then examined using GenAlEx version 6.5 [53]. The state of heterozygosity excess and the shift in the allelic frequency distributions in the genetically bottlenecked populations were tested using Bottleneck version 1.2.02 [54]. The Wilcoxon signed-rank test, with a two-phased model of mutation (TPM) and SMM, was used to obtain the probabilities for the excess levels of heterozygosity, owing to the small sample sizes of the loci. The TPM was carried out with 95% single-step mutations and 5% multistep mutations, with a variance among the multiple steps set at 12. This test detects the relatively short-term bottleneck events. To test for the relatively long-term bottleneck events, the M ratio test [55] was performed using Arlequin version 3.5.2.2. The M ratio is the mean number of alleles in a population divided by the allelic size range, and indicates the reductions in both recent and historical population sizes.
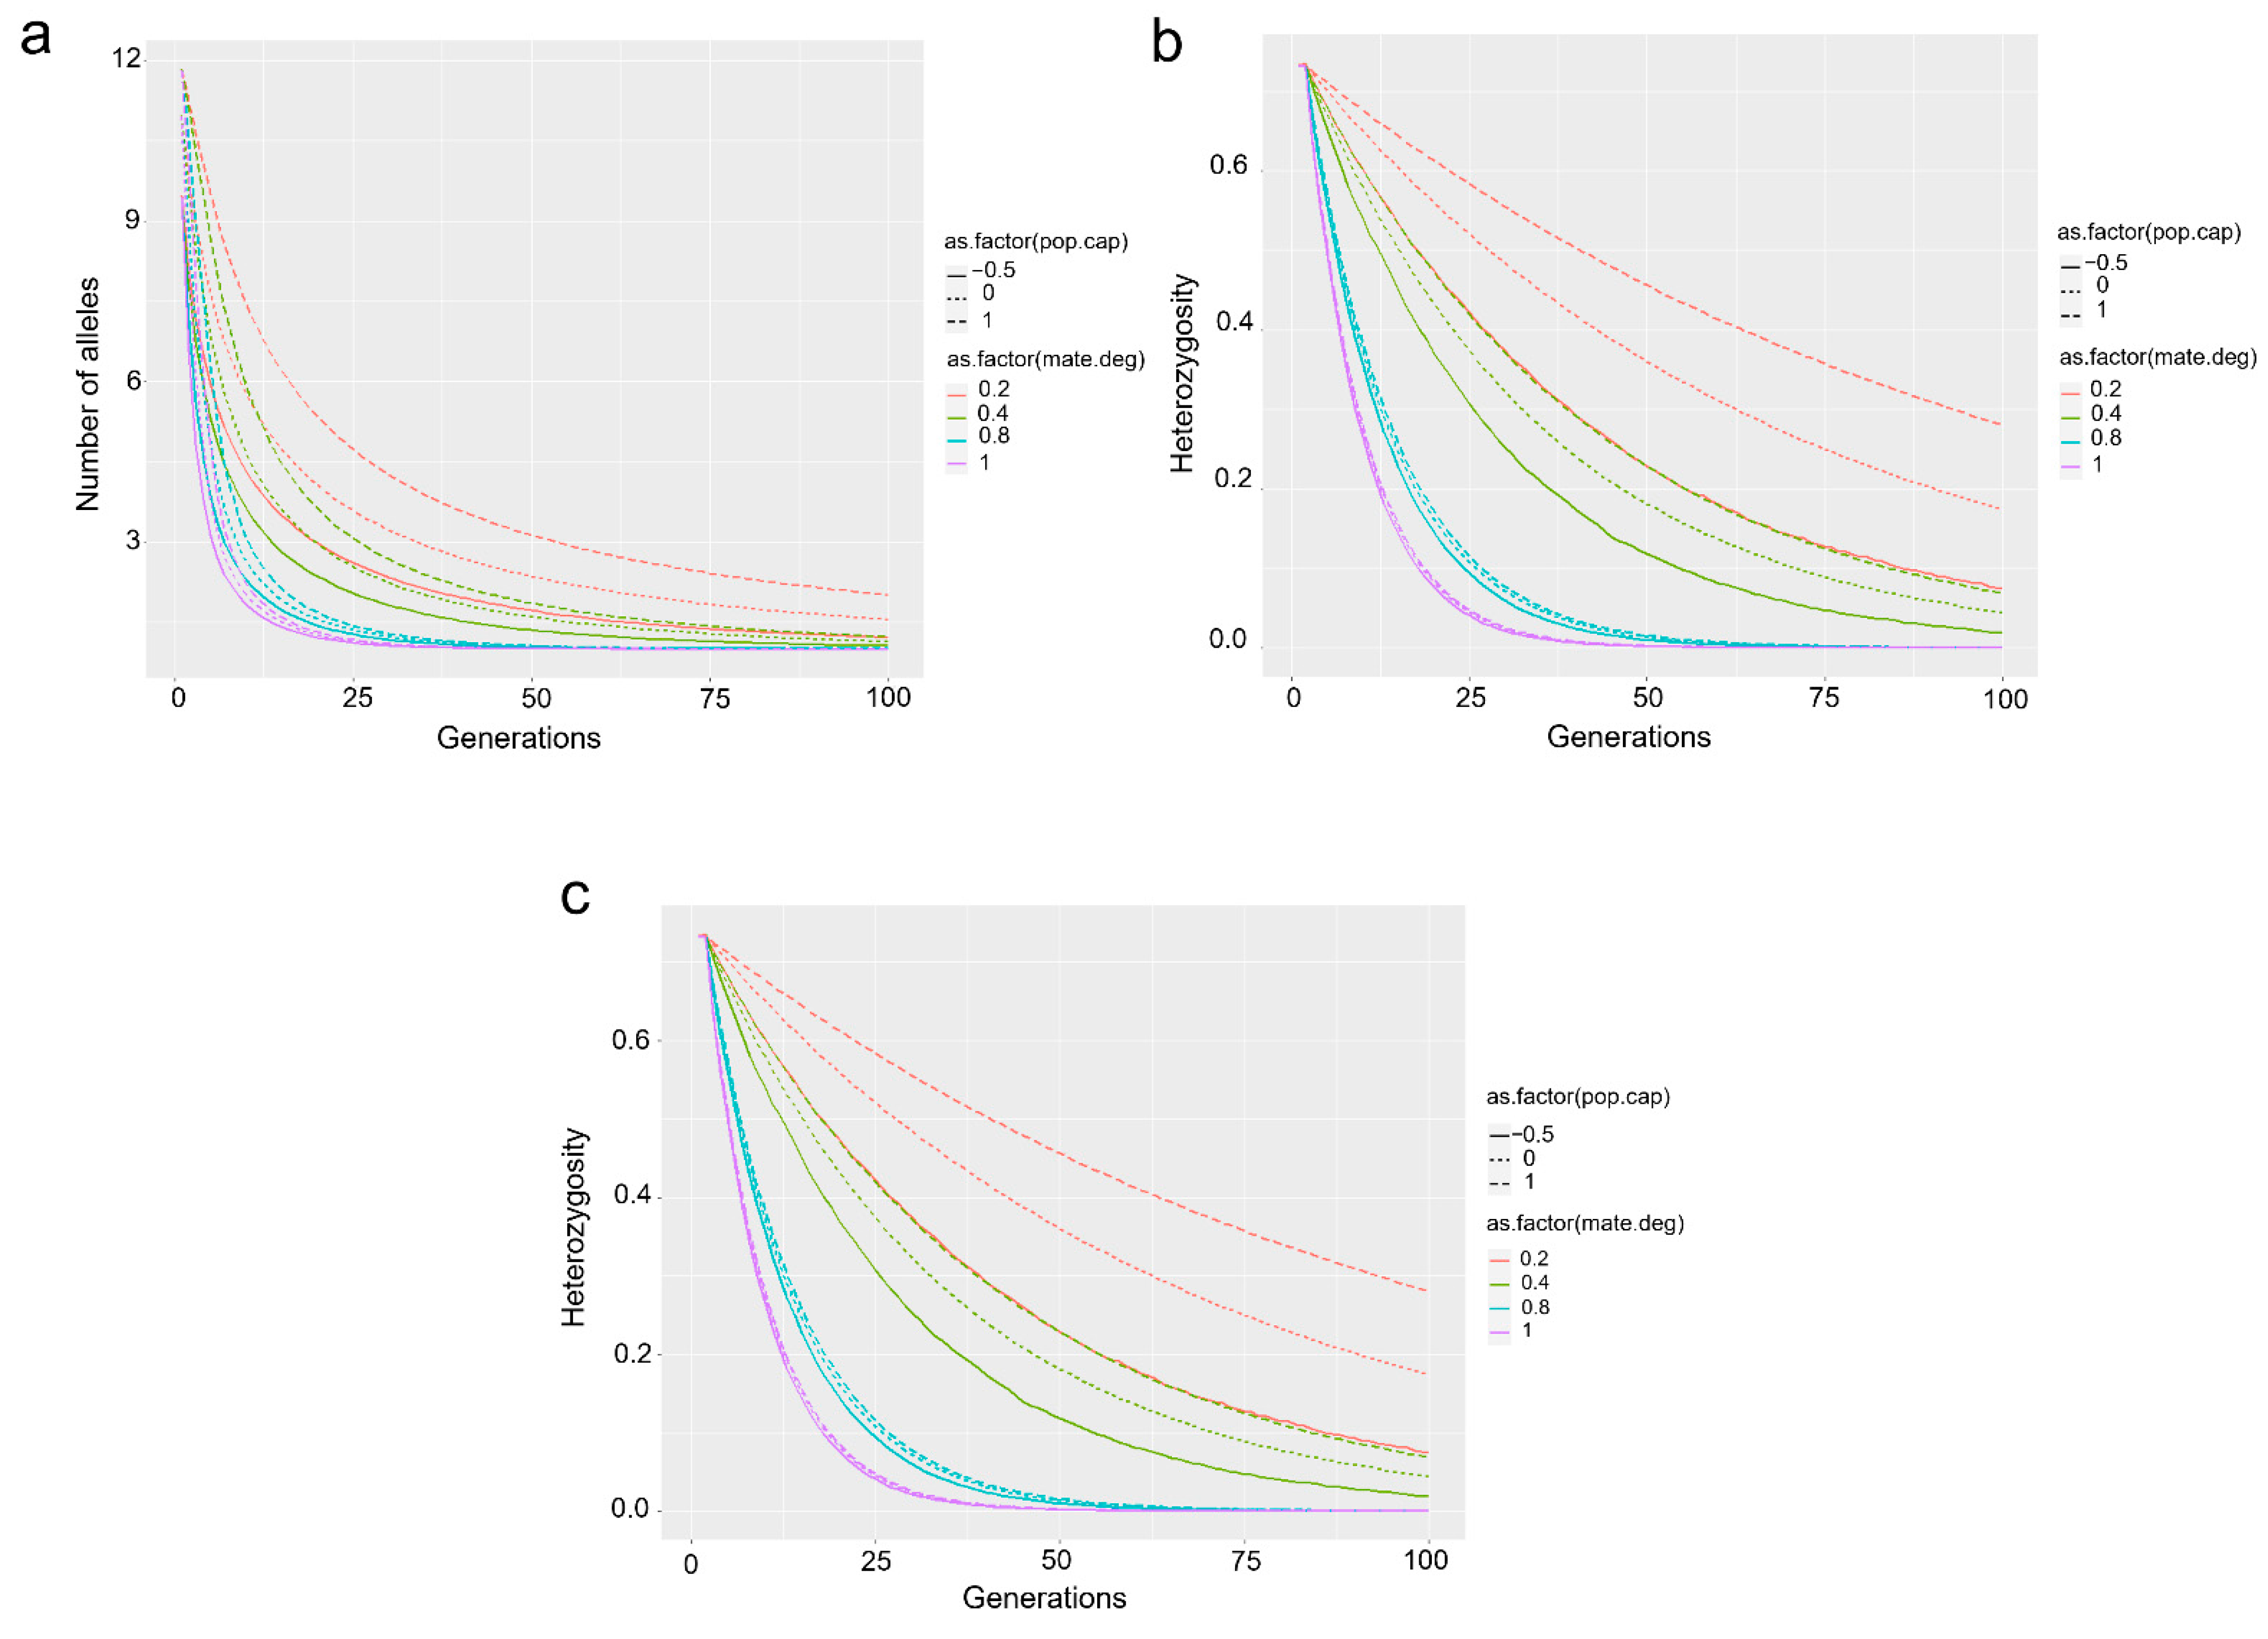
The principal coordinates analysis (PCoA) was performed to assess the overall relationship across individuals in the captive population, using GenAlEx version 6.5. The analysis of the principal components (DAPC) was performed using the package ADEGENET 2.0 [56] in R 4.1.2 [50]. The DAPC makes no assumptions about the population models [56]. It defines the synthetic variables where the genetic variation is maximized between clusters of individuals (K) and minimized within the clusters. The details of the model-based clustering method implemented in STRUCTURE, were described by Jangtarwan et al. [45]. To simulate the future genetic and demographic scenarios of the population, we performed individual-based forward genetic simulations in the simulation program quantiNEMO [57], using individual-based genotypic data input. The simulation presented the fitness of the captive population by estimating the future genetic variation and diversity [58]. This study used twelve scenarios, including a combination of three scenarios from the carrying capacity (50% decreased population size, fixed at the current population size, and 100% increased population size), and four scenarios from the proportion of polygyny (0.2, 0.4, 0.8, and 1.0), owing to the captive selection practice in the breeding population) with one mating male [59]. Each simulation was run for 100 generations for 1000 replications, assuming a substitution rate of 3.5% per million years [5].

2.4. Mitochondrial D-Loop Sequencing

The mt D-loop sequences were selected as a suitable region for estimating the genetic variability of the elephants [60] using primers MDL3 (5′-CCCACAATTAATGGGCCCGGAGCG-3′) and MDL5 (5′-TTACATGAATTGGCAGCCAACCAG-3′). Each PCR amplification was performed using 15 μL of 1 × ThermoPol® buffer that contained 1.5 mM MgCl2, 0.2 mM dNTPs, 5.0 μM primers, 0.5 U Taq polymerase (Apsalagen Co., Ltd., Bangkok, Thailand), and 25 ng genomic DNA. The PCR conditions were as follows: the initial denaturation at 94 °C for 4 min, followed by 35 cycles of 94 °C for 30 s, 63 °C for 45 s, 72 °C for 30 s, and a final extension at 72 °C for 10 min. The PCR products were purified using the FavorPrep GEL/PCR Purification Mini Kit (Favorgen Biotech Corp., Ping-Tung, Taiwan). The nucleotide sequences of the DNA fragments were determined by the DNA sequencing service of First Base Laboratories Sdn Bhd (Seri Kembangan, Selangor, Malaysia). The BLASTn and BLASTx programs (http://blast.ncbi.nlm.nih.gov/Blast.cgi (accessed on 15 February 2022)) were used to search the nucleotide sequences in the National Center for Biotechnology Information database to confirm the identity of the amplified DNA fragments. The sequences generated were deposited in the DNA Data Bank of Japan (DDBJ) (Table S1).

2.5. Mitochondrial D-Loop Data Analysis

The multiple sequence alignment was performed for 94 sequences for each of the mt D-loop datasets, all unalignable, gap-containing sites, estimates of haplotype (h) and nucleotide (π) diversity, number of haplotypes, and average number of nucleotide differences were performed using the previous study method, as previously described by Wongtienchai et al., 2021 [47].
A statistical parsimony network of the consensus sequences and demographic history was determined, using the statistical test of neutrality, described by Wongtienchai et al. (2021) [47]. The Bayesian coalescent-based methods were then performed to evaluate the historical demographic fluctuations, using the extended Bayesian skyline plot (EBSP) method implemented in BEAUTi version 2.0.2 (part of the BEAST version 2.0.2 package) [61,62], by applying the HKY model, strict clock, and coalescent Bayesian skyline model with a prior Gamma distribution. For the mean substitution rate, the prior was set as a log normal distribution with a mean of 6.700%/million years and a standard deviation of 0.900%/million years to match the rate estimated from the fossil data [63,64]. TRACER (version 1.7.1. http://beast.community/tracer (accessed on 15 March 2022)) was used to assess the burn-in and the effective sample sizes (ESSs) of the parameters. The EBSP can fit different demographic scenarios by allowing changes in the population size over time.
To investigate the haplogroups of the elephant populations, multiple sequence alignments of 158 mt D-loop sequences were performed with eight representative reference sequences as elephant haplogroups, examined using MEGA (version 11 https://www.megasoftware.net/(accessed on 15 February 2022)) [65]. The representative sequences of Asian elephant mtDNA haplotypes α (GenBank accession numbers: AY589513, AY589516, AY589515, AY245822, AY245821, AY245820, AY245819, AY245818, and AY245817) and β (AY589514, AY589512, AY365433, AY365432, AY245823, AY245826, AY245825, AY245824, AY245816, AY245815, AY2458214, AY245813, AY245812, AY245811, AY245810, AY245809, AY245808, AY245807, AY245806, AY245805, AY245804, AY245803, AY245802, and AY245827) were used to construct the haplotype network and phylogenetic trees. The phylogenetic analysis was then performed using the Bayesian inference with MrBayes v3.2.7a [66]. The MCMC process was used to run four chains simultaneously for one million generations, sampling every 100 generations. The log-likelihood and parameter values were assessed using Tracers version 1.7.1 [67]. A burn-in of 25% of saved trees was removed, and the remaining trees were used to generate a majority-rule consensus tree with average branch lengths. The Bayesian posterior probability in the sampled tree population was obtained in percentage terms.

2.6. Convolutional Neural Networks

The image processing and deep learning were used to study the potential of using an automated system to identify individuals. Simple convolutional neural networks (CNNs) were employed as an image classification system, and were observed to perform well in the image recognition [68]. Because only the images of each elephant in the NEI were available, an image dataset was developed. The dataset contained images of 64 individual elephants, each with 10–111 pictures. For each elephant, ten pictures were manually selected to cover various postures to reduce any testing redundancy and bias. The number of pictures in the experimental dataset was 640; the number of classes was 64, and each class had ten samples. As shown in Figure S1, the images for each elephant were obtained using various cameras, lighting, angles, rotations, backgrounds, distances, and postures. The elephants appeared to be similar to each other from a layperson’s perspective and identifying individuals was considered to be challenging. A five-fold experimental setup was conducted where, for each fold and class, eight images were used for training; one was used for validation and the other for testing. The experiment was repeated with rotation, five times (Figure S2). High resolution images (2656 × 3984 pixels) were reduced to 128 × 128 pixels to cut down on the image dimensions. The number of training samples per class was limited and simple image processing techniques, such as rotation and scaling (zoom range), were used to generate additional image samples [69].
Simple CNNs were used as a classification engine where a batch of 128 × 128-pixel images was used to determine 64 classes, as shown in Figure S3. Four convolutional and max-pooling layers were used before flattening, and a fully convolutional layer before outputting the probability of each class. The first N highest probability values were then used to declare the top-N prediction. The top-N accuracy was commonly used to evaluate this type of classification, where it was acceptable to visualize a few images for the user to consider the first group of the most probable class labels, instead of just the top one, such as a mobile application for finding missing pets. Five hundred epochs and the L1 function were used for regularization.

3. Results

3.1. Genetic Variability of the Elephant Captive Population, Based on the Microsatellite Data

All captive individuals were genotyped and 487 alleles were observed among all loci, with the mean number of alleles, per locus, being 12.407 ± 1.029 (Table 1). All allelic frequencies showed significant departures from the Hardy–Weinberg equilibrium of the captive population, with multiple lines of evidence for a linkage disequilibrium (Tables S3–S5). The ability to detect significant departures from the Hardy–Weinberg equilibrium was limited, due to the small sample sizes; however, consistent patterns of deviation from the Hardy–Weinberg equilibrium or linkage equilibrium were not detected across sites. Consequently, the genetic analyses were performed, based on all microsatellite loci. Null alleles were frequently observed for 16 loci (LaT06, LaT08, LaT16, LaT13, LaT17, LaT24, LaT18, LaT25, LaT26, FH19, FH48, FH65, FH67, FH94, FH102, and FH103), and all markers listed were similarly treated. The MEP population exhibited negative F values but the NEI and BCEP populations exhibited positive ones. The PIC of all captive populations ranged from 0.410 to 0.949 and I ranged from 0.475 to 3.256 (Table S6). The Ho values ranged from 0.000 to 0.935 (mean ± standard error [SE]: 0.416 ± 0.041) and the He values ranged from 0.218 to 0.951 (mean ± SE: 0.745 ± 0.021) (Table 1 and Table S6). Welch’s t-test showed that Ho was significantly different from He in the NEI population (Ho = 0.329 ± 0.046, He = 0.769 ± 0.030, t = −8.012, df = −0.440, p < 0.05) and the BCEP population (Ho = 0.204 ± 0.055, He = 0.747 ± 0.037, t = −0.112, df = −0.543, p < 0.05), but not significantly in the MEP population (Ho = 0.714 ± 0.047, He = 0.721 ± 0.041, t = −8.192, df = −0.007, p = 0.910). When comparing the pairwise Ho between populations, the results showed statistical differences between the two pairs; NEI-MEP and MEP-BCEP. Conversely, all of the pairwise He values between populations were not different (Table 2). The AR value of the population was 12.407 ± 7.381. The standard genetic diversity indices are summarized in Table 1 and Table S4.
A pairwise test was performed to determine the level of relatedness between individuals in the captive elephant population. The mean pairwise r values of 12,403 elephant combination pairs among the 158 sampled individuals was −0.005 ± 0.032 (NEI population = −0.011 ± 0.040, MEP population = −0.012 ± 0.032, and BECP population = −0.023 ± 0.046). No pairs showed r < −0.25; there were 12,396 pairs with −0.25 < r < 0.25, and 7 pairs (NEI population = 2 pairs and BCEP population = 5 pairs) with 0.25 < r (Table 2 and Tables S7–S9). Distributions of r values for the Asian elephant were skewed to the left, indicating pairwise r values lower than expected by chance from a null hypothesis of unrelated individuals. Relative to Asian elephants from all populations, distributions of the pairwise r values from the NEI, MEP, and BCEP populations were significantly different from each other and the mean of the pairwise r values of all populations (Figure 1, Table S10). The mean FIS was 0.501 ± 0.176 (Table 3), with individual values of FIS ranging from −0.061 to 1.000 (Tables S11–S13). However, distributions of FIS from the NEI, MEP, and BCEP populations were significantly different from each other, while the FIS of the MEP population was mostly lower than zero (Figure 1, Table S10). The Ne for individuals that contributed genetically to the NEI population was 38.6 (95% CI: 33.8–199.1), 153.7 (95% CI: 95.2–245.6) for the MEP population, and 103.6 (95% CI: 73.0–217.3) for the BCEP population (Table 3). Simultaneously, the parentage analysis of the captive population individuals revealed approximately one-fifth of all elephants, at least 29 of the total number. No genetic evidence of extra-pair paternity was found (Tables S14–S17). All paternities were assigned unequivocally. No parent-offspring pairs among the different populations were observed. The combined likelihood of rejection for the microsatellites utilized, was evaluated at 0.95. The probability of two elephants conveying an indistinguishable genotype was calculated to be 0.1051 (Tables S18–S20).
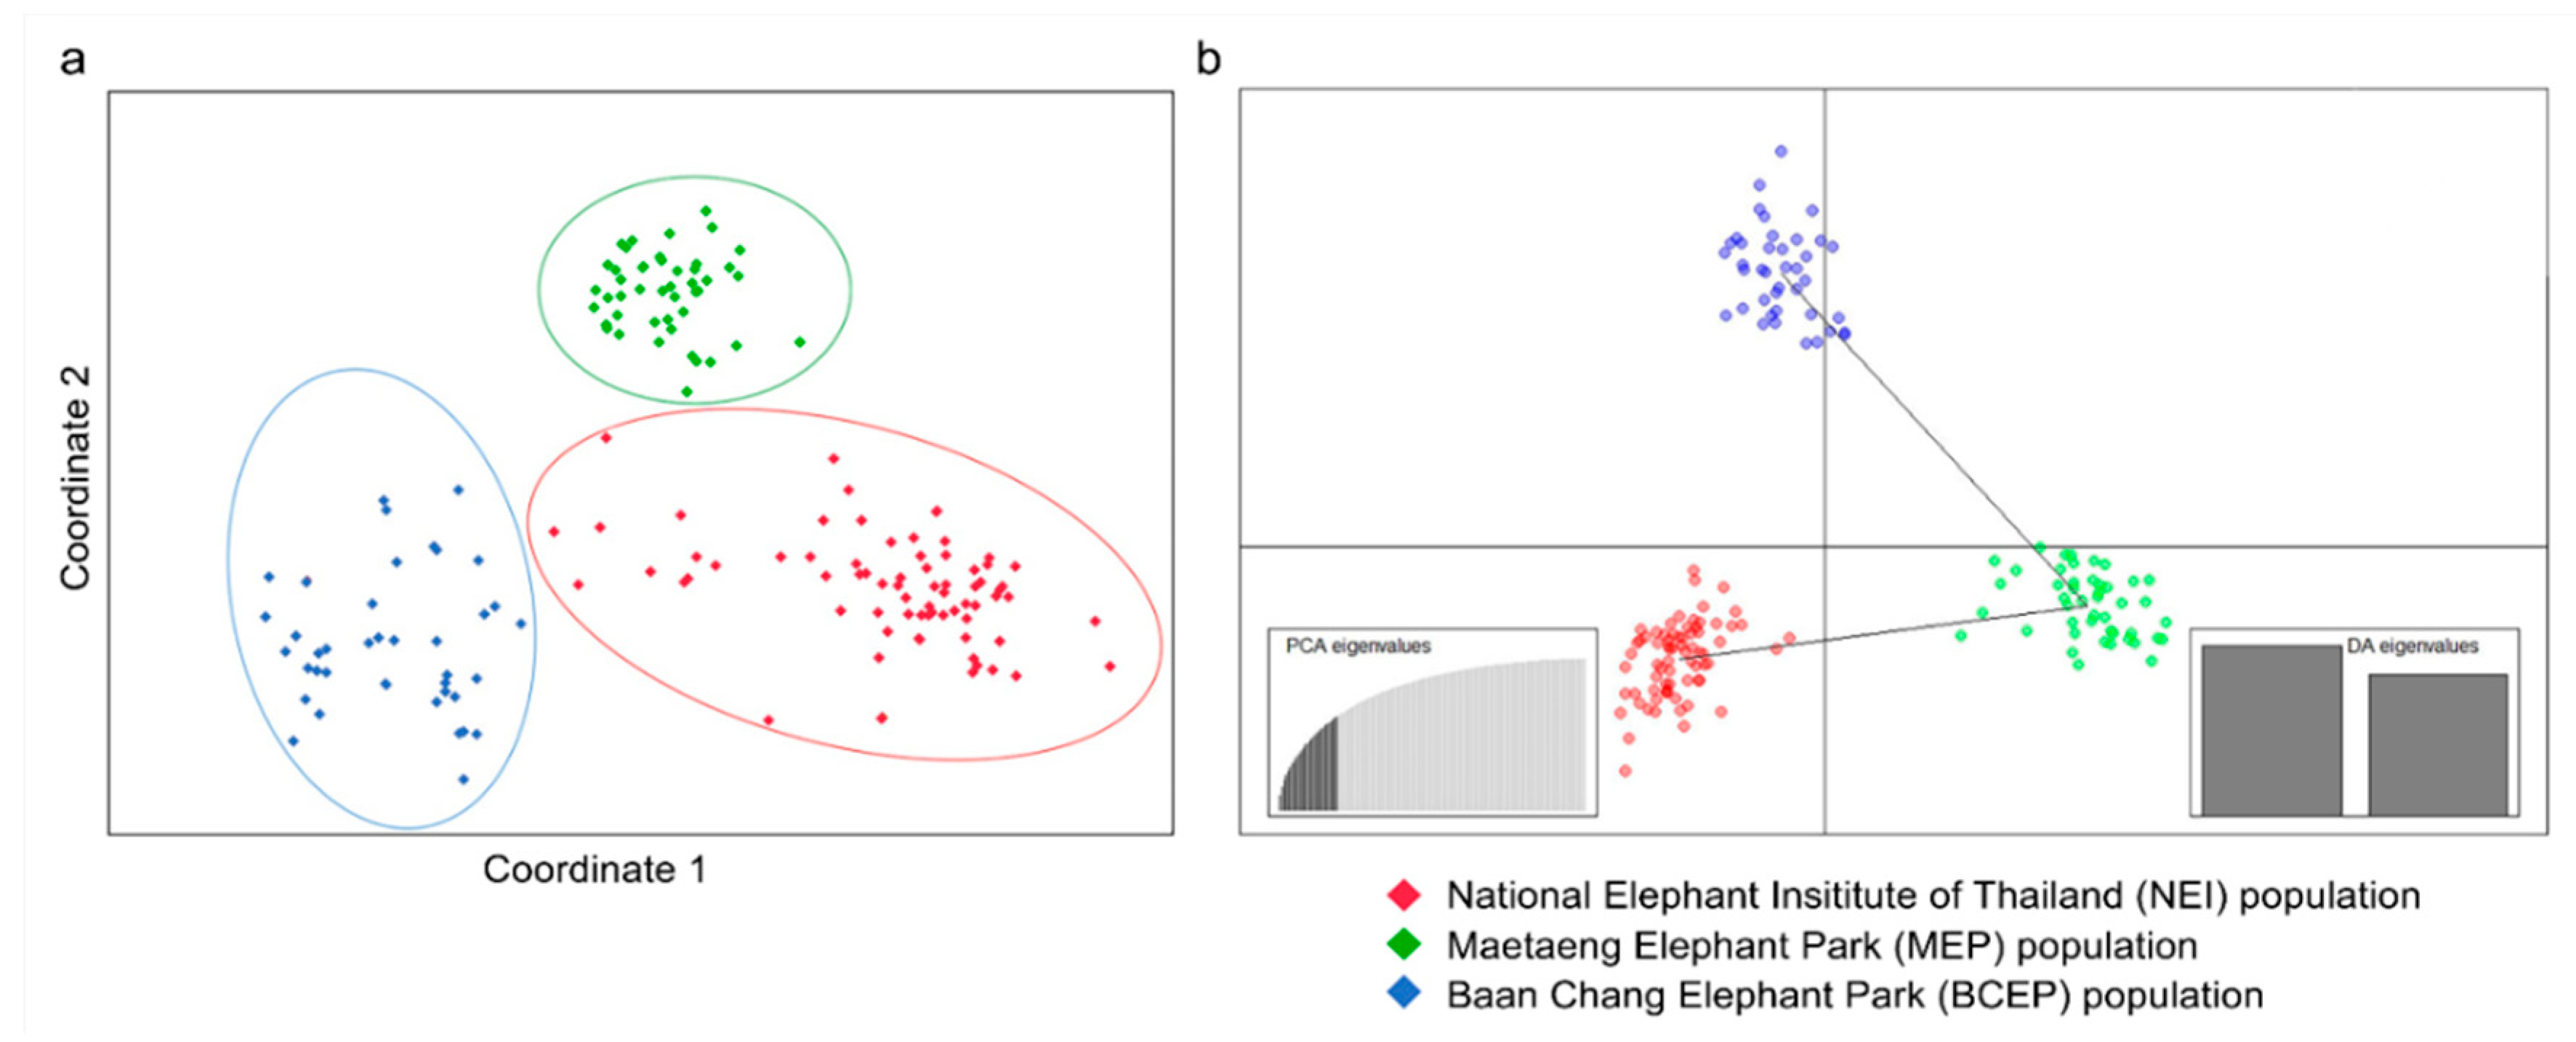
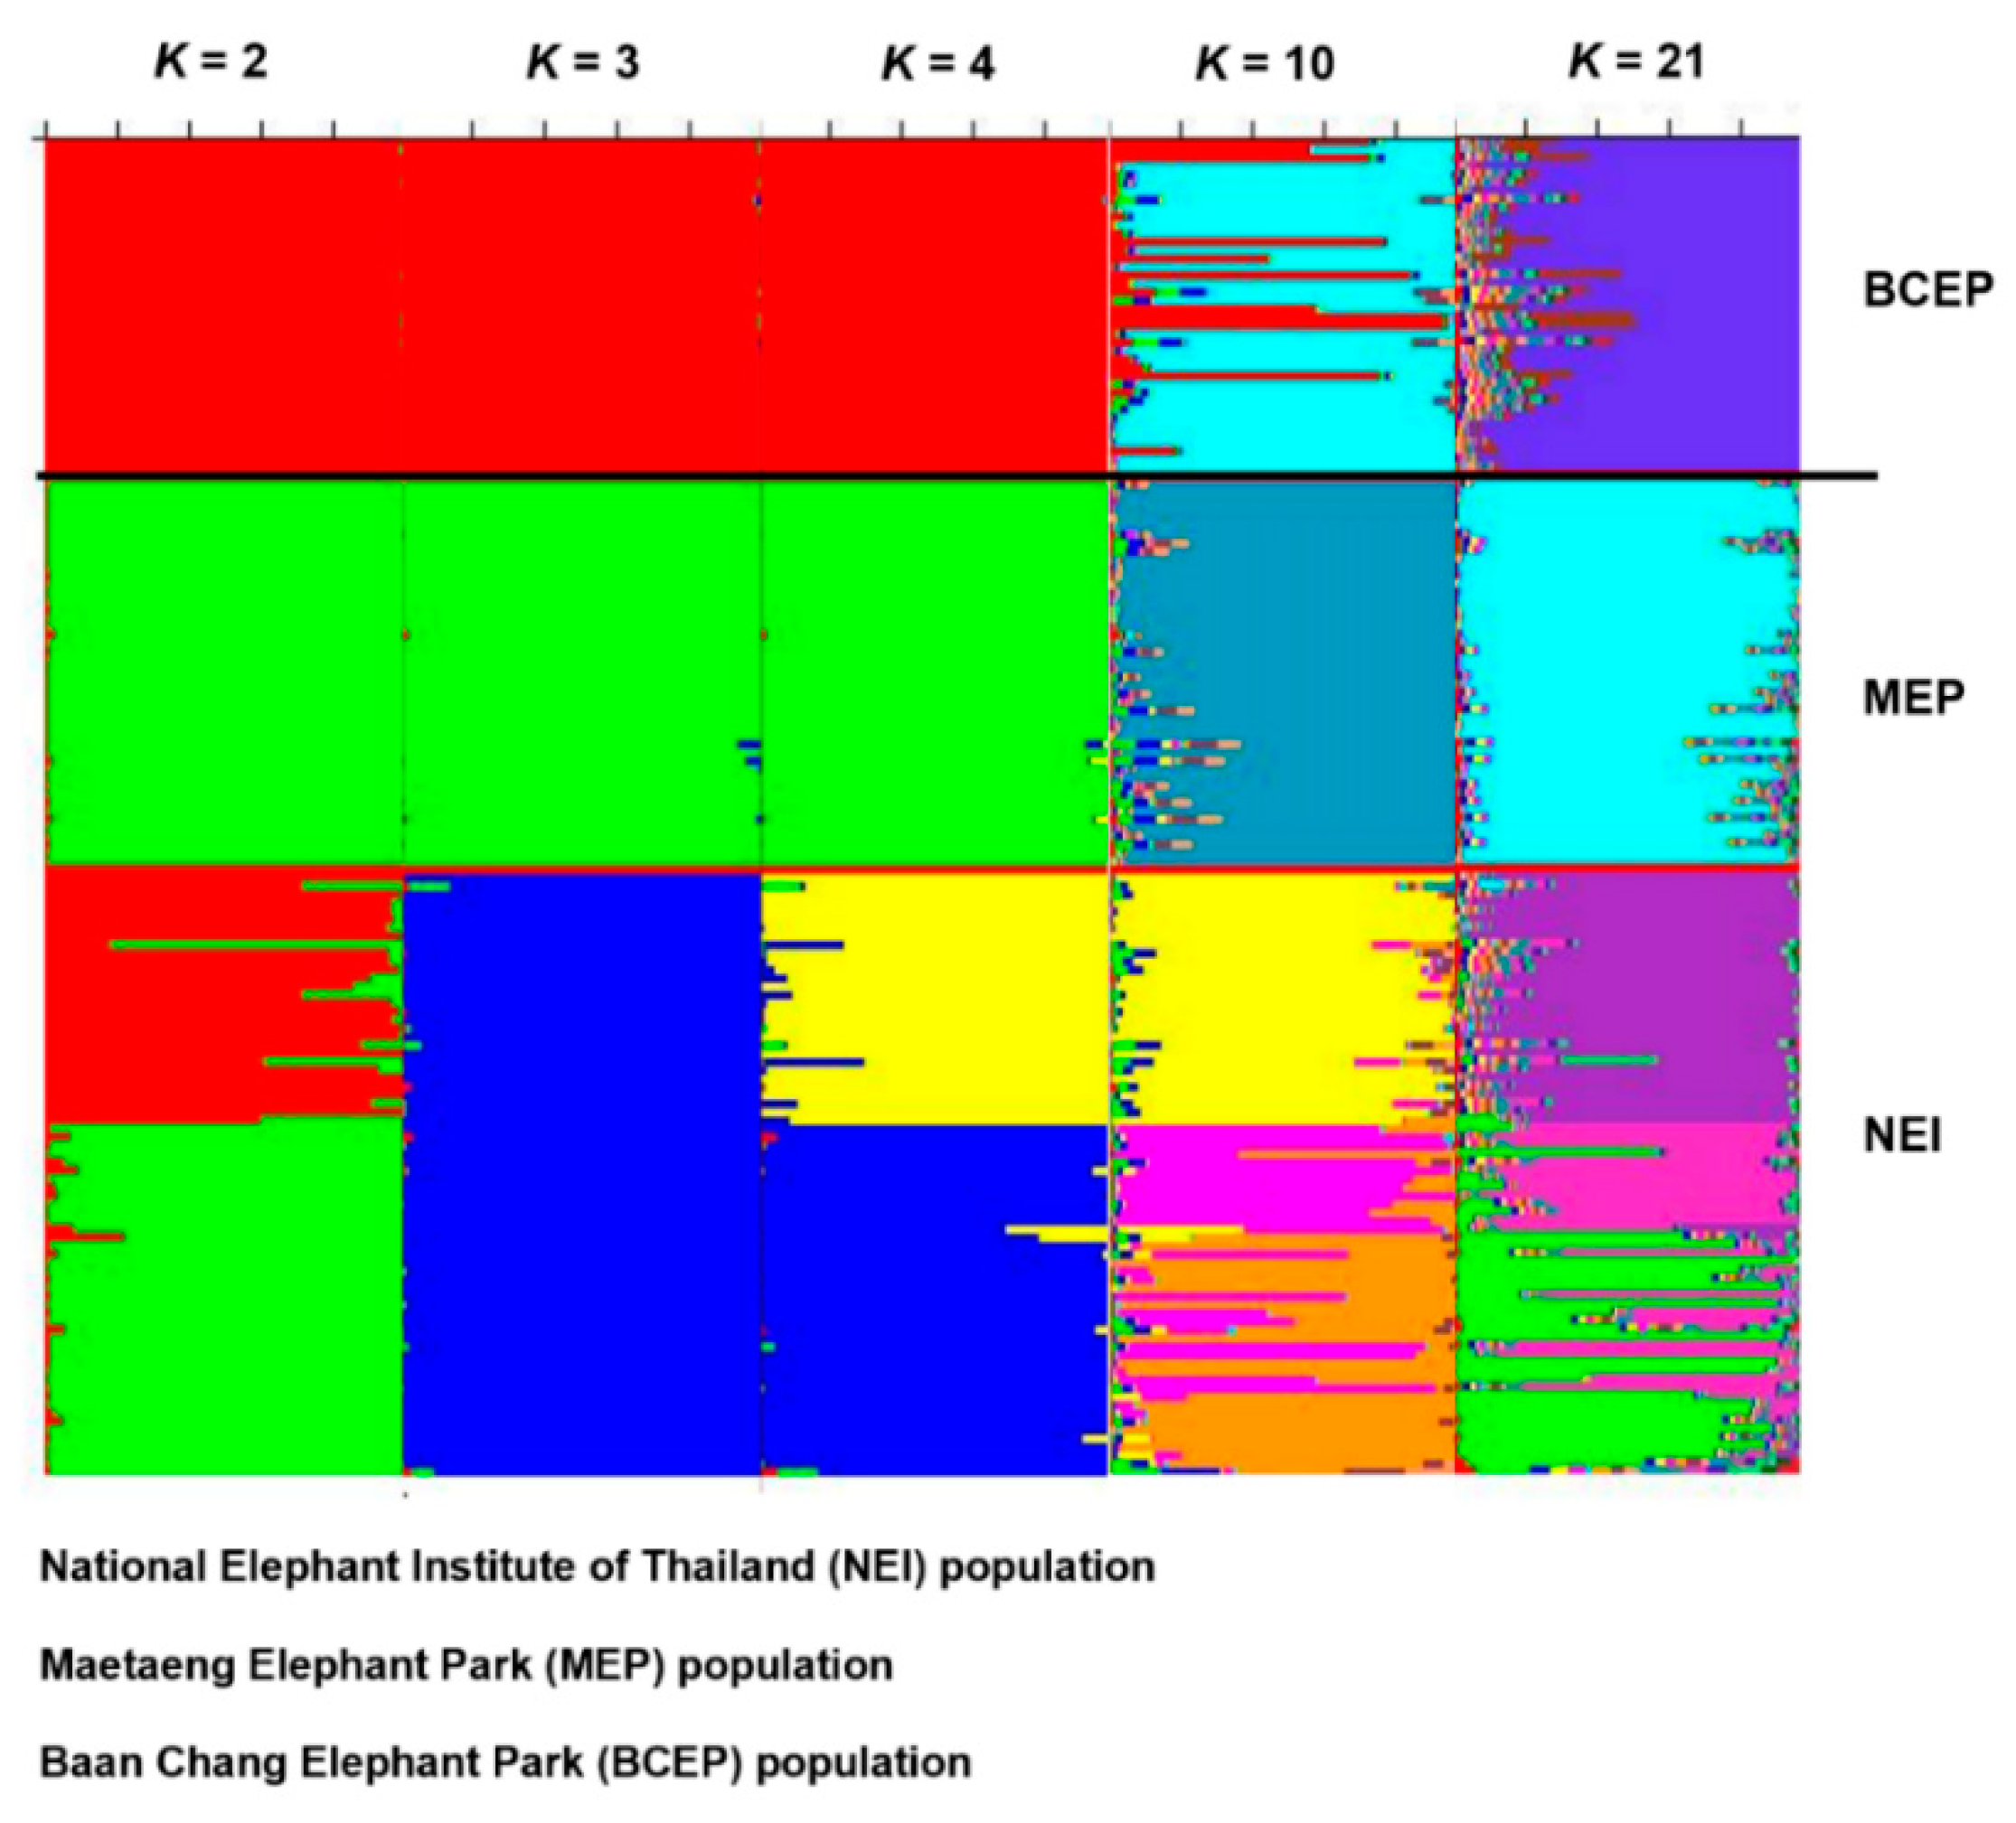
Following 110 permutations, the estimates of FST showed significant differences (p < 0.05) between the captive populations; however, the estimates of FST ENA between the captive populations were not different (Table S21). The AMOVA results showed that the distribution of genetic variations was 46% among individuals within a population and 10% among populations (Table S22). Nei’s genetic distances and RST showed that the MEP and BCEP populations were closer than the NEI with others (Tables S21 and S23). The Wilcoxon signed-rank tests for recent population bottlenecks yielded SMM and TPM values of 1.000 in all populations (normal L-shaped mode shift). The M ratios of the NEI and MEP populations exceeded 0.68, whereas that of the BCEP was 0.366 ± 0.305, indicating the presence of a historical reduction in population size (Table 3 and Table S24). The PCoA revealed that the first, second, and third principal components accounted for 6.99%, 4.25%, and 3.21% of the total variation, respectively, and supported three tentatively differentiated elephant groups (NEI, MEP, and BCEP) (Figure 2). This was consistent with the results of DAPC (Figure 2). The model-based Bayesian clustering algorithms implemented in STRUCTURE generated different population patterns with an increasing K-value from 2, 3, 4, 10, and 21; however, the optimized population structure patterns were assigned to three clusters (K = 3), based on Evanno’s ΔK (Figure 3 and Figure S4).
The forward genetic simulations were performed for 12 scenarios of the varied carrying capacity and the proportion of polygyny, to estimate the loss of genetic diversity across three captive populations. The genetic diversity was represented by the number of alleles, heterozygosity, and allelic diversity (Figure 4). The results from 100 simulated generations showed that all loci of the population with restricted one-male polygyny mating were fixed by approximately 50 generations (Figure 4). All simulations showed a decrease in the genetic diversity. The decline in genetic diversity is relatively slow when captive populations have a relatively large carrying capacity.

3.2. Genetic Variability of the Captive Population, Based on the Mitochondrial Haplotype Analysis

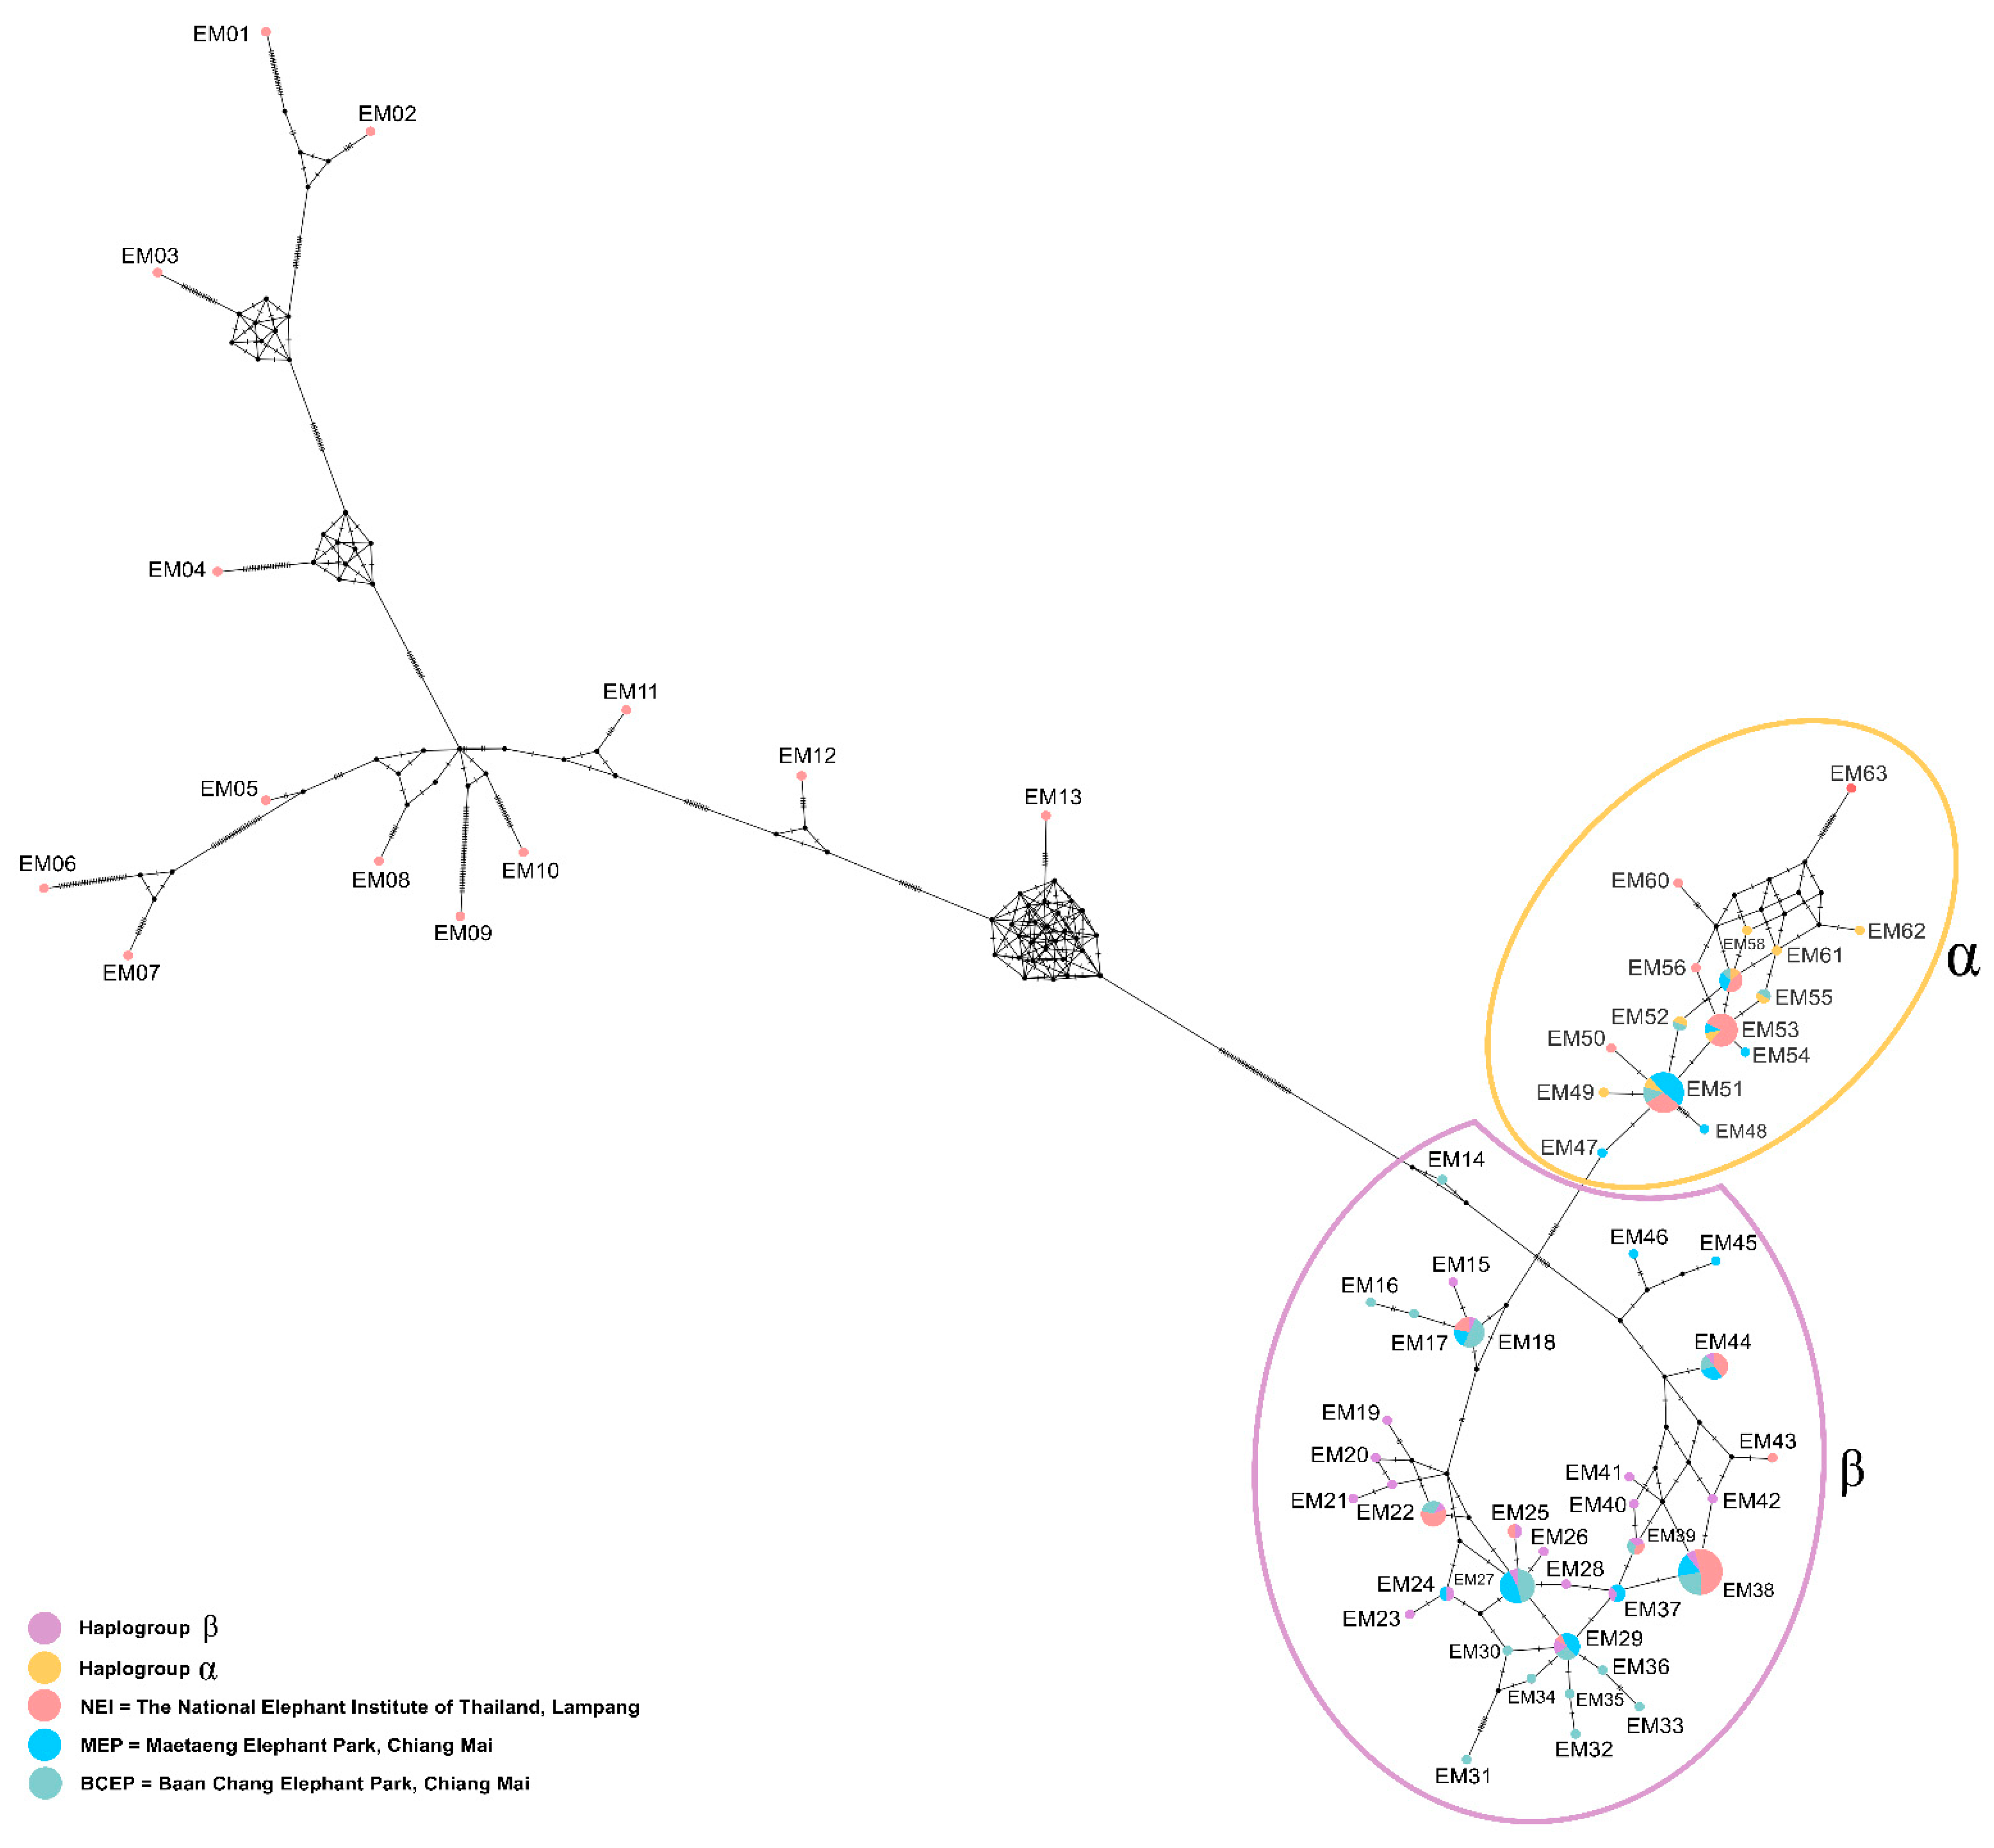
The amplicon length and alignment length of the mt D-loop sequences were 640 and 380 bp, respectively, with 49 haplotypes. Overall, the haplotype and nucleotide diversities were 0.920 ± 0.010 and 0.061 ± 0.030 in the mt D-loop sequences (Table 4). A complex haplotype network was constructed from the large number of detected polymorphic sites and haplotypes (Figure 5). The most common haplotype of all populations was haplotype EM18. Fifteen haplotypes (EM18, EM22, EM24, EM25, EM27, EM29, EM37, EM38, EM39, EM44, EM51, EM52, EM53, EM55, and EM57) were shared in the NEI, MEP, and BCEP population. Multiple sequence alignments of 158 elephant mt D-loop sequences were grouped in both α and β haplogroups (Figure S5). To examine the genetic differentiation among the three populations, we calculated FST, GST, ΦST, Dxy, Da, and Nm. The FST values ranged from 0.032 to 0.082, the GST values ranged from 0.003 to 0.015, and the ΦST values ranged from 0.029 to 0.050 for the mt D-loop sequences (Table 5). The Nm values ranged from 5.535 to 15.110, the Dxy values ranged from 0.021 to 0.065, and the Da values ranged from 0.001 to 0.007 for the mt D-loop sequences (Table 5). The gene flow estimates were often obtained among the MEP and BCEP populations.
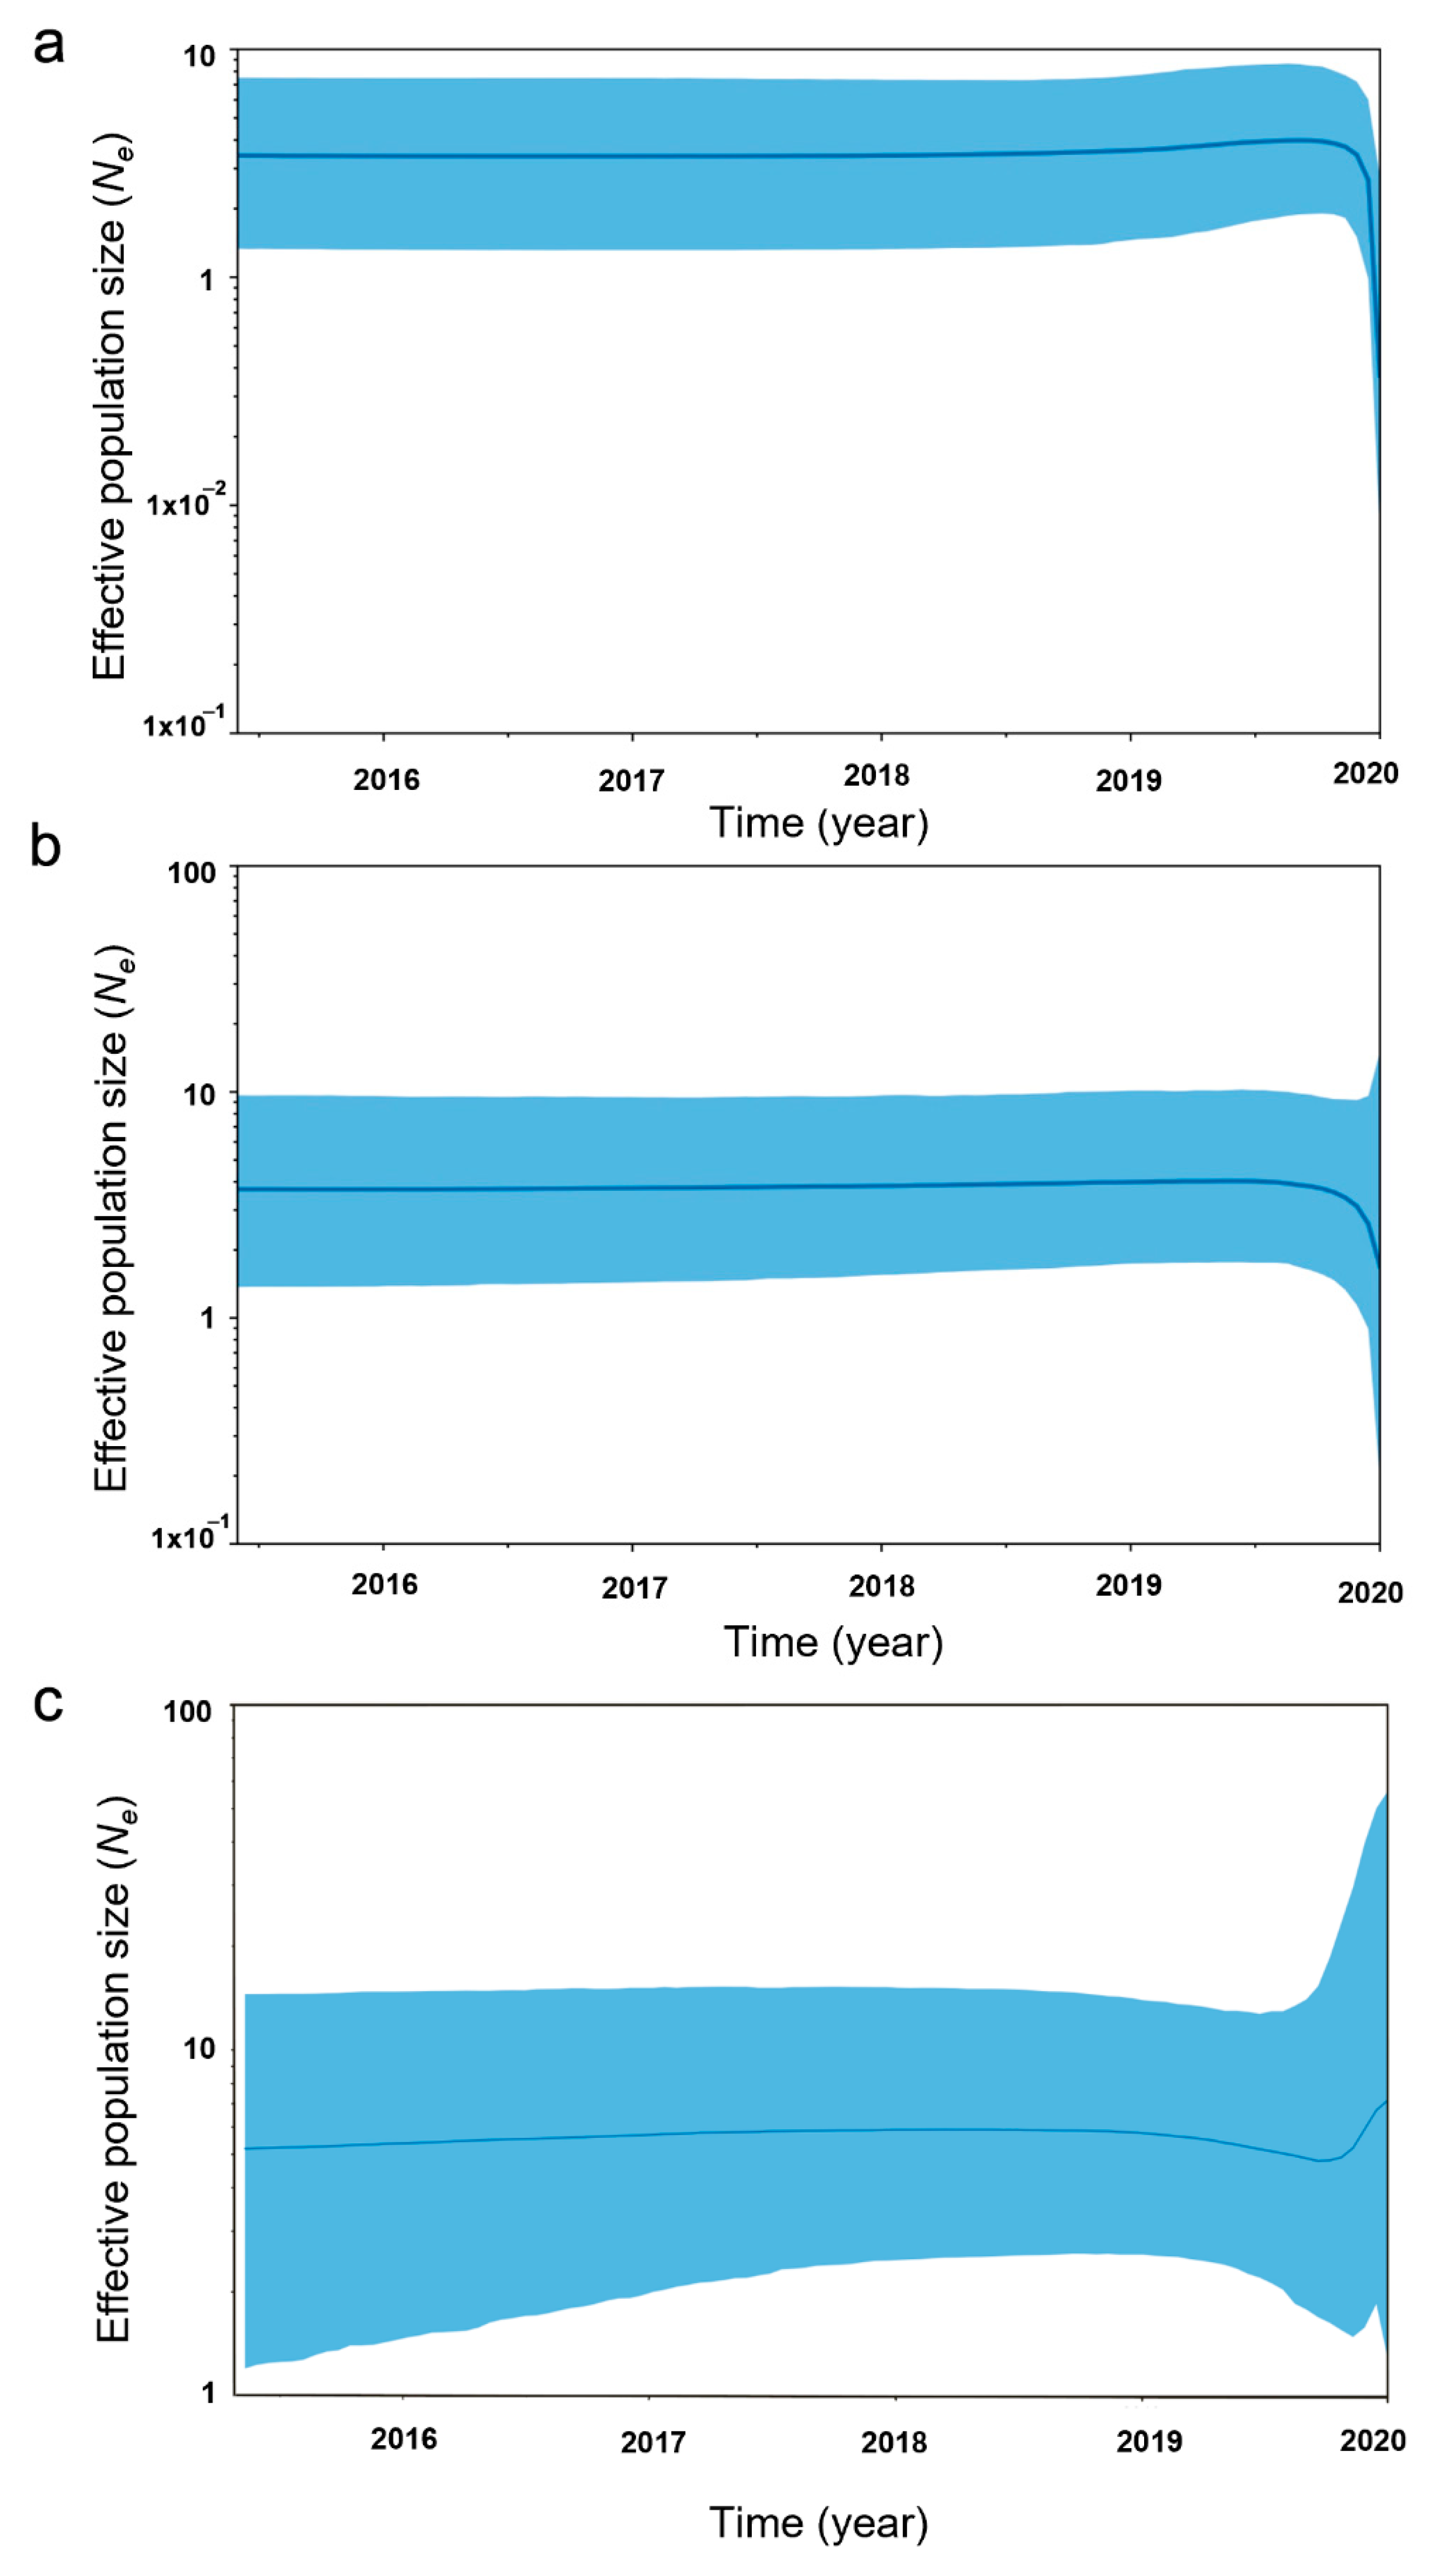
Five different tests of neutrality were used to examine the historical population expansion for the mt D-loop sequences of the wild population. Tajima’s D values were not significant and ranged from −0.212 (p = 0.466) to 0.991 (p = 0.869). Fu and Li’s F* values ranged from −1.348 (p = 1.000) to 0.155 (p = 1.000) and were not significant. Fu and Li’s D* values ranged from −1.462 (p = 1.000) to 0.435 (p = 1.000) and were not significant. Ramos–Onsins and Rozas’s R2 values ranged from 0.108 to 0.149 (Table 6). The mismatch distribution analysis indicated a multimodal distribution (Figure S6). The raggedness index values ranged from 0.019 to 0.045 without any statistical significance. The EBSPs, based on the mt D-loop sequences detected a tentative constant in all populations (Figure 6).

3.3. Classification of the Individual Elephants by the Convolutional Neural Networks

The preliminary results for the simple image processing and CNNs tended to be valid. For each test, the probability values from the output layer were used to provide the ranking of each class prediction. The random selection from a set of image data was performed (Figure S7). Overall, the model yielded an acceptable prediction, as the third prediction was the most accurate. The prediction results for five cases were averaged in Table 7. The Top-1 accuracy was 41.6% on average, far better than the random classification at 1/64 or 0.015%. The Top-3, Top-5, and Top-7 accuracies were 64.1%, 72.8%, and 78.8%, respectively. The average ranking was 5.6 out of 64, making it potentially practical in real applications as the accurate prediction would rank at 5.6 on average. The top-5 prediction, generally used in most applications, was 72.8%.

4. Discussion

The current global captive population of Asian elephants is estimated at 14,000–15,000 individuals or approximately one-third of the global Asian elephant population [7,72]. The captive elephant population in Thailand partially depends on capturing wild elephants, resulting in the rapidly declining number of elephants in the wild. Domesticated elephants in captive camps are therefore required to compensate for the demands for captive elephants and tourist camps, sustainably. Thai captive elephants are currently frequently transferred across different regions throughout the country, either under governmental or private ownership and held in 153 places in 56 provinces [73], with each elephant camp containing between 1 and 195 elephants [74]. Currently, six camps have been certified by the Department of Tourism and nine by the Department of Livestock Development, out of approximately 250 camps in Thailand [16]. To supplement the transfer of elephants between camps, the reproduction percentage of female captive elephants needs to be increased. However, inbreeding and its effects on lowering the genetic diversity have negatively impacted successive generations of captive elephants and other animals [29]. Previous studies on the genetic diversity among Thai captive elephants in Northern Thailand, revealed a high He (more than 0.5) in the tourist camps [28,29]. This was consistent with the present study where He and AR values were high, which were likely suitable conditions for adaptation. The AR value is important for the population size adaptation, while heterozygosity is important for immediate adaptation [75]. However, the comparison of He and Ho revealed that He was significantly higher than Ho in the elephant populations at the NEI and BCEP, suggesting inbreeding. This result was similar to the inbreeding coefficient of the two captive populations, which tended to exceed zero. We found at least 39 individuals to be effective for transferring genetic components to the subsequent generation in the NEI, suggesting that the captive population is composed of related individuals. The NEI population has grown by rapid proliferation of individuals with small Ne or Ne/N, in contrast with those of the MEP population. The NEI provides research and education on elephants with the aim of conserving, in a sustainable way, and preserving local traditions for future generations. This is the reason underlying the lack of an action plan for the transfer of elephants between camps. Multiple breeding generations of the captive population have reduced the population size and increased the degree of inbreeding [76]. The arrangement of inbreeding, according to differences in the genetic group, should be considered further to reduce the inbreeding risk of captive elephants in the NEI. It is not possible to capture wild elephants to add to the captive herds in Thailand and there is no exchange population between captive and wild elephants. Therefore, maintaining a long-term captive elephant population, particularly increasing the birth rate in the population, is challenging [77]. By contrast, the Ne and Ne/N of the BCEP population were high, despite the high inbreeding coefficient. This might result from a possible subpopulation within the BCEP population, as indicated by the positive F values and Bayesian structural analysis; demographically, the historic population reduction was observed in the BCEP population. The genetic partition within the population is a consequence of the possible mixed origin of captive populations, with founding individuals from historically distinct lineages in the camps. This likely agreed with the first hypothesis.
The results of the mean maternal lineage analyses, based on the mt D-loop sequences, showed a low nucleotide diversity (π) but a high haplotype diversity (h) in all populations. The π value offers a more reliable reflection of the mtDNA diversity in a population than the h value, which reflects the recent changes in a population [41,78]. This suggests that a few maternal lineages were observed in the population. However, the NEI population showed a higher nucleotide diversity than the MEP and BCEP populations, possibly caused by the elephant society structure of the MEP and BCEP populations with a few maternal lineages. Furthermore, many males might contribute to the population size, according to the routine transfer between camps [79,80,81]. The decline in the genetic diversity is relatively slow when captive populations have a relatively large carrying capacity. The present demographic analyses identified no recent bottlenecks in the captive population, according to the haplotype network and the demographic history of both mt D-loop sequences and the microsatellite genotyping (except for the BCEP population), although only the nonsignificant raggedness index was observed. The population became constant. Our forward genetic simulation analyses showed that the number of mating males was the primary factor influencing the genetic diversity of the captive elephant populations; even a small population can maintain a higher genetic diversity than a larger patch capacity, with a high degree of polygyny. This suggests that the optimal male selection for breeding could help maintain the genetic diversity in the captive populations. Microsatellite data also show that all loci of the population with restricted one-male polygyny mating, exhibited a fixed reduction in the genetic diversity over the subsequent 50 generations (approximately 1750 years, assuming an Asian elephant generation of 50 years).

4.1. Genetic Diversity of the Elephants in Camps Reflects the Different Historic Origins

The genetic differentiation is the accumulation of the differences in allelic frequencies between completely or partially isolated populations, owing to evolutionary forces. This is important for understanding the selection or genetic drift [29]. Here, the pairwise FST value was statistically significant among the three populations, in relation to the PCoA and DAPC information, implying the genetic differentiation among the camps. Interestingly, the Bayesian structural analyses with many K levels showed large different allelic patterns or gene pools among the three populations, suggesting that the elephants in each camp were derived from distinct original lineages. Similarly, no parent-offspring pairs among different populations were observed from the parentage analysis of the combined three captive populations. Historically, Asian elephants are a geographically widespread species and this may help to the maintain genetic variation [79,80,81]. The current captive populations from the MEP and BCEP might reflect scenarios of large original sources of Asian elephants in Thailand brought into the camps and possibly the fairly routine transfer of elephants between camps [79,80,81].
In this study, the private haplotypes were observed in Asian elephants; 15 of the 49 haplotypes were novel. Only nine haplotypes were shared by the three populations, and 40 haplotypes were private to one of them. The genetic differentiation of the NEI population differed significantly from that of the MEP/BCEP populations; however, those of the MEP and BCEP populations were not significantly different. Many elephant camps allow for the sufficient gene flow within their region, as observed between the MEP and BCEP populations, because of the male elephants distributed for mating and the resulting offspring in several camps. Our 158 control region sequences (380 bp) yielded 49 different haplotypes, based on 10 variable sites. Although all observed ‘Sundaland’ haplotypes were mostly the β clade, the median-joining network revealed that all haplotypes in this study were grouped into the α or β haplogroups [6,34,82], supporting the large variation in the Asian elephant lineage in Thailand. The finding of many different haplotypes within the camps suggests a remarkable breeding management and suggests that camps in different clusters cooperated and transferred the genetic value for breeding. This can influence the adaptability and distribution of a species in diverse habitats. The results of this study provide the baseline information on the genetic status of elephants between tourist camps in Thailand that will be important for future conservation and breeding programs of the species.

4.2. Legal Legislation and Identification Certificates

Corruption, ineffective laws, weak judicial systems, lack of enforcement of wildlife law, and light sentences for offenders, allow criminal networks to keep plundering wildlife with little regard for the consequences [83,84,85]. These factors make the illegal elephant trade a low-risk business with high returns. It takes well over 10 years for newborn elephants to serve as draft animals; therefore, calves do not generate income for the elephant tourist camps. The growing demand for captive elephants as draft animals is addressed by the illegal capture of elephants from the wild. A 20-year National Elephant Conservation Action Plan of Thailand (2018–2037) was therefore developed. This includes four major strategies: (1) policy and regulations pertaining to elephants, (2) understanding the socio-politics and culture, related to elephants, (3) wild elephant conservation and habitat management, and (4) elephant welfare and health care. This study proposes the enactment of a national policy on captive elephants that introduces a scientific and transparent process, regarding the registration and renewal of licenses to hold captive elephants following the first strategy. The frame of DNA fingerprinting, including the allelic frequency and probability, and the mt D-loop, were innovated for the identification certificate. The gene pool estimates from the different populations can be used to infer the origin of the DNA samples. These could be obtained from individuals of unknown origin to prevent illegal legislation owing to registration fraud. This should limit the use of captive elephants for cultural, religious, and tourism purposes, and allow for the adoption of the standardized captive elephant registration protocols and best practices, proposed by the Seventeenth Conference of Parties of CITES in 2016 and the second Asian Elephant Range States’ meeting in 2017. In addition, the CNN with multiple elephant pictures was simply performed to incorporate the historic records and DNA fingerprints. The accuracy and precision of the CNN image recognition were approximately 41.6% and 44.63%, respectively, and the top-5 classification accuracy is 72.8%. However, there were only eight samples, which is considered to be low, in light of the data that can be collected [86,87]. The sample size should be significantly bigger to ensure that the data are representative, compared to those in this preliminary experiment. The study and the ultimate application of the appropriate techniques and parameters for the image features and learning models should significantly improve the prediction performance.
This study presents an assessment of the population status of captive elephants in Thailand and provides guidelines for their management. This will promote the long-term preservation of captive elephant populations in Thailand, based on legal legislation. This study presents the blueprint for a more optimized and sustainable future for all and addresses the global challenges we face, including those related to poverty, inequality, climate change, environmental degradation, peace, and justice with the Sustainable Development Goals (SDG) 8 (promote sustained, inclusive, and sustainable economic growth, full and productive employment, and decent work for all), 15 (protect, restore, and promote the sustainable use of terrestrial ecosystems, sustainably manage forests, combat desertification, and halt and reverse the land degradation and halt the biodiversity loss), 16 (promote peaceful and inclusive societies for a sustainable development, provide access to justice for all, and build effective, accountable, and inclusive institutions at all levels), and 17 (strengthen the means of implementation and revitalize the Global Partnership for Sustainable Development). A science-based set of standards or guidelines, as well as enforceable regulations for tourist elephants in Thailand are needed and will aid in this effort. Further studies on the genetic variation and differentiation of Asian elephants should be performed with a greater number of individuals and in other areas of the country. Collaboration with camps, tourist agencies, and governmental agencies will also promote the maintenance of healthy, sustainable populations of captive elephants throughout Thailand and other Asian range countries.

5. Conclusions

Captive elephant populations in this study revealed two scenarios of high genetic variation, in the MEP and BCEP populations, as the representatives of tourist camps, and a low genetic variation in the NEI population, as representing the government sector. The genetic variation must be carefully controlled, to maintain an adequate genetic diversity in the camps. Male elephants are the main contributors of the genetic diversity of captive elephant populations. Considering the three camps, the diverse origins of elephants were observed, suggesting various historic origins. This leads us to apply the DNA fingerprint with ML for the development of identification certificates for legal legislation. The continuous monitoring of captive populations is required because demographic processes are crucial in small populations to set the foundation for DNA fingerprinting of Thai elephants. This comprehensive system will document the pedigree and demographic history of the captive elephant population, as one way of ensuring that tourism does not negatively impact wild counterparts. It is essential that the implementation be synergistically accompanied by research that examines the impacts and numerous adverse effects of climate change and the loss of biodiversity. Results can be used to modify and improve the implementation of effective measures.

Supplementary Materials

The following supporting information can be downloaded at: https://www.mdpi.com/article/10.3390/su142215355/s1, Figure S1: Examples of 10 selected pictures of each class for the experimental dataset; Figure S2: Setup of the five-fold experiments; Figure S3: Structure of the convolutional neural network model; Figure S4: Optimized population structure patterns were assigned into three clusters (K = 3), based on Evanno’s ΔK; Figure S5: Phylogenetic relationship between all individual Asian elephants (Elephas maximus, Linnaeus, 1758) and the GenBank accession numbers: AY589513, AY589516, AY589515, AY365432, AY365433, AY245823, AY589514, AY589512, AY365433, AY365432, AY245823, AY245826, AY245825, AY245824, AY245822, AY245822, AY245821, AY245820, AY245819, AY245818, AY245817, AY245816, AY245815, AY2458214, AY245813, AY245812, AY245811, AY245810, AY245809, AY245808, AY245807, AY245806, AY245805, AY245804, AY245803, AY245802, and AY245827, constructed with the help of the Bayesian inference (BI) analysis using the mt D-loop sequencing. Support values at each node are bootstrap values of the Bayesian posterior probability; Figure S6: Mismatch distributions analysis (a) the National Elephant Institute of Thailand (NEI, Lampang), (b) Maetaeng Elephant Park (MEP, Chiang Mai), (c) Baan Chang Elephant Park (BCEP, Chiang Mai. The x-axis represents the number of pairwise differences (mismatches), while the y-axis represents the frequency of these differences. The observed mismatch distribution (blue line) is compared to the expected distribution (purple line) for a stable population; Figure S7: Example of the top-3 rank prediction results; Table S1: Specimen populations of Asian elephants (Elephas maximus, Linnaeus, 1758) in Thailand. All sequences were deposited in the DNA Data Bank of Japan (DDBJ); Table S2: Microsatellite primers and sequences; Table S3: Pairwise differentiation of the linkage disequilibrium of Asian elephant (Elephas maximus, Linnaeus, 1758) individuals at the National Elephant Institute of Thailand, based on 18 microsatellite loci. Numbers indicate the p-values with 110 permutations; Table S4: Pairwise differentiation of the linkage disequilibrium of Asian elephant (Elephas maximus, Linnaeus, 1758) individuals at Maetaeng Elephant Park, based on 18 microsatellite loci. Numbers indicate the p-values with 110 permutations; Table S5: Pairwise differentiation of the linkage disequilibrium of Asian elephant (Elephas maximus, Linnaeus, 1758) individuals at Baan Chang Elephant Park, based on 18 microsatellite loci. Numbers indicate the p-values with 110 permutations; Table S6: The genetic diversity of 158 Asian elephants (Elephas maximus, Linnaeus, 1758) is based on 18 microsatellite loci. Detailed information on all individuals is presented in Table S1; Table S7: Pairwise genetic relatedness (r) for all 72 Elephas maximus, Linnaeus, 1758 individuals in the National Elephant Institute of Thailand. Detailed information on all individuals is presented in Table S1; Table S8: Pairwise genetic relatedness (r) for all 46 Elephas maximus, Linnaeus, 1758 individuals in Maetaeng Elephant Park. Detailed information on all individuals is presented in Table S1; Table S9: Pairwise genetic relatedness (r) for all 40 Elephas maximus, Linnaeus, 1758 individuals in Baan Chang Elephant Park. Detailed information on all individuals is presented in Table S1; Table S10: Distributions of the r values and FIS values for the Asian elephants (Elephas maximus, Linnaeus, 1758); Table S11: Pairwise inbreeding coefficients (FIS) for all 79 Asian elephant (Elephas maximus, Linnaeus, 1758) individuals in the National Elephant Institute of Thailand. Detailed information on all Asian elephant individuals is presented in Table S1; Table S12: Pairwise inbreeding coefficients (FIS) for all 46 Asian elephant (Elephas maximus, Linnaeus, 1758) individuals in Maetaeng Elephant Park. Detailed information on all Asian elephant individuals is presented in Table S1; Table S13: Pairwise inbreeding coefficients (FIS) for all 40 Asian elephant (Elephas maximus, Linnaeus, 1758) individuals in Baan Chang Elephant Park. Detailed information on all Asian elephant individuals is presented in Table S1; Table S14: Parentage analysis of 72 Asian elephant (Elephas maximus, Linnaeus, 1758) individuals in the National Elephant Institute of Thailand. Detailed information on all Asian elephant individuals is presented in Table S1; Table S15: Parentage analysis of 46 Asian elephant (Elephas maximus, Linnaeus, 1758) individuals in Maetaeng Elephant Park. Detailed information on all Asian elephant individuals is presented in Table S1; Table S16: Parentage analysis of 40 Asian elephant (Elephas maximus, Linnaeus, 1758) individuals in Baan Chang Elephant Park. Detailed information on all Asian elephant individuals is presented in Table S1; Table S17: Parentage analysis of 158 Asian elephant (Elephas maximus, Linnaeus, 1758) individuals in the National Elephant Institute of Thailand, Maetaeng Elephant Park, and Baan Chang Elephant Park. Detailed information on all Asian elephant individuals is presented in Table S1; Table S18: Probability of the identity estimated using Gimlet version 1.3.3 (Valière, 2002) of Asian elephant (Elephas maximus, Linnaeus, 1758) individuals in the National Elephant Institute of Thailand, based on 18 microsatellite loci. Detailed information on all individuals is presented in Table S1 [88]; Table S19: Probability of identity estimated using Gimlet version 1.3.3 (Valière, 2002) of Asian elephant (Elephas maximus, Linnaeus, 1758) individuals in Maetaeng Elephant Park, based on 18 microsatellite loci. Detailed information on all individuals is presented in Table S1; Table S20: Probability of identity estimated using Gimlet version 1.3.3 (Valière, 2002) of Asian elephant (Elephas maximus, Linnaeus, 1758) individuals in Baan Chang Elephant Park, based on 18 microsatellite loci. Detailed information on all individuals is presented in Table S1; Table S21: Pairwise genetic differentiation (FST), pairwise FSTENA values with the ENA correction for the null alleles and RST values, using FSTAT version 2.9.3 (Goudet, 1995) and of Asian elephants (Elephas maximus, Linnaeus, 1758) between captive breeding, based on 18 microsatellite loci. The number indicates the p values, with 110 permutations. Detailed information on all Asian elephant individuals is presented in Table S1; Table S22: Analysis of the molecular variance (AMOVA) results for Asian elephants (Elephas maximus, Linnaeus, 1758), based on 18 microsatellite loci using Arlequin version 3.5.2.2 (Excoffier & Lischer, 2010). Detailed information on all Asian elephant individuals is presented in Table S1 [89]; Table S23: Pairwise population Nei’s genetic distance (D) values using GenAlEx version 6.5 (Peakall & Smouse, 2012) of 158 Asian elephant (Elephas maximus, Linnaeus, 1758) individuals on 18 microsatellite loci; Table S24: Observed and expected heterozygosity of Asian elephants (Elephas maximus, Linnaeus, 1758), based on 18 microsatellite loci and the genetic bottlenecks for all individuals. Data were calculated using Bottleneck version 1.2.02 (Piry et al., 1999). Detailed information on all Asian elephant individuals is presented in Table S1.

Author Contributions

Conceptualization, N.A., D.H.M.N., and K.S.; Data curation, K.S.; Formal analysis, N.A., D.H.M.N., W.S. (Worapong Singchat), W.S. (Warong Suksavate), A.P., K.K., K.J., S.T., N.M., and K.S.; Investigation, K.S.; Methodology, N.A., D.H.M.N., N.M., P.D., and K.S.; Project administration, K.S.; Resources, W.L., S.C., T.A., O.T., S.I., and P.D.; Software, T.P. and W.S. (Warong Suksavate) and S.T.; Supervision, K.S.; Validation, N.A., D.H.M.N., W.S. (Worapong Singchat) and K.S.; Visualization, N.A., D.H.M.N., T.P., and K.S.; Writing–original draft, N.A., D.H.M.N., W.S. (Warong Suksavate), S.T., and K.S.; Writing—review and editing, N.A., D.H.M.N., W.S. (Worapong Singchat), W.S. (Warong Suksavate), T.P., W.L., S.C., T.A., A.P., K.K., K.J., S.F.A., S.T., N.M., O.T., S.I., P.D., and K.S. All authors have read and agreed to the published version of the manuscript.

Funding

This research was financially supported, in part, by the Thailand Science Research and Innovation, through the Kasetsart University Reinventing University Program 2021 (3/2564) awarded to T.P. and K.S.; the Higher Education for Industry Consortium (Hi-FI; no. 6414400777) awarded to N.A.; the e-ASIA Joint Research Program (no. P1851131) awarded to W.S. and K.S.; a grant from the National Science and Technology Development Agency (NSTDA) (JRA-CO-2564-14003-TH) awarded to W.S. and K.S.; the National Science and Technology Development Agency (NSTDA) (P-20-52605) awarded to K.S.; a postdoctoral researcher award at Kasetsart University awarded to S.F.A. and K.S. and the Office of the Ministry of Higher Education, Science, Research and Innovation. No funding source was involved in the study design, collection, analysis and interpretation of the data, writing the report, or the decision to submit the article for publication.

Institutional Review Board Statement

All animal care and experimental procedures were approved (approval no. ACKU63 SCI 017) by the Animal Experiment Committee of Kasetsart University and conducted in accordance with the Regulations on Animal Experiments at Kasetsart University.

Informed Consent Statement

Not applicable.

Data Availability Statement

All sequences were deposited in the DNA Data Bank of Japan (DDBJ). The online version contains Supplementary Materials available at https://datadryad.org/stash/share/dg2SMl_JQlGgjz6pOWuCRiaOr2C29QZanghBB0t5iBc (accessed on 10 August 2022).

Acknowledgments

We thank the Department of National Parks, Wildlife and Plant Conservation for assistance with the sample collection and knowledge transfer, and the United States Agency for International Development (USAID) Emerging Pandemic Threats PREDICT program. The authors are also grateful to Sirintip Thongia and Onjira Korboon (Animal Genomics and Bioresources Research Unit (AGB Research Unit), Kasetsart University, Thailand) for some helpful assistance carried out the lab work.

Conflicts of Interest

The authors declare no conflict of interest.

References

  1. Linnaeus, C. Systema Naturae per Regna Tria Naturae: Secundum Classes, Ordines, Genera, Species, cum Characteribus, Differentiis, Synonymis, Locis; Apud JB Delamolliere: Sweden, Stockholm, 1758. [Google Scholar]
  2. Kerley, G.I.; Landman, M. The impacts of elephants on biodiversity in the Eastern cape subtropical thickets: Elephant conservation. S. Afr. J. Sci. 2006, 102, 395–402. [Google Scholar]
  3. Kerley, G.I.; Landman, M.; Kruger, L.; Owen-Smith, N.; Balfour, D.; de Boer, W.F.; Gaylard, A.; Slotow, R. Effects of elephants on ecosystems and biodiversity. In The 2007 Scientific Assessment of Elephant Management in South Africa; CSIR: Pretoria, South Africa, 2008; pp. 101–147. [Google Scholar]
  4. Shannon, G.; Thaker, M.; Vanak, A.T.; Page, B.R.; Grant, R.; Slotow, R. Relative impacts of elephant and fire on large trees in a savanna ecosystem. Ecosystems 2011, 14, 1372–1381. [Google Scholar] [CrossRef]
  5. Fleischer, R.C.; Perry, E.A.; Muralidharan, K.; Stevens, E.E.; Wemmer, C.M. Phylogeography of the Asian elephant (Elephas maximus) based on mitochondrial DNA. Evolution 2001, 55, 1882–1892. [Google Scholar] [CrossRef]
  6. Vidya, T.N.C.; Fernando, P.; Melnick, D.J.; Sukumar, R. Population differentiation within and among Asian elephant (Elephas maximus) populations in southern India. Heredity 2005, 94, 71–80. [Google Scholar] [CrossRef] [PubMed] [Green Version]
  7. Sukumar, R. A brief review of the status, distribution and biology of wild Asian elephants Elephas maximus. Int. Zoo Yearb. 2006, 40, 1–8. [Google Scholar] [CrossRef]
  8. Menon, V.; Tiwari, S.K. Population status of Asian elephants Elephas maximus and key threats. Int. Zoo Yearb. 2019, 53, 17–30. [Google Scholar] [CrossRef]
  9. IUCN. Asian Elephant. The IUCN Red List of Threatened Species. Available online: https://www.iucnredlist.org (accessed on 20 March 2022).
  10. Ahlering, M.A.; Hedges, S.; Johnson, A.; Tyson, M.; Schuttler, S.G.; Eggert, L.S. Genetic diversity, social structure, and conservation value of the elephants of the Nakai Plateau, Lao PDR, based on non-invasive sampling. Conserv. Genet. 2011, 12, 413–422. [Google Scholar] [CrossRef]
  11. Sun, Y.; Chen, Y.; Díaz-Sacco, J.J.; Shi, K. Assessing population structure and body condition to inform conservation strategies for a small isolated Asian elephant (Elephas maximus) population in southwest China. PLoS ONE 2021, 16, e0248210. [Google Scholar] [CrossRef]
  12. Thitaram, C. Breeding management of captive Asian elephant (Elephas maximus) in range countries and zoos. Jpn. J. Zoo Wild. Med. 2012, 17, 91–96. [Google Scholar] [CrossRef] [Green Version]
  13. Asian Elephant Specialist Group. Asian Elephant Range States Meeting, Final Report; Asian Elephant Specialist Group: Jakarta, Indonesia, 2017; p. 68. [Google Scholar]
  14. Menkham, K.; Sukmasuang, R.; Pla-ard, M.; Charaspet, K.; Panganta, T.; Trisurat, Y.; Bhumpakohan, N. Population and habitat use of Asian elephants (Elephas maximus) and five ungulate species in Khao Ang Rue Nai Wildlife Sanctuary, Chachoengsao Province, Thailand. Biodiversitas 2019, 20, 8. [Google Scholar] [CrossRef] [Green Version]
  15. Shaffer, L.J.; Khadka, K.K.; van den Hoek, J.; Naithani, K.J. Human-elephant conflict: A review of current management strategies and future directions. Front. Ecol. Evol. 2019, 6, 235. [Google Scholar] [CrossRef]
  16. Bansiddhi, P.; Brown, J.L.; Thitaram, C. Welfare assessment and activities of captive elephants in Thailand. Animals 2020, 10, 919. [Google Scholar] [CrossRef] [PubMed]
  17. Schmidt-Burbach, J.; Ronfot, D.; Srisangiam, R. Asian elephant (Elephas maximus), pig-tailed macaque (Macaca nemestrina) and tiger (Panthera tigris) populations at tourism venues in Thailand and aspects of their welfare. PLoS ONE 2015, 10, e0139092. [Google Scholar] [CrossRef] [PubMed] [Green Version]
  18. Chaitae, A.; Gordon, I.J.; Addison, J.; Marsh, H. Protection of elephants and sustainable use of ivory in Thailand. Oryx 2021, 56, 601–608. [Google Scholar] [CrossRef]
  19. Stiles, D. CITES–approved ivory sales and elephant poaching. Pachyderm 2009, 45, 150–153. [Google Scholar]
  20. Nijman, V. An Assessment of the Live Elephant Trade in Thailand; TRAFFIC International: Cambridge, MA, USA, 2014. [Google Scholar]
  21. Bansiddhi, P.; Nganvongpanit, K.; Brown, J.L.; Punyapornwithaya, V.; Pongsopawijit, P.; Thitaram, C. Management factors affecting physical health and welfare of tourist camp elephants in Thailand. PeerJ 2019, 7, e6756. [Google Scholar] [CrossRef] [Green Version]
  22. Wongruang, P. Dealing with the Elephant in the Room—Ivory Trade. Available online: https://www.nationthailand.com/opinion/30357559 (accessed on 20 March 2022).
  23. Kanchanapangka, S. Roadmap of Torture: Captive Thai Elephant and the Anecdote. Thai J. Vet. Med. 2010, 40, 149–150. [Google Scholar]
  24. National Geographic. Available online: https://www.nationalgeographic.com/magazine/article/global-wildlife-tourism-social-media-causes-animal-suffering (accessed on 20 March 2022).
  25. Kelling, S.; Gerbracht, J.; Fink, D.; Lagoze, C.; Wong, W.K.; Yu, J.; Gomes, C. Ebird: A human/computer learning network for biodiversity conservation and research. In Proceedings of the 24th Innovative Applications of Artificial Intelligence Conference, Toronto, ON, Canada, 22–26 July 2012. [Google Scholar]
  26. Kumar, D.; Jakhar, S.D. Artificial Intelligence in Animal Surveillance and Conservation. In Impact of Artificial Intelligence on Organizational Transformation; Scrivener Publishing LLC: Beverly, MA, USA, 2022; pp. 73–85. [Google Scholar]
  27. Vélez, J.; Castiblanco-Camacho, P.J.; Tabak, M.A.; Chalmers, C.; Fergus, P.; Fieberg, J. Choosing an Appropriate Platform and Workflow for Processing Camera Trap Data using Artificial Intelligence. arXiv 2022, arXiv:2202.02283. [Google Scholar] [CrossRef]
  28. Thitaram, C.; Somgird, C.; Mahasawangkul, S.; Angkavanich, T.; Roongsri, R.; Thongtip, N.; Colenbrander, B.; van Steenbeek, F.G.; Lenstra, J.A. Genetic assessment of captive elephant (Elephas maximus) populations in Thailand. Conserv. Genet. 2010, 11, 325–330. [Google Scholar] [CrossRef]
  29. Kriangwanich, W.; Nganvongpanit, K.; Buddhachat, K.; Brown, J.L.; Siengdee, P.; Chomdej, S.; Bansiddhi, P.; Thitaram, C. Genetic diversity and variation in captive Asian elephants (Elephas maximus) in Thailand. Trop. Conserv. Sci. 2018, 11, 1940082918816871. [Google Scholar] [CrossRef] [Green Version]
  30. Toin, P.; Brown, J.L.; Punyapornwithaya, V.; Bansiddhi, P.; Somgird, C.; Thitaram, C. Reproductive performance of captive Asian elephants (Elephas maximus) in large tourist camps in Thailand. Anim. Reprod. Sci. 2020, 222, 106606. [Google Scholar] [CrossRef] [PubMed]
  31. Thongtip, N.; Saikhun, J.; Damyang, M.; Mahasawangkul, S.; Suthunmapinata, P.; Yindee, M.; Kongsila, A.; Angkawanish, T.; Jansittiwate, S.; Wongkalasin, W.; et al. Evaluation of post-thaw Asian elephant (Elephas maximus) spermatozoa using flow cytometry: The effects of extender and cryoprotectant. Theriogenology 2004, 62, 748–760. [Google Scholar] [CrossRef] [PubMed]
  32. Lair, R.C. Gone Astray: The Care and Management of the Asian Elephant in Domesticity; Food and Agriculture Organization of the United Nations: Bangkok, Thailand, 1997; pp. 279–300. [Google Scholar]
  33. Thitaram, C.; Dejchaisri, S.; Somgird, C.; Angkawanish, T.; Brown, J.; Phumphuay, R.; Chomdech, S.; Kangwanpong, D. Social group formation and genetic relatedness in reintroduced Asian elephants (Elephas maximus) in Thailand. Appl. Anim. Behav. Sci. 2015, 172, 52–57. [Google Scholar] [CrossRef]
  34. Fickel, J.; Lieckfeldt, D.; Ratanakorn, P.; Pitra, C. Distribution of haplotypes and microsatellite alleles among Asian elephants (Elephas maximus) in Thailand. Eur. J. Wildl. Res. 2007, 53, 298–303. [Google Scholar] [CrossRef]
  35. Thongchai, S.; Dejchaisri, S.; Sukmasuang, S.; Thongtipsiridech, S.; Wajjwalku, W.; Kaolim, N. Genetic diversity of wild elephant (Elephas maximus Linnaeus, 1758) in the northeastern part of Thailand. J. Wildl. Thail. 2011, 18, 16–33. [Google Scholar]
  36. Witzenberger, K.A.; Hochkirch, A. Ex situ conservation genetics: A review of molecular studies on the genetic consequences of captive breeding programmes for endangered animal species. Biodivers. Conserv. 2011, 20, 1843–1861. [Google Scholar] [CrossRef]
  37. Srikulnath, K.; Matsubara, K.; Uno, Y.; Thongpan, A.; Suputtitada, S.; Nishida, C.; Matsuda, Y.; Apisitwanich, S. Genetic relationship of three butterfly lizard species (Leiolepis reevesii rubritaeniata, Leiolepis belliana belliana, Leiolepis boehmei, Agamidae, Squamata) inferred from nuclear gene sequence analyses. Kasetsart J. (Nat. Sci.). 2010, 44, 424–435. [Google Scholar]
  38. Sukumar, R.; Gadgil, M. Male-female differences in foraging on crops by Asian elephants. Anim. Behav. 1998, 36, 1233–1235. [Google Scholar] [CrossRef]
  39. Comstock, K.E.; Wasser, S.K.; Ostrander, E.A. Polymorphic microsatellite DNA loci identified in the African elephant (Loxodonta africana). Mol. Ecol. 2000, 9, 1004–1006. [Google Scholar] [CrossRef]
  40. Archie, E.A.; Moss, C.J.; Alberts, S.C. Characterization of tetranucleotide microsatellite loci in the African savannah elephant (Loxodonta africana africana). Mol. Ecol. Notes 2003, 3, 244–246. [Google Scholar] [CrossRef]
  41. Ariyaraphong, N.; Pansrikaew, T.; Jangtarwan, K.; Thintip, J.; Singchat, W.; Laopichienpong, N.; Pongsanarm, T.; Panthum, T.; Suntronpong, A.; Ahmad, S.F.; et al. Introduction of wild Chinese gorals into a captive population requires careful genetic breeding plan monitoring for successful long-term conservation. Glob. Ecol. Conserv. 2021, 28, e01675. [Google Scholar] [CrossRef]
  42. Chailertrit, V.; Swatdipong, A.; Peyachoknagul, S.; Salaenoi, J.; Srikulnath, K. Isolation and characterization of novel microsatellite markers from Siamese fighting fish (Betta splendens, Osphronemidae, Anabantoidei) and their transferability to related species, B. smaragdina and B. imbellis. Genet. Mol. Res. 2014, 13, 7157–7162. [Google Scholar] [CrossRef] [PubMed]
  43. Lapbenjakul, S.; Thanapa, W.; Twilprawat, P.; Muangmai, N.; Khancanaketu, T.; Temsiripong, Y.; Unajak, S.; Peyachoknagul, S.; Srikulnath, K. High genetic diversity and demographic history of captive Siamese and Saltwater crocodiles suggest the first step toward the establishment of a breeding and reintroduction program in Thailand. PLoS ONE 2017, 12, e0184526. [Google Scholar] [CrossRef] [PubMed] [Green Version]
  44. Jangtarwan, K.; Koomgun, T.; Prasongmaneerut, T.; Thongchum, R.; Singchat, W.; Tawichasri, P.; Fukayama, T.; Sillapaprayoon, S.; Kraichak, E.; Muangmai, N.; et al. Take one step backward to move forward: Assessment of genetic diversity and population structure of captive Asian woolly-necked storks (Ciconia episcopus). PLoS ONE 2019, 14, e0223726. [Google Scholar] [CrossRef] [Green Version]
  45. Jangtarwan, K.; Kamsongkram, P.; Subpayakom, N.; Sillapaprayoon, S.; Muangmai, N.; Kongphoemph, A.; Wongsodchuen, A.; Intapan, S.; Chamchumroon, W.; Safoowong, M.; et al. Predictive genetic plan for a captive population of the Chinese goral (Naemorhedus griseus) and prescriptive action for ex situ and in situ conservation management in Thailand. PLoS ONE 2020, 15, e0234064. [Google Scholar] [CrossRef]
  46. Thintip, J.; Singchat, W.; Ahmad, S.F.; Ariyaraphong, N.; Muangmai, N.; Chamchumroon, W.; Pitiwong, K.; Suksavate, W.; Duangjai, S.; Duengkae, P.; et al. Reduced genetic variability in a captive-bred population of the endangered Hume’s pheasant (Syrmaticus humiae, Hume 1881) revealed by microsatellite genotyping and D-loop sequencing. PLoS ONE 2021, 16, e0256573. [Google Scholar] [CrossRef]
  47. Wongtienchai, P.; Lapbenjakul, S.; Jangtarwan, K.; Areesirisuk, P.; Mahaprom, R.; Subpayakom, N.; Singchat, W.; Sillapaprayoon, S.; Muangmai, N.; Songchan, R.; et al. Genetic management of a water monitor lizard (Varanus salvator macromaculatus) population at Bang Kachao Peninsula as a consequence of urbanization with Varanus Farm Kamphaeng Saen as the first captive research establishment. J. Zool. Syst. Evol. Res. 2021, 59, 484–497. [Google Scholar] [CrossRef]
  48. Peakall, R.; Smouse, P.E. GenAlEx 6.5: Genetic analysis in Excel. Population genetic software for teaching and research—An update. Bioinformatics 2012, 28, 2537–2539. [Google Scholar] [CrossRef] [Green Version]
  49. Præstgaard, J.T. Permutation and bootstrap Kolmogorov-Smirnov tests for the equality of two distributions. Scand. J. Stat. 1995, 22, 305–322. [Google Scholar]
  50. R Core Team. R: A Language and Environment for Statistical Computing; R Foundation for Statistical Computing: Vienna, Austria, 2022. [Google Scholar]
  51. Goudet, J.F. FSTAT (version 1.2): A computer program to calculate F-statistics. J. Hered. 1995, 86, 485–486. [Google Scholar] [CrossRef]
  52. Chapuis, M.P.; Estoup, A. Microsatellite null alleles and estimation of population differentiation. Mol. Biol. Evol. 2007, 24, 621–631. [Google Scholar] [CrossRef] [PubMed] [Green Version]
  53. Nei, M. Genetic distance between populations. Am. Nat. 1972, 106, 283–292. [Google Scholar] [CrossRef]
  54. Piry, S.; Luikart, G.; Cornuet, J.M. BOTTLENECK: A computer program for detecting recent reductions in the effective population size using allele frequency data. J. Hered. 1999, 90, 502–503. [Google Scholar] [CrossRef]
  55. Garza, J.C.; Williamson, E.G. Detection of reduction in population size using data from microsatellite loci. Mol. Ecol. 2001, 10, 305–318. [Google Scholar] [CrossRef]
  56. Jombart, T. Adegenet: A R package for the multivariate analysis of genetic markers. Bioinformatics 2008, 24, 1403–1405. [Google Scholar] [CrossRef] [PubMed] [Green Version]
  57. Neuenschwander, S.; Hospital, F.; Guillaume, F.; Goudet, J. QuantiNemo: An individual based program to simulate quantitative traits with explicit genetic architecture in a dynamic metapopulation. Bioinformatics 2008, 24, 1552–1553. [Google Scholar] [CrossRef] [PubMed]
  58. Frankham, R. Genetics and extinction. Biol. Conserv. 2005, 126, 131–140. [Google Scholar] [CrossRef]
  59. Ballou, J.D.; Lees, C.; Faust, L.J.; Long, S.; Lynch, C.; Bingaman Lackey, L.; Foose, T.J. Demographic and genetic management of captive populations. In Wild Mammals in Captivity: Principles and Techniques for Zoo Management; University of Chicago Press: Chicago, IL, USA, 2006; p. 219. [Google Scholar]
  60. Fernando, P.; Lande, R. Molecular genetic and behavioral analysis of social organization in the Asian elephant (Elephas maximus). Behav. Ecol. 2000, 48, 84–91. [Google Scholar] [CrossRef]
  61. Heled, J.; Drummond, A.J. Bayesian inference of population size history from multiple loci. BMC Evol. Biol. 2008, 8, 289. [Google Scholar] [CrossRef] [Green Version]
  62. Bouckaert, R.; Vaughan, T.G.; Barido-Sottani, J.; Duchêne, S.; Fourment, M.; Gavryushkina, A.; Heled, J.; Jones, G.; Kühnert, D.; de Maio, N.; et al. BEAST 2.5: An advanced software platform for Bayesian evolutionary analysis. PLoS Comput. Biol. 2019, 15, e1006650. [Google Scholar] [CrossRef] [Green Version]
  63. Shoshani, J.; Tassy, P. Advances in proboscidean taxonomy & classification, anatomy & physiology, and ecology & behavior. Quat. Int. 2005, 126, 5–20. [Google Scholar] [CrossRef]
  64. Rohland, N.; Malaspinas, A.S.; Pollack, J.L.; Slatkin, M.; Matheus, P.; Hofreiter, M. Proboscidean mitogenomics: Chronology and mode of elephant evolution using mastodon as outgroup. PLoS Biol. 2007, 5, e207. [Google Scholar] [CrossRef] [PubMed]
  65. Tamura, K.; Stecher, G.; Kumar, S. MEGA11: Molecular evolutionary genetics analysis version 11. Mol. Biol. Evol. 2021, 38, 3022–3027. [Google Scholar] [CrossRef] [PubMed]
  66. Huelsenbeck, J.P.; Ronquist, F. MRBAYES: Bayesian inference of phylogenetic trees. Bioinformatics 2001, 17, 754–755. [Google Scholar] [CrossRef] [Green Version]
  67. Rambaut, A.; Drummond, A.J.; Xie, D.; Baele, G.; Suchard, M.A. Posterior summarization in Bayesian phylogenetics using Tracer 1.7. Syst. Biol. 2018, 67, 901–904. [Google Scholar] [CrossRef] [Green Version]
  68. Huang, C.J.; Shen, Y.; Chen, Y.H.; Chen, H.C. A novel hybrid deep neural network model for short-term electricity price forecasting. Int. J. Energy Res. 2021, 45, 2511–2532. [Google Scholar] [CrossRef]
  69. Frolov, V.; Faizov, B.; Shakhuro, V.; Sanzharov, V.; Konushin, A.; Galaktionov, V.; Voloboy, A. Image Synthesis Pipeline for CNN-Based Sensing Systems. Sensors 2022, 22, 2080. [Google Scholar] [CrossRef]
  70. Do, C.; Waples, R.S.; Peel, D.; Macbeth, G.M.; Tillett, B.J.; Ovenden, J.R. NeEstimator v2: Re-implementation of software for the estimation of contemporary effective population size (Ne) from genetic data. Mol. Ecol. Resour. 2014, 14, 209–214. [Google Scholar] [CrossRef]
  71. Wang, J. COANCESTRY: A program for simulating, estimating and analysing relatedness and inbreeding coefficients. Mol. Ecol. Resour. 2011, 11, 141–145. [Google Scholar] [CrossRef]
  72. CITES: Illegal Trade in Live Asian Elephants: Review of Current Legislative, Regulatory, Enforcement, and Other Measures across Range States. Available online: www.cites.org/sites/default/files/eng/cop/17/WorkingDocs/E-CoP17-57-01-A5.pdf (accessed on 20 March 2022).
  73. Sukmasuang, R.; Thongtip, N.; Bhumpakphan, N. The Studies of Ecology, Population, Distribution and Health to Solve Elephant Problems in Thailand; Kasetsart University Research and Development Institute: Bangkok, Thailand, 2013. [Google Scholar]
  74. Pintavongs, W.; Chueplaivej, P.; Boonyasart, B.; Kidyhoo, S.; Pravai, W.; Rattanakunuprakarn, J.; Ounsiri, S.; Lorsanyaluck, B.; Sunyathitiseree, P.; Jittapalapong, S.; et al. Domestic elephant population structure and health status in Thailand. J. Kasetsart Vet. 2014, 24, 16–24. [Google Scholar]
  75. Greenbaum, G.; Templeton, A.R.; Zarmi, Y.; Bar-David, S. Allelic richness following population founding events—A stochastic modeling framework incorporating gene flow and genetic drift. PLoS ONE 2014, 9, e115203. [Google Scholar] [CrossRef] [PubMed] [Green Version]
  76. McPhee, M.E. Generations in captivity increases behavioral variance: Considerations for captive breeding and reintroduction programs. Biol. Conserv. 2004, 115, 71–77. [Google Scholar] [CrossRef]
  77. Thitaram, C. Elephant Reproduction: Improvement of Breeding Efficiency and Development of a Breeding Strategy; Utrecht University: Utrecht, The Netherlands, 2009. [Google Scholar]
  78. Rosetti, N.; Remis, M.I. Spatial genetic structure and mitochondrial DNA phylogeography of Argentinean populations of the grasshopper Dichroplus elongatus. PLoS ONE 2012, 7, e40807. [Google Scholar] [CrossRef]
  79. Luan, S.; Chiang, T.Y.; Gong, X.U.N. High genetic diversity vs. low genetic differentiation in Nouelia insignis (Asteraceae), a narrowly distributed and endemic species in China, revealed by ISSR fingerprinting. Ann. Bot. 2006, 98, 583–589. [Google Scholar] [CrossRef] [PubMed]
  80. Wang, R.; Zheng, L.; Touré, Y.T.; Dandekar, T.; Kafatos, F.C. When genetic distance matters: Measuring genetic differentiation at microsatellite loci in whole-genome scans of recent and incipient mosquito species. Proc. Natl. Acad. Sci. USA 2001, 98, 10769–10774. [Google Scholar] [CrossRef] [Green Version]
  81. Wisely, S.M.; Buskirk, S.W.; Fleming, M.A.; McDonald, D.B.; Ostrander, E.A. Genetic diversity and fitness in black-footed ferrets before and during a bottleneck. J. Hered. 2002, 93, 231–237. [Google Scholar] [CrossRef] [Green Version]
  82. Kusza, S.; Suchentrunk, F.; Pucher, H.; Mar, K.U.; Zachos, F.E. High levels of mitochondrial genetic diversity in Asian elephants (Elephas maximus) from Myanmar. Hystrix 2018, 29, 152–154. [Google Scholar] [CrossRef]
  83. De Silva, M.; de Silva, P.K. The Sri Lankan Elephant: Its Evolution, Ecology and Conservation; WHT Publications: Colombo, Sri Lanka, 2007; p. 278. [Google Scholar]
  84. Shepherd, C.R.; Nijman, V. An Overview of the Regulation of the Freshwater Turtle and Tortoise Pet Trade in Jakarta, Indonesia; TRAFFIC Southeast Asia: Petaling Jaya, Malaysia, 2008; p. 24. [Google Scholar]
  85. Nijman, V. An overview of international wildlife trade from Southeast Asia. Biodivers. Conserv. 2010, 19, 1101–1114. [Google Scholar] [CrossRef] [Green Version]
  86. Van Horn, G.; Aodha, O.M.; Song, Y.; Cui, Y.; Sun, C.; Shepard, A.; Adam, H.; Perona, P.; Belongie, S. The inaturalist species classification and detection dataset. In Proceedings of the IEEE Conference on Computer Vision and Pattern Recognition, Salt Lake City, UT, USA, 18–22 June 2018; pp. 8769–8778. [Google Scholar]
  87. Tabak, M.A.; Norouzzadeh, M.S.; Wolfson, D.W.; Sweeney, S.J.; Vercauteren, K.C.; Snow, N.P.; Halseth, J.M.; DiSilvo, P.A.; Lewis, J.S.; White, M.D.; et al. Machine learning to classify animal species in camera trap images: Applications in ecology. Methods Ecol. Evol. 2019, 10, 585–590. [Google Scholar] [CrossRef] [Green Version]
  88. Valière, N. GIMLET: A computer program for analysing genetic individual identification data. Mol. Ecol. Resour. 2002, 2, 377–379. [Google Scholar] [CrossRef]
  89. Excoffier, L.; Lischer, H.E. Arlequin suite ver 3.5: A new series of programs to perform population genetics analyses under Linux and Windows. Mol. Ecol. Resour. 2010, 10, 564–567. [Google Scholar] [CrossRef] [PubMed]
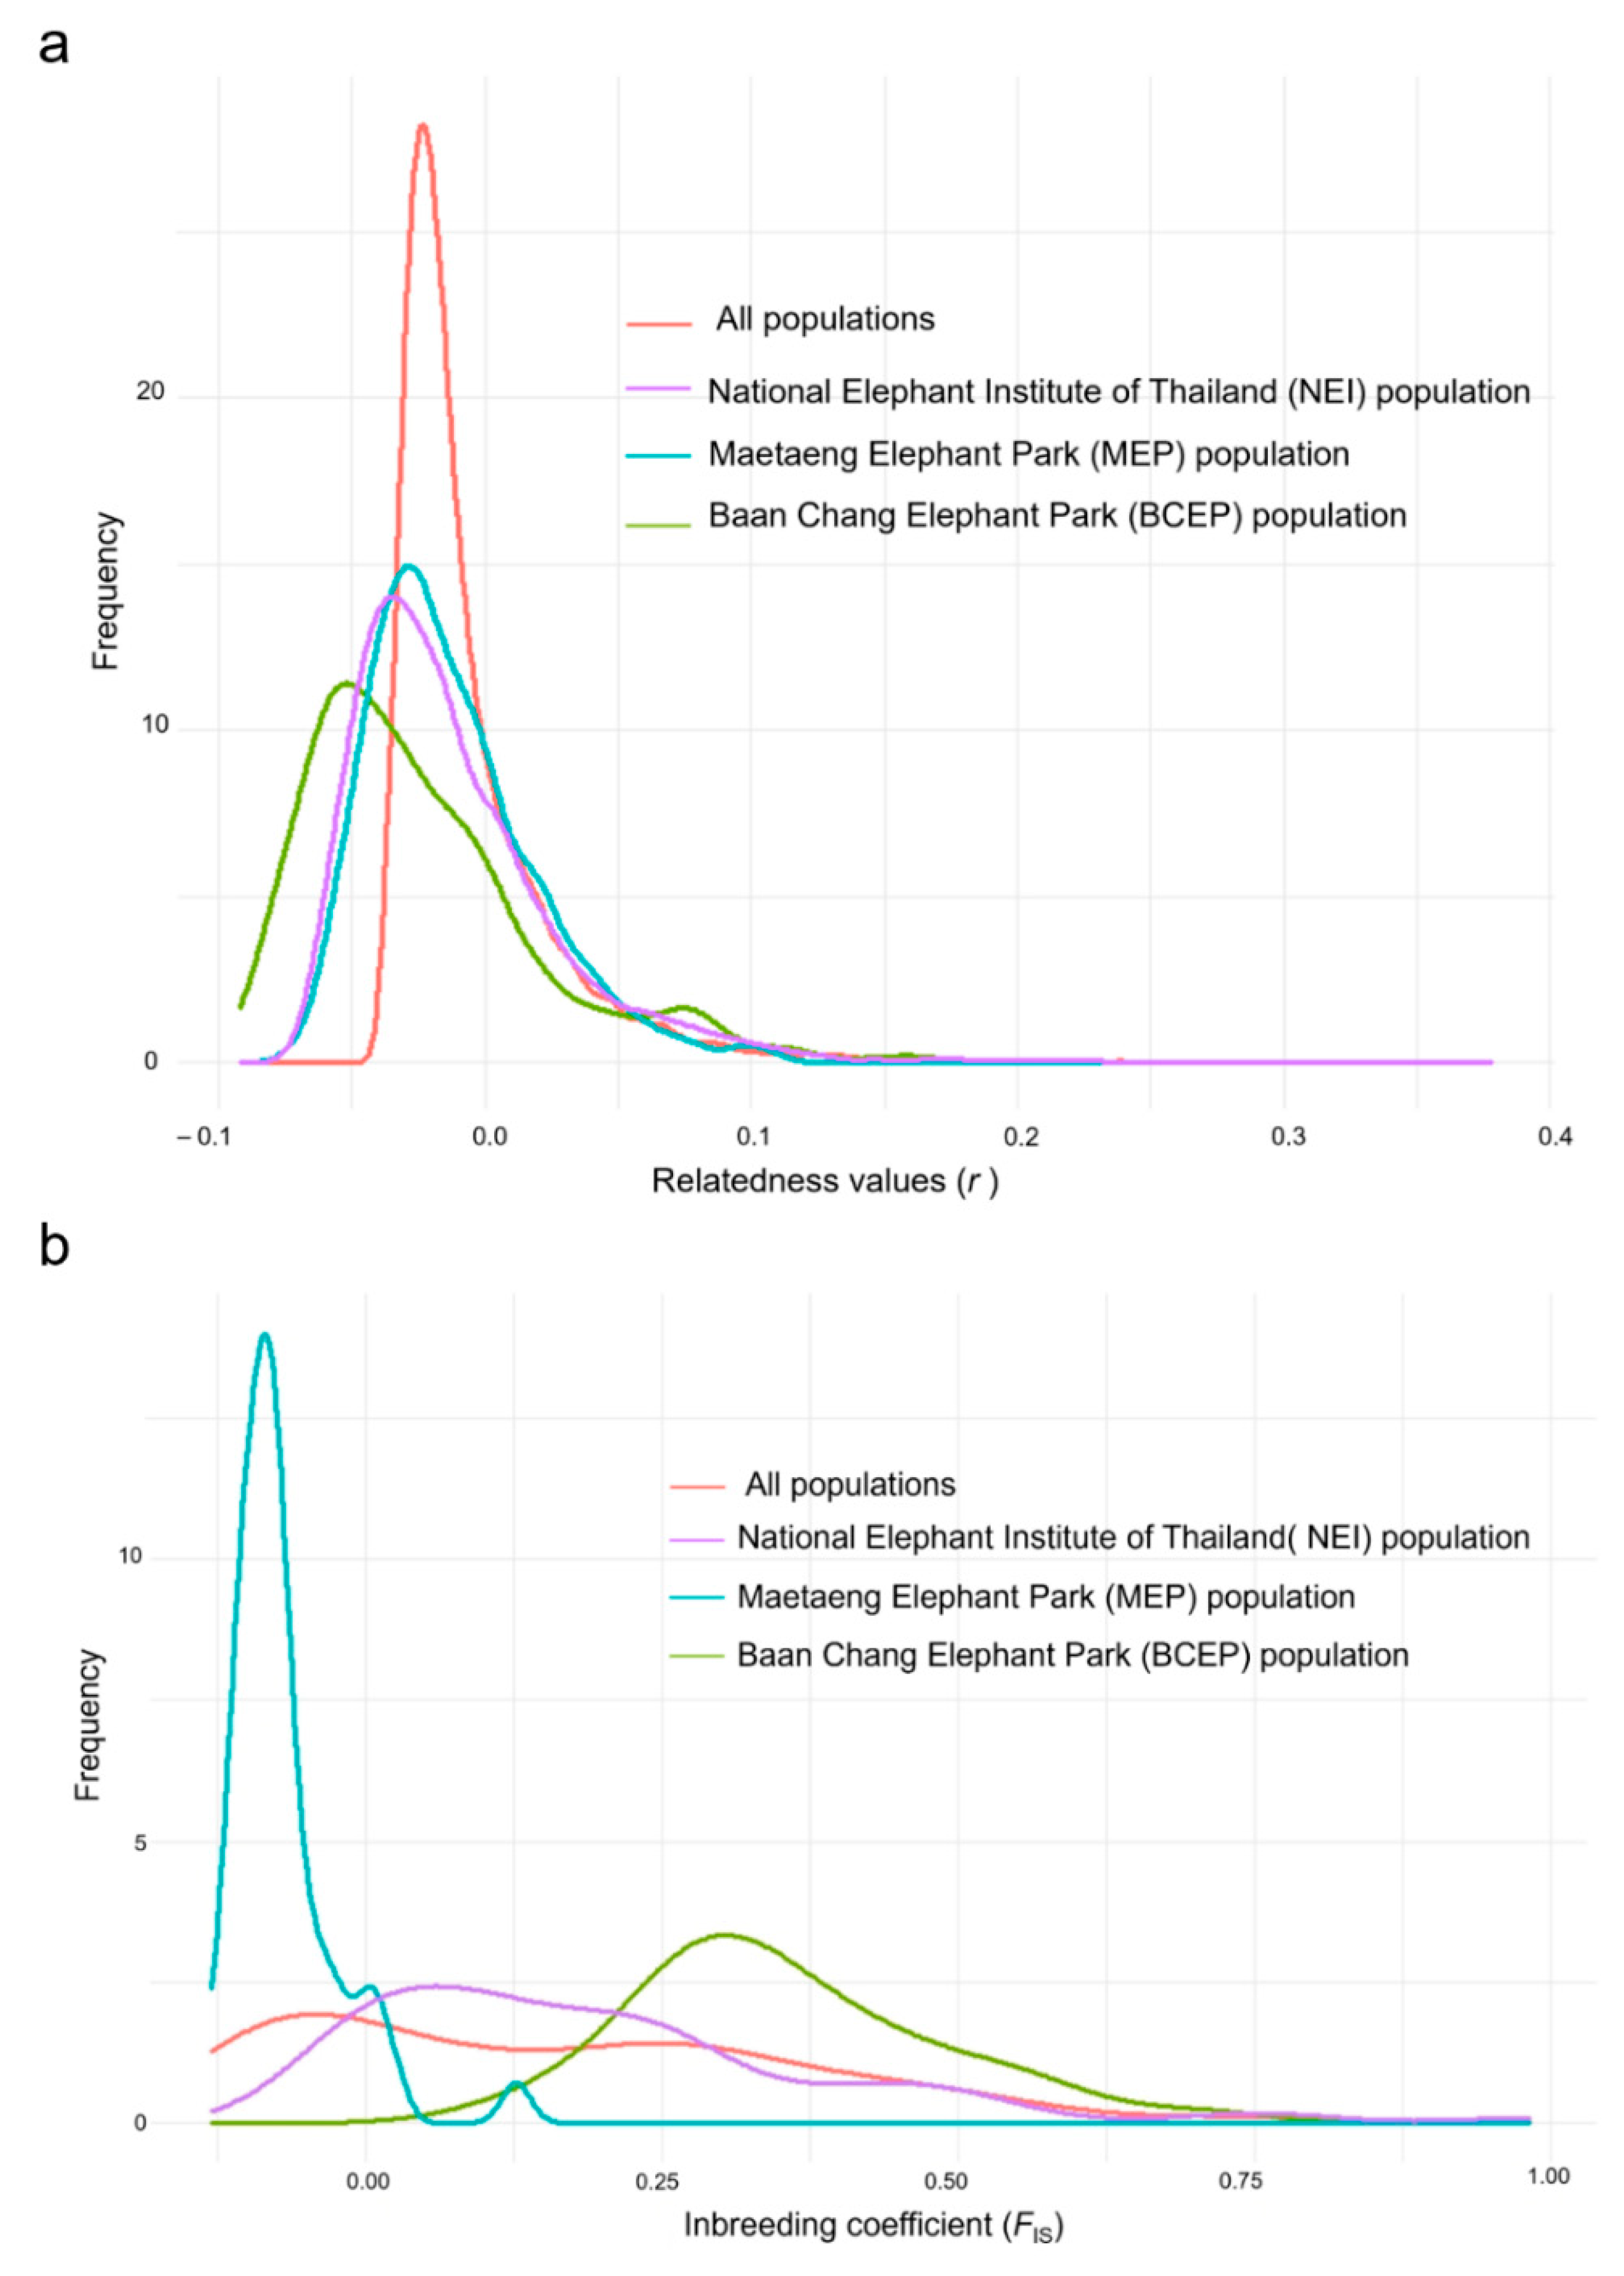
Figure 1. Observed distribution of (a) pairwise relatedness (r) and (b) inbreeding coefficients (FIS) for 158 Asian elephants (Elephas maximus, Linnaeus, 1758), plotted against the expected distributions.
Sustainability 14 15355 g001
Figure 2. (a) Principal component analysis of Asian elephants (Elephas maximus, Linnaeus, 1758) at the National Elephant Institute of Thailand (NEI, Lampang), Maetaeng Elephant Park (MEP, Chiang Mai), and Baan Chang Elephant Park (BCEP, Chiang Mai). Detailed information for all Asian elephant individuals is presented in Table S1, (b) discriminant analysis of principal components (DAPC) results. Scatter plot, based on the DAPC output for three assigned genetic clusters, each indicated by different colors. Dots represent different individuals.
Sustainability 14 15355 g002
Figure 3. Population structure of 158 Asian elephant (Elephas maximus, Linnaeus, 1758) individuals. Each vertical bar on the x-axis represents an individual, while the y-axis represents the proportion of membership (posterior probability) in each genetic cluster. Asian elephants are superimposed on the plot, with black vertical lines indicating the boundaries. Asterisks indicate the wild-born individuals. Detailed information for all Asian elephant individuals is presented in Table S1.
Sustainability 14 15355 g003
Figure 4. Simulation results showing the relationships between generations; (a) number of alleles, (b) heterozygosity, and (c) allelic richness.
Sustainability 14 15355 g004
Figure 5. Haplotype network, based on the sequence data for the mitochondrial D-loop region of Asian elephants (Elephas maximus, Linnaeus, 1758) from the National Elephant Institute of Thailand (NEI, Lampang), Maetaeng Elephant Park (MEP, Chiang Mai), and Baan Chang Elephant Park (BCEP, Chiang Mai). EM = haplotype
Sustainability 14 15355 g005
Figure 6. Coalescent Bayesian skyline analysis output. The black line is the median estimated effective population size. Blue areas represent the upper and lower bounds of the 95% higher posterior density interval. (a) the National Elephant Institute of Thailand (NEI, Lampang), (b) Maetaeng Elephant Park (MEP, Chiang Mai), (c) Baan Chang Elephant Park (BCEP, Chiang Mai).
Sustainability 14 15355 g006
Table 1. Genetic diversity among 158 Asian elephants (Elephas maximus, Linnaeus, 1758), based on 18 microsatellite loci.
Population NNaARNeIHoHeM RatioPICF
NEI 1Mean7215.05615.0566.0551.9610.3290.7690.6850.7470.575
S.E.02.0368.6401.0400.1440.0460.0300.3900.1370.059
MEP 2Mean4611.11111.1115.3091.7110.7140.7211.3050.687−0.018
S.E.01.7777.5380.9280.1590.0470.0411.2760.1890.067
BCEP 3Mean4011.05611.0565.9101.8140.2040.7470.3660.7180.677
S.E.01.4065.9651.0590.1540.0550.0370.3050.1710.089
All PopulationMean15812.40712.4075.7581.8280.4160.7450.7850.7170.412
S.E.01.0297.3810.5740.0870.0410.0210.6570.1650.059
Sample size (N); number of alleles (Na); allelic richness (AR); number of effective alleles (Ne); Shannon’s information index (I); observed heterozygosity (Ho); expected heterozygosity (He); M ratio test (M ratio); polymorphic information content (PIC); fixation index (F). 1 NEI = The National Elephant Institute of Thailand, Lampang. 2 MEP = Maetaeng Elephant Park, Chiang Mai. 3 BCEP = Baan Chang Elephant Park, Chiang Mai.
Table 2. Comparison of the genetic diversity parameters between Asian elephant (Elephas maximus, Linnaeus, 1758) populations, based on 18 loci.
Population 1Population 2df 4SE 5t-Testp-Value
heterozygosity (Ho)NEI 1MEP 2−0.3850.066−5.854<0.05
NEIBCEP 30.1250.0721.7430.085
MEPBCEP0.5100.0727.049<0.05
heterozygosity (He)NEIMEP0.0480.0500.9450.347
NEIBCEP0.0220.0480.4620.645
MEPBCEP−0.0260.055−0.4710.639
1 NEI = The National Elephant Institute of Thailand, Lampang. 2 MEP = Maetaeng Elephant Park, Chiang Mai. 3 BCEP = Baan Chang Elephant Park, Chiang Mai.4 df = Difference of mean 5 SE = Standard error.
Table 3. Inbreeding coefficients, relatedness, effective population size, and ratio of the effective population size and census population (Ne/N) of Asian elephants (Elephas maximus, Linnaeus, 1758) at the National Elephant Institute of Thailand (NEI, Lampang), Maetaeng Elephant Park (MEP, Chiang Mai), and Baan Chang Elephant Park (BCEP, Chiang Mai).
PopulationNFISRelatedness (r)Estimated Ne95% CIs for NeNe/N
NEI 1720.195 ± 0.201−0.011 ± 0.04038.60033.800–199.1000.536
MEP 246−0.069 ± 0.045−0.012 ± 0.032153.70095.200–245.6003.341
BCEP 3400.354 ± 0.126−0.023 ± 0.046103.60073.000–217.3002.590
Estimates were calculated using NeEstimator version 2.1 [70], COANCESTRY version 1.0.1.9 [71], and GenAlEx version 6.5 [48]. Detailed information for all elephant individuals is presented in Table S1. Sample size (N); inbreeding coefficient (FIS); effective population size (Ne). 1 NEI = The National Elephant Institute of Thailand, Lampang. 2 MEP = Maetaeng Elephant Park, Chiang Mai. 3 BCEP = Baan Chang Elephant Park, Chiang Mai.
Table 4. Mitochondrial D-loop sequence diversity for Asian elephants (Elephas maximus, Linnaeus, 1758).
PopulationNNumber of haplotypes (H)Theta (Per Site) from SAverage Number of Nucleotide
Differences (k)
Overall HaplotypeNucleotide Diversities (π)
NEI 172320.11935.4160.920 ± 0.0200.099 ± 0.048
MEP 246140.0177.9310.901± 0.0240.023 ± 0.012
BCEP 340200.0237.7790.936 ± 0.0190.022 ± 0.012
All populations158490.10621.3680.928 ± 0.0100.060 ± 0.030
1 NEI = The National Elephant Institute of Thailand, Lampang. 2 MEP = Maetaeng Elephant Park, Chiang Mai. 3 BCEP = Baan Chang Elephant Park, Chiang Mai.
Table 5. Genetic differentiation between the three populations of Asian elephants (Elephas maximus, Linnaeus, 1758) for the D-loop sequence. Genetic differentiation coefficient (GST), Wright’s F-statistics for the subpopulations within the total population (FST), ΦST, gene flow (Nm) from the sequence data and the haplotype data, the average number of nucleotide substitutions per site between populations (Dxy) and the net nucleotide substitutions per site between populations (Da).
Population 1Population 2GSTΦSTFSTDxyDaNm
NEI 1MEP 20.0090.0500.081 **0.0660.0065.693
NEIBCEP 30.0100.0480.081 **0.0670.0075.692
MEPBCEP0.0010.0280.036 *0.0220.00113.380
* p < 0.05, ** p < 0.01. 1 NEI = The National Elephant Institute of Thailand, Lampang. 2 MEP = Maetaeng Elephant Park, Chiang Mai. 3 BCEP = Baan Chang Elephant Park, Chiang Mai.
Table 6. Neutrality tests of the mitochondrial D-loop sequence for Asian elephants (Elephas maximus, Linnaeus, 1758).
PopulationTajimaFu D*Fu F*Fu’s FsEwens–Watterson TestChakraborty’s TestRamos–Onsins and RozasRaggedness Index
NEI 10.295 ns0.255 ns−0.044 ns4.465 ns0.989 ns0.080 ns0.109 ns0.023 ns
MEP 21.132 ns−0.204 ns0.243 ns1.544 ns0.251ns0.100 ns0.150 ns0.030 ns
BCEP 3−0.093 ns−1.125 ns−0.990 ns−2.964 ns0.721 ns0.064 ns0.114 ns0.017 ns
All populations−0.861 ns−0.635 ns−1.154 ns−0.277 ns0.989 ns0.072 ns0.062 ns0.015 ns
ns = not significant. 1 NEI = The National Elephant Institute of Thailand, Lampang. 2 MEP = Maetaeng Elephant Park, Chiang Mai. 3 BCEP = Baan Chang Elephant Park, Chiang Mai.
Table 7. Classification accuracy of five convolutional neural network models.
ModelTop-1
% Accuracy
Top-3
% Accuracy
Top-5
% Accuracy
Top-7
% Accuracy
Rank
% Average
143.860.968.876.66.5
243.867.276.679.75.6
335.964.175.081.35.5
450.068.875.078.15.0
534.459.468.878.15.2
Average41.664.172.878.85.6
Publisher’s Note: MDPI stays neutral with regard to jurisdictional claims in published maps and institutional affiliations.