Article

Water Column Detection Method at Impact Point Based on Improved YOLOv4 Algorithm

1
Weapon Engineering College, Naval University of Engineering, Wuhan 430034, China
2
School of Information Science and Engineering, Wuhan University of Science and Technology, Wuhan 430081, China
*
Author to whom correspondence should be addressed.
Sustainability 2022, 14(22), 15329; https://doi.org/10.3390/su142215329
Submission received: 22 October 2022 / Revised: 15 November 2022 / Accepted: 16 November 2022 / Published: 18 November 2022
(This article belongs to the Special Issue Artificial Intelligence Applications for Sustainable Urban Living)

Abstract

:
For a long time, the water column at the impact point of a naval gun firing at the sea has mainly depended on manual detection methods for locating, which has problems such as low accuracy, subjectivity and inefficiency. In order to solve the above problems, this paper proposes a water column detection method based on an improved you-only-look-once version 4 (YOLOv4) algorithm. Firstly, the method detects the sea antenna through the Hoffman line detection method to constrain the sensitive area in the current detection image so as to improve the accuracy of water column detection; secondly, density-based spatial clustering of applications with noise (DBSCAN) + K-means clustering algorithm is used to obtain a better prior bounding box, which is input into the YOLOv4 network to improve the positioning accuracy of the water column; finally, the convolutional block attention module (CBAM) is added in the PANet structure to improve the detection accuracy of the water column. The experimental results show that the above algorithm can effectively improve the detection accuracy and positioning accuracy of the water column at the impact point.

1. Introduction

For a long time, the navy has generally used manual methods to detect the offset distance between the impact point and target of naval gun training. There are problems, such as low accuracy, subjectivity, and inefficiency. It is urgent to build a new high-precision automatic target picking system to guide the troops to carry out scientific and effective training. In the automatic target-picking system, the accuracy of detecting and positioning the water column will directly affect the shooting evaluation results.
Water column detection belongs to moving target detection [1]. The use of traditional algorithms in moving target detection has been widely investigated. In [2], the authors combined the development and status quo of target-detection algorithms and made prospects. Traditional algorithms include the scale-invariant feature transform (SIFT) algorithm [3], PCA-SIFT algorithm [4], speeded up robust feature (SURF) algorithm [5], etc. It is pointed out that PCA-SIFT and SURF algorithms simplify the matching process of SIFT, respectively, so the speed will be relatively fast, but the detection accuracy and positioning accuracy based on feature point matching will also decline. In [6], the author proposed a target detection method based on a new cascade classifier, which is composed of a multiscale block-local binary patterns (MB-LBP) feature classifier, SIFT feature classifier and SURF feature classifier, with high precision. In [7], the author proposed a moving target-detection algorithm based on the spectral residual algorithm and K-means clustering algorithm. At first, the algorithm extracts the accelerator bar feature SURF every two frames and registers the images; secondly, the visual salient features is extracted from the frame difference results by using the spectral residual algorithm to remove the noise and pseudo moving targets caused by inaccurate matching; at last, after morphological processing, the improved K-means clustering algorithm is introduced to cluster discontinuous contours to form a complete goal.
The target detection based on deep learning was developed for moving target detection to overcome the limitations of the traditional algorithm. In [2], the authors summed up target detection algorithms based on depth learning, including the faster region convolutional network (Faster R-CNN) algorithm [8,9,10], SSD algorithm [11,12], YOLO [13], YOLOv2 [14], YOLOv3 [15], YOLOv4 [16,17,18,19], YOLOv5 [20] algorithm, etc. It is also pointed out that both YOLO series and single-shot multiBox detector (SSD) algorithms follow the method of R-CNN series algorithms to perform classification pre-training on large datasets, and then fine-tune on small datasets. In [21], the authors proposed a complex pedestrian detection model based on the YOLOv4 improved algorithm to solve the problem of pedestrian pose and scale diversity and pedestrian occlusion. The model uses an improved K-means clustering algorithm to analyze the real frame size of the pedestrian dataset, and then uses the path aggregation network (PANet) for multi-scale feature fusion to improve the detection effect. In [22], the authors proposed a steel strip surface defect detection method based on the improved you-only-look-once version 4 (YOLOv4) algorithm. The attention mechanism is embedded in the backbone network structure, and the path aggregation network is modified into a customized receptive field block structure, which strengthens the feature extraction functionality of the network model. In [23], the authors used hollow convolution to resample the feature image to improve the feature extraction and target detection performance. In addition, they used the ultra-lightweight subspace attention mechanism (ULSAM) to derive different attention feature maps for each subspace of the feature map for multi-scale feature representation. Finally, soft non-maximum suppression (Soft-NMS) was introduced to minimize the occurrence of missed targets due to occlusion. In [24], the authors proposed the first comprehensive study and analysis of wheat grain detection by using improved YOLOv5. Specifically, the authors designed a machine vision system and constructed a wheat grain detection benchmark (WGDB), including 1746 images with 7844 bounding boxes, all of which were independently classified. Utilizing this dataset, the authors conducted a comprehensive study of the most advanced objection detection methods. In addition, the authors proposed a wheat grain detection network (WGNet) trained on this benchmark as a baseline, aiming to solve the degradation issues by employing sparse network pruning and a hybrid attention module. In [25], the authors proposed a deep learning model based on the attention mechanism for tomato virus disease recognition. A squeeze-and-excitation (SE) module was added to a YOLOv5 model to realize the extraction of key features, using a human visual attention mechanism for reference. In [26], the authors used the Faster R-CNN algorithm to extract core features in batches, and calculate and identify engineering rock mass quality at high speed. The author of reference [27] proposed a small target detection algorithm based on improved SSD. This algorithm enhances the semantic information of deep and deep features through the local and global information of the feature map of three scales, and introduces spatial attention mechanism and coordinate attention mechanism to enrich the semantic information and location information of the feature map to be merged. At the same time, the attention enhancement module is used to further fuse the expression ability of features.
Based on the analysis of the above algorithms, this paper proposes an improved YOLOv4 algorithm to detect water column targets. First, Hoffman line detection is performed on the image, and the sea antenna is extracted. Secondly, the water column marked frame is clustered to obtain an ideal bounding box, according to the DBSCAN + K-means algorithm. Finally, fuzzy water column is extracted by the improved YOLOv4 PANet structure.

2. Basics of YOLOv4 Algorithm

This section introduces the principle and network structure of the YOLOv4 algorithm.

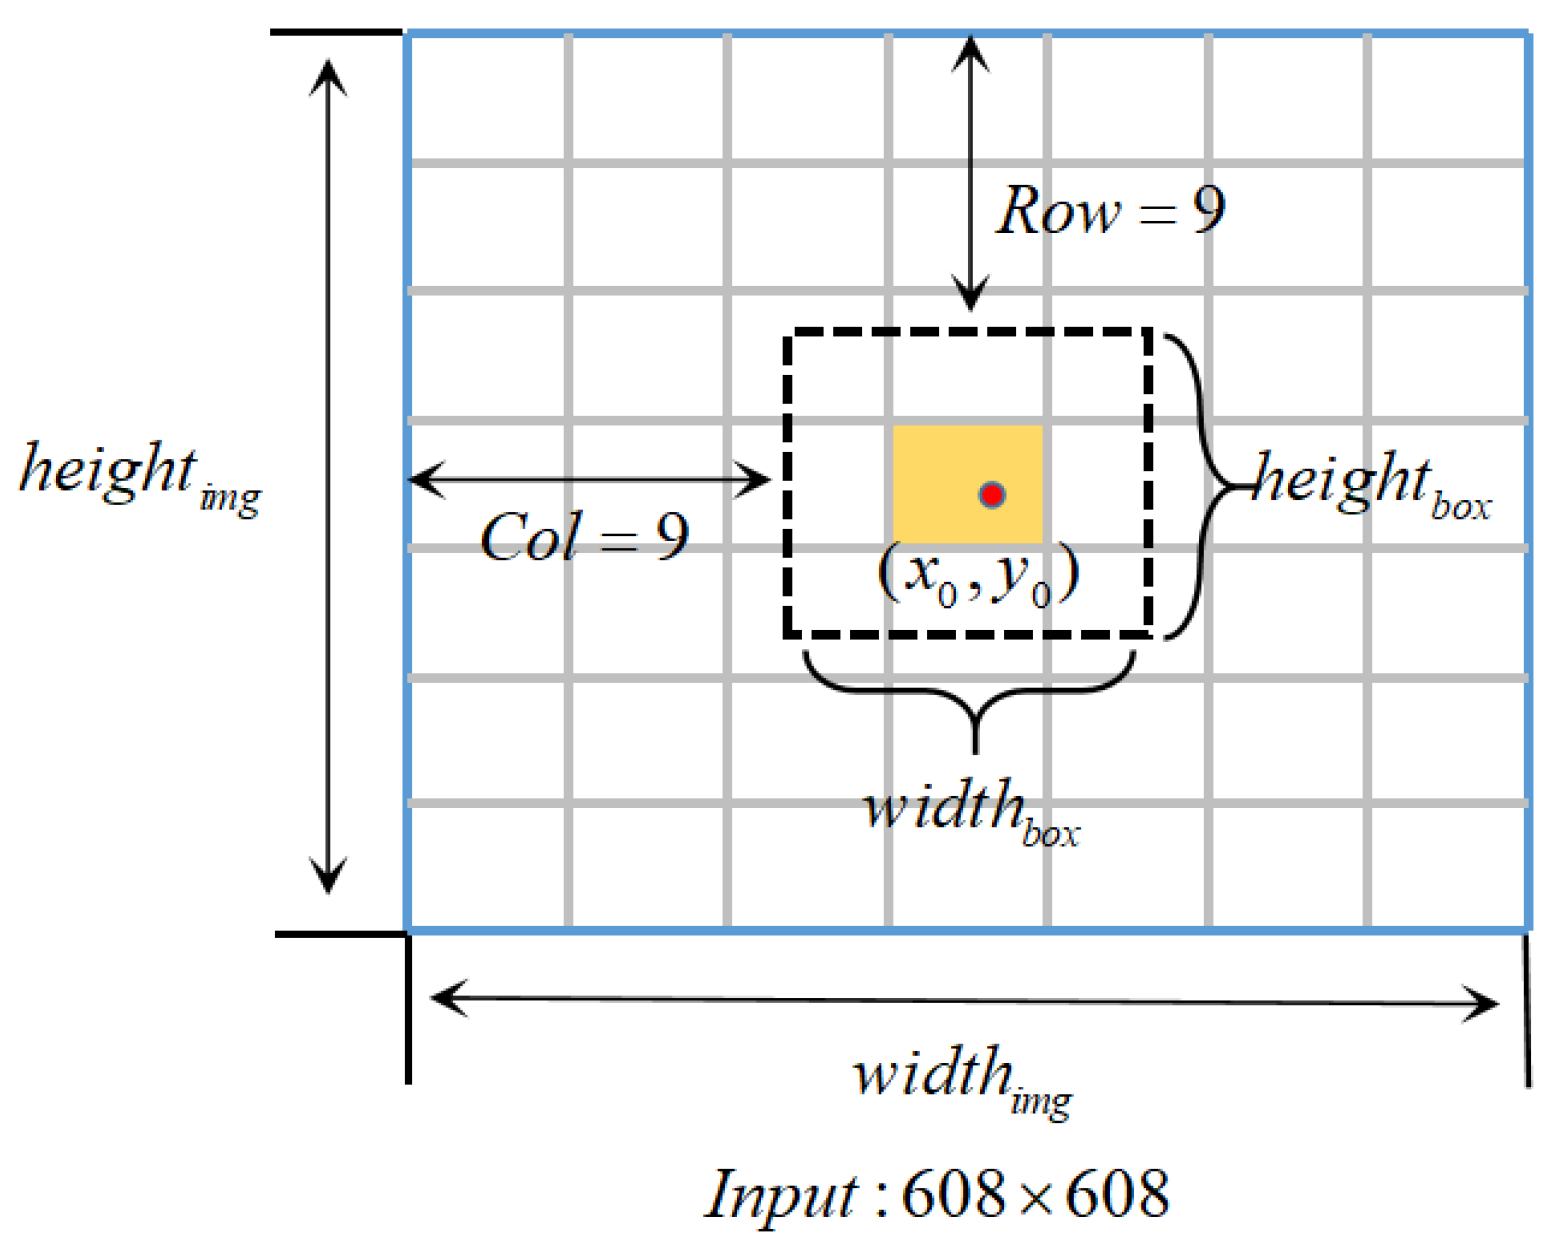
2.1. The Principle of YOLOv4 Algorithm

The YOLOv4 algorithm divides the network into S × S grid cell. Then, each grid predicts B bounding boxes, the confidence level of the bounding box, and the probability of the category. The confidence level of the prediction bounding box reflects whether the prediction bounding box contains targets and the positioning accuracy of targets. The accuracy is expressed as the intersection union ratio (IOU) of the predicted bounding box and the actual bounding box, as shown in Equation (1):
c o n f i d e n c e = P r ( o b j e c t ) × I O U p r e d t r u t h .
As shown in Equation (1), confidence represents the confidence level of the prediction bounding box and represents the probability of the target being detected.
The boundary box with high category confidence will be retained by setting the category confidence threshold, and the final boundary box will be obtained by combining the non-maximum suppression algorithm. The prediction box contains four parameters t x , t y , t w and t z . To reduce the impact of singular samples on the network, the YOLOv4 algorithm normalizes the above parameters. As shown in Figure 1, the input image of 608 × 608 is divided into 19 × 19 grid cells. The width and height of the image are expressed as w i d t h i m g and h e i g h t i m g , and the width and height are divided into 19 × 19 grid cells. Dotted lines represent the prediction bounding box. The coordinate of the center point is ( x 0 , y 0 ) , and the grid location of the center point is ( r o w , c o l ) . The width and height of the bounding box are w i d t h b o x and h e i g h t b o x , respectively. The normalization method is described as follows:
(1)
Normalize the width and height of the bounding box according to Equations (2) and (3):
t w = w i d t h b o x w i d t h i m g
t h = h e i g h t b o x h e i g h t i m g
(2)
Normalize the coordinates of the center point according to Equations (4) and (5):
t x = x 0 × s w i d t h i m g c o l
t y = y 0 × s h e i g h t i m g r o w

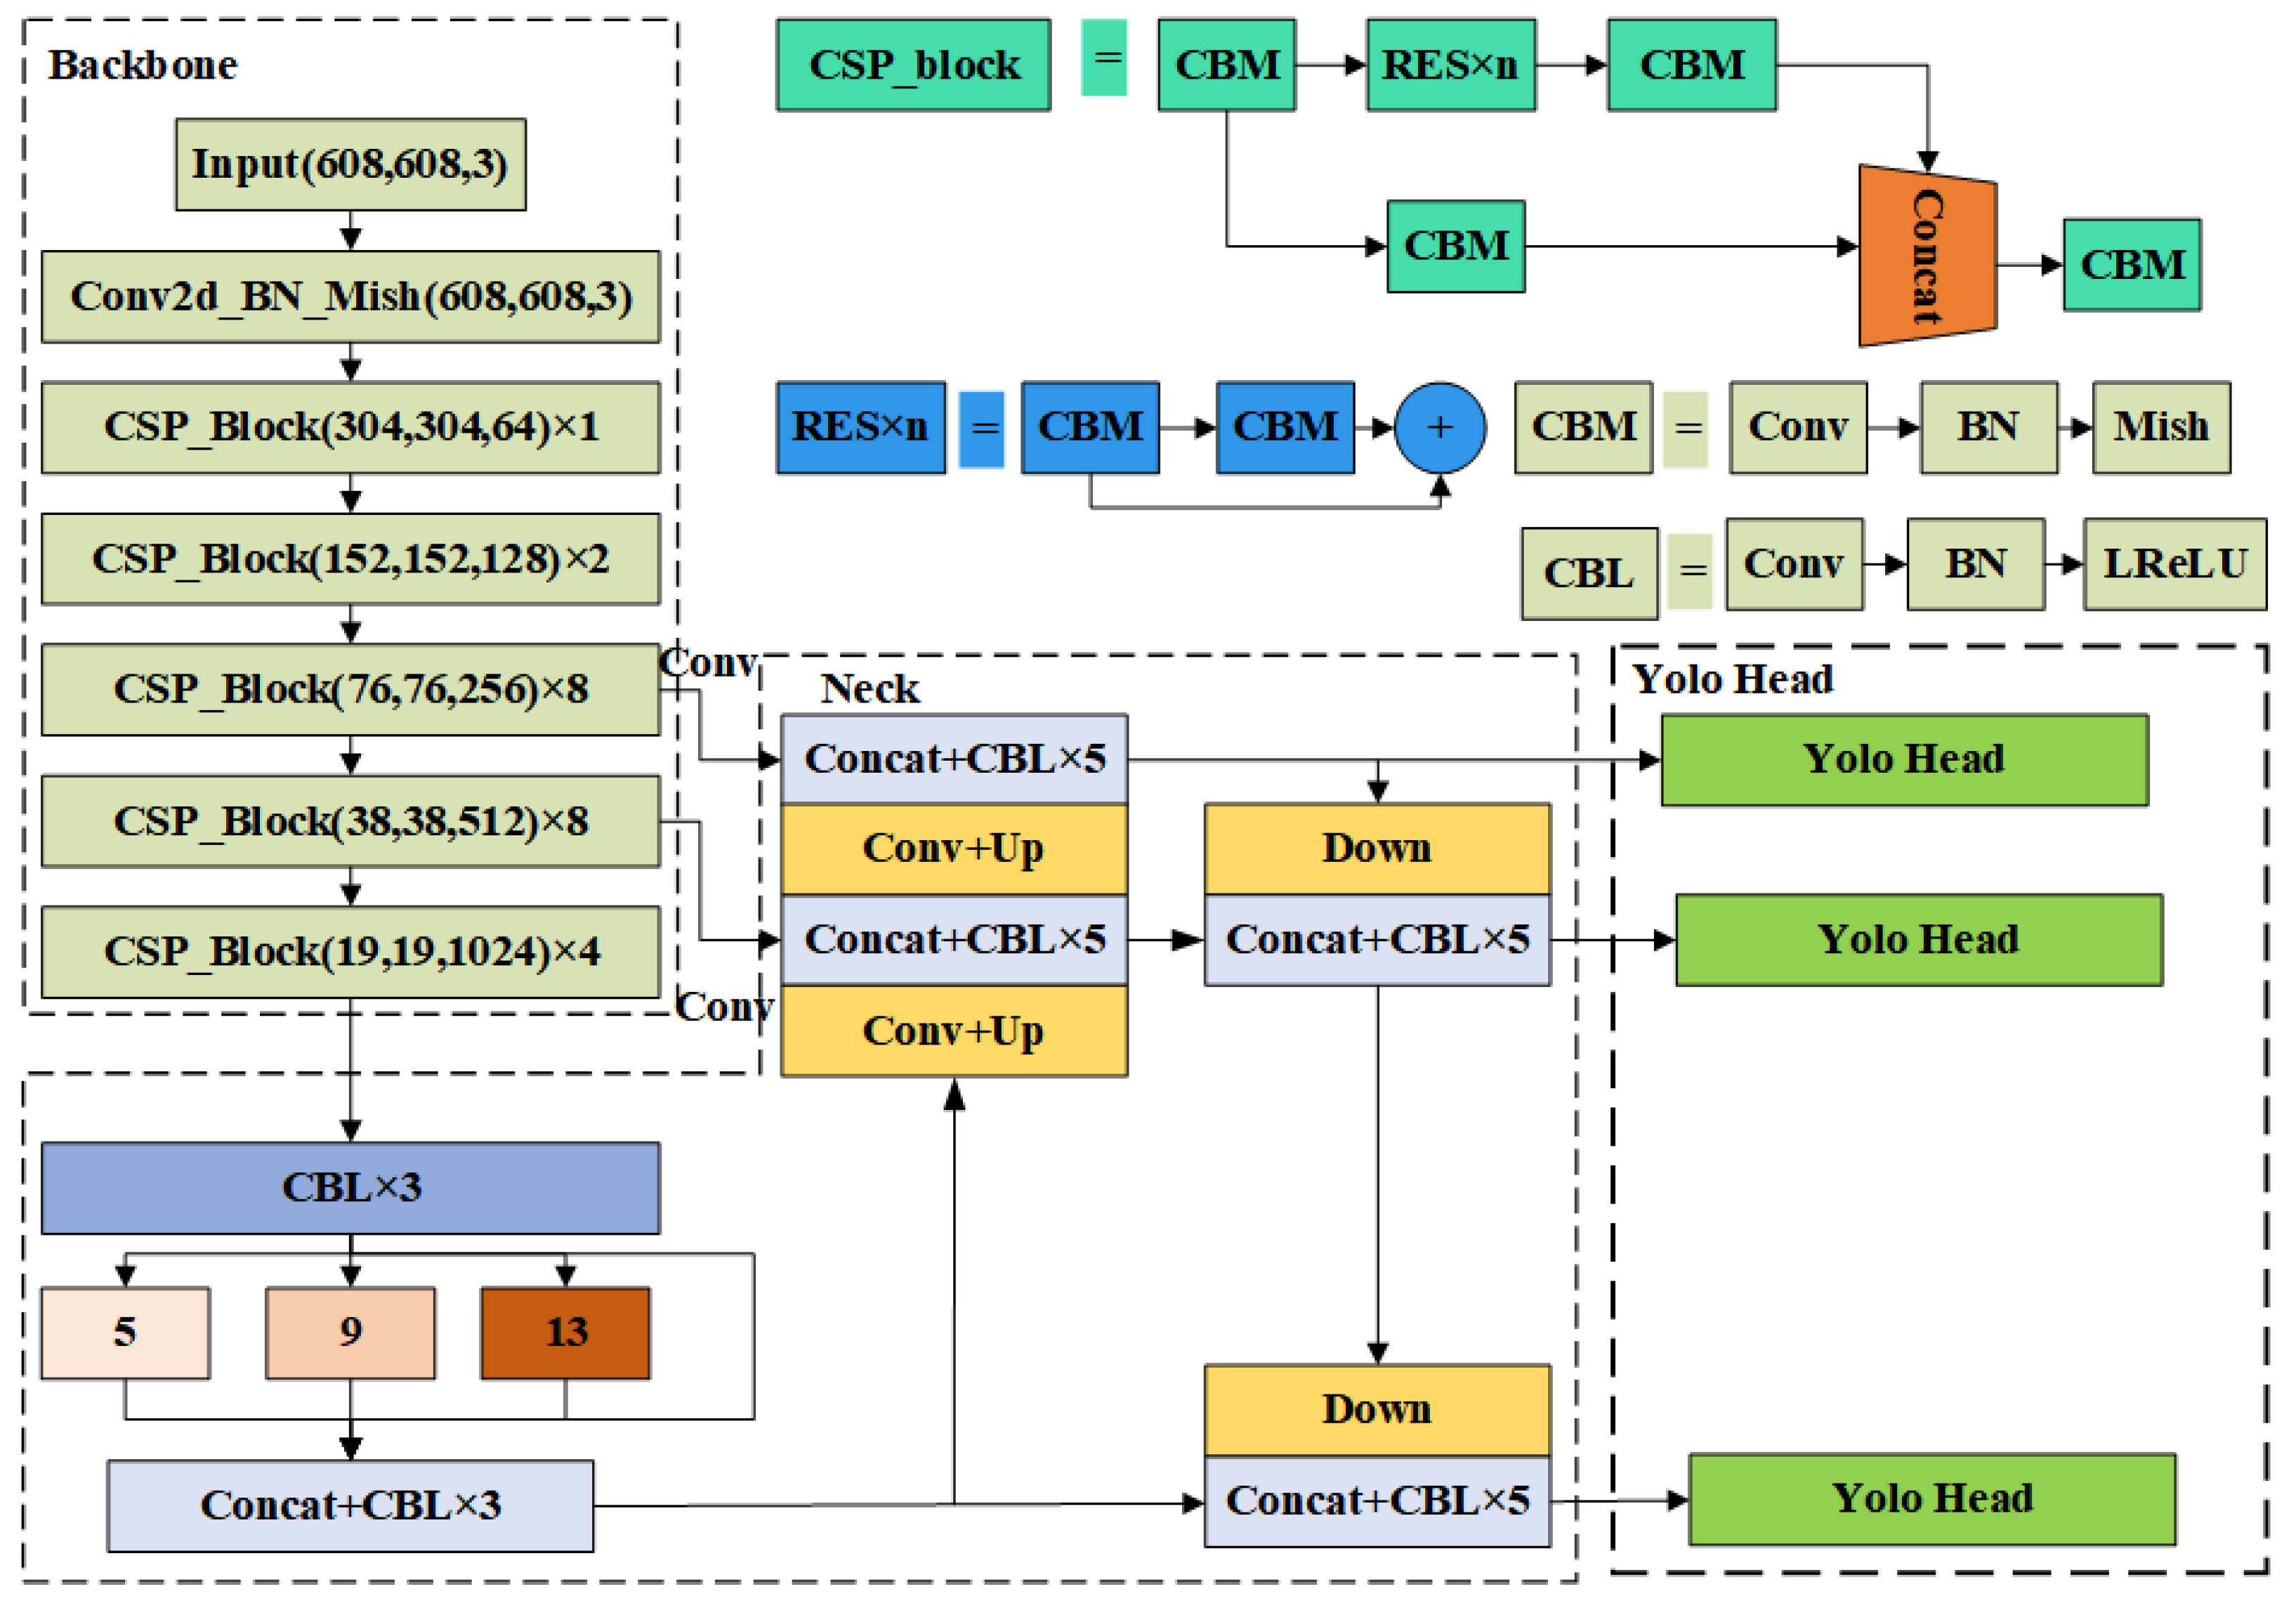
2.2. The Network Structure of The YOLOv4 Algorithm

The network structure of the YOLOv4 algorithm is mainly composed of three parts, namely the backbone network, neck network and head network. The network structure of the algorithm is shown in Figure 2. On the backbone network, the backbone network of the YOLOv4 algorithm is the CSPParknet53 network, which is mainly composed of five CSPNet residual blocks. The introduction of the CSPNet residual not only reduces the network computation, but also enhances the feature extraction. In terms of the activation function, the CSPParknet53 network uses the Mish activation function to further enhance the propagation of deep network information. On the neck network, the YOLOv4 algorithm uses a combination structure of the SPP (spatial pyramid) module and PANet. The SPP module carries out 13 × 13 , 9 × 9 , 5 × 5 and 1 × F o u r different scale maximum pooling operations to effectively increase the receptive field of the network and extract significant context features. PANet is mainly improved based on the FPN (feature pyramid network). A bottom-up path is added on the basis of the FPN to enhance the fusion between different feature maps.
YOLOv4 uses multi-scale prediction, and the final output of the head network is 13 × 13 , 26 × 26 , 52 × 52 . The detection head of 52 detects large, medium and small targets, respectively. Finally, the position and size of the prediction box are obtained by using the pre-set prior box size and the relative offset.

3. Improved YOLOv4 Algorithm

The target picking system requires high water column detection accuracy, which is more than 90 % , and thus the algorithm is needed to detect fog, small water columns or water columns in other extreme situations effectively. Under the condition, the YOLOv4 algorithm will fail to detect and make false detection. In order to avoid the situation, the paper uses two methods to improve: One is to extract the sea antenna features in the image through the Hoffman line detection algorithm, and determine the sensitive area in the image through the sea sky line so as to constrain the approximate position of the water column and eliminate the interference of noise such as spray and water reflection. The other is to improve the detection accuracy of small targets by CBAM being added to the PANet module.
The YOLOv4 network framework generally selects the K-means algorithm to cluster and analyze the size information of the prior bounding box, but it performed poorly in water column positioning. Therefore, the DBSCAN + K-means algorithm is selected to determine the size of the prior bounding box.
In summary, for the target picking scenario of unmanned surface vehicles (USVs), the improvement of YOLOv4 mainly includes the following three aspects:
(1)
Sea antenna detection based on Hoffman space.
(2)
DBSCAN + K-means clustering algorithm analysis prior box.
(3)
Improved PANet structure based on CBAM.

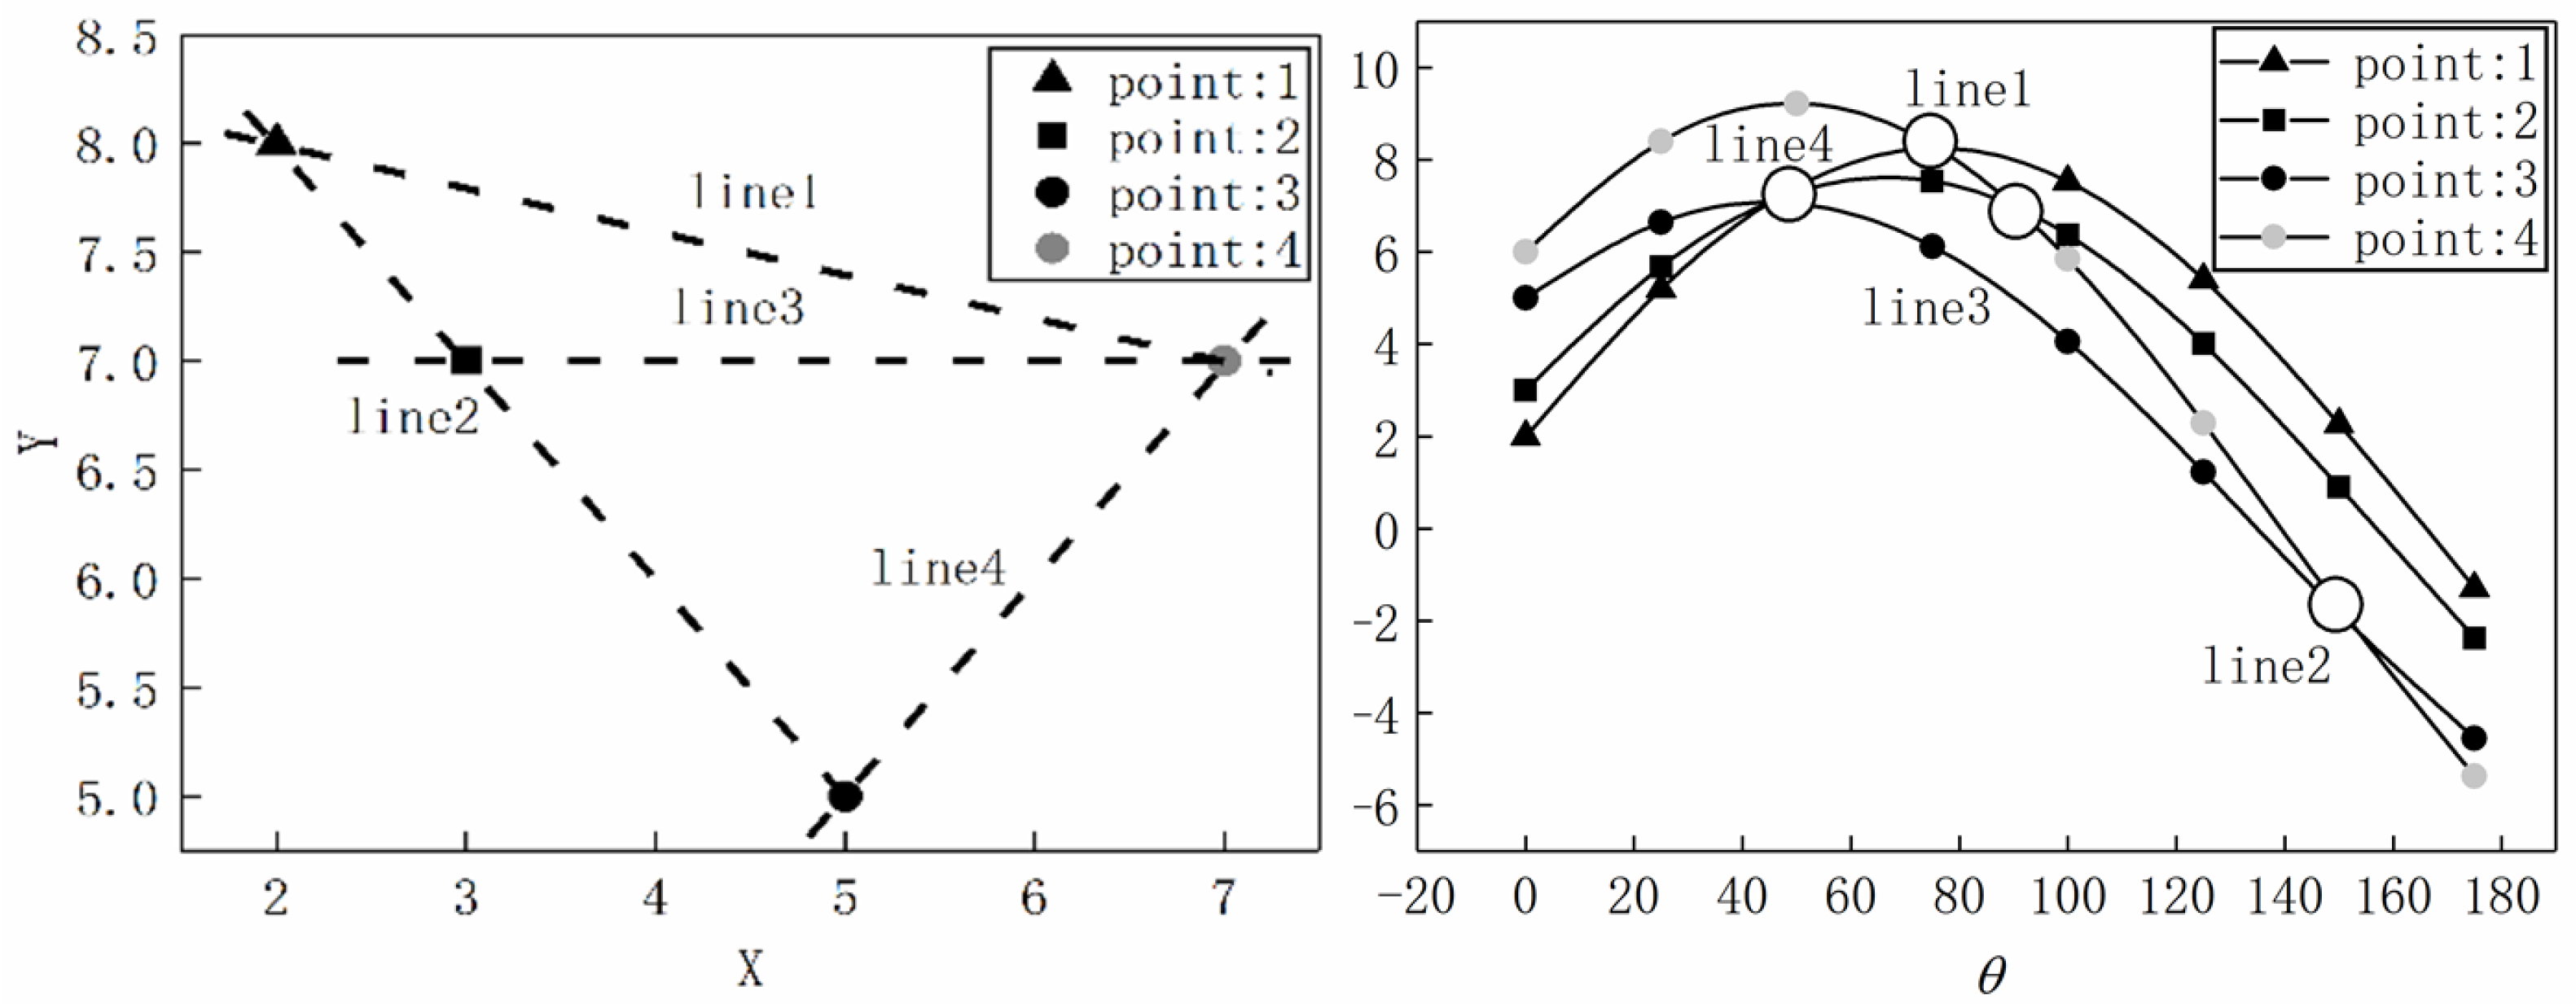
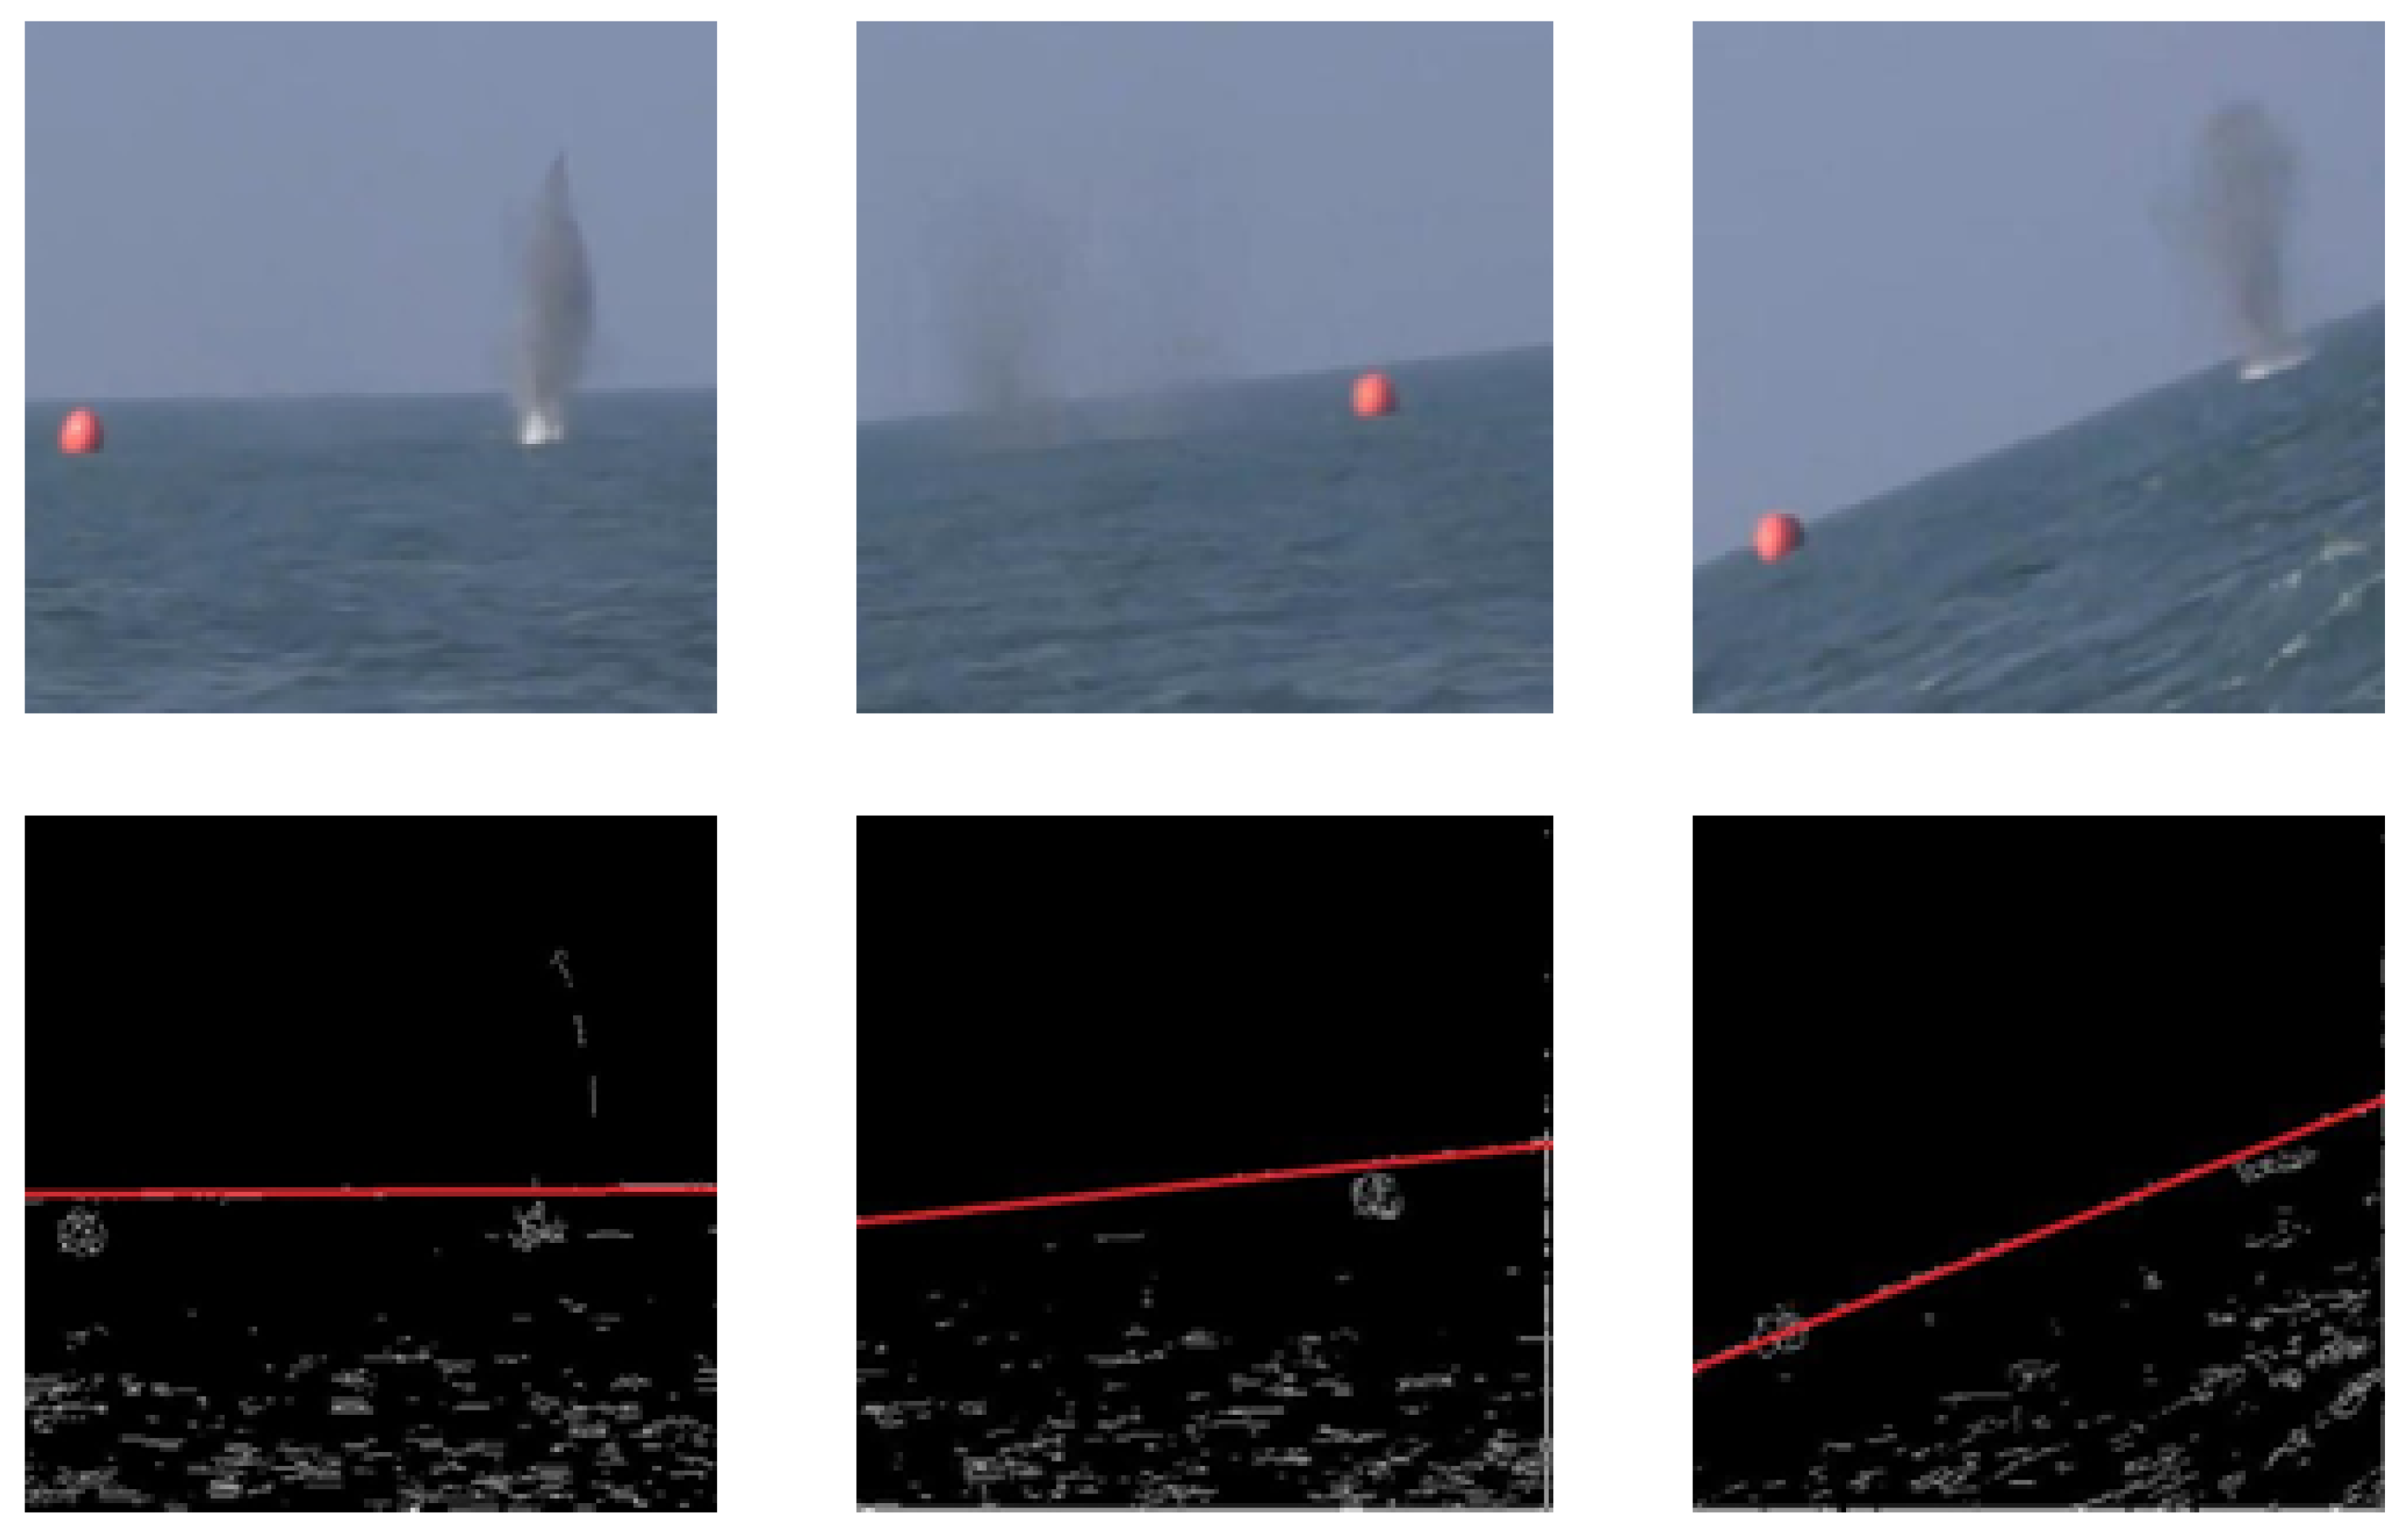
3.1. Sea Antenna Detection Based on Hoffman Space

Hoffman line detection requires region growth theory and Hoffman space transformation and statistics. The basic principle of the region growing algorithm is to merge the pixels with similar properties in the image so as to achieve the goal of segmentation between the target and the background. Because the pixels that make up the same object have high similarity, the object and background can be segmented by region growth.
The basic principle of Hoffman line detection is to use the duality of points and lines. A straight line can be represented by its slope and intercept on the y-axis in the Cartesian coordinate system, and lines can be represented by their perpendicular length ρ to the origin and the angle θ between the perpendicular and the x-axis in Hoffmann space, that is
ρ = x cos θ + y sin θ .
A line in the plane x o y corresponds to a point ( ρ , θ ) in Hoffmann space θ o ρ . The straight line passing through a point ( x 0 , y 0 ) in the plane is shown as a curve in Hough space, which is expressed as
ρ = x 0 cos θ + y 0 sin θ .
Therefore, the possibility of the existence of linear targets can be converted into the number of curved intersections converted by Equation (7). As shown in Figure 3, line2 passing through three points is represented as the intersection of three curves in Hoffman space.
In the actual calculation process, it is necessary to discretize the independent variables, and construct a “voter” matrix to approximate the Hough space. Then, adding 1 to the voting on the linear position represents the effective point of the image in the voter. Finally, the line position can be filtered by sorting the number of votes.
In this paper, we use the Hoffman line detection method to constrain the sensitive area in the current detection image. First, the original image is zoomed out to 640 × 480; secondly, the canny algorithm is used to detect the edge and extract the texture features of the image; finally, the longest line segment in the map is detected by the Hoffman line detection algorithm. If the number of target pixels in the line segment is greater than 2/3 of the length of the line segment, it is considered to be sea-level. Considering that sea antenna detection is sensitive to blue, the blue channel of the image is taken as the input, and the results are shown in Figure 4.
It can be seen from the figure that the sea-antenna-detection algorithm based on Hoffman space can clearly show the texture of the sea antenna, and the algorithm has good detection capability for the sea antenna with large tilt.

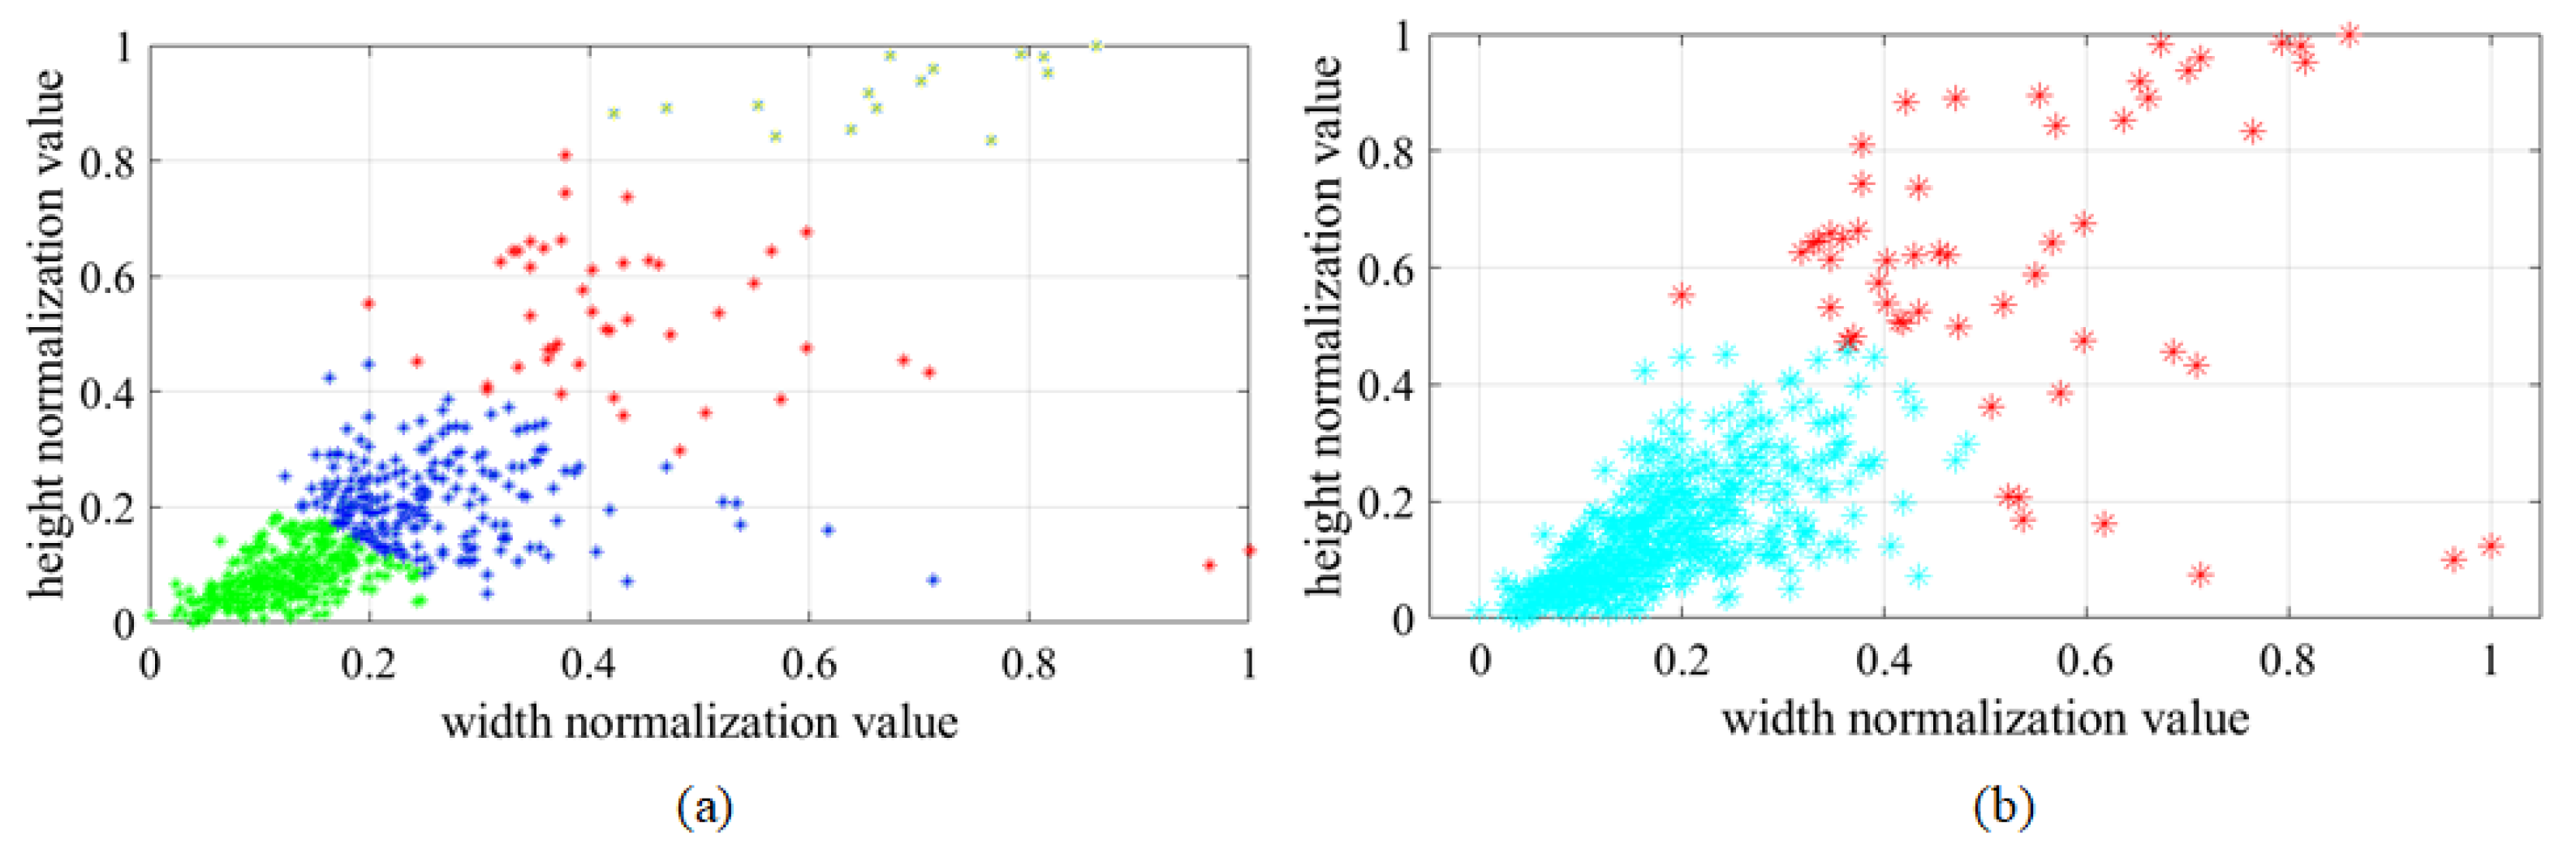
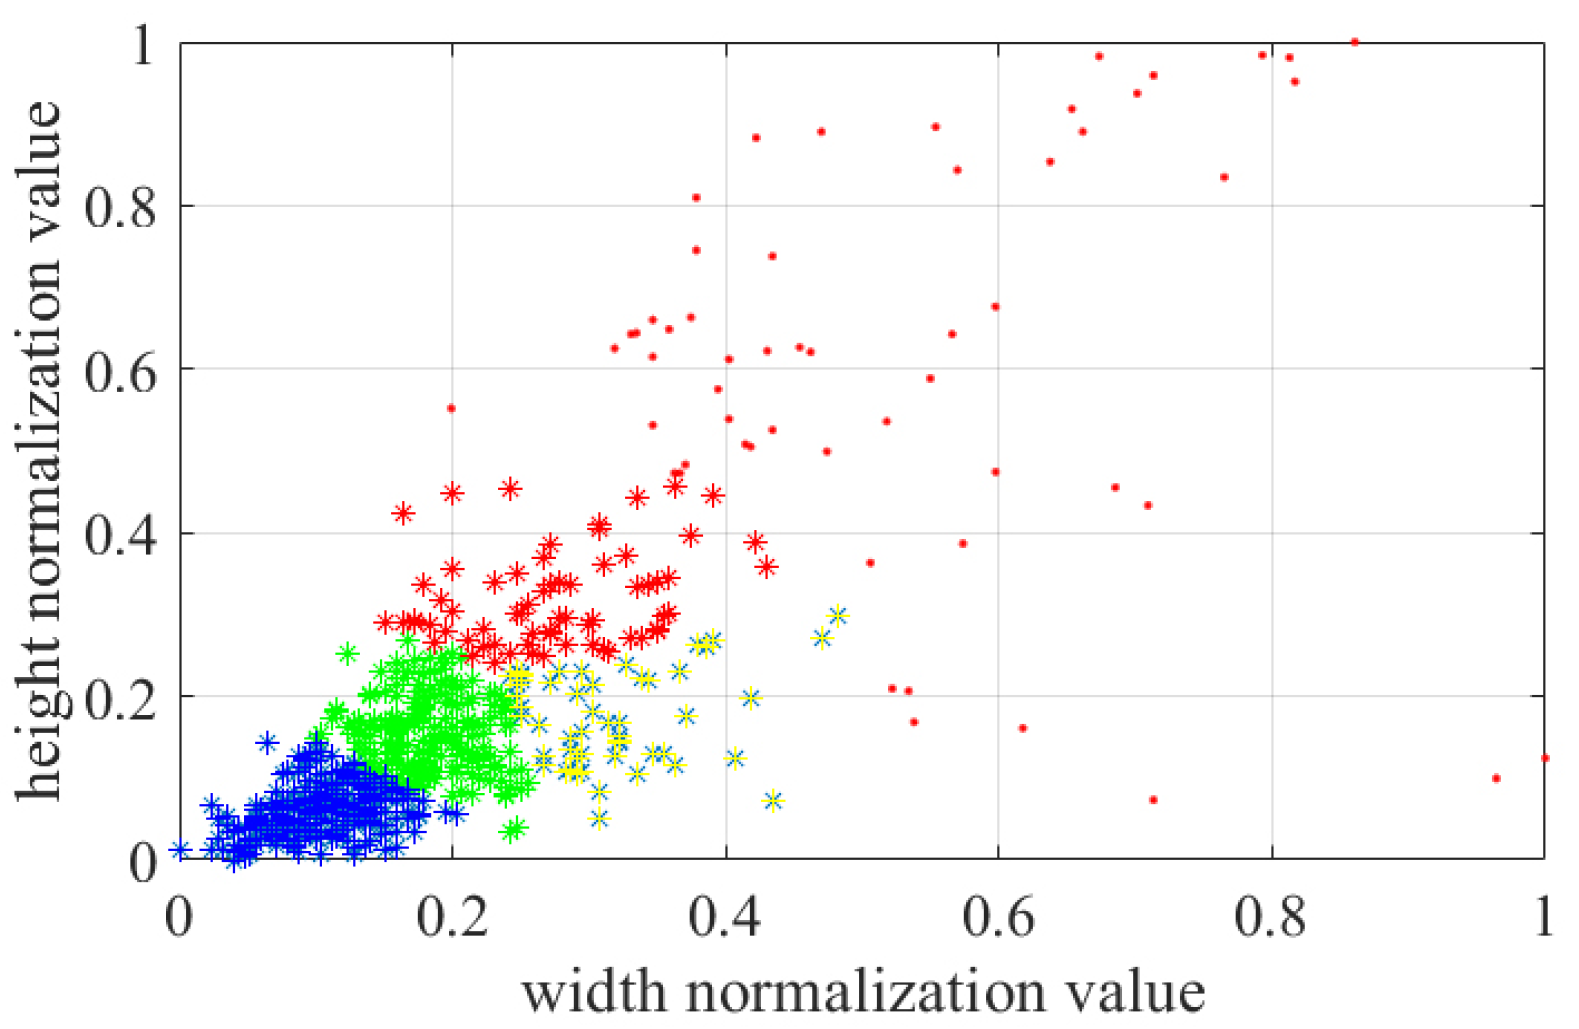
3.2. DBSCAN + K-Means Algorithm Analysis Prior Box

The YOLOv4 algorithm needs to be preset to a prior bounding box to determine the aspect ratio of the detection target in advance and generate a specified number of prior bounding boxes in each grid to detect the objects in the box and predict the bounding box of the target.
At present, the YOLOv4 algorithm uses the K-means clustering algorithm to determine the size of the prior bounding box. The larger the number of clustering centers, the better the fit with the dataset. However, when the K value is greater than the threshold, the clustering effect is not significantly improved. The idea of the K-means algorithm is to randomly select K samples from the initial data as the initial cluster center, and then the distance d is calculated from each sample to the cluster center, which is usually calculated according to the center point of the bounding boxes.
The water column has a continuous generation process and a dissipation process, and it stays for a long time at the initial stage of growth, so the number density of small- and medium-sized water columns is large. The target picking accuracy is the error between the water column and the target, which is reflected in the positioning accuracy at the initial stage of water column growth. K-means algorithm performs clustering on Euclidean distance, which ignores the density, and thus, a clustering algorithm based on density should be used. At present, the common clustering algorithms based on density include the mean-shift algorithm and DBSCAN algorithm. As the bounding box of the water column in the paper only needs to roughly divide the water column into two categories—growth process (high density) and dissipation process (low density)—there is no need to locate the location with the highest density, and it is not easy for the mean-shift algorithm to divide the water column according to the sample density by setting the bandwidth. Thus, the DBSCAN algorithm is selected in this paper. Before using the DBSCAN algorithm for clustering analysis, two parameters need to be determined. One is the radius of the nearest neighbor region, representing the range of circular fields with a fixed point as the center point; another is the number of points at least contained in the adjacent region. The DBSCAN algorithm infers the number of clusters based on data, and thus it does not need to determine the number of clusters in advance, and it can generate clusters for any shape. The K-means algorithm and DBSCAN algorithm are used to cluster the size of the label box, and the results are shown in Figure 5.
In Figure 5, the value of the K is set to 4, and the radius of the adjacent region of the DBSCAN algorithm is 0.1, at least 25. According to the classification results, the K-means is evenly divided on the Euclidean distance, ignoring the density information. DBSCAN is divided in density, but it is not easy to adjust parameters for further division at higher density.
In order to ensure the high positioning accuracy at the initial stage of water column growth, the number of clusters at the initial stage should be as large as possible. Based on the above reasons, this paper proposes the combination of DBSCAN with K-means to determine the appropriate prior bounding box. First, the cluster with the size of the labeled bounding box of the water column is divided according to the density by clustering with the DBSCAN algorithm, and then the cluster with high density is divided according to the K value by the K-means algorithm. The division result is shown in Figure 6.
In the paper, the length and width of the target border marked in the target dataset are input into the clustering algorithm as the initial dataset, and finally a group of better prior bounding box values are obtained.
It can be seen from Figure 7 that the K-means clustering algorithm is mainly divided according to the distance between the cluster center point and discrete points, which is difficult to ensure the typicality of the size in the cluster, and it is easy to cause the detection frame to be larger than the actual water column, thus making it difficult to accurately locate the water column target.

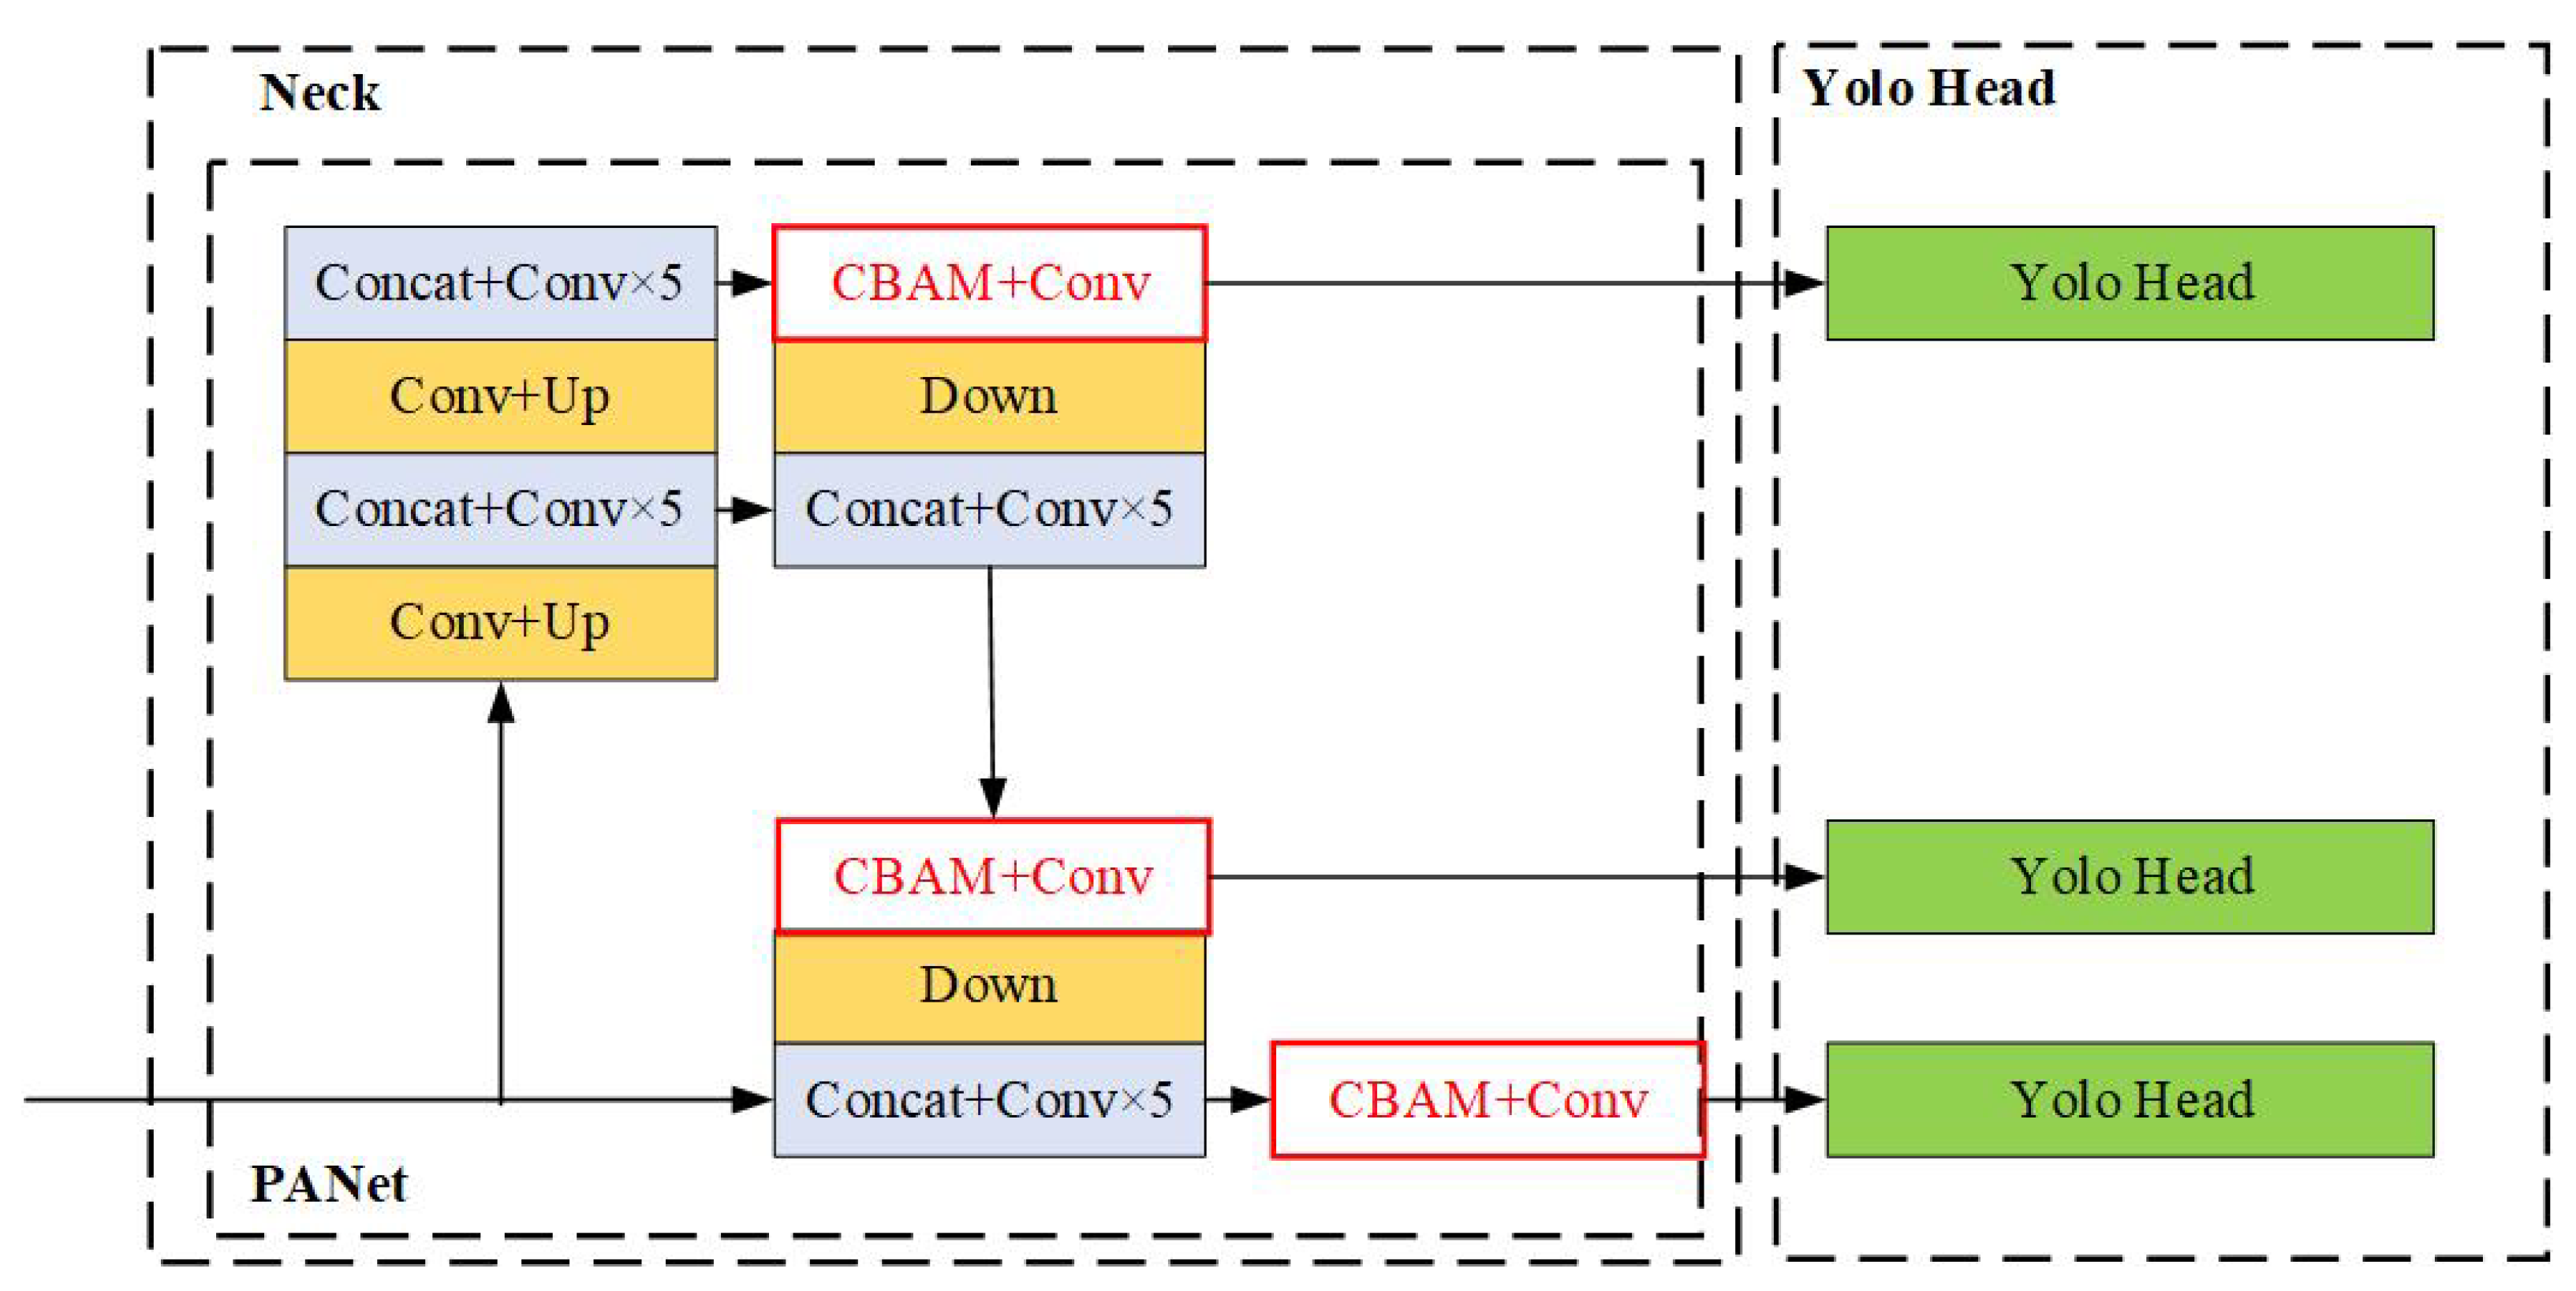
3.3. Improved PANet Structure Based on CBAM

The shallow network contains more water column positioning information, while the deep network contains better water column semantic information. After a series of down-sampling operations, the positioning information of the small-scale water column will be lost. The purpose of this section is to improve the weight of the feature map of the water column and training efficiency so as to improve the detection accuracy and positioning accuracy of the YOLOv4 detection model for small and fuzzy water columns.
The PANet structure first completes the top-down feature extraction in the traditional feature pyramid net (FPN) structure. In the step, only the semantic information is enhanced, and no positioning information is transferred. Then, the path enhancement feature extraction from bottom to top is completed in the next feature pyramid, and the shallow strong positioning information is transferred up. Next, the features of all layers of the pyramid are used to make the later classification and positioning more accurate from the adaptive feature pooling layer. Finally, the features are fused in the full connection layer.
YOLOv4 algorithm uses the PANet structure on three effective feature layers, but the recognition and detection effect for small water columns and fuzzy water columns is still poor. Therefore, the paper adds a CBAM module to each of three branches at the end of the YOLOv4 feature fusion network. With the improvement of the characteristics of small water columns with improved PANet based on CBAM, the weight of the water column increases, while the weight of the non target area is suppressed so as to improve the overall detection accuracy of the water column. The improvement of the PANet module is shown in Figure 8.
Combining Figure 2 and Figure 7, assuming that the input image size is 608 × 608 × 3 , the size of the input feature map input to the CBAM module is 152 × 152 × 256 . The input feature map passes through two parallel MaxPool layers and Avgpool layers, which changes the feature map from 152 × 152 × 256 to 1 × 1 × 256 , and then the feature map passes through the Share MLP module, where it compresses the number of channels to 1 × 1 × 16 at first, and then expands to 1 × 1 × 256 . Two results are obtained according to the feature map passing through the ReLU activation function, and the two results are added; then, the output result of channel attention is obtained from the feature map passing through a sigmoid activation function. The feature map enhanced with the channel attention mechanism is obtained from multiplying the output result with the initial input feature map.
The feature map enhanced by attention mechanism is transformed to 152 × 152 × 1 feature map through maximum pooling and average pooling, then concatenating the two feature maps, transforming them into 1-channel feature map through 7 × 7 convolution, and then obtaining the feature map of spatial attention through a sigmoid function. Finally, the output result multiplied by the feature map of attention mechanism enhancement is changed back to 152 × 152 × 256 . At this time, the feature map has enhanced the information of water column. When the YOLO head is used to analyze the location loss, classification loss and confidence loss, the convergence can be accelerated, and the accuracy can be improved.
Through the improvement of Figure 8, the detection result of the weak water column is shown in Figure 9.
It can be seen from Figure 9 that the improved PANet structure based on CBAM can improve the detection accuracy of the small water column.

4. Results and Discussion

4.1. Introduction to Test Platform

The CPU of the experimental environment in this paper is i7-10875H, the GPU is RTX2060, and memory is 16 G. Python programming language is used under the win11 operating system. The deep learning framework is based on tensorflow2, and Cuda and Cudnn are used to accelerate the network model.

4.2. Evaluating Indicator

In this experiment, precision (P), recall (R), and average precision (AP) are used as evaluation indicators to measure the quality of the model. In this experiment, the IOU threshold of 0.6 is taken as the detection threshold, that is, the overlapping area between the detection frame and the real frame exceeds 60 % , which is considered a positive detection example. The formula is as follows:
P = T P T P + F P .
R = T P T P + F N .
A P = n = 1 N 0 1 P ( R ) d R
Among them, TP represents the real example, that is, the number of positive sample water columns actually detected is also the number of positive sample water columns; FN represents the false counterexample, that is, the water column example detected as a negative sample but actually is a positive sample; and FP represents the false positive example, that is, the water column target detected as a positive sample but actually is a negative sample.
The detection deviation is defined as the distance between the center point of the detection box and the center point of the dimension box when the IOU is greater than 0.6. Specific definitions are as follows:
δ a c c u r a c y = ( x 1 c x 2 c ) 2 ( y 1 c y 2 c ) 2
where, δ a c c u r a c y represents the detection deviation, and ( x 1 c , y 1 c ) and ( x 2 c , y 2 c ) represents the central coordinates of the detection box and the label box, respectively. When no target is detected, or the deviation is greater than the width of the callout box, the detection accuracy is recorded as the width of the callout box.
All algorithms (Faster R-CNN, SSD, YOLOv4, YOLOv5 and improved YOLOV4) are tested in Python.

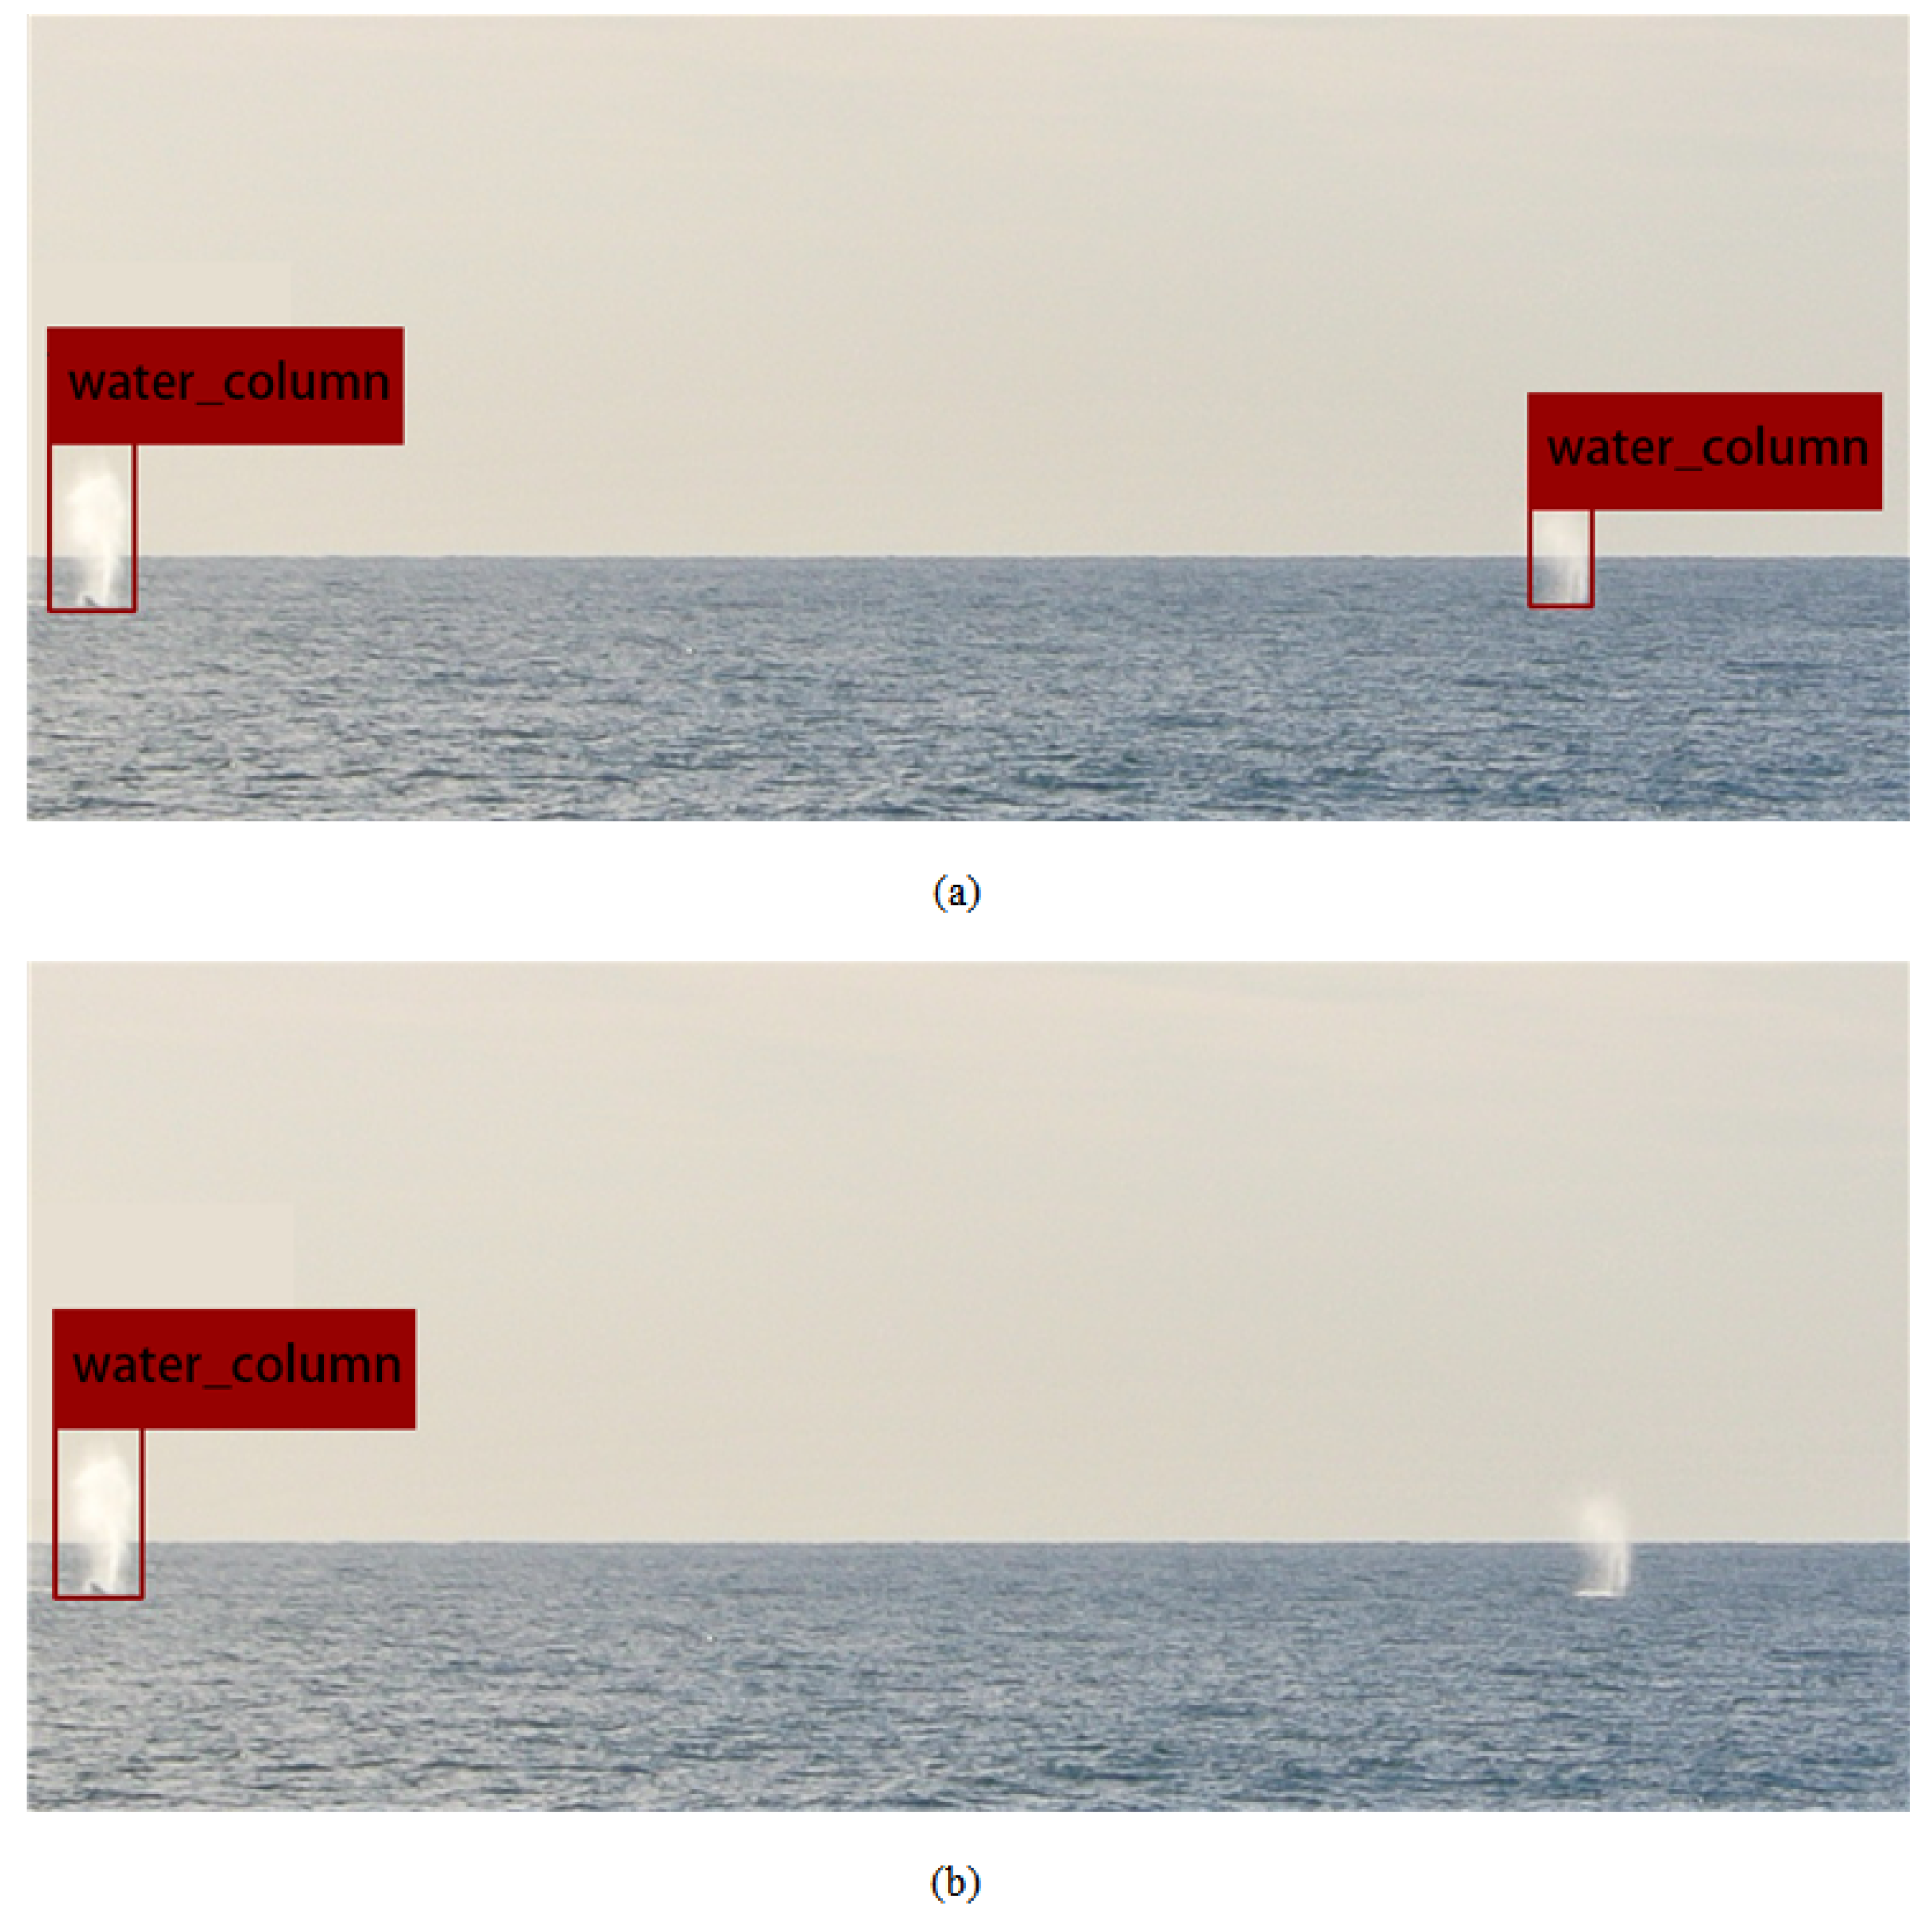
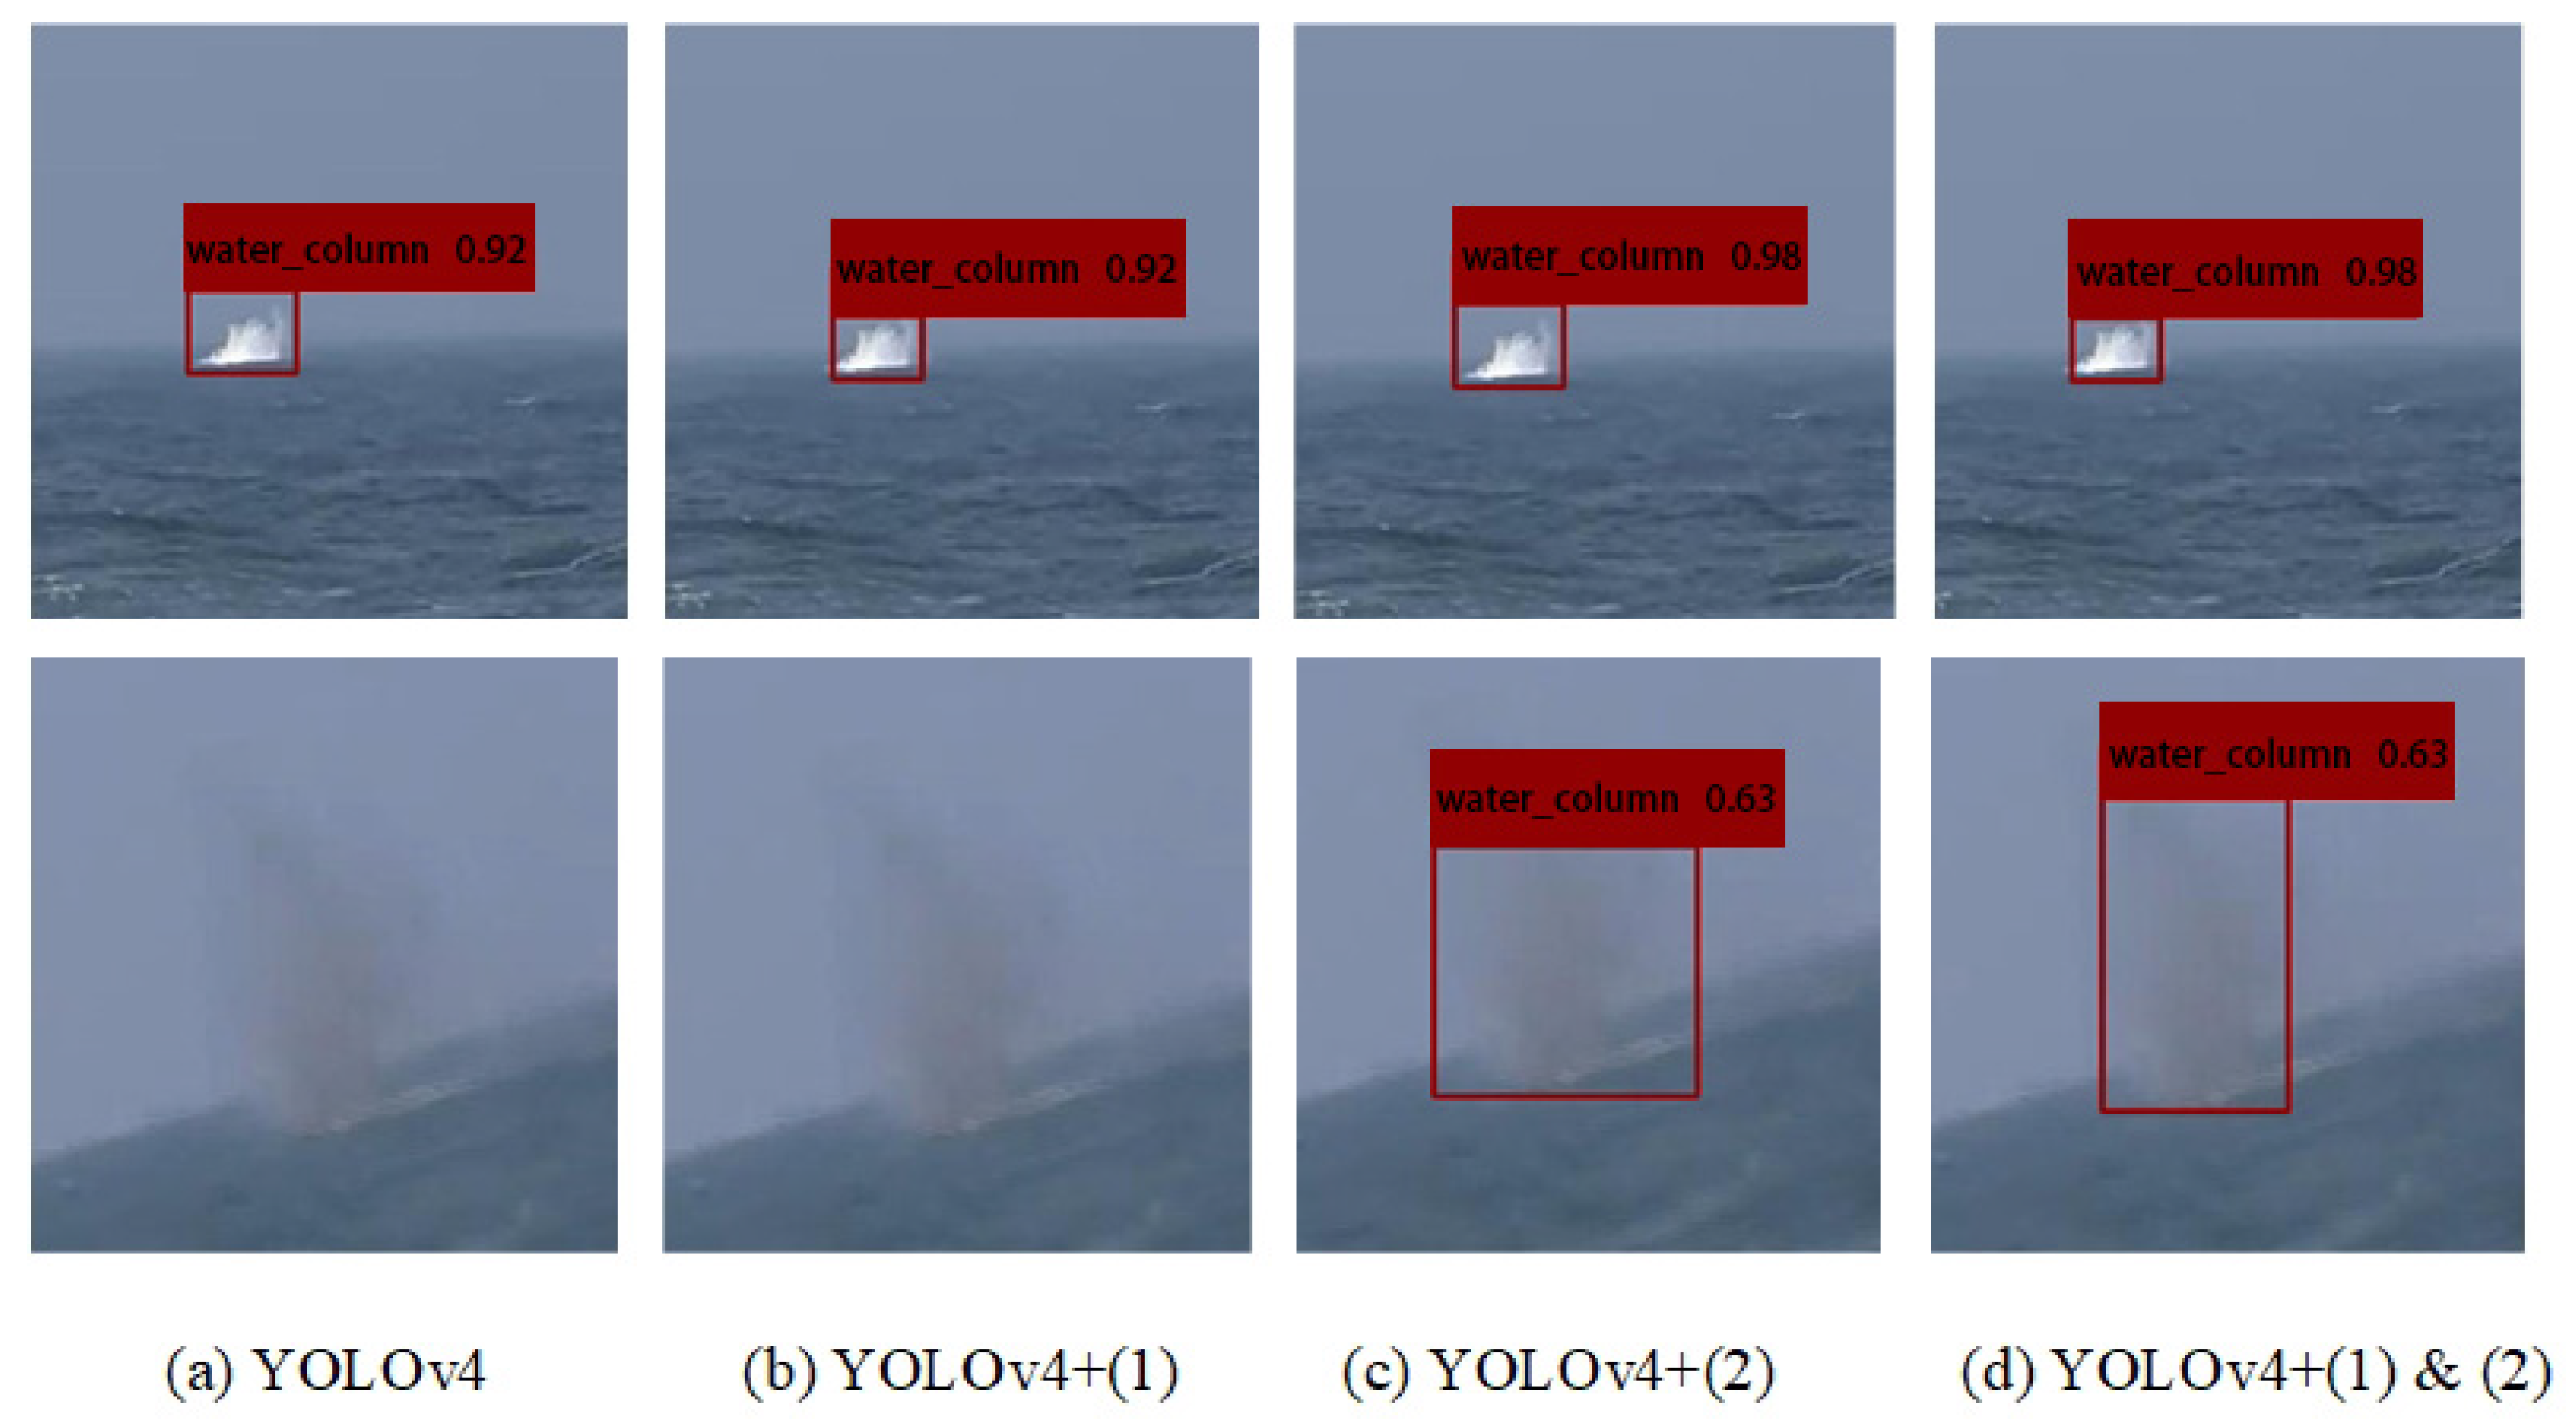
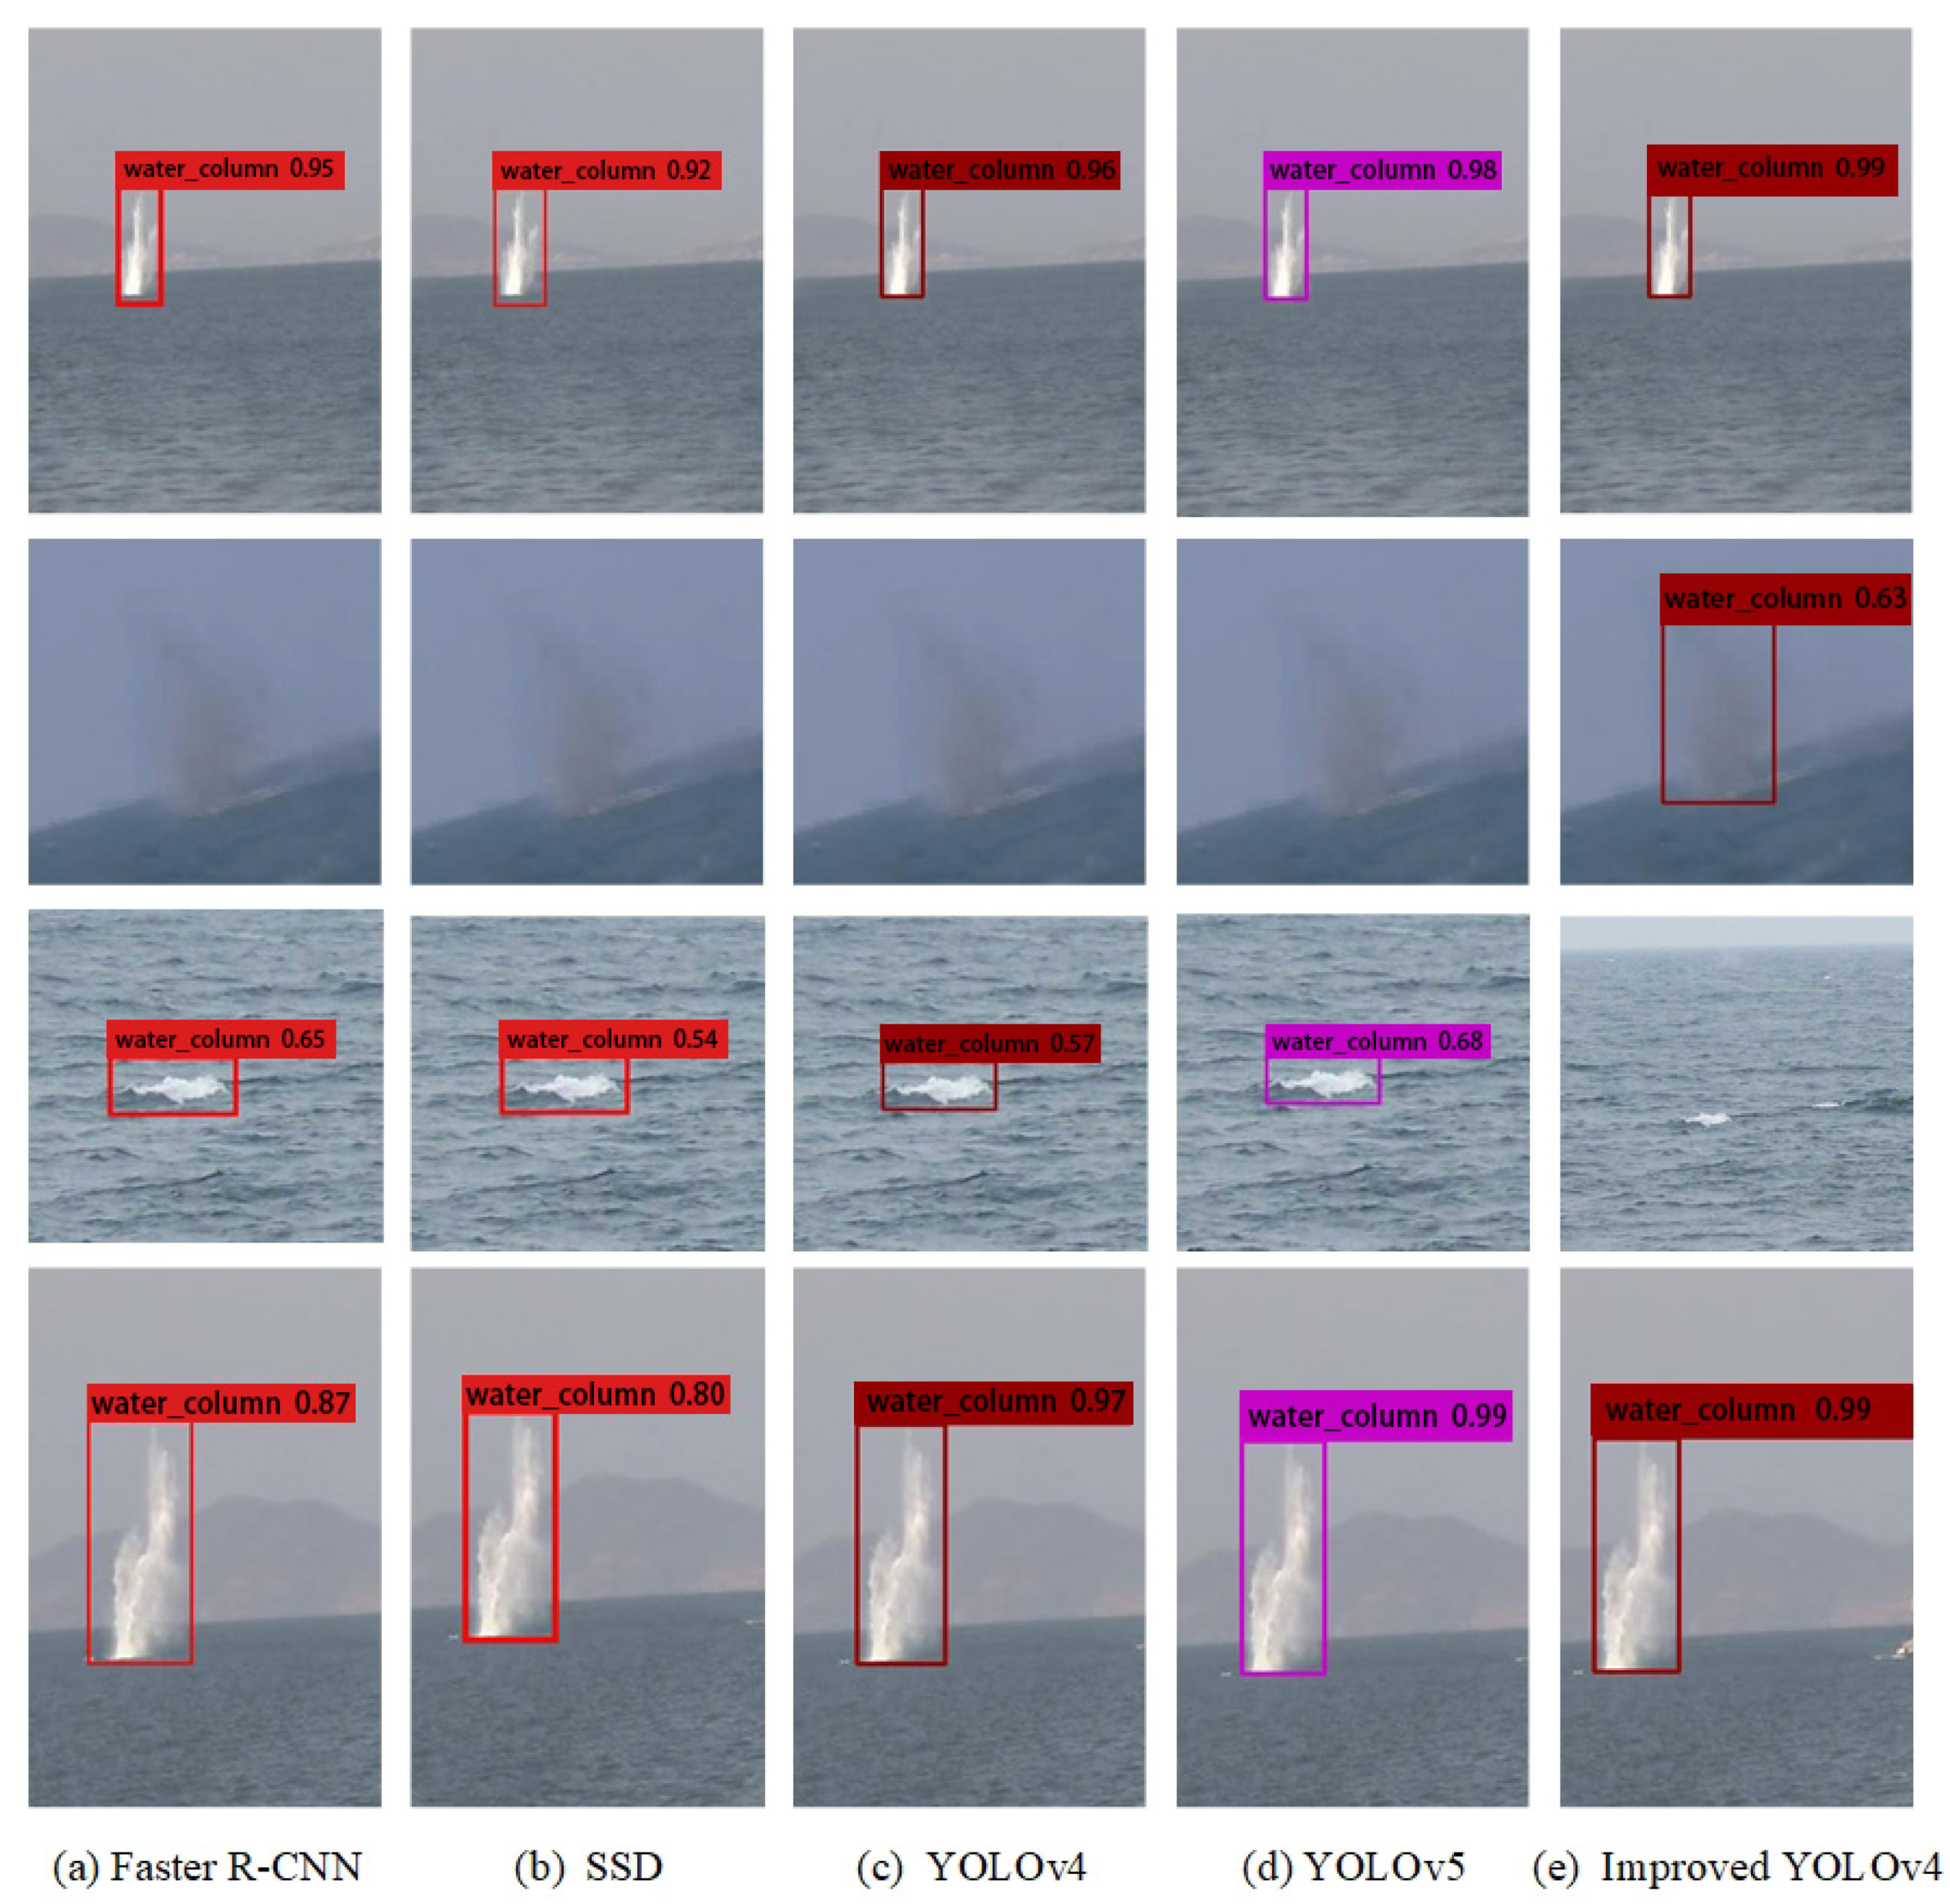
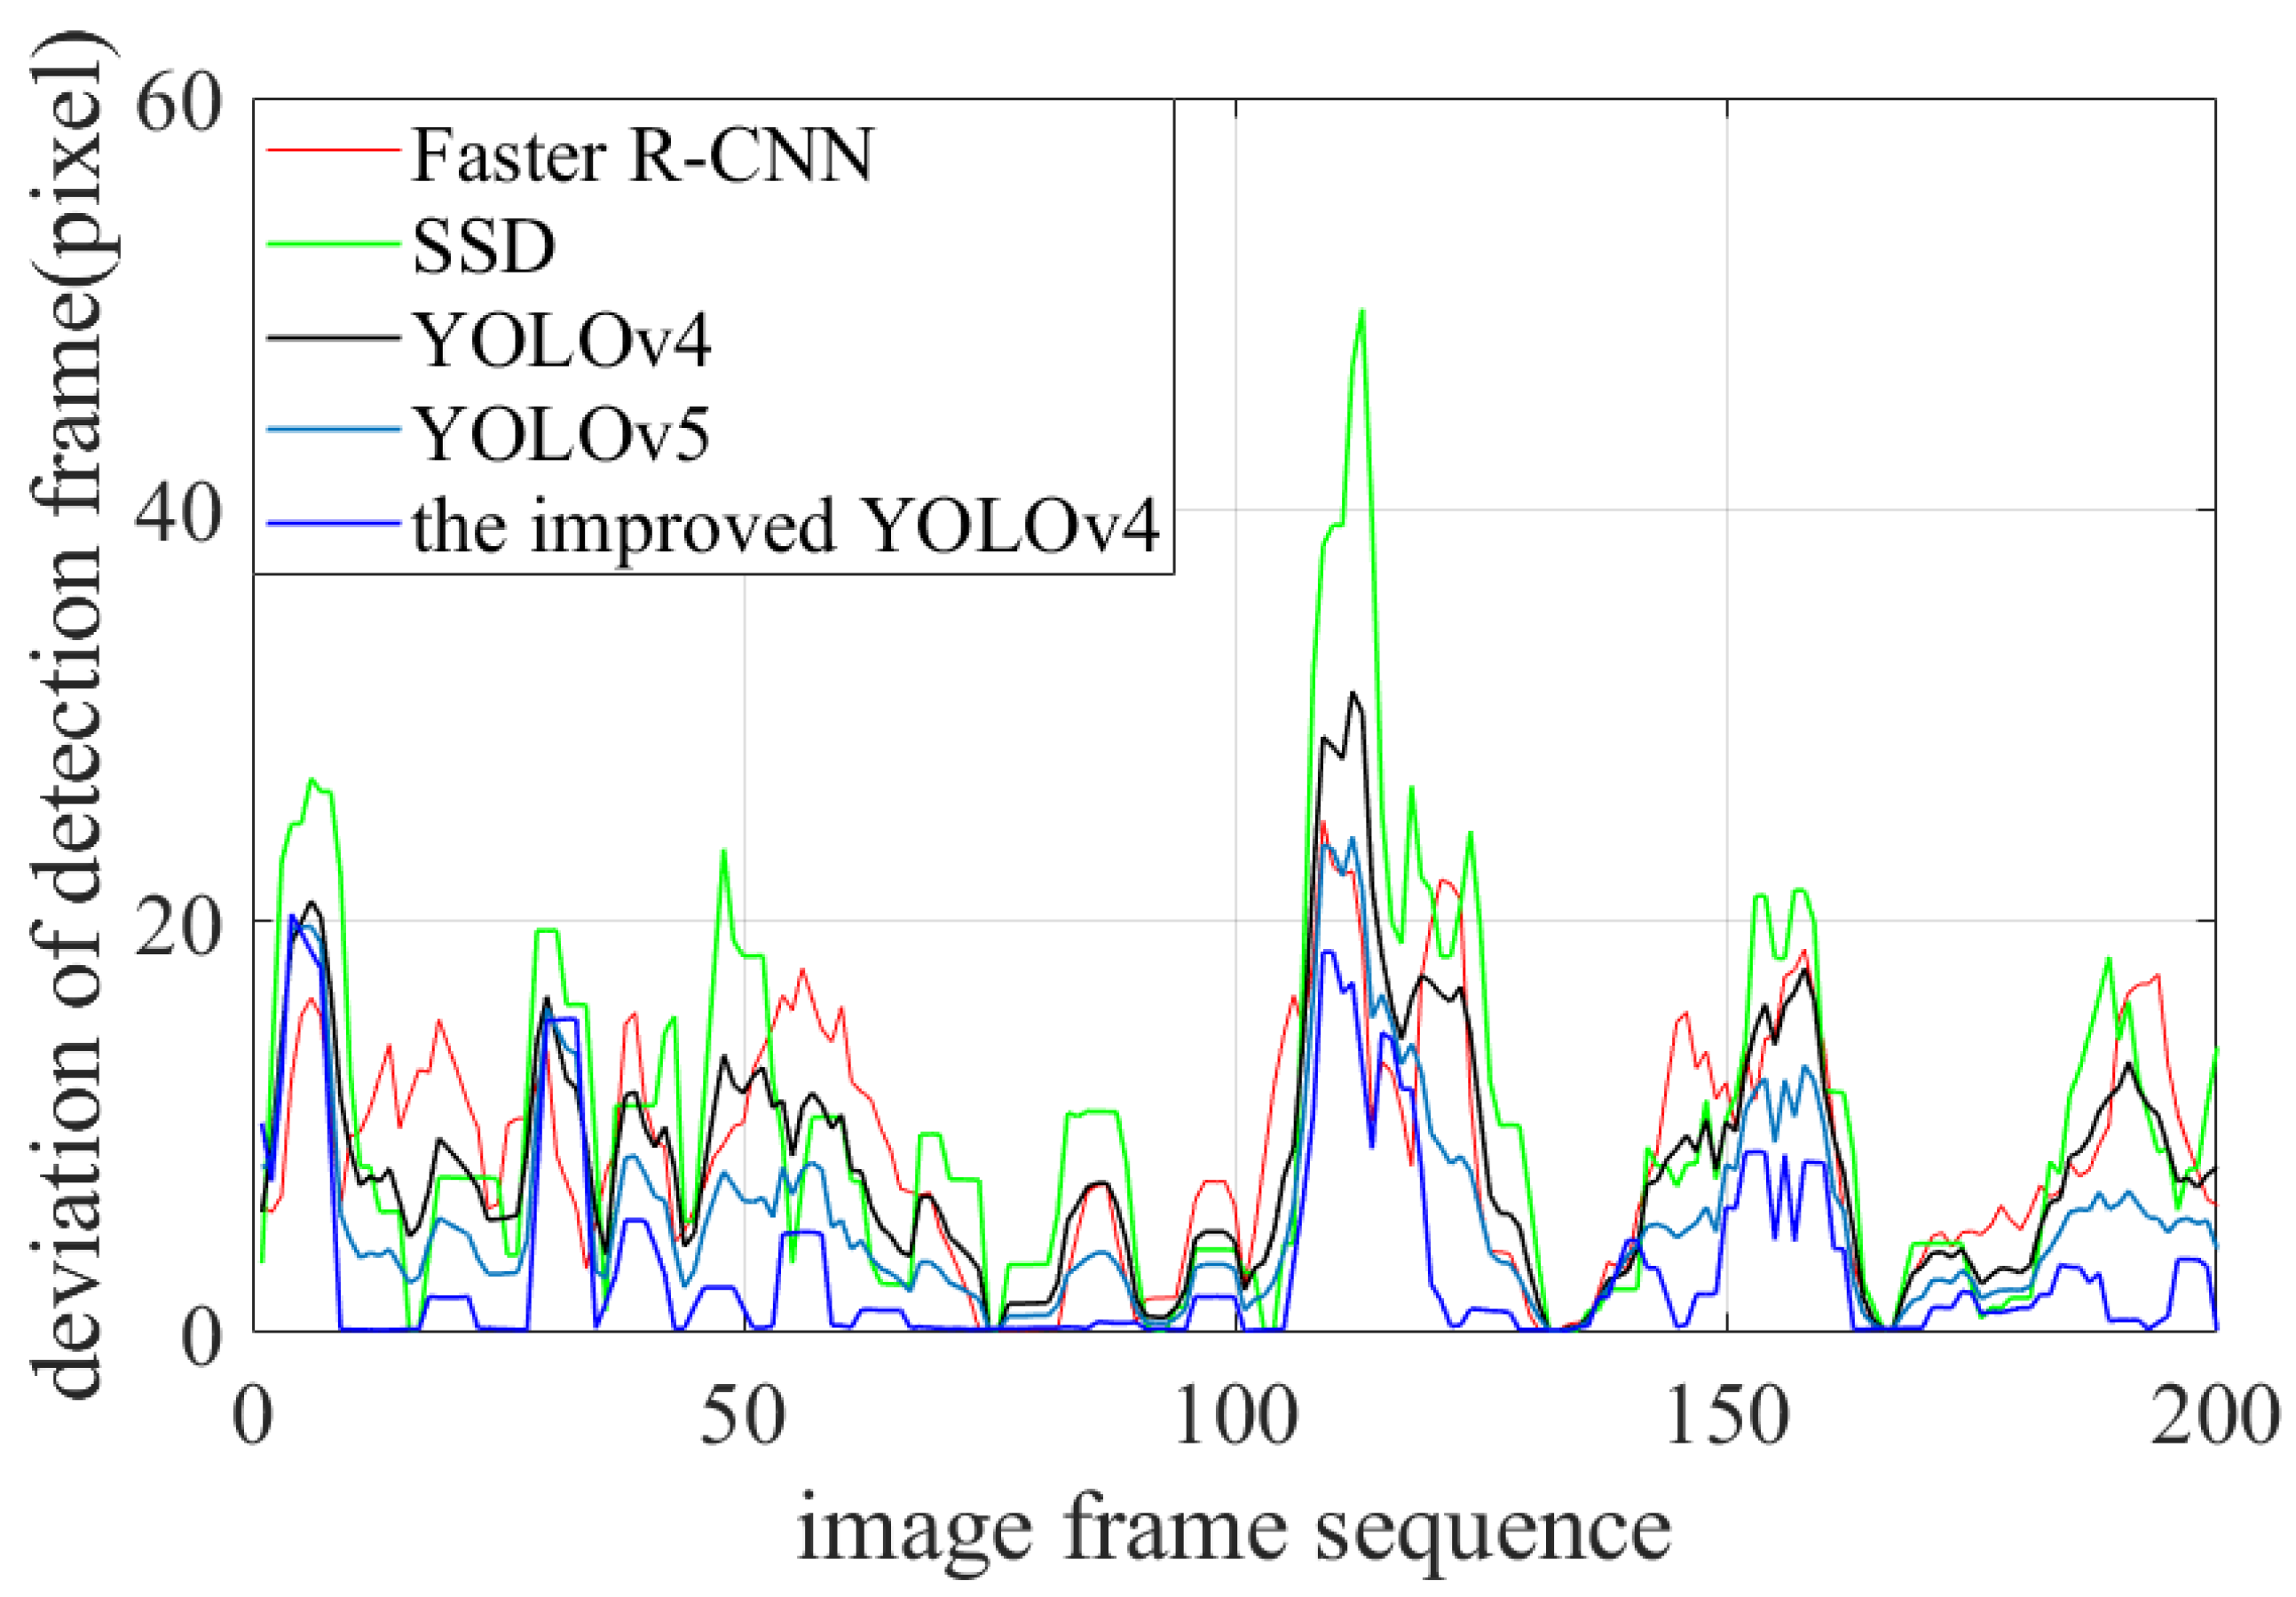
4.3. Experimental Result

In the paper, the ablation experiment and horizontal comparison test are set. In the ablation experiment, YOLOv4 is compared with the following improvements: (1) DBSCAN + K-means, and (2) Improved PANet structure based on CBAM. The results are shown in Figure 10.
It is the horizontal comparison test in which Faster R-CNN, SSD, YOLOv4, YOLOv5 algorithms, as comparative algorithms, were used to detect the water column. A total of 200 images are detected, and the detection results are shown in Figure 10. Statistical data are shown in Figure 11 and Table 1. The experimental parameters of each algorithm are selected as follows.
The parameters of training Faster R-CNN are set as: input image size is 608 × 608, Resnet50 is used in the backbone section. The ratio of training set, validation set, and test set is 6:2:2. In total, 600 images are trained, the batch_size is 4, epochs is 500, training Faster R-CNN costs about 3.4 G memory, the training duration is about 8.6 h, and the final loss function value is 0.3542.
The parameters of training SSD are set as: input image size is 608 × 608 , and vgg is used for the backbone part. The ratio of training set, validation set, and test set is 6:2:2. In total, 600 images are trained, the batch_size is 4, epochs is 500, training SSD costs about 3.4 G in memory, the training duration is about 7.8 h, and the final loss function value is 0.5437.
The parameters of training YOLOv5 are set as: the input image size is 608 × 608 , the backbone consists of CBL, BottleneckCSP/C3, SPP/SPPF, etc. The ratio of the training set, validation set, and test set is 6:2:2. In total, 600 images are trained, the batch_size is 4, epochs is 500, about 3.3 G of memory is consumed, the training duration is about 8.9 h, and the final loss function value is 0.2663.
The parameters of training YOLOv4 and the improved YOLOv4 are set as: the input image size is 608 × 608 , the backbone consists of Darknet53 + ResX. The ratio of training set, validation set, and test set is 6:2:2. In total, 600 images are trained, the batch_size is 4, and epochs is 500. Training the YOLOv4 algorithm costs about 3.5 G in memory, the training duration is about 8.2 h, and the final loss function value is 0.3124. Training the improved YOLOv4 costs about 3.8 G memory, the training duration is about 9.1 h, and the final loss function value is 0.2324.
It can be seen from Figure 10 that improvement (1) can more accurately locate the water column boundary, and improvement (2) can improve the detection confidence and accuracy.
It can be seen from Figure 11 that the detection effect of all algorithms is good for the clear water column and large water column. Only the improved YOLOv4 algorithm can correctly detect the fuzzy water column, and other algorithms have missed detection, due to the improved YOLOv4 algorithm enhancing the training effect of the fuzzy water column through CBAM. All algorithms, except the improved YOLOv4 algorithm, have wrongly detected small spray due to sea-antenna-detection preprocessing being added to the improved YOLOv4 algorithm in the paper, which reduces false detections by limiting the detection area.
It can be seen from Figure 12 that Faster R-CNN, SSD, YOLOv4, YOLOv5 and the improved YOLOv4 algorithm have relatively high positioning accuracy, which is about 10 pixels overall, and the positioning accuracy of the improved YOLOv4 is best. When the image frame number is 100–130 frames, all algorithms have large positioning deviation due to the image being blurry.
It can be seen from Table 1 that the detection speed of YOLOv4, YOLOv5 and the improved YOLOv4 algorithm meet the real-time requirements (more than 30). The map of Faster R-CNN, SSD algorithm, YOLOv4, YOLOv5 and the improved YOLOv4 algorithm are over 90 % , but the performance of the improved YOLOv4 algorithm is best. What is more, the positioning accuracy of the improved YOLOv4 algorithm is best.

5. Conclusions Remarks and Discussion

In this paper, an improved YOLOv4 water column detection algorithm is proposed for the specific scene of the impact point water column detection. First, the sea antenna is detected by the Hoffman line detection method to constrain the sensitive area in the current detection image so as to improve the detection accuracy of the water column. Secondly, the size selection of the prior bounding box of YOLOv4 is improved by using the DBSCAN+K-means clustering analysis algorithm, which makes the prior bounding box more typical. Finally, CBAM is added to PANet to improve the detection accuracy and positioning accuracy of water columns with weak features. Compared with faster R-CNN, SSD, YOLOv4, YOLOv5 algorithms, the algorithm can effectively improve the detection accuracy and positioning accuracy of the water column, and provide an effective water column detection and positioning method for USV target picking.
Although the method proposed in this paper can improve the detection rate of water column images collected by USV and reduce the false detection of spray, the false detection rate of sea spray in image collected by UAV is still high. Because the target picking image collected by the unmanned aerial vehicle (UAV) probably does not have a sea antenna, it is impossible to limit the target picking area. Therefore, in order to improve the robustness of the algorithm, in the subsequent work, judging the water column by the size of the connected area of the water column or limiting the detection area of the water column by manually delimiting the rough target picking area will improve the detection accuracy of the algorithm. In addition, the continuous detection and tracking of the same water column in this algorithm is easy to interrupt, and it is easy to be misjudged as two or more water columns. As a means of automatically picking up targets, it is necessary to further optimize the track_id of target in YOLOv4 algorithm, thus determining that each water column has only one track_id. Regarding missing a few detection frames, the Kalman filter can be used to assist tracking. For many missing detection frames, the water column position in the image can be converted to the actual geographical coordinates, and the water column track_id can be limited according to the unchanged geographical coordinates of the water.

Author Contributions

Conceptualization, J.S. and S.S.; methodology, J.S. and C.Z.; validation, B.S. and C.Z.; writing—original draft preparation, J.S.; writing—reviewing and editing, Z.S. and B.S. All authors have read and agreed to the published version of the manuscript.

Funding

This research was funded by the National Natural Science Foundation of China, grant number 61773395.

Institutional Review Board Statement

Not applicable.

Informed Consent Statement

Not applicable.

Data Availability Statement

Not applicable.

Acknowledgments

The authors would like to thank for Z.W. for the excellent technical support and W.Y. for critically reviewing the manuscript.

Conflicts of Interest

The authors declare no conflict of interest.

References

  1. Wang, Y.-S.; Ji, S.-Y.; Du, B.-B. Marine impact water column signal detection algorithm based on improved Faster R-CNN. Weapon Equip. Eng. 2022, 43, 182–189. [Google Scholar]
  2. Fang, Z.-P.; He, H.-J.; Zhou, G.-M. Overview of Target Detection Algorithms. Comput. Eng. Appl. 2018, 54, 11–18. [Google Scholar]
  3. Wang, Y.-C.; Chen, Q. Blind watermarking algorithm based on SIFT and Radon transform. Electron. Des. Eng. 2022, 30, 180–184. [Google Scholar]
  4. Zhang, H.-Y.; Bai, J.-J.; Li, Z.-J. Scale invariant SURF detector and automatic clustering segmentation for infrared small targets detection. Infrared Phys. Technol. 2022, 83, 7–16. [Google Scholar] [CrossRef]
  5. Shi, H.; Cao, J.-F.; Chen, L.-C.; Pan, L.-H. PCA-SIFT Feature Extraction Algorithm of Coal Mine Image in Hadoop Platform. J. Taiyuan Univ. Sci. Technol. 2022, 41, 124–129. [Google Scholar]
  6. Song, Y.-P.; Huang, H.; Ku, F.-L.; Fan, D.-D. Face recognition algorithm based on MB-LBP and tensor high order singular value decomposition. Comput. Eng. Des. 2021, 42, 1122–1127. [Google Scholar]
  7. Ma, Q.; Zhang, X.-Z.; Li, H.-F.; Deng, H.X. A moving object detection algorithm based on spectral residual algorithm and clustering algorithm. Comput. Engeering Sci. 2018, 40, 1867–1873. [Google Scholar]
  8. Quan, J.; Jia, M.-T.; Lin, B. Development of a core feature identification application based on the Faster R-CNN algorithm. Eng. Appl. Artif. Intell. 2022, 1159, 52–60. [Google Scholar]
  9. Sun, Y.-C.; Pan, S.-G.; Zhao, T. Detection and Recognition of Traffific Lights Based on Faster R-CNN. Acta Opt. Sin. 2020, 40, 143–151. [Google Scholar]
  10. Huang, Z.; Sui, B.; Wen, J. An intelligent ship image/video detection and classifification method with improved regressive deep convolutional neural network. Complexity 2020, 23, 4–13. [Google Scholar]
  11. Zeng, F.-L.; Ying, L.; Yang, Y. A detection method of Edge Coherent Mode based on improved SSD. Fusion Eng. Des. 2022, 179, 20–30. [Google Scholar] [CrossRef]
  12. Chen, Z.-C.; Guo, H.-Q.; Yang, J.; Jiao, H.; Feng, Z.; Chen, L.; Gao, T. Fast vehicle detection algorithm in traffic scene based on improved SSD. Measurement 2022, 201, 263–270. [Google Scholar] [CrossRef]
  13. Huang, H.; Sun, D.; Wang, R. Ship Target Detection Based on Improved YOLO Network. Appl. Sci. 2020, 17, 1–10. [Google Scholar] [CrossRef]
  14. Bai, G.-G.; Hou, J.-M.; Zhang, Y.-W.; Li, B.; Han, H.; Wang, T.; Hinkelmann, R.; Zhang, D.; Guo, L. An intelligent water level monitoring method based on SSD algorithm. Measurement 2021, 185, 2233–2241. [Google Scholar] [CrossRef]
  15. Pan, W.-G.; Chen, Y.-H.; Liu, B. Traffific Light Detection Based on YOLOv3 Optimization Algorithm. Transducer Microsyst. Technol. 2019, 38, 147–149. [Google Scholar]
  16. Li, Q.; Zhao, F.; Xu, Z.-P. Improved YOLOv4 algorithm for safety management of on-site power system work. Energy Rep. 2022, 8, 737–746. [Google Scholar] [CrossRef]
  17. Zhang, L.; Zhou, X.-H.; Li, B.-B. Automatic shrimp counting method using local images and lightweight YOLOv4. Biosyst. Eng. 2022, 22, 20–32. [Google Scholar] [CrossRef]
  18. Prasetyo, E.; Suciati, N.; Fatichah, C. Yolov4-tiny with wing convolution layer for detecting fish body part. Comput. Electron. Agric. 2022, 198, 68–75. [Google Scholar] [CrossRef]
  19. Fu, H.; Song, G.; Wang, Y. Improved YOLOv4 Marine Target Detection Combined with CBAM. Symmetry 2021, 130, 62–78. [Google Scholar] [CrossRef]
  20. Dong, X.-D.; Yan, S.; Duan, C.-Q. A lightweight vehicles detection network model based on YOLOv5. Eng. Appl. Artif. Intell. 2022, 113, 52–59. [Google Scholar] [CrossRef]
  21. Li, M.-J.; Wang, H.; Wan, Z.-B. Surface defect detection of steel strips based on improved YOLOv4. Comput. Electr. Eng. 2022, 102, 45–53. [Google Scholar] [CrossRef]
  22. Tan, L.; Lv, X.-Y.; Lian, X.-F. YOLOv4 Drone: UAV image target detection based on an improved YOLOv4 algorithm. Comput. Electr. Eng. 2021, 93, 45–52. [Google Scholar] [CrossRef]
  23. Bochkovskiy, A.; Wang, C.Y.; Liao, H.Y.M. YOLOv4: Optimal Speed and Accuracy of Object Detection. arXiv 2004, arXiv:2004.10934. [Google Scholar]
  24. Zhao, W.-Y.; Liu, S.-Y.; Li, X.-Y.; Han, X.; Yang, H. Fast and accurate wheat grain quality detection based on improved YOLOv5. Comput. Electron. Agric. 2022, 202, 168–182. [Google Scholar] [CrossRef]
  25. Qi, J.; Liu, X.; Liu, K.; Xu, F.; Guo, H.; Tian, X.; Li, M.; Bao, Z.; Li, Y. An improved YOLOv5 model based on visual attention mechanism: Application to recognition of tomato virus disease. Comput. Electron. Agric. 2022, 194, 10–25. [Google Scholar] [CrossRef]
  26. Ren, S.; He, K.; Girshick, R.; Sun, J. Faster r-cnn: Towards real-time object detection with region proposal networks. IEEE Trans. Pattern Anal. Mach. Intell. 2016, 39, 1137–1149. [Google Scholar] [CrossRef] [Green Version]
  27. Zhang, K.; Chen, Z.-J.; Zhang, Y. A Fast Target Detection Method in SAR Images Improved by YOLOv4 Tiny. Comput. Eng. Appl. 2022, 26, 1–10. [Google Scholar]
Figure 1. Normalization of predicted bounding box.
Sustainability 14 15329 g001
Figure 2. The proposed framework YOLOV4 structure.
Sustainability 14 15329 g002
Figure 3. Hoffman linear detection framework.
Sustainability 14 15329 g003
Figure 4. Sea-antenna-detection diagram based on Hoffman space.
Sustainability 14 15329 g004
Figure 5. Schematic diagram of clustering algorithm. (a) K-means clustering results. (b) DBSCAN clustering results.
Sustainability 14 15329 g005
Figure 6. Clustering results of running DBSCAN with K-means algorithm.
Sustainability 14 15329 g006
Figure 7. Prediction box generated based on K-means and DBSCAN algorithm. (a) Water column label box. (b) Based on the priori box determined by K-means, the detection box is larger than the label box. (c) Based on the prior frame determined by DBSCAN + K-means algorithm, the detection box is basically consistent with the label box.
Sustainability 14 15329 g007
Figure 8. Schematic diagram of neck module.
Sustainability 14 15329 g008
Figure 9. Comparison of small water column detection results: (a) YOLOv4 algorithm detection result figure, small water column undetected. (b) Detection results of improved YOLOv4 algorithm, all water columns detected.
Sustainability 14 15329 g009
Figure 10. Ablation experiment of the improved YOLOv4 algorithm. Comparison of running results of YOLOv4, YOLOv4+(1), YOLOv4+(2), YOLOv4+(1) with small water column and fuzzy water column (2).
Sustainability 14 15329 g010
Figure 11. Comparison of running results of Faster R-CNN, SSD, YOLOv4, and improved YOLOV4 algorithm with clear water column, fuzzy water column, small spray and big water column.
Sustainability 14 15329 g011
Figure 12. Pixel deviation curve of water column target located by target-detection algorithm.
Sustainability 14 15329 g012
Table 1. Target detection algorithm operation data table.
Target Detection AlgorithmFaster R-CNNSSDYOLOV4YOLOV5Proposed
Detection speed (FPS)2529333431
mAP 93.7 % 90.1 % 94.2 % 95.3 % 96.3 %
δ a c c u r a c y 14.718.614.313.210.2
Publisher’s Note: MDPI stays neutral with regard to jurisdictional claims in published maps and institutional affiliations.

