Article

Integrating Text-Mining and Sustainability Balanced Scorecard Methods to Examine the Relationship between CEO Messages of Homepages and Firm Value: Emphasis on Fashion Companies in South Korea

1
Department of Accounting and Taxation, Semyung University, Jecheon 27136, Republic of Korea
2
Department of Fashion Design & Marketing, Seoul Women’s University, 621 Hwarang-ro, Nowon-gu, Seoul 01797, Republic of Korea
3
Department of Big Data Analytics, Kyung Hee University, 26, Kyungheedae-ro, Dongdaemun-gu, Seoul 02447, Republic of Korea
*
Author to whom correspondence should be addressed.
Sustainability 2022, 14(22), 15285; https://doi.org/10.3390/su142215285
Submission received: 18 September 2022 / Revised: 11 November 2022 / Accepted: 15 November 2022 / Published: 17 November 2022

Abstract

:
This research examines the association between CEO messages and current and future corporate value on the websites of fashion companies. The research methods of this paper are as follows: First, we extract the fashion firm samples among companies listed in Korea’s KOSPI and KOSDAQ in 2020. Second, CEO messages’ text data on the homepage of the fashion companies are obtained by hand-collecting. The repeated words with high TF-IDF values are selected as keywords using text-mining techniques. Third, the CEO messages of the fashion firms are classified with one of finance, customer, internal management process, learning and growth, and corporate social standpoints by the SBSC framework. This research investigates through regression analysis whether firms that emphasize certain factors affect their future or current corporate value. As an additional test, using social network analysis, CONCOR analysis, and 2SLS analysis, the paper checks the objectivity and robustness of the empirical results. The results of this paper are as follows: The first finding presents that all the standpoints of the CEO messages of fashion firms had no significant association with current company value. These results imply that CEO messages posted on the company homepage are generally expressed from a long-term standpoint, and a long time is needed to realize their visions or goals expressed in the CEO message to actually effect corporate value. The second finding shows that the future firm value can be improved as firms mention more words related to the corporation’s social responsibility among CEO messages of the company homepages disclosed by fashion companies. This result implies that if a fashion firm shows its vision and goals related to corporate social responsibility and makes an effort to achieve them, the company value will be increased in the future. The results of the additional tests support the fact that there is a significant positive association between the mention of social responsibility in the CEO message of the company’s website and future firm value. The contributions of this study are as follows: First, on research topics in the field of accounting, this study utilizes text mining and the SBSC framework and quantified qualitative data to perform empirical analysis. Introducing this new and innovative methodology contributes to the development of convergence research. Second, the results of this study suggest that the contents of the company’s CEO message contain symbolic and implicit important information. In particular, this study proved through empirical analysis that companies’ effort and achievement related to social responsibility help increase corporate value in the long run.

1. Introduction

Information asymmetry exists among corporate managers, shareholders, and corporate stakeholders [1]. The information asymmetry does not have a positive influence on corporate value because it gives anxiety and uncertainty to shareholders and corporate stakeholders. According to a stakeholder standpoint approach to the resource-based theory [2], CEOs can have access to critical resources that many stakeholders can provide. If a manager shares key information about a company with shareholders and stakeholders and reliably presents countermeasures, the value of the firm is likely to be evaluated positively. Based on the stakeholder resource-based theory [2], in most competitive circumstances, a firm will not be able to attract the kind of resources necessary to generate such profits if the only stakeholder making a claim for the economic benefits of the company is the shareholder. In order to attract the kinds of resources that can generate profits, managers must recognize that stakeholders, besides shareholders, have claims about profits that help their resources generate.
In addition, based on the stakeholder theory [3,4], CSR activities of firms have a positive effect on the future corporate value measured by Tobin’s q. Also, the legitimacy theory [5,6] explains that the management of a company discloses positive social and environmental information in response to the unfavorable attitude of the media. This is the theory that supports the justification and motivation for disclosing information on activities for the society and environment of a company.
A sound corporate governance structure can improve corporate value. If the CEO transparently discloses management information about the company and acts ethically, the future of the company will naturally be bright. Also, according to the legitimacy theory [7,8], corporate social responsibility activities improve the company image and give customers belief and trust in the company, ultimately further strengthening corporate value.
Therefore, managers need to make various efforts to solve information asymmetry about companies. As one of them, the CEO messages on the company’s vision and strategy are disclosed on the corporation’s website. The CEO messages on the corporate website allow shareholders and stakeholders outside the company to know information on the management philosophy of corporate managers and the direction of corporate development.
This purpose of this is to examine the association between CEO messages and corporate value on the website of fashion companies. To analyze this, first, through text-mining techniques, keywords that are significantly repeated are extracted from CEO messages on the homepages of companies belonging to the fashion industry. The keywords are then classified through the SBSC (Sustainability Balanced Scorecard) framework. Finally, the more fashion companies emphasize in the CEO message, the higher the corporate value of the present and future.
The corporate homepage contains a variety of information, which delivers many contents to the outside [9]. Companies present important information directly or indirectly, especially through CEO messages on their homepage [10]. When a company’s strategy team or marketing team publishes a CEO message on its website, they upload it through careful review [11]; namely, the CEO messages on the corporate homepage contain important information about the company’s vision, goals, strategy, etc. [12,13,14]. Therefore, this study analyzes the CEO message posted on the company’s website to obtain important information about what the company is aiming for, what it values, and what it practices for it.
One of the representative performance evaluation indicators for companies is the BSC framework [15,16,17]. It is classified into a finance standpoint, a customer standpoint, an internal management process standpoint, and a learning and growth standpoint. In addition to quantitative information such as a financial standpoint, this performance evaluation indicator includes qualitative information such as a customer standpoint, an internal management process standpoint, and a learning and growth standpoint [18]. Recently, as information on corporate social activities is emphasized, the SBSC framework is often used for performance evaluation or research [19,20,21,22]. Therefore, in this study, CEO messages are classified using the SBSC framework because it is expected that companies belonging to the fashion industry who have social responsibility and devote themselves to society will have higher corporate value.
The concrete analysis procedure of this paper is as follows. First of all, only companies belonging to the fashion industry among companies listed in Korea’s KOSPI and KOSDAQ are extracted and used as samples. At the same time, financial data on the sample company are downloaded from Kis-value [23] and converted into variables. Second, CEO messages on the website of the sample company are directly collected by hand-collecting, and words with high TF-IDF [24,25] values are selected as keywords through text-mining [26] techniques. Next, in this study, the CEO messages of the firm are classified using the SBSC framework. In other words, this research classifies the keywords of CEO messages posted on the websites of companies belonging to the fashion industry as being one of finance standpoints, customer standpoints, internal management process standpoints, learning and growth standpoints, and responsibility social standpoints. Finally, we investigate through regression analysis whether firms that emphasize certain factors have changes in their future or current corporate value. Additionally, we check the objectivity and robustness of the results of this study using social network analysis [27], CONCOR analysis [28], and 2SLS analysis.
This paper is composed of the following. In Section 2, our researchers derive the hypotheses from previous studies related to the subject of this study. Section 3 explains sample selection and research models for demonstrating hypotheses, and Section 4 shows empirical analysis results and discusses their meanings. In Section 5, we conclude this paper.

2. Previous Literature and Hypotheses Development

With the “Korean Wave” becoming popular around the world, the Korean fashion industry is also developing. Since the fashion industry is a trend-sensitive industry, consumers’ reactions are very important [28]. In particular, Korea is a country with developed IT, and in the fashion industry, it more actively conducts marketing activities through various media such as social media and websites to identify consumers’ needs than any other industries [29]. Korean fashion companies tend to conduct online marketing more actively than companies in other industries. Therefore, this study selects companies belonging to the Korean fashion industry as samples.
Information asymmetry exists between firm insiders (managers) and outsiders (shareholders and corporate stakeholders) [1]. This information asymmetry does not have a positive influence on company value in the long run as it gives uncertainty to shareholders and corporate stakeholders [1,2]. So as to solve the information asymmetry, the CEO of a company delivers information about the company to stakeholders, shareholders, and customers outside the company through various methods. As one of the various means of information transmission, there is a company’s official website.
Hence, CEOs should try to make various efforts to solve information asymmetry about companies. As one of them, the CEO messages on the company’s website supply shareholders, corporate stakeholders, and customers with the company’s vision and strategy. The CEO messages on the corporate website contain critical information on the management philosophy of corporate managers and the plan of corporate development.
Each company has different contents to emphasize through CEO messages through the homepage. In general, the CEO message implies the vision or goal that the company aims for [9,11]. Specifically, it may include marketing elements directed at customers or strategies to improve employee satisfaction [10,13], and it may include content on corporate social responsibility and activities that have recently been emphasized socially [12,13]. This paper examines CEO messages on the websites of Korean fashion companies to investigate which elements of CEO messages will be related to current or future corporate value.
In this research, first, keywords are extracted from CEO messages using the text mining technique [26]. Then, using the SBSC framework [20,22], the keywords are classified into one of the financial standpoints, customer standpoints, internal management process standpoints, learning and growth standpoints, and social responsibility standpoints. Through this process, it is expected that the vision or goal that the company wants to pursue can be inferred to some extent through the CEO messages on the corporate website.
Namely, this study aims to conduct an empirical analysis on whether there is a significant relationship between the points emphasized by the company (financial standpoint, customer standpoint, internal process standpoint, learning and growth standpoint, and corporate social activity) and current or future corporate value. Most of the emphasis in a company’s CEO message is what the company wants to pursue from a long-term standpoint [9,10,12,14]. Therefore, it is expected that it will be difficult for the emphasis in the CEO messages posted on the company’s website to immediately lead to current corporate performance. Hence, the following hypothesis is derived.
Hypothesis 1.
The emphasis on the CEO message’s content (financial standpoint, customer standpoint, internal management process standpoint, learning and growth standpoint, and corporate social activities) on the corporate website belonging to the fashion industry will not have a significant relationship with the current corporate value.
Also, this research conducts an empirical analysis on whether the emphasis (financial standpoint, customer standpoint, internal process standpoint, learning and growth standpoint, and social responsibility) among the CEO messages on the corporate website has a significant relationship with future corporate value.
According to a stakeholder standpoint approach to the resource-based theory [1], CEOs can have access to significant resources stakeholders can provide. If a manager provides useful and important information about a firm with shareholders and stakeholders, the firm value is likely to be estimated more positively. Based on the stakeholder resource-based theory [2], if a firm attracts the kind of resources necessary to generate such profits, the manager of the company should recognize that stakeholders as well as shareholders have claims about profits that help their resources generate. And, by the stakeholder theory [3,4], CSR activities of firms have a positive impact upon the future firm value [29,30]. Also, by the legitimacy theory [5,6], if the manager of the company discloses positive social and environmental information in response to the media, it improves the corporate image and brings good results to the company.
If the CEO transparently discloses management information about the company and behaves ethically, corporate governance is sound, and this plays a critical part in the growth of the company. In addition, according to the legitimacy theory [7,8], corporate social responsibility activities improve a firm’s image and give customers belief and trust in the company, ultimately further strengthening corporate value.
However, in general, the emphasis on a firm’s CEO message is more time-consuming from a long-term standpoint than easily achievable in the short term [12,13]. Even if the emphasis in the CEO message posted on the company’s website does not directly lead to current corporate performance, it may have a significant effect on future corporate value to some extent from a long-term standpoint. In other words, the CEO of the company will continue to pursue what he or she aims for in the CEO message of the website, and these efforts are expected to be realized in the long run to help improve future corporate value. Thus, we derive the following hypothesis.
Hypothesis 2.
The emphasis on the CEO message content (financial standpoint, customer standpoint, internal management process standpoint, learning and growth standpoint, and corporate social activities) on the corporate website belonging to the fashion industry will have a significant association with the future firm value.

3. Research Design

3.1. Sample Selection

3.1.1. Financial Data

The samples’ year for this research is 2020, and the samples’ targets are KOSPI- and KOSDAQ-listed fashion industry companies in South Korea. In addition, banking, securities, and insurance industries are excluded from the samples due to dissimilar accounting standards. Also, the samples were obtained only from corporations with their settlement date at the end of December.
This study conducted an empirical analysis by collecting data from companies belonging to the Korean fashion industry. KIS-VALUE of NICE credit rating information provides financial data on listed companies in Korea and also provides information on standard industry classification codes.
The corporate financial data utilized in this paper meet all of the below conditions:
Condition 1: KOSPI- and KOSDAQ-listed fashion industry firms in South Korea.
Condition 2: Except from the banking, securities, and insurance industries, a firm with their settlement date at the end of December.
Condition 3: The financial data can be collected from KIS-value of NICE credit rating information (http://www.nicerating.com, accessed date, 15 September 2022).
After obtaining the samples by satisfying all of these conditions, firms that do not have finance data are excluded from the final samples. In addition, this study uses winsorizing of the extremities of 1% of the samples utilized in the analysis. Given all of the above conditions, the number of final samples is 42 firm-year. Among the companies listed in KOSPI and KOSDAQ, a detailed survey of industries related to “fashion, textiles, and fashion design” by the standard industry classification code showed that there were only 47 companies in total. Among them, four companies did not have a CEO message, and one company did not have financial data about the company. As a result of considering these situations, the number of final samples utilized to empirical analysis was 42 firm/year. The detailed information on the samples of this research is as follows. Table 1 indicates the calculation process of the number of ultimate observations used in this study.

3.1.2. Text Data

Text mining defines a method to derive meaningful information from text data by using natural language processing (NLP) [31]. This method enables users to extract and use useful information from a lot of textual data. Utilizing Java API functions, the text that we want is collected automatically, and unnecessary words from obtained text data are removed in the procedure of deciding keywords.
The specific text mining process utilized in this study is as follows: First, our researchers conducted the bag-of-words (BoW) methodology [32] to obtain frequently repeated words in the CEO messages of corporate homepages. The term frequency-inverse document frequency (TF-IDF) matrix [24], which indicates the frequency of word repetition in the CEO message of a firm’s website, is made by employing the BoW methodology. The TF-IDF is most generally utilized in text mining vectorizing technics [25].

3.1.3. Classifying CEO Message of a Firm’s Website by SBSC Framework

The balanced scorecard (BSC) has been used as a research method in many previous studies so far and has been actively used in practice [15,16,17,18]. The BSC identifies interactions among financial, customers, internal management processes, and learning and growth standpoints. These four standpoints of the BSC are interlinked by cause-and-result relations [15]. By estimating and explaining major success factors based upon these four standpoints, the BSC method helps the accomplishment of the corporation’s successful visions and aims [15]. Actually, for sustainable growth of the company, the BSC approach can provide important factors and suggest clear strategies [17].
However, the performance evaluation elements of the BSC framework are missing elements of corporate social responsibility and related activities. To overcome the shortcomings of the existing BSC framework, not including the social responsibility standpoint, the SBSC framework is created by adding corporate social responsibility elements to the existing BSC framework, and this framework is becoming more and more actively used [19,20,21,22].
In this paper, our researchers utilize the SBSC framework including a corporate social responsibility standpoint to the prior four standpoints. Yet, the CEO message of the company homepage involves a lot of keywords on the management environment outside of the firm. Therefore, this study classifies the keywords of CEO messages utilizing six standpoints (finance, customer, internal management process, learning and growth, social responsibility, and external management environment). In this study, external management environment is actually excluded from the analysis because it is an area the company cannot control.

3.1.4. Research Method

The concrete analysis method of this research is as follows. First of all, our researchers only selected the fashion companies among companies listed in Korea’s KOSPI and KOSDAQ in 2020 as samples. And financial data of the sample companies are downloaded from Kis-value [23] and converted into variables.
Next, CEO messages’ text data on the homepages of the sample companies are obtained by hand-collecting. The repeated words with high TF-IDF [25,26] values are selected as keywords through text-mining [26] techniques.
Third, in this study, the CEO messages of the firm are classified by the SBSC framework. In other words, our researchers classify the keywords of CEO messages posted on the websites of companies belonging to the fashion industry as one of financial standpoints, customer standpoints, internal management process standpoints, learning and growth standpoints, and corporate social standpoints.
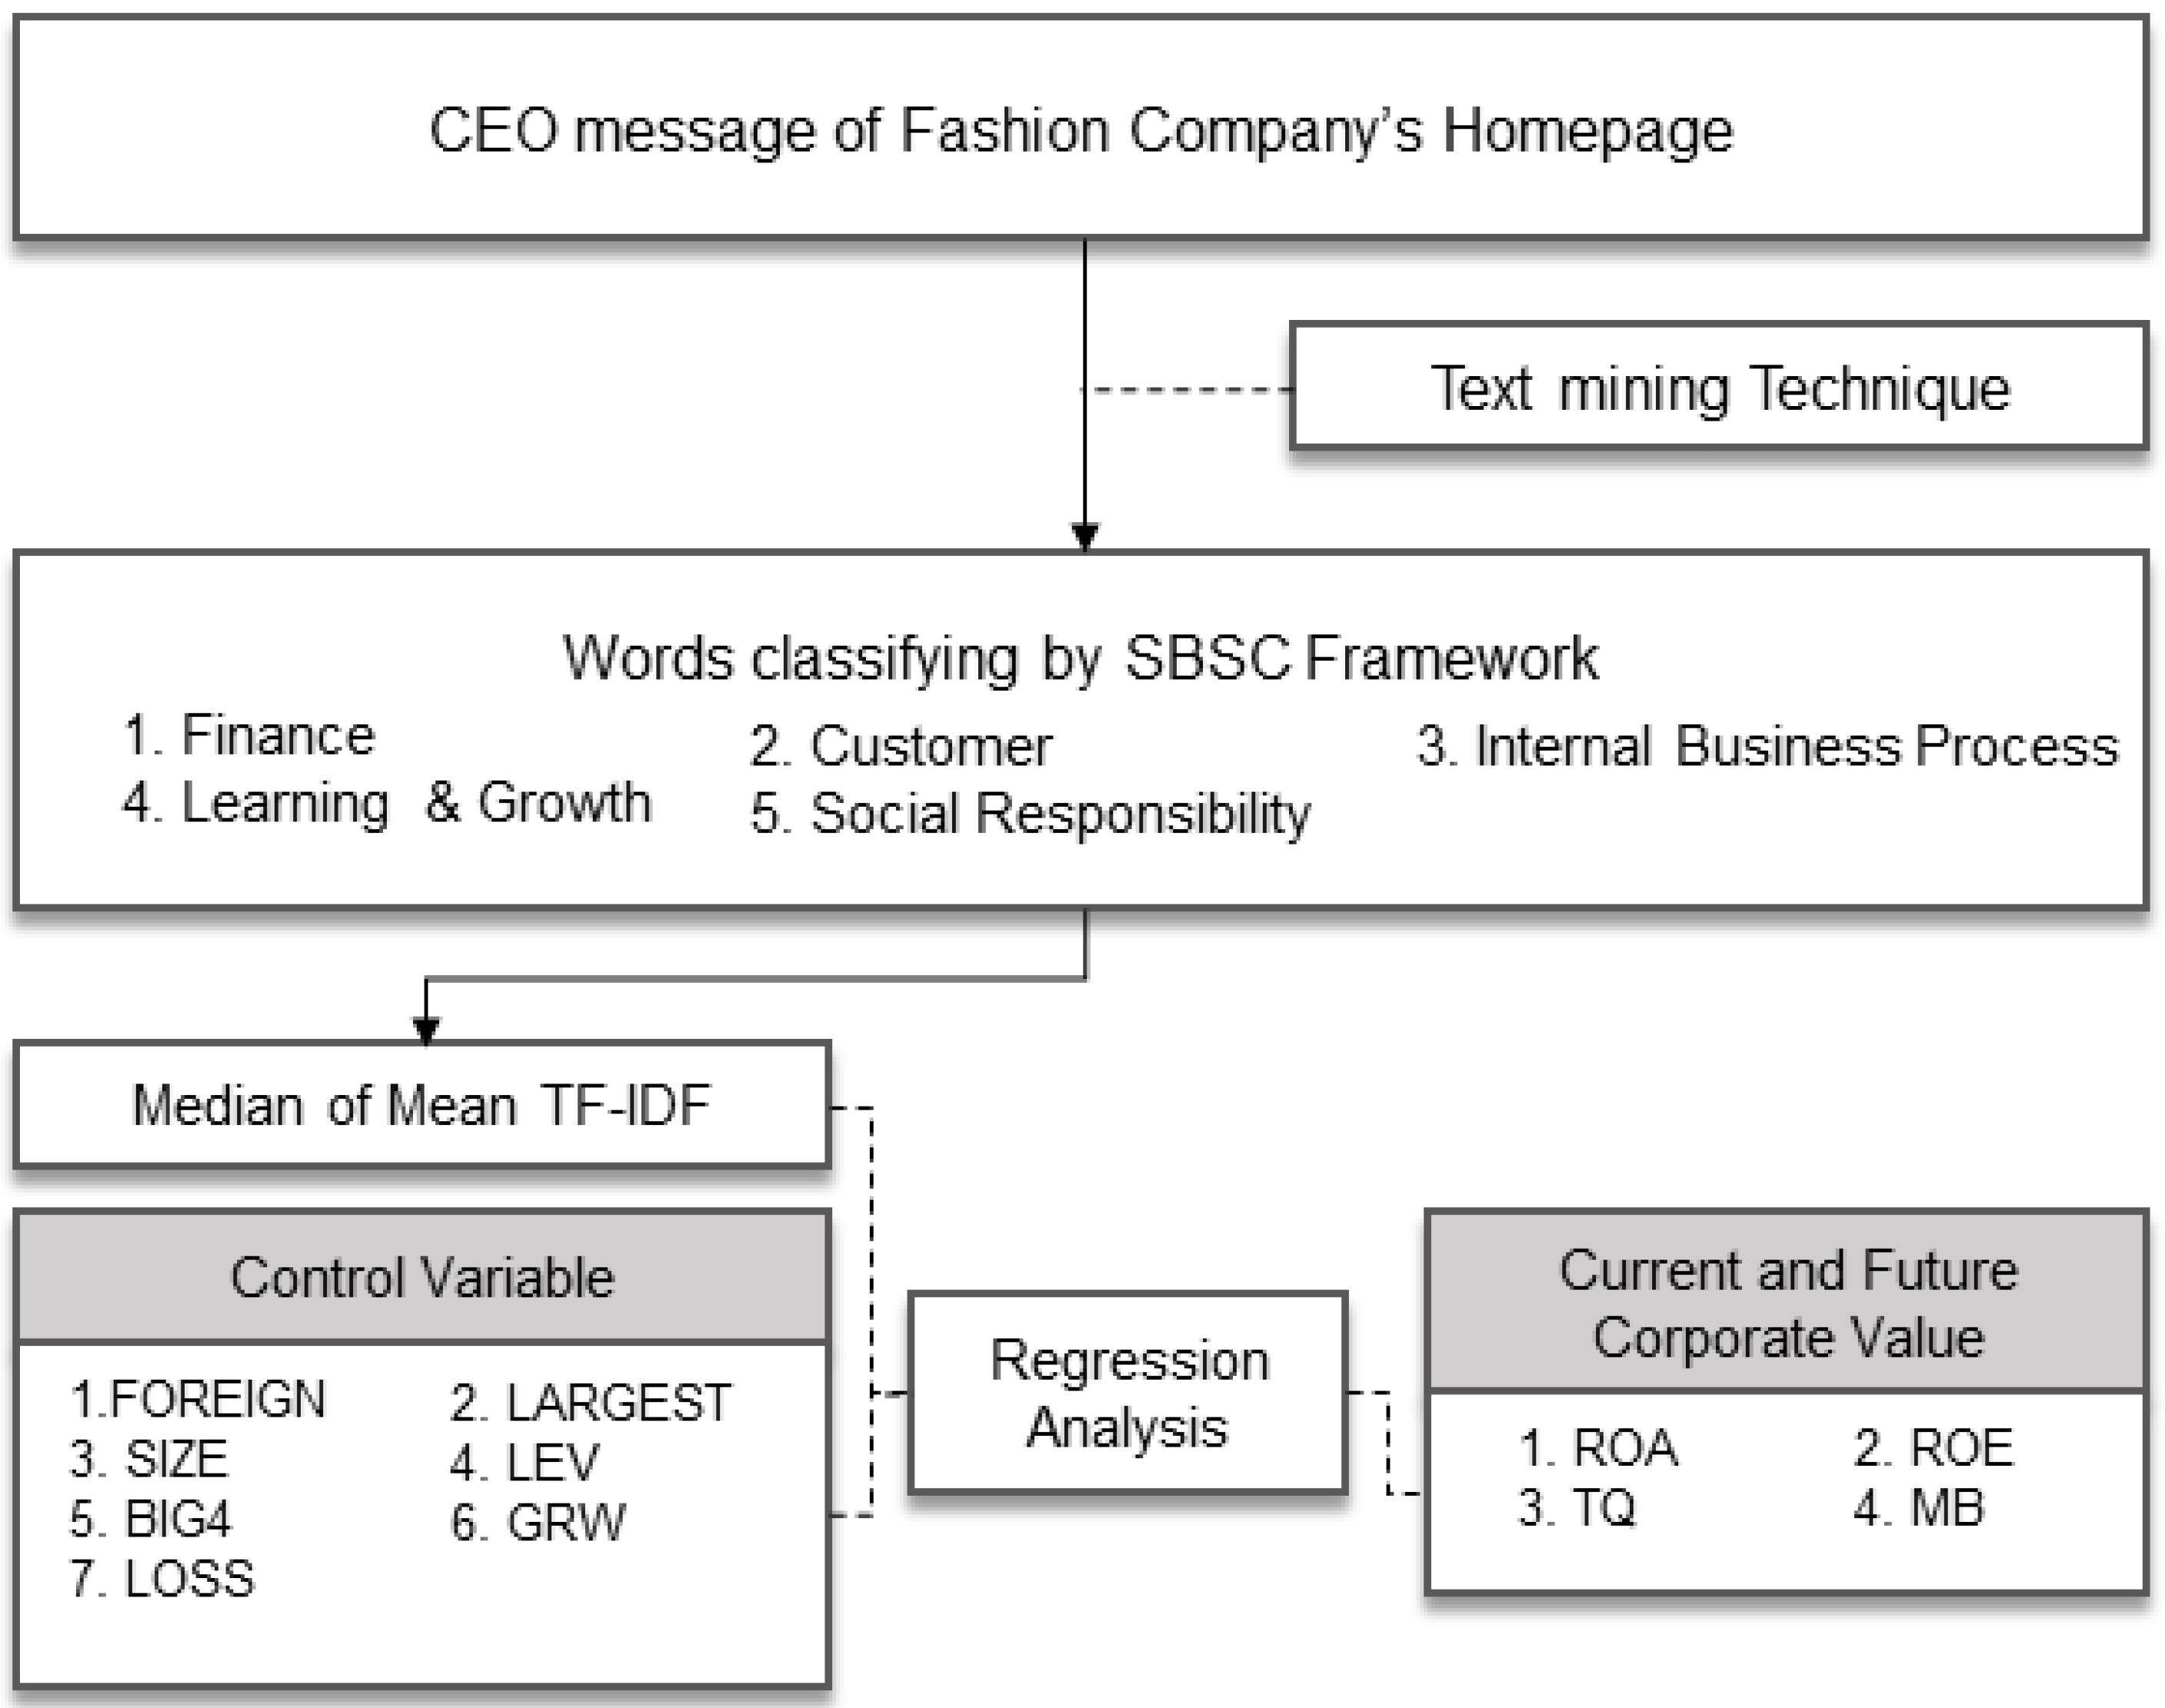
Finally, we examine through regression analysis whether firms that emphasize certain factors have changes in their future or current corporate value. Also, using social network analysis [27], CONCOR analysis [28], and 2SLS analysis, as an additional test, we check the objectivity and robustness of the results of this paper. The following (Figure 1) schematizes the research method used in this paper to be easy to understand.

3.2. Descriptive Statistics and Correlation Analysis

The variables utilized for the empirical testing of this research are described in Table 2. Both ROA and ROE are employed as proxies for current company value [31,32]. Also, TQ and MB are used as measures for future firm value [33,34]. Many previous studies have utilized ROA and ROE as proxy variables for current firm value, and Tobin’s Q and market value to book value ratio as proxy variables for future corporate value [35,36,37,38,39,40,41,42,43].
In this paper, by the SBSC framework, the CEO messages of the company homepages belonging to the fashion industry are classified into five types, as follows and transformed into variables. “Finance” refers to the TF-IDF average value of words classified by the SBSC framework from a financial standpoint, and “Customer” refers to the TF-IDF average value of words classified by the SBSC framework from a customer standpoint, “Internal Management Process” refers to the TF-IDF average value of words classified by the SBSC framework in terms of internal management process, and “Learning & Growth” refers to the TF-IDF average value of words classified by the SBSC framework in terms of learning and growth. And the last variable, “Social Responsibility”, refers to the TF-IDF average value of words classified by the SBSC framework from the standpoint of social responsibility.
Descriptive statistics of the variables used in this paper are presented in Table 3. The means of TQ and MB, which show future corporate value, are 0.703 and 1.151, respectively, and the standard deviations are 0.486 and 0.778, respectively. The means of ROA and ROE, which represent current corporate value, are –0.016 and –0.045, respectively, and the standard deviations are 0.111 and 0.200, respectively. In 2020, the sample period of this study, it is estimated that the current corporate value was relatively low due to the COVID-19 pandemic, and the future corporate value was also relatively low for the same reason.
The results of correlation analysis show Table 4. TQ and MB, indicating future company value, present positive (+) association significantly. ROA and ROE, indicating current company value, have positive (+) relation significantly as well. TQ has no significant relation with ROA. In addition, TQ has no significant association with ROE. Also, MB presents no significant association with ROA and ROE.

3.3. Empirical Analysis Model

3.3.1. Empirical Analysis Model for Hypothesis 1

This research employs OLS (ordinary least square) analysis to test hypotheses. The empirical analysis model for testing Hypothesis 1 of this paper is as follows:
ROA/ROE = β0 + β1 Finance/Customer/Internal Management Process/Learning & Growth/Social Responsibility + β2 FOREIGN +
β3 LARGEST + β4 SIZE + β5 LEV + β6 BIG4 + β7 GRW + β8 LOSS + ε
See Table 2 for definitions of variables.
In Equation (1), this research model establishes Finance/Customer/Internal Management Process/Learning and Growth/Social Responsibility as the independent variable, meaning the average TF-IDF value of words is classified by the SBSC framework [17,18] into financial standpoint/customer standpoint/internal management process standpoint/learning and growth standpoint/social responsibility standpoint, respectively.
In this paper, our researchers examine the difference between the influence of CEO messages upon current and future corporate values. First, in the accounting, economics, and finance research, ROA or ROE is used as a proxy for current corporate value [31,32,35,36].
Current profit means net income of current year. ROA is a financial indicator that refers to the ratio of current profits to total assets and refers to the current company’s profit ratio. ROE is a financial indicator that refers to the ratio of current profits to total capital, and like ROA, it refers to the current corporate profit ratio. The formula for the company’s current value is as follows:
ROA = current profit/total assets.
ROE = current profit/total capital.
Next, in the accounting, economics, and finance research, Tobin’s q or market value of capital to book value of capital ratio is utilized as a proxy for future firm value [33,34,37,38]. The formula for the firm’s future value is as follows. TQ is a variable that means Tobin’s Q, and MB is a variable that means market value of capital to book value of capital ratio. Both of these variables are widely used as proxy variables for a company’s future value in accounting, economics, and the financial research field [39,40,41,42,43].
TQ is calculated as the following explanation. The sum of common stock market capitalization, preferred stock market capitalization, and debt book value is divided by the asset’s book value. This means the market value of the total asset is compared to the book value of the total asset, and it can be interpreted that the larger the TQ, the higher the total asset of the company. In other words, it means that as the TQ increases, the corporate value improves in the future, and MB is a variable that means the market value of total capital is compared to the book value of total capital. It can be interpreted that the larger the MB value, the higher the total capital is expected. In other words, the larger the MB, the greater the future corporate value. The formula for the company’s future value is as follows.
TQ = (common stock market capitalization + preferred stock market
capitalization + debt book value)/assets book value.
MB = (market capitalization of common stock + preferred stock market
capitalization)/capital book value.
In order to test Hypothesis 1, the research model establishes and employs ROA and ROE as dependent variables, meaning current corporate value. In accounting and finance fields, most studies employ ROI and ROE as measures for current company value [31,32].
The control variables employed in this research model are as follows. Above all, in order to consider corporate governance, FOREIGN indicating the foreign investor share ratio and LARGE indicating the largest shareholder share ratio are used as the control variables in the empirical analysis model [44,45]. To control the corporate size, SIZE is established with a natural log on the lagged year total assets [46]. LEV, indicating liability ratio, is employed to take a considerable financial risk [47]. BIG4 is used to consider the audit risk indicating, if one of the large foreign accounting companies called Big4 is audited. To take a consideration of the sales growth rate of the firm [48], GRW indicating the sales growth ratio is used [49]. Finally, LOSS is employed to control the negative effect from the firm’s loss [50].
If Finance/Customer/Internal Management Process/Learning and Growth/Social Responsibility’s coefficient β1 shows a significantly positive (+) value, and Finance/Customer/Internal Management Process/Learning and Growth/Social Responsibility have the impact of increasing present firm value, and vice versa, if β1 presents a negative (−) value significantly, and Finance/Customer/Internal Management Process/Learning and Growth/Social Responsibility have the influence of reducing present firm value.

3.3.2. Empirical Analysis Model for Hypothesis 2

The research model to test Hypothesis 2 of this study is as follows:
TQ/MB = β0 + β1 Finance/Customer/Internal Management Process/Learning & Growth/Social Responsibility + β2 FOREIGN +
β3 LARGEST + β4 SIZE + β5 LEV + β6 BIG4 + β7 GRW + β8 LOSS + ε
See Table 2 for definitions of variables.
In Equation (2), this research model establishes Finance/Customer/Internal Management Process/Learning and Growth/Social Responsibility as the independent variable, meaning the average TF-IDF value of words is classified by the SBSC framework into financial standpoint/customer standpoint/internal management process standpoint/learning and growth standpoint/social responsibility standpoint, respectively.
And, in the research model, TQ and MB are employed as proxies for future firm value [33,34]. In Equation (2) for Hypothesis 2 verification, the control variable is used in the same as Equation (1) for Hypothesis 1 verification.
If Finance/Customer/Internal Management Process/Learning and Growth/Social Responsibility’s coefficient β1 shows a positive (+) value significantly, and Finance/Customer/Internal Management Process/Learning & Growth/Social Responsibility have the impact of increasing future company value, and vice versa, and if β1 has a negative (−) value significantly, Finance/Customer/Internal Management Process/Learning and Growth/Social Responsibility have the influence of reducing future company value.

4. Research Results

4.1. Results of Hypothesis 1

Table 5 shows the results of testing the finance standpoint of Hypothesis 1 in this research. As ROA is used as the dependent variable, for the coefficient of Finance, β1 is −0.019, and the t-value is −0.034. This represents no significant result statistically. As ROE is used as the dependent variable, for the coefficient of Finance, β1 is −0.083, and the t-value is −0.081. This indicates no significant result statistically as well. These results mean that the finance standpoint of a CEO message does not affect the current corporate value.
The results of testing the customer standpoint of Hypothesis 1 in this study are shown in Table 6. As ROA is employed as the dependent variable, for the coefficient of Customer, β1 is −0.338, and the t-value is −1.324. This is no significant result, statistically. As ROE is employed as the dependent variable, for the coefficient of Customer, β1 presents −0.355, and the t-value is −0.722. This is no significant result, statistically. The results imply that customer standpoint of CEO message does not have a significant relationship with current firm value.
Table 7 represents the results of testing the internal management process standpoint of Hypothesis 1 in this paper. As ROA is utilized as a dependent variable, for the coefficient of Internal Management Process, β1 is −0.386, and the t-value is −0.853. This indicates no significant result, statistically. As ROE is employed as a dependent variable, for the coefficient Internal Management Process, β1 is −0.107, and the t-value is −0.124. This presents no significant result statistically as well. These results mean that the internal management process standpoint of a CEO message does not have influence on current corporate value.
Table 8 shows the results of testing the learning and growth standpoint of Hypothesis 1 in this research. As ROA is utilized as a dependent variable, for the coefficient of Learning and Growth, β1 is −0.574, and the t-value is −1.353. This result indicates no significant result, statistically. When ROE is employed as a dependent variable, for the coefficient of Learning and Growth, β1 shows −0.677, and the t-value is −0.830. This is not a significant result, statistically. The results imply that the learning and growth standpoint of a CEO message does not have significant association with current firm value.
Table 9 represents results of testing the social responsibility standpoint of Hypothesis 1 in this research. As ROA is used as a dependent variable, for the coefficient of Social Responsibility, β1 is −0.412, and the t-value is −1.577. This is not a significant result, statistically. As ROE is employed as a dependent variable, for the coefficient of Social Responsibility, β1 indicates −0.370, and the t-value is −0.727. This is no significant result statistically as well. These results mean that the social responsibility standpoint of a CEO message does not affect the current corporate value.
Overall, the CEO messages of companies’ homepages in the fashion industry were classified by the SBSC framework (Finance/Customer/Internal Management Process/Learning and Growth/Social Responsibility standpoint), and empirical analysis was conducted to find if each standpoint had a significant relationship with the current corporate value.
However, as expected, the results show that all standpoints of the CEO message had no significant relationship with current corporate value. These results mean that most CEO messages posted on the corporate website are expressed from a long-term standpoint, and it takes a long time for the visions or goals expressed in the CEO message to actually affect corporate value. A company’s vision and strategy are established by managers from a long-term standpoint, and as a company pursues this, the company’s image will be improved, and the brand value will be improved. However, it is difficult to immediately attract consumers to the image or brand value of a company [35].

4.2. Findings on Hypothesis 2

Table 10 shows the results of testing the finance standpoint of Hypothesis 2 in this paper. As TQ is used as the dependent variable, for the coefficient of Finance, β1 is −2.957, and the t-value is −0.914. This indicates no significant result, statistically. As MB is employed as a dependent variable, for the coefficient of Finance, β1 is −3.647, and the t-value is −0.711. This is not a significant result statistically as well. These results mean that the finance standpoint of a CEO message does not affect future firm value.
The results of testing the customer standpoint of Hypothesis 2 in this study are shown in Table 11. As TQ is used as a dependent variable, for the coefficient of Customer, β1 is 0.999, and the t-value is 0.639. This is not a significant result, statistically. As MB is used as the dependent variable, for the coefficient of Customer, β1 presents 1.221, and the t-value is 0.494. This is not a significant result, statistically. The results imply that the customer standpoint of a CEO message does not have a significant relationship with future corporate value.
Table 12 shows results of testing the internal management process standpoint of Hypothesis 2 in this research. As TQ is employed as a dependent variable, for the coefficient of Internal Management Process, β1 is 3.015, and the t-value is 1.121. This is not a significant result, statistically. As MB is utilized as a dependent variable, for the coefficient of Internal Management Process, β1 is 3.809, and the t-value is 0.892. This is not a significant result statistically as well. These results mean that the internal management process standpoint of a CEO message does not influence future corporate value.
The results of testing the learning and growth standpoint of Hypothesis 2 in this study are shown in Table 13. As TQ is used as a dependent variable, for the coefficient of Learning and Growth, β1 is 0.734, and the t-value is 0.281. This indicates no significant result, statistically. As MB is used as a dependent variable, for the coefficient of Learning and Growth, β1 shows 1.330, and the t-value is 0.323. This is not a significant result, statistically. The results imply that the learning and growth standpoint of a CEO message does not have a significant association with future firm value.
Table 14 presents results of testing the social responsibility standpoint of Hypothesis 2 in this study. As TQ is employed as a dependent variable, for the coefficient of Social Responsibility, β1 is 3.246, and the t-value is 2.134. This is a significant result under 5%, statistically. As MB is used as a dependent variable, for the coefficient of Social Responsibility, β1 is 4.193, and the t-value is 1.709. This is a significant result under 10%, statistically.
These results imply that increasing the words related to the social responsibility standpoint of the CEO message of the firm’s homepage can improve future corporate value. In other words, it can be interpreted that if a company presents its vision and goals related to social responsibility in the CEO message of the homepage website and pursues them in the long run, corporate value can ultimately be improved.
Additionally, the Adj_R_square value is 26.41% for TQ and 25.34% for MB as a dependent variable, respectively. The results imply that there is high inter-variable explanation power in this empirical model. The F-value of this model is 2.635 for TQ and 2.546 for MB as a dependent variable, respectively, and this is significant under 5%, statistically. This result indicates that the empirical model of this study is highly reasonable.
Finally, as the result of the empirical testing of this research, the finding is that the future corporate value improves as companies mention more words related to corporate social responsibility among CEO messages on the corporate website disclosed by fashion companies.
In recent years, consumers have responded favorably to companies that devote and serve society with a sense of social responsibility. In particular, due to the nature of fashion companies, they are relatively more sensitive to consumer reactions and consider the corporate image to be more important than those belonging to other industries. If a fashion company presents its vision and goals for corporate social responsibility and keeps them, the firm will be able to develop further in the long run.

4.3. Additional Tests

4.3.1. Social Network Analysis and CONCOR Analysis

Through the result of the empirical analysis in this research, we find that corporate value is significantly related to social responsibility in the CEO message on the corporate website, from a long-term standpoint. This study additionally performs social network analysis [19] and CONCOR analysis [20] to further enhance the objectivity and robustness of the results of this paper.
Further analysis of this study uses “Textom”, a social matrix program provided by “The IMC corporation” to identify the keyword co-occurrence matrix and numerically calculate the structural arrangement between keywords to construct a 1-mode network matrix. The constructed matrix uses “Ucinet6”, a network analysis tool, to identify the connection structure between keywords and to visualize the network as a NetDraw function by quantifying the degree of relationship.
In addition, we derive clusters of keywords with similar characteristics by utilizing “CONCOR (Convergence of interested CORrelations) analysis”, a structural isotropy measurement method that uses correlation values to derive patterns of relationships between actors.
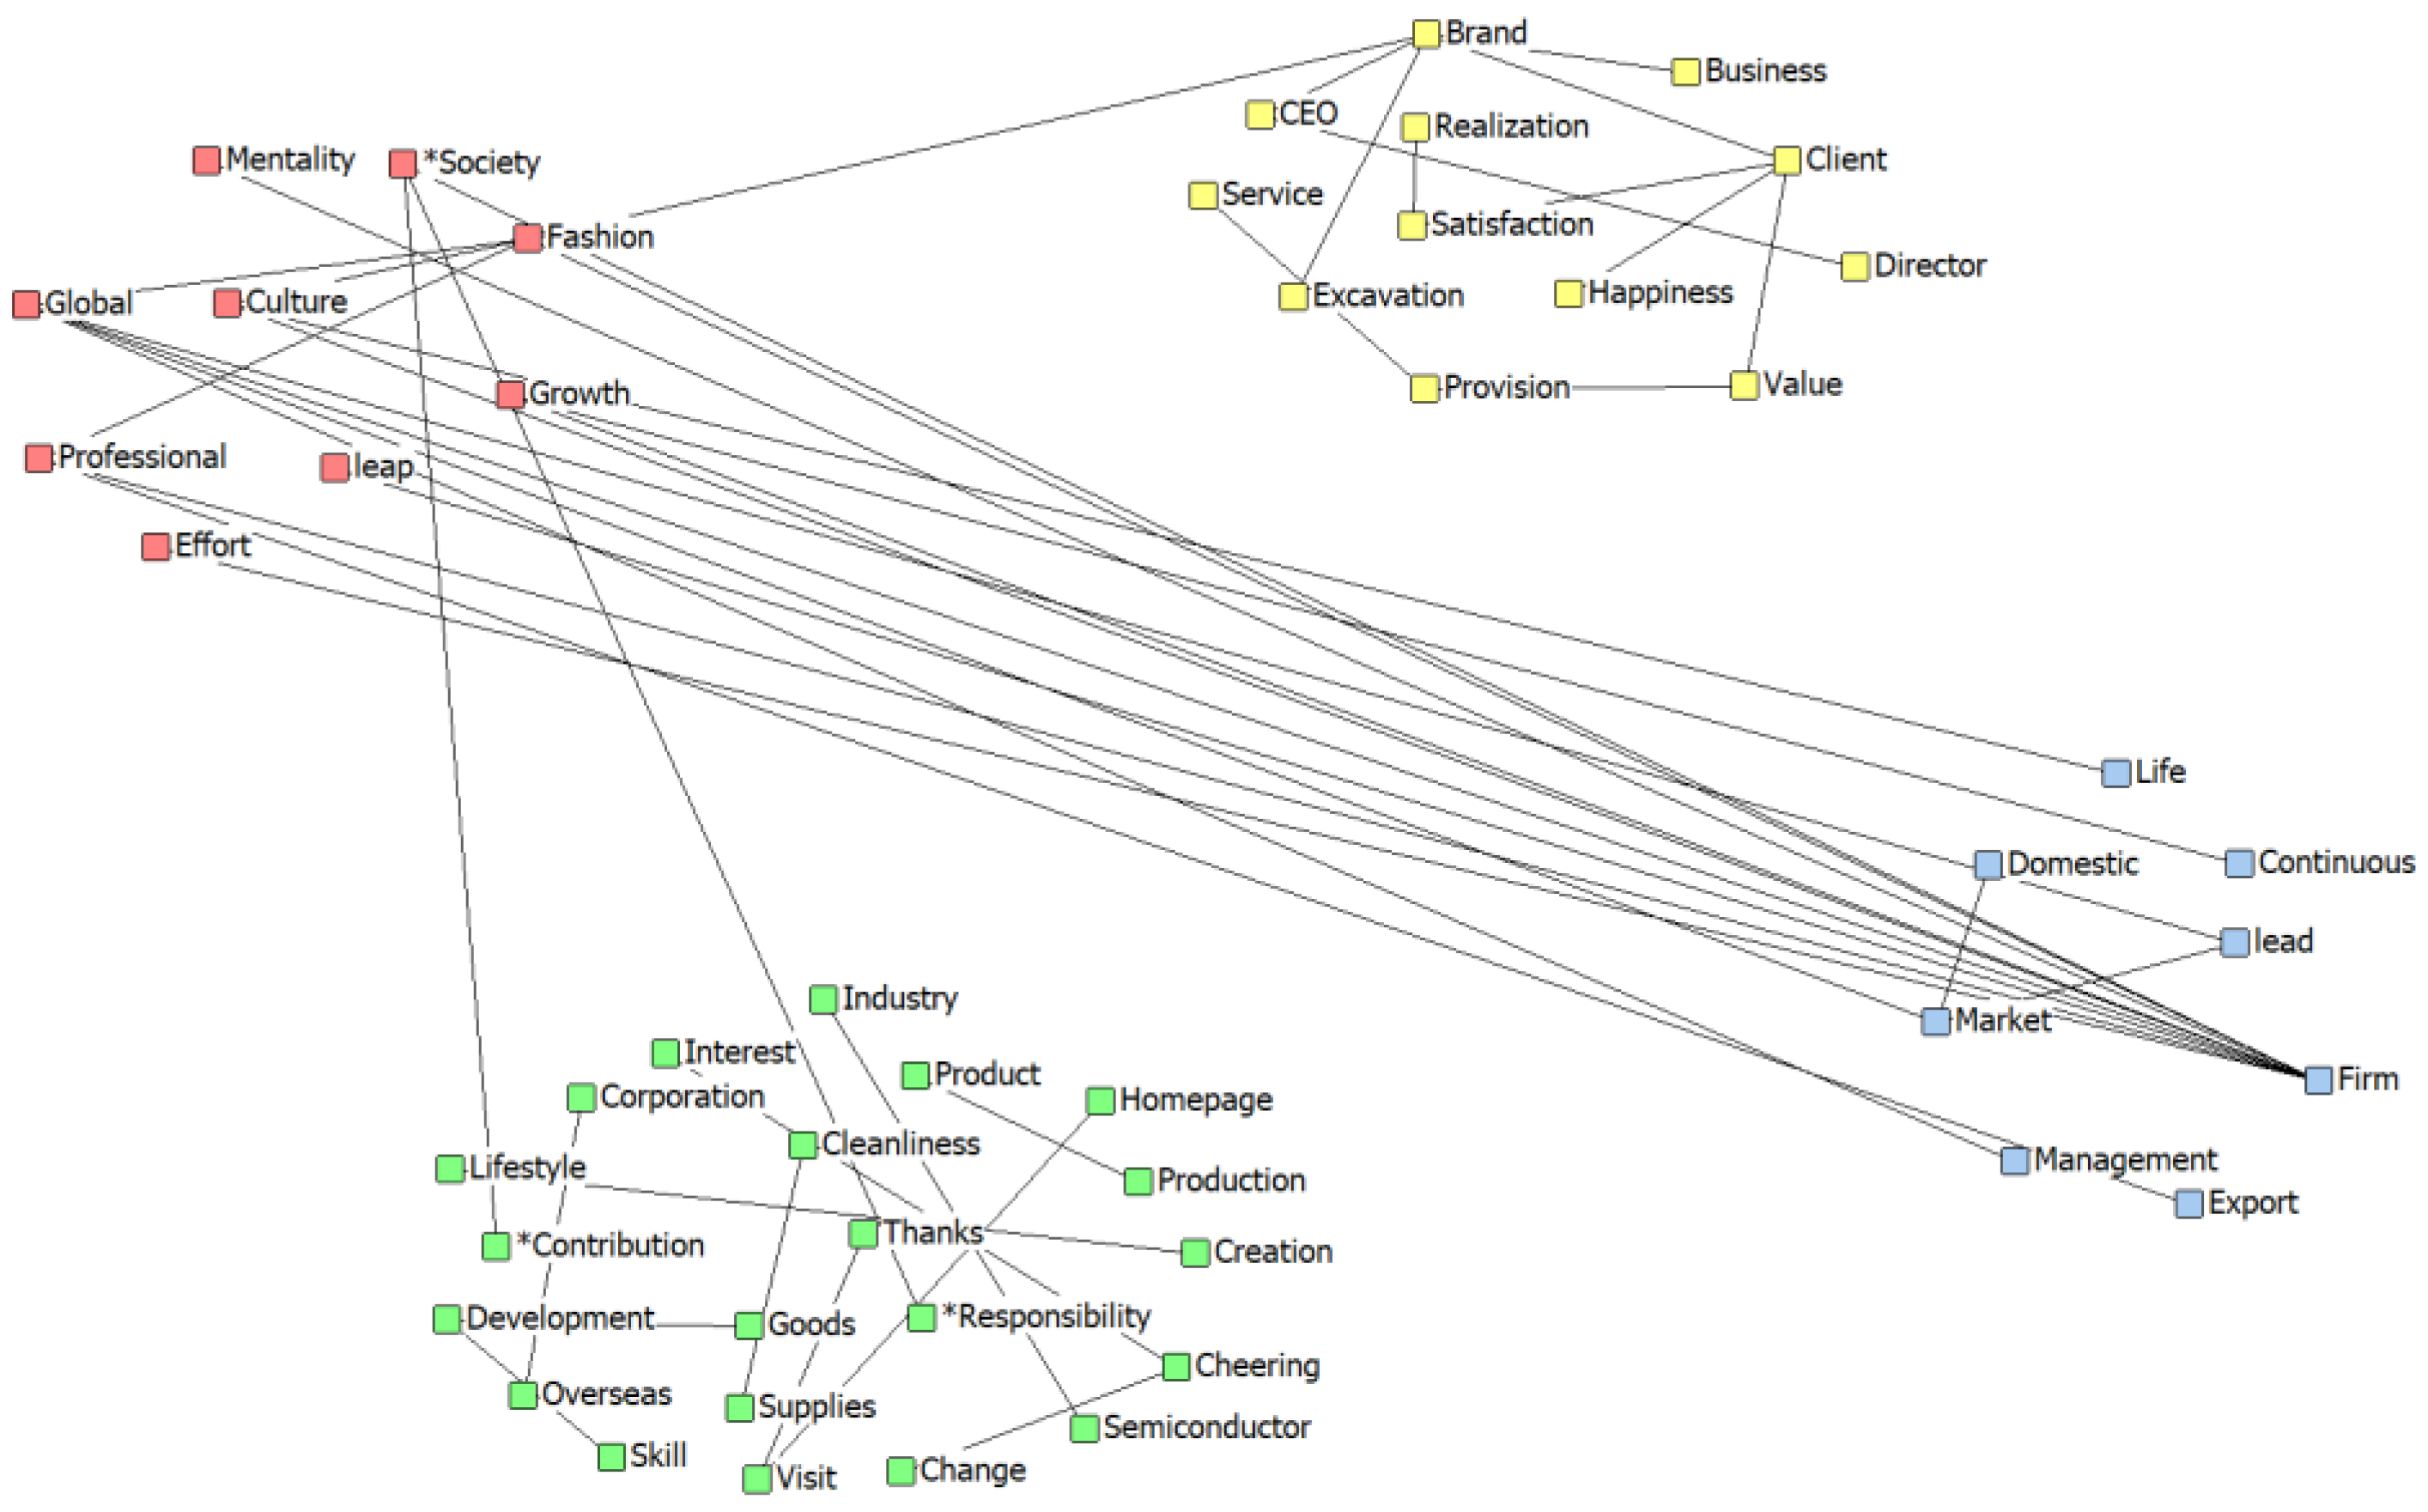
As of 31 December 2020, this study produced a network based on “connection accuracy centrality” to visualize the pattern and connection relationship of the corporate greeting data corresponding to the fashion industry among domestic listed companies and then conducted a CONCOR analysis. The results of visualization in consideration of the high-frequency ranking by applying “connection centrality” to the upper keyword are presented in (Figure 2).
In the analysis process, keywords corresponding to “social responsibility” were separated from other keywords by “* marking”, and the keywords for “social responsibility” were “Society”, “Contribution”, and “Responsibility”, which included three out of a total of 50 keywords. When a total of 50 important keywords were network visualized as nodes, 90 connecting lines appeared between each node, and the network average density was 1.80.
First of all, network analysis shows that “Society” is related to “Firm”, “Contribution”, and “Responsibility”, and “Contribution” is related to “Brand”, “Management”, and “Society”. Finally, “Responsibility” is associated with “Corporation”, “Overseas”, and “Society”. These results can be inferred that corporate social responsibility activities are closely related to business by improving corporate brand value through contributions to society.
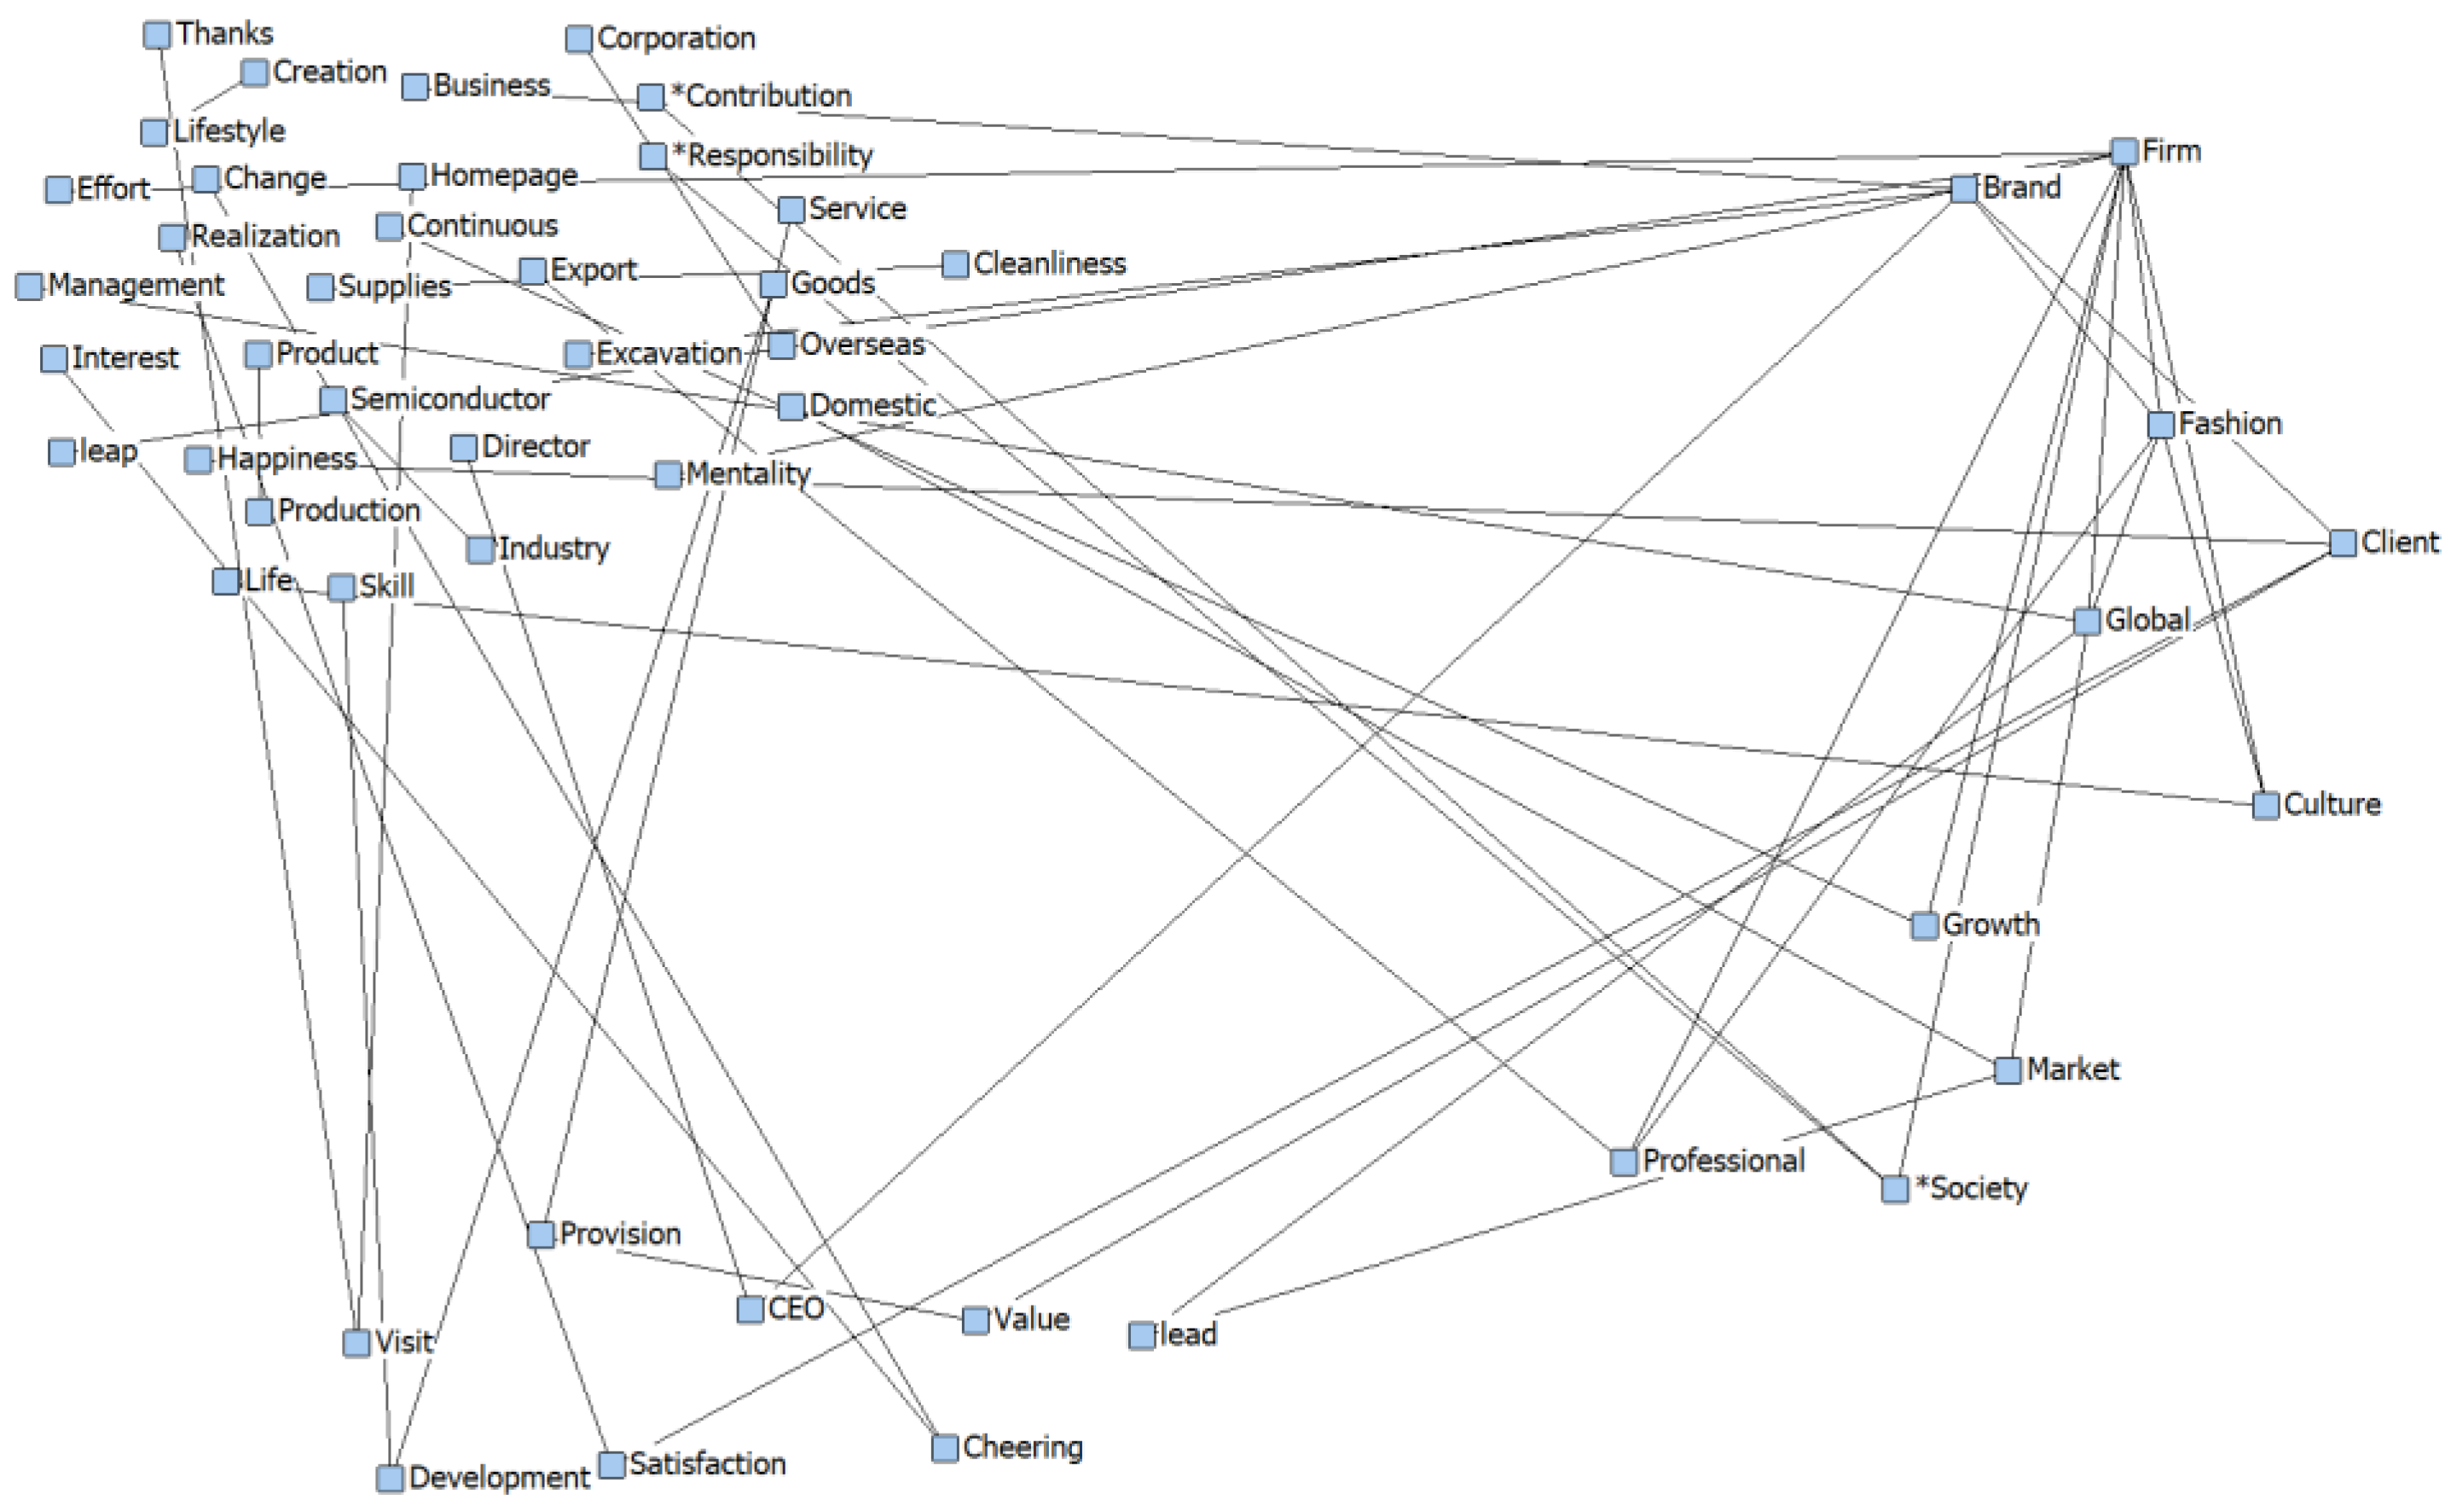
On the other hand, the results of the CONCOR analysis using 50 major top keywords are shown in Figure 3, and as a result of the analysis, they were classified into four groups. The spacing between each keyword shows how much the keywords are related to each other as a visual distance, and it can be interpreted that if the spacing between keywords is close, it has a high correlation, and if the distance is farther, it has a lower correlation. As can be seen in the figure, it is possible to interpret the relationship and connection relationship between keywords corresponding to each group.
The results of CONCOR analysis show that “Society”, “Contribution”, and “Responsibility” are interrelated, and in particular, “Society” and “Responsibility” were also related to “Growth”. Also, the results present that “Fashion” is associated with “Brand”, and “Brand” is associated with “CEO” and “Business”. In addition, “Firm” is organically related to “Society”, “Fashion”, and “Growth”.
From these results, it can be interpreted that fashion companies can grow brand value through social activities and that the CEO can play an important part in management. In conclusion, the results of the additional test support the fact that there is a significant association between the mention of social responsibility and future corporate value in the CEO message of the corporate website, which is the main result of this research.

4.3.2. 2SLS Analysis

This study additionally conducts 2SLS analysis to control the endogeneity that may occur in the research model. If the 2SLS analysis results are the same as the existing research results, the empirical analysis results of this study can be interpreted as robust and objective results. The first stage model of the 2SLS study model of this study is as follows:
[1st stage]  (3)
Finance/Customer/Internal Management Process/Learning & Growth/Social Responsibility
= β0 + β1 LARGEST + β2 SIZE + β3 LEV + β4 GRW + β5 CFO + ε
In Equation (3), five variables by the SBSC framework are employed as dependent variables. In addition, LARGET, SIZE, LEV, GRW, and CFO are set as variables to explain the characteristics of a company’s Finance/Customer/Internal Management Process/Learning and Growth/Social Responsibility. First of all, LARGEST is established because the manager’s position may vary depending on the company’s largest shareholder stake [44,45]. In addition, SIZE, which means the size of the company, is added because the vision or strategy of the company may differ depending on the size of the company [46]. LEV is employed because the debt ratio can also affect setting the company’s vision or strategy [47,48,49]. In addition, GRW and CFO variables are added to the model because the situation facing the company changes according to the company’s growth rate or operating cash flow [50,51,52,53].
CFO is calculated by the formula in which the operating cash flow is divided by lagged year-end total assets. In Equation (4), the second stage model of the 2SLS study model of this study is as follows:
[2nd stage]  (4)
ROA/ROE/TQ/MB = β0 + β1 Finance/Customer/Internal Management Process/Learning &
Growth/Social Responsibility + β2 FOREIGN + β3 LARGEST + β4 SIZE + β5 LEV+ β6 BIG4 +
β7 GRW + β8 LOSS + ε
The results of the 2SLS analysis for endogenous control in this study are as follows. Table 15 shows the result of 2SLS analysis when the independent variable is Finance in the second stage. The results of the additional test are the same as the main analysis results, and when the emphasis in the CEO message is related to Finance, there is no significant relationship between the current and future corporate values.
Table 16 presents the result of 2SLS analysis when the independent variable is Customer in the second stage. The results of the additional test show the same as the main analysis results, and when the emphasis in the CEO message is related to Customer, there is no significant relationship between the current and future corporate values.
Table 17 indicates the result of 2SLS analysis when the independent variable is Internal Management Process in the second stage. The results of the additional test present the same as the main analysis results, and when the emphasis in the CEO message is related to Internal Management Process, there is no significant relationship between the current and future corporate values.
Table 18 is the result of 2SLS analysis when the independent variable is Learning and Growth in the second stage. The results of the additional test show the same as the main analysis results, and when the emphasis in the CEO message is related to Learning and Growth, there is no significant relationship between the current and future corporate values.
Finally, Table 19 shows the result of 2SLS analysis when the independent variable is Social Responsibility in the second stage. The results of the additional test are the same as the main analysis results, when the emphasis in the CEO message is related to Social Responsibility. It has no significant relationship between Social Responsibility contents in the CEO message and current firm value. Yet, the result indicates a significantly positive (+) association with future corporate value.
The results of the 2SLS additional test in this study are all consistent with the results of the main test. This means that the empirical analysis results of this paper have high reliability and also that endogenous does not exist in the research model in this study.

4.3.3. Exclude LOSS from Control Variables + 2SLS Analysis (Results for Hypothesis 1)

Table 20 presents additional results for Hypothesis 1. This study conducts an additional test by excluding LOSS from the control variable to investigate whether the results of Hypothesis 1 may not be significant due to the control variable representing the loss of the company in the verification of Hypothesis 1. The results of the additional analysis are as follows. When the dependent variable is ROA or ROE, the relationship with social responsiveness is not statistically significant. Therefore, we find that the reason why the results of Hypothesis 1 do not show significantly is not because of the control variable LOSS.

4.3.4. Include ROA as a Control Variable + 2SLS Analysis (Results for Hypothesis 2)

Table 21 shows additional results for Hypothesis 2. In this study, in the verification of Hypothesis 2, additional analysis is performed to control the point that the present value of the corporation may affect the future value of the firm. ROA was additionally set as a control variable in the research model of Hypothesis 2. The results of the additional test are as follows. When the dependent variable is TQ, the β1 value, which is the coefficient of Social Responsibility, an independent variable, is 3.276, and the t-value is 2.044. This result is statistically significant below 5%. However, when the dependent variable is MB, the relationship with the independent variable Social Responsibility is not statistically significant. The finding of this additional test is the relationship between TQ and Social Responsibility is the same as the result of the main analysis. Hence, this means that Hypothesis 2 is supported.

5. Conclusions

This paper examined the association between CEO messages and current and future firm value on the websites of fashion companies. The research methods of this paper are as follows: First, we extracted the fashion companies’ samples among companies listed in Korea’s KOSPI and KOSDAQ in 2020. Financial data of the sample companies were downloaded from Kis-value [15] and converted into financial variables. Second, CEO messages’ text data on the homepages of the fashion companies were obtained by hand-collecting. The repeated words with high TF-IDF [16,17] values were selected as keywords using text-mining [18] techniques. Third, the CEO messages of the fashion firms are classified by the SBSC framework. Namely, keywords of CEO messages posted on the websites of fashion companies were classified as one of financial standpoints, customer standpoints, internal management process standpoints, learning and growth standpoints, and corporate social standpoints. Ultimately, this research investigates through regression analysis whether firms that emphasize certain factors affect their future or current corporate value. As an additional test, to check the objectivity and robustness of the results of this paper, this paper used social network analysis [19] and CONCOR analysis [20]. Also, to check endogeneity, this study conducted 2SLS analysis.
The findings of this research are as follows: The first finding presents that all the standpoints of the CEO message of fashion firms had no significant association with current firm value. These results imply that CEO messages posted on the company homepage are generally expressed from a long-term standpoint, and it takes a long time to realize their visions or goals expressed in the CEO message to actually effect corporate value.
The second finding shows that the future firm value can be improved as firms mention more words related to a corporation’s social responsibility among CEO messages of the company homepages disclosed by fashion companies. In recent years, consumers have responded favorably to companies that devote and serve social activities with social responsibility. Especially, owing to the nature of fashion companies, they are relatively more sensitive to consumers’ reactions and consider the image of the firm more importantly than those belonging to other industries. This result implies that if a fashion firm shows its vision and goals related to corporate social responsibility and makes an effort to achieve them, the company’s value will be increased in the future.
Additionally, this study performed social network analysis [19] and CONCOR analysis [20] to check the objectivity and robustness of the results of this paper. And, to check endogeneity, this paper also conducted 2SLS analysis. In conclusion, the results of the additional tests support the fact that there is a significant positive association between the mention of social responsibility in the CEO message of the corporate website and future firm value. In other words, this result provides us with important and useful information that fashion companies can grow brand value through social responsibility activities and that the CEO of the firm can play an important part in successful development of the company.
The contributions of this study are as follows. First, this research quantified unstructured text data through text mining for topics in the accounting field and then conducted an empirical analysis using them. The introduction of the new and innovative methodology used in this study is expected to contribute to the development of convergence research.
Second, the empirical analysis results of this study mean that the contents of the company’s CEO message posted on the website contain symbolic and important information about the company. In particular, this study proved through empirical analysis that efforts and performances related to corporate social responsibility help increase corporate value in the long run.
Third, this paper used the SBSC framework to classify keywords of CEO messages posted on the corporate website, clearly identifying what vision and strategy companies emphasize. In particular, this study expanded the scope of empirical research in the future by extracting important information contained in corporate qualitative data and using it for empirical analysis.
Fourth, this study is not the first study to conduct an empirical analysis on the relationship between a company’s CEO message and corporate value. In South Korea, where information flow is fast due to the development of IT technology, consumers are relatively sensitive and can quickly acquire information provided by companies. In addition, the fashion industry is more sensitive than other industries and is greatly influenced by corporate image and brand. Therefore, this paper examined the relationship between the CEO message of a company and corporate value by sampling companies belonging to the Korean fashion industry. As a result of the study, it was reaffirmed that the CEO message disclosed on the company’s website contains meaningful information.
The research scope and limitations of this research are as follows. Our researchers conducted an empirical analysis by sampling only listed companies belonging to the Korean fashion industry. As a result, there is a limitation to the small number of samples. Yet, as a result of the empirical testing of this paper, despite the small number of samples, a significant value was derived for the F-value, which means the validity of the model. In addition, the adjusted R-square value, which means the explanatory power between variables, was also derived as a normal value. In future studies, it is necessary to present more objective research results by securing the number of samples so that there is no problem with the number of samples.
Author Contributions

Conceptualization, H.J.N.; methodology, H.J.N. and S.R.K.; software, H.J.J.; validation, S.R.K. and H.J.N.; formal analysis, H.J.J. and H.J.N.; resources, H.J.J.; data curation, H.J.J. and S.R.K.; writing—original draft preparation, H.J.N.; writing—review and editing, S.R.K. and H.J.J.; supervision, H.J.N.; project administration, S.R.K. All authors have read and agreed to the published version of the manuscript.

Funding

This work was supported by a research grant from Seoul Women’s University (2022-0102).

Institutional Review Board Statement

Not applicable.

Informed Consent Statement

Not applicable.

Data Availability Statement

Not applicable.

Conflicts of Interest

The authors declare no conflict of interest.

References

  1. Balakrishnan, S.; Koza, M.P. Information asymmetry, adverse selection and joint-ventures: Theory and evidence. J. Econ. Behav. Organ. 1993, 20, 99–117. [Google Scholar] [CrossRef]
  2. Barney, J.B. Why resource-based theory’s model of profit appropriation must incorporate a stakeholder standpoint. Strateg. Manag. J. 2018, 39, 3305–3325. [Google Scholar] [CrossRef]
  3. Harjoto, M.A.; Jo, H. Corporate governance and firm value: The impact of corporate social responsibility. J. Bus. Ethics 2011, 103, 351–383. [Google Scholar]
  4. Jo, H.; Harjoto, M.A. The causal effect of corporate governance on corporate social responsibility. J. Bus. Ethics 2012, 106, 53–72. [Google Scholar] [CrossRef]
  5. Deegan, C.; Rankin, M.; Tobin, J. An examination of the corporate social and environmental disclosures of BHP from 1983–1997: A test of legitimacy theory. Account. Audit. Account. J. 2002, 15, 312–343. [Google Scholar] [CrossRef]
  6. Ulum, I.; Ghozali, I.; Chariri, A. Pengaruh intellectual capital terhadap kinerja keuangan perusahaan perbankan di Indonesia. Doctoral Dissertation, Fakultas Ekonomika & Bisnis, Universitas Diponegoro (UNDIP), Semarang, Indonesia, 2007. [Google Scholar]
  7. O’donovan, G. Environmental disclosures in the annual report: Extending the applicability and predictive power of legitimacy theory. Account. Audit. Account. J. 2002, 15, 344–371. [Google Scholar] [CrossRef]
  8. Burlea, A.S.; Popa, I. Legitimacy theory. Encycl. Corp. Soc. Responsib. 2013, 21, 1579–1584. [Google Scholar]
  9. Amernic, J.; Craig, R.; Tourish, D. Measuring and Assessing Tone at the Top Using Annual Report CEO Letters; The Institute of Chartered Accountants of Scotland: Edinburgh, UK, 2010. [Google Scholar]
  10. Andreia Costa, G.; Cristina Oliveira, L.; Lima Rodrigues, L.; Craig, R. Factors associated with the publication of a CEO letter. Corp. Commun. Int. J. 2013, 18, 432–450. [Google Scholar] [CrossRef]
  11. Mäkelä, H.; Laine, M. A CEO with many messages: Comparing the ideological representations provided by different corporate reports. Account. Forum 2011, 35, 217–231. [Google Scholar] [CrossRef]
  12. Kohut, G.F.; Segars, A.H. The president’s letter to stockholders: An examination of corporate communication strategy. J. Bus. Commun. 1992, 29, 7–21. [Google Scholar] [CrossRef]
  13. Segars, A.H.; Kohut, G.F. Strategic communication through the World Wide Web: An empirical model of effectiveness in the CEO’s letter to shareholders. J. Manag. Stud. 2001, 38, 535–556. [Google Scholar] [CrossRef]
  14. Bournois, F.; Point, S. A letter from the president: Seduction, charm and obfuscation in French CEO letters. J. Bus. Strategy 2006, 27, 46–55. [Google Scholar] [CrossRef]
  15. Kaplan, R.S.; Norton, D.P. Measuring the strategic readiness of intangible assets. Harv. Bus. Rev. 2004, 82, 52–63. [Google Scholar] [PubMed]
  16. Kaplan, R.S. The balanced scorecard: Comments on balanced scorecard commentaries. J. Account. Organ. Chang. 2012, 8, 539–545. [Google Scholar] [CrossRef]
  17. Kaplan, R.S.; Norton, D.P. Transforming the balanced scorecard from performance measurement to strategic management: Part II. Account. Horiz. 2001, 15, 147–160. [Google Scholar] [CrossRef]
  18. Lipe, M.G.; Salterio, S.E. The balanced scorecard: Judgmental effects of common and unique performance measures. Account. Rev. 2000, 75, 283–298. [Google Scholar] [CrossRef]
  19. Falle, S.; Rauter, R.; Engert, S.; Baumgartner, R. Sustainability management with the sustainability balanced scorecard in SMEs: Findings from an Austrian case study. Sustainability 2016, 8, 545. [Google Scholar] [CrossRef] [Green Version]
  20. Kang, J.S.; Chiang, C.F.; Huangthanapan, K.; Downing, S. Corporate social responsibility and sustainability balanced scorecard: The case study of family-owned hotels. Int. J. Hosp. Manag. 2015, 48, 124–134. [Google Scholar] [CrossRef]
  21. Rabbani, A.; Zamani, M.; Yazdani-Chamzini, A.; Zavadskas, E.K. Proposing a new integrated model based on sustainability balanced scorecard (SBSC) and MCDM approaches by using linguistic variables for the performance evaluation of oil producing companies. Expert Syst. Appl. 2014, 41, 7316–7327. [Google Scholar] [CrossRef]
  22. Figge, F.; Hahn, T.; Schaltegger, S.; Wagner, M. The Sustainability Balanced Scorecard–Theory and Application of a Tool for Value-Based Sustainability Management. In Proceedings of the Greening of Industry Network Conference, Göteborg, Sweden, 23–26 June 2002; Volume 2. [Google Scholar]
  23. KIS-VALUE. Available online: https://www.kisvalue.com (accessed on 1 September 2022).
  24. Ramos, J. Using TF-IDF to Determine Word Relevance in Document Queries. In Proceedings of the First Instructional Conference on Machine Learning, Piscataway, NJ, USA, 3–8 December 2003; Volume 242, pp. 133–142. [Google Scholar]
  25. Zhang, W.; Yoshida, T.; Tang, X. A comparative study of TF* IDF, LSI and multi-words for text classification. Expert Syst. Appl. 2011, 38, 2758–2765. [Google Scholar] [CrossRef]
  26. Jing, L.P.; Huang, H.K.; Shi, H.B. Improved Feature Selection Approach TFIDF in Text Mining. In Proceedings of the International Conference on Machine Learning and Cybernetics, Beijing, China, 4–5 November 2002; Volume 2, pp. 944–946. [Google Scholar]
  27. Can, U.; Alatas, B. A new direction in social network analysis: Online social network analysis problems and applications. Phys. A Stat. Mech. Appl. 2019, 535, 122372. [Google Scholar] [CrossRef]
  28. Baek, S.M.; Moon, I.O. The Study on the patient safety culture convergence research topics through text mining and CONCOR analysis. J. Digit. Converg. 2021, 19, 359–367. [Google Scholar]
  29. Lueg, R.; Pedersen, M.M.; Clemmensen, S.N. The role of corporate sustainability in a low-cost business model–A case study in the Scandinavian fashion industry. Bus. Strategy Environ. 2015, 24, 344–359. [Google Scholar] [CrossRef]
  30. Noris, A.; Nobile, T.H.; Kalbaska, N.; Cantoni, L. Digital fashion: A systematic literature review. A standpoint on marketing and communication. J. Glob. Fash. Mark. 2021, 12, 32–46. [Google Scholar] [CrossRef]
  31. Manning, C.; Surdeanu, M.; Bauer, J.; Finkel, J.; Bethard, S.; McClosky, D. The Stanford CoreNLP Natural Language Processing Toolkit. In Proceedings of the 52nd Annual Meeting of the Association for Computational Linguistics: System Demonstrations, Baltimore, MD, USA, 22–27 June 2014; pp. 55–60. [Google Scholar]
  32. Sun, H.; Sun, X.; Wang, H.; Li, Y.; Li, X. Automatic target detection in high-resolution remote sensing images using spatial sparse coding bag-of-words model. IEEE Geosci. Remote Sens. Lett. 2011, 9, 109–113. [Google Scholar] [CrossRef]
  33. Cremers, M.; Ferrell, A. Thirty years of shareholder rights and firm value. J. Financ. 2014, 69, 1167–1196. [Google Scholar] [CrossRef]
  34. Anbar, A.; Alper, D. Bank specific and macroeconomic determinants of commercial bank profitability: Empirical evidence from Turkey. Bus. Econ. Res. J. 2011, 2, 139–152. [Google Scholar]
  35. Lang, L.H.; Stulz, R.M. Tobin’s q, corporate diversification, and firm performance. J. Polit. Econ. 1994, 102, 1248–1280. [Google Scholar]
  36. De Andres, P.; Azofra, V.; Lopez, F. Corporate boards in OECD countries: Size, composition, functioning and effectiveness. Corp. Gov. Int. Rev. 2005, 13, 197–210. [Google Scholar] [CrossRef]
  37. Park, S.O.; Na, H.J.; Kwon, O. Comparative effect of company-driven SNS activity vs. consumer-driven SNS activity on firm value: Evidence from Facebook. Comput. Ind. 2016, 82, 186–195. [Google Scholar] [CrossRef]
  38. Nazir, M.S.; Afza, T. Does managerial behavior of managing earnings mitigate the relationship between corporate governance and firm value? Evidence from an emerging market. Future Bus. J. 2018, 4, 139–156. [Google Scholar] [CrossRef]
  39. Na, H.J.; Lee, K.C.; Choi, S.U.; Kim, S.T. Exploring CEO messages in sustainability management reports: Applying sentiment mining and sustainability balanced scorecard methods. Sustainability 2020, 12, 590. [Google Scholar] [CrossRef] [Green Version]
  40. Benamraoui, A.; Jory, S.R.; Mazouz, K.; Shah, N.; Gough, O. The effect of block ownership on future firm value and performance. N. Am. J. Econ. Financ. 2019, 50, 100982. [Google Scholar] [CrossRef]
  41. Fu, L.; Singhal, R.; Parkash, M. Tobin’s q ratio and firm performance. Int. Res. J. Appl. Financ. 2016, 7, 1–10. [Google Scholar]
  42. Na, H.J.; Choi, S.; Kwon, O. The association of institutional information on websites with present and future financial performance. J. Soc. E- Bus. Stud. 2018, 23, 63–85. [Google Scholar]
  43. Adachi-Sato, M.; Vithessonthi, C. Corporate debt maturity and future firm performance volatility. Int. Rev. Econ. Financ. 2019, 60, 216–237. [Google Scholar] [CrossRef]
  44. Kautonen, T.; Van Gelderen, M.; Fink, M. Robustness of the theory of planned behavior in predicting entrepreneurial intentions and actions. Entrep. Theory Pract. 2015, 39, 655–674. [Google Scholar] [CrossRef]
  45. Marin, G.; Marino, M.; Pellegrin, C. The impact of the European Emission Trading Scheme on multiple measures of economic performance. Environ. Resour. Econ. 2018, 71, 551–582. [Google Scholar] [CrossRef]
  46. Bai, C.-E.; Liu, Q.; Lu, J.; Song, F.M.; Zhang, J. Corporate governance and market valuation in China. J. Comp. Econ. 2004, 32, 599–616. [Google Scholar] [CrossRef] [Green Version]
  47. Doukas, J. Overinvestment, Tobin’s q and gains from foreign acquisitions. J. Bank. Financ. 1995, 19, 1285–1303. [Google Scholar] [CrossRef]
  48. Francis, J.J.; Johnston, M.; Robertson, C.; Glidewell, L.; Entwistle, V.; Eccles, M.P.; Grimshaw, J.M. What is an adequate sample size? Operationalising data saturation for theory-based interview studies. Psychol. Health 2010, 25, 1229–1245. [Google Scholar] [CrossRef] [PubMed] [Green Version]
  49. Ross, S.A. The determination of financial structure: The incentive-signaling approach. Bell J. Econ. 1977, 8, 23–40. [Google Scholar] [CrossRef] [Green Version]
  50. Elemes, A.; Blaylock, B.; Spence, C. Tax-motivated profit shifting in big 4 networks: Evidence from Europe. Account. Organ. Soc. 2021, 95, 101267. [Google Scholar] [CrossRef]
  51. Rose, C. The composition of semi-two-tier corporate boards and firm performance. Corp. Gov. Int. Rev. 2005, 13, 691–701. [Google Scholar] [CrossRef]
  52. Shih, J.; Samad-Khan, A.; Medapa, P. Is the size of an operational loss related to firm size. Oper. Risk. 2000, 2, 21–22. [Google Scholar]
  53. Detthamrong, U.; Chancharat, N.; Vithessonthi, C. Corporate governance, capital structure and firm performance: Evidence from Thailand. Res. Int. Bus. Financ. 2017, 42, 689–709. [Google Scholar] [CrossRef]
Figure 1. Research method.
Sustainability 14 15285 g001
Figure 2. The result of social network analysis. The * mark on the keyword in the figure is the word related to corporate social responsibility activities.
Sustainability 14 15285 g002
Figure 3. The result of CONCOR. The * mark on the keyword in the figure is the word related to corporate social responsibility activities.
Sustainability 14 15285 g003
Table 1. Sample selection criteria.
CriteriaN
Fashion companies in the KOSPI and KOSDAQ market in 202047
   Less: Absence of corporation’s CEO messages(4)
   Less: Impossible to obtain financial data from the database(1)
Final samples42
Table 2. Definition of variables.
VariablesDefinition
FinanceThe mean of TF-IDF of the keywords indicating financial standpoint by SBSC framework.
CustomerThe mean of TF-IDF of the keywords indicating customer standpoint by SBSC framework.
Internal Management ProcessThe mean of TF-IDF of the keywords indicating internal management process standpoint by SBSC framework.
Learning and GrowthThe mean of TF-IDF of the keywords indicating learning and growth standpoint by SBSC framework.
Social ResponsibilityThe mean of TF-IDF of the keywords indicating social responsibility standpoint by SBSC framework.
ROAMeasures for current company value 1: current net income is divided by total assets.
ROEMeasures for current company value 2: current net income is divided by total equity.
TQMeasures for future company value 1: the sum of the market value of equity and the book value of debt, all divided by the book value of total assets.
MBMeasures for future company value 2: market value of equity to book value of equity ratio.
FOREIGNForeign investors’ shareholder ratio.
LARGEThe largest shareholder’s equity ratio.
SIZENatural logarithm of lagged year’s total assets.
LEVThe ratio of lagged year’s total debts to lagged year’s total assets.
BIG4Dummy variable, 1 if a firm is audited by Big4 accounting corporation, otherwise 0.
GRW(Current year’s sales − lagged year’s sales) ÷ lagged year’s sales
LOSSDummy variable, 1 if the firm reports loss, otherwise 0.
Table 3. Descriptive statistics.
VariablesNMeansSDMinQ1MediumQ3Max
ROA42−0.0160.111−0.307−0.0740.0040.0540.205
ROE42−0.0450.200−0.640−0.1400.0050.0730.307
TQ420.7030.4860.1320.3520.5350.9592.211
MB421.1510.7780.2760.4940.8541.6313.040
FORN420.0380.0640.0010.0070.0170.0300.273
LARGE420.2800.1570.0690.1850.2250.3450.701
SIZE4226.0080.89124.62225.45125.97526.61028.097
LEV420.3650.1740.0860.2170.3620.5150.696
BIG4420.3570.4850.0000.0000.0001.0001.000
GRW42−0.0880.218−0.576−0.205−0.0790.0320.050
LOSS420.4760.5050.0000.0000.0001.0001.000
See Table 2 for definitions of variables.
Table 4. The result of correlation analysis.
VariablesROAROETQMBFinanceCustomerInternal Management ProcessLearning and GrowthSocial ResponsibilityFOREIGNLARGESTSIZELEVBIG4GRWLOSS
ROA1.000 ***
ROE0.952 ***1.000 ***
TQ0.047 0.068 1.000 ***
MB−0.078 −0.143 0.868 ***1.000 ***
Finance0.145 0.127 0.034 0.023 1.000 ***
Customer−0.078 −0.005 0.157 0.073 0.507 ***1.000 ***
Internal Management Process−0.163 −0.069 0.235 0.170 0.386 **0.779 ***1.000 ***
Learning and Growth−0.095 −0.014 0.175 0.087 0.626 ***0.918 ***0.790 ***1.000 ***
Social Responsibility−0.248 −0.160 0.333 **0.272 *0.110 0.803 ***0.808 ***0.670 ***1.000 ***
FOREIGN0.187 0.193 −0.173 −0.237 −0.082 −0.111 −0.120 −0.078 −0.171 1.000 ***
LARGEST0.066 −0.050 0.296 *0.369 **0.123 −0.071 0.005 −0.066 −0.009 −0.015 1.000 ***
SIZE0.379 **0.371 **−0.292 *−0.392 **−0.063 −0.137 −0.260 *−0.220 −0.296 *0.577 ***−0.204 1.000 ***
LEV−0.267 *−0.364 **−0.208 0.217 −0.080 −0.168 −0.129 −0.256 −0.067 −0.296 *0.101 −0.158 1.000 ***
BIG40.110 0.075 −0.098 0.025 −0.095 −0.189 −0.119 −0.179 −0.262 *0.222 0.181 0.236 0.266 *1.000 ***
GRW0.446 ***0.448 ***−0.041 −0.043 0.039 0.135 0.075 0.131 0.035 0.152 −0.242 0.262 *−0.132 0.045 1.000 ***
LOSS−0.769 ***−0.742 ***−0.115 0.045 −0.158 −0.064 0.134 −0.017 0.120 −0.299 *0.048 −0.520 ***0.347 **−0.014 −0.438 ***1.000 ***
* < 0.10, ** <0.05, *** < 0.01. *, **, *** indicate significance at the 10%, 5%, 1% levels, respectively.
Table 5. Results for Hypothesis 1 (Finance standpoint, n = 42).
VariablesROAROE
βt-ValueVIFβt-ValueVIF
Intercept−0.277−0.4880.000−0.403−0.3750.000
Finance−0.019−0.0341.103−0.083−0.0811.103
FOREIGN−0.205−0.8571.748−0.399−0.8821.748
LARGEST0.0780.9291.286−0.018−0.1161.286
SIZE0.0140.6122.9000.0240.5622.900
LEV−0.050−0.6291.393−0.226−1.5171.393
BIG40.0250.9001.3000.0561.0771.300
GRW0.0741.1811.3910.1170.9871.391
LOSS−0.148−4.680 ***1.902−0.246−4.112 ***1.902
Adj_R_square54.80%50.75%
F-value6.522 ***5.695 ***
*** < 0.01. *** indicate significance at the 1% levels.
Table 6. Results for Hypothesis 1 (Customer standpoint, n = 42).
VariablesROAROE
βt-ValueVIFβt-ValueVIF
Intercept−0.142−0.2520.000−0.262−0.2410.000
Customer−0.338−1.3241.121−0.355−0.7221.121
FOREIGN−0.220−0.9451.739−0.412−0.9201.739
LARGEST0.0760.9321.275−0.021−0.1371.275
SIZE0.0090.4162.9690.0190.4472.969
LEV−0.063−0.8101.414−0.239−1.6071.414
BIG40.0220.8091.3050.0531.0251.305
GRW0.0861.3901.4190.1301.0891.419
LOSS−0.150−4.930 ***1.864−0.248−4.218 ***1.864
Adj_R_square57.14%51.53%
F-value7.074 ***5.844 ***
*** < 0.01. *** indicate significance at the 1% levels.
Table 7. Results for Hypothesis 1 (Internal Management Process standpoint, n = 42).
VariablesROAROE
βt-ValueVIFβt-ValueVIF
Intercept−0.178−0.3110.000−0.377−0.3430.000
Internal Management Process−0.386−0.8531.147−0.107−0.1241.147
FOREIGN−0.206−0.8751.735−0.396−0.8791.735
LARGEST0.0790.9581.275−0.019−0.1211.275
SIZE0.0100.4642.9850.0230.5312.985
LEV−0.061−0.7761.435−0.229−1.5141.435
BIG40.0240.9031.2960.0561.0821.296
GRW0.0841.3251.4330.1200.9951.433
LOSS−0.145−4.657 ***1.881−0.244−4.108 ***1.881
Adj_R_square55.80%50.77%
F-value6.751 ***5.697 ***
*** < 0.01. *** indicate significance at the 1% levels.
Table 8. Results for Hypothesis 1 (Learning and Growth standpoint, n = 42).
VariablesROAROE
βt-ValueVIFβt-ValueVIF
Intercept−0.102−0.1800.000−0.198−0.1810.000
Learning and Growth−0.574−1.3531.204−0.677−0.8301.204
FOREIGN−0.205−0.8821.735−0.396−0.8881.735
LARGEST0.0700.8631.281−0.028−0.1801.281
SIZE0.0080.3703.0000.0170.4053.000
LEV−0.075−0.9511.475−0.255−1.6851.475
BIG40.0240.8901.2960.0551.0711.296
GRW0.0861.3901.4170.1311.1031.417
LOSS−0.148−4.879 ***1.857−0.246−4.202 ***1.857
Adj_R_square57.24%51.78%
F-value7.098 ***5.892 ***
*** < 0.01. *** indicate significance at the 1% levels.
Table 9. Results for Hypothesis 1 (Social Responsibility standpoint, n = 42).
VariablesROAROE
βt-ValueVIFβt-ValueVIF
Intercept−0.064−0.1140.000−0.213−0.1940.000
Social Responsibility−0.412−1.5771.183−0.370−0.7271.183
FOREIGN−0.198−0.8631.735−0.390−0.8731.735
LARGEST0.0811.0131.276−0.016−0.1031.276
SIZE0.0060.2693.0490.0170.3903.049
LEV−0.056−0.7331.394−0.231−1.5631.394
BIG40.0170.6341.3400.0490.9421.340
GRW0.0881.4421.4190.1301.0911.419
LOSS−0.146−4.853 ***1.859−0.244−4.155 ***1.859
Adj_R_square58.05%51.54%
F-value7.305 ***5.846 ***
*** < 0.01. *** indicate significance at the 1% levels.
Table 10. Results for Hypothesis 2 (Finance standpoint, n = 42).
VariablesTQMB
βt-ValueVIFβt-ValueVIF
Intercept2.9810.8850.0006.7971.2740.000
Finance−2.957−0.9141.103−3.647−0.7111.103
FOREIGN−1.357−0.9581.748−0.567−0.2531.748
LARGEST0.6271.2631.2861.1671.4851.286
SIZE−0.067−0.5072.900−0.218−1.0482.900
LEV−0.727−1.5601.3930.8481.1491.393
BIG40.0280.1731.3000.0330.1281.300
GRW−0.195−0.5231.3910.0120.0201.391
LOSS−0.249−1.3271.902−0.358−1.2061.902
Adj_R_square18.08%19.79%
F-value2.005 *2.124 *
* < 0.10. * indicate significance at the 10% levels.
Table 11. Results for Hypothesis 2 (Customer standpoint, n = 42).
VariablesTQMB
βt-ValueVIFβt-ValueVIF
Intercept2.5240.7320.0006.2381.1460.000
Customer0.9990.6391.1211.2210.4941.121
FOREIGN−1.197−0.8421.739−0.370−0.1651.739
LARGEST0.5901.1861.2751.1221.4281.275
SIZE−0.055−0.4132.969−0.204−0.9662.969
LEV−0.671−1.4211.4140.9161.2271.414
BIG40.0460.2831.3050.0550.2141.305
GRW−0.222−0.5871.4190.000−0.0221.419
LOSS−0.215−1.1521.864−0.317−1.0731.864
Adj_R_square17.00%19.14%
F-value1.933 *2.079 *
* < 0.10. * indicate significance at the 10% levels.
Table 12. Results for Hypothesis 2 (Internal Management Process standpoint, n = 42).
VariablesTQMB
βt-ValueVIFβt-ValueVIF
Intercept2.1490.6290.0005.7481.0600.000
Internal Management Process3.0151.1211.1473.8090.8921.147
FOREIGN−1.226−0.8751.735−0.405−0.1821.735
LARGEST0.5731.1671.2751.1011.4131.275
SIZE−0.043−0.3272.985−0.189−0.8972.985
LEV−0.617−1.3141.4350.9851.3211.435
BIG40.0390.2451.2960.0470.1851.296
GRW−0.261−0.6941.433−0.071−0.1201.433
LOSS−0.246−1.3281.881−0.355−1.2091.881
Adj_R_square19.11%20.50%
F-value2.077 *2.175 *
* < 0.10. * indicate significance at the 10% levels.
Table 13. Results for Hypothesis 2 (Learning and Growth standpoint, n = 42).
VariablesTQMB
βt-ValueVIFβt-ValueVIF
Intercept2.7010.7720.0006.3231.1470.000
Learning and Growth0.7340.2811.2041.3300.3231.204
FOREIGN−1.242−0.8701.735−0.425−0.1891.735
LARGEST0.5941.1861.2811.1321.4351.281
SIZE−0.062−0.4553.000−0.208−0.9763.000
LEV−0.677−1.3961.4750.9281.2141.475
BIG40.0380.2341.2960.0460.1801.296
GRW−0.203−0.5331.417−0.006−0.0101.417
LOSS−0.222−1.1841.857−0.324−1.0991.857
Adj_R_square16.15%18.79%
F-value1.877 *2.054 *
* < 0.10. * indicate significance at the 10% levels.
Table 14. Results for Hypothesis 2 (Social Responsibility standpoint, n = 42).
VariablesTQMB
βt-ValueVIFβt-ValueVIF
Intercept1.2450.3790.0004.5580.8600.000
Social Responsibility3.2462.134 **1.1834.1931.709 *1.183
FOREIGN−1.290−0.9651.735−0.487−0.2261.735
LARGEST0.5541.1831.2761.0761.4251.276
SIZE−0.008−0.0643.049−0.142−0.6923.049
LEV−0.662−1.4981.3940.9311.3071.394
BIG40.0970.6271.3400.1220.4881.340
GRW−0.297−0.8341.419−0.121−0.2111.419
LOSS−0.235−1.3401.859−0.342−1.2091.859
Adj_R_square26.41%25.34%
F-value2.635 **2.546 **
* < 0.10, ** <0.05. *, ** indicate significance at the 10%, 5% levels, respectively.
Table 15. 2SLS results of Finance (n = 42).
1st Stage2nd Stage (ROA)2nd Stage (ROE)2nd Stage (TQ)2nd Stage (MB)
Variablesβt-Valueβt-Valueβt-Valueβt-Valueβt-Value
Intercept0.1000.869−0.417−0.524−0.126−0.0849.7572.196 **15.8162.211 **
Finance 1.5770.250−3.160−0.265−77.592−2.200−103.212−1.817 *
FORN −0.187−0.752−0.431−0.918−2.108−1.518−1.577−0.705
LARG−0.002−0.3240.0900.931−0.044−0.240−0.009−0.0170.3250.375
SIZE−0.003−0.6380.0170.6530.0170.345−0.232−1.605−0.438−1.882 *
LEV−0.007−0.307−0.030−0.277−0.263−1.273−1.648−2.691 **−0.380−0.385
BIG4 0.0220.7870.0601.1140.1430.8960.1850.721
GRW0.0030.1790.0701.0670.1271.0240.0370.1000.3190.542
LOSS −0.146−4.580 ***−0.249−4.117 ***−0.304−1.701 *−0.434−1.509
CFO0.0040.529
Adj_R_
square
13.06%54.88%50.85%26.98%26.15%
F value2.2326.542 ***5.713 ***2.683 **2.613 **
* < 0.10, ** <0.05, *** < 0.01. *, **, *** indicate significance at the 10%, 5%, 1% levels, respectively.
Table 16. 2SLS results of Customer (n = 42).
1st Stage2nd Stage (ROA)2nd Stage (ROE)2nd Stage (TQ)2nd Stage (MB)
Variablesβt-Valueβt-Valueβt-Valueβt-ValueΒt-Value
Intercept0.3351.4860.1240.174−0.083−0.061−3.353−0.852−1.607−0.252
Customer −1.086−0.916−0.870−0.38416.9682.592 **22.5302.120 **
FORN −0.184−0.780−0.380−0.841−1.552−1.190−0.837−0.395
LARG−0.016−1.1020.0560.648−0.037−0.2270.9281.959 *1.5712.043 **
SIZE−0.010−1.1170.0000.0180.0130.2600.1360.9430.0510.219
LEV−0.064−1.445−0.101−1.054−0.267−1.4530.1010.1901.9452.258 **
BIG4 0.0170.6220.0500.9350.1490.9650.1930.770
GRW0.0401.1590.1231.5060.1561.003−0.945−2.098 **−0.985−1.347
LOSS −0.137−4.100 ***−0.236−3.711 ***−0.401−2.181 **−0.563−1.885 *
CFO−0.021−1.359
Adj_R_
square
3.70%55.95%50.97%30.53%28.56%
F value1.3156.786 ***5.735 ***3.002 **2.821 **
* < 0.10, ** <0.05, *** < 0.01. *, **, *** indicate significance at the 10%, 5%, 1% levels, respectively.
Table 17. 2SLS results of Internal Management Process (n = 42).
1st Stage2nd Stage (ROA)2nd Stage (ROE)2nd Stage (TQ)2nd Stage (MB)
Variablesβt-Valueβt-Valueβt-Valueβt-ValueΒt-Value
Intercept0.3072.408 **0.3570.4090.3320.199−4.266−0.845−2.810−0.348
Internal ManagementProcess −2.029−0.947−2.354−0.57622.9841.858 *30.4891.540
FORN −0.212−0.901−0.404−0.902−1.156−0.851−0.310−0.143
LARG−0.014−1.6630.0290.305−0.075−0.4081.1292.022 *1.8372.056 **
SIZE−0.010−1.985 *−0.007−0.234−0.001−0.0110.1670.9350.0930.323
LEV−0.030−1.180−0.103−1.072−0.287−1.571−0.106−0.1921.6691.884 *
BIG4 0.0200.7250.0500.9640.0910.5780.1160.459
GRW0.0170.8790.1141.5240.1641.146−0.638−1.476−0.577−0.833
LOSS −0.137−4.171 ***−0.233−3.711 ***−0.345−1.815 *−0.488−1.604
CFO−0.008−0.884
Adj_R_
square
8.37%56.03%51.25%24.13%24.15%
F value1.7496.804 ***5.789 ***2.449 **2.450 **
* < 0.10, ** <0.05, *** < 0.01. *, **, *** indicate significance at the 10%, 5%, 1% levels, respectively.
Table 18. 2SLS results of Learning and Growth (n = 42).
1st Stage2nd Stage (ROA)2nd Stage (ROE)2nd Stage (TQ)2nd Stage (MB)
Variablesβt-Valueβt-Valueβt-Valueβt-ValueΒt-Value
Intercept0.3182.327 **0.6370.5720.4810.226−9.534−1.522−9.808−0.97
Learning and Growth −2.785−0.951−2.696−0.48237.9472.302 **50.3671.894 *
FORN −0.196−0.835−0.388−0.864−1.349−1.018−0.567−0.265
LARG−0.008−0.9370.0420.469−0.054−0.3111.0642.095 **1.7522.137 **
SIZE−0.010−1.878 *−0.016−0.419−0.005−0.0690.3321.5580.3120.906
LEV−0.052−1.945 *−0.182−1.141−0.354−1.1611.0961.2213.2652.254 **
BIG4 0.0180.6580.0500.9380.1240.7950.1600.634
GRW0.0251.1600.1481.4930.1880.998−1.186−2.130 **−1.304−1.452
LOSS −0.136−4.107 ***−0.234−3.691 ***−0.381−2.039 *−0.536−1.778 *
CFO−0.008−0.784
Adj_R_
square
8.58%56.04%51.10%27.89%26.74%
F value1.7696.807 ***5.760 ***2.762 **2.662 **
* < 0.10, ** <0.05, *** < 0.01. *, **, *** indicate significance at the 10%, 5%, 1% levels, respectively.
Table 19. 2SLS results of Social Responsibility (n = 42).
1st Stage2nd Stage (ROA)2nd Stage (ROE)2nd Stage (TQ)2nd Stage (MB)
Variablesβt-Valueβt-Valueβt-Valueβt-ValueΒt-Value
Intercept0.4712.217 **0.0970.133−0.207−0.149−4.161−1.053−2.685−0.416
Social Responsibility −0.698−0.809−0.368−0.22413.1882.821 ***17.5192.297 **
FORN −0.173−0.721−0.379−0.83−1.841−1.420−1.22−0.577
LARG−0.012−0.8880.0740.896−0.021−0.1350.6501.4501.2021.643
SIZE−0.015−1.860 *0.0000.0010.0160.3110.1871.2510.1190.488
LEV−0.056−1.330−0.068−0.835−0.235−1.519−0.366−0.8331.3261.849 *
BIG4 0.0170.6110.0520.9590.1741.130.2260.9
GRW0.0341.0230.1021.4350.1320.977−0.701−1.829 *−0.662−1.057
LOSS −0.138−4.159 ***−0.240−3.787 ***−0.407−2.259 **−0.571−1.941 *
CFO−0.033−2.235 **
Adj_R_
square
13.06%55.70%50.82%32.69%30.05%
F value2.232 *6.728 ***5.707 ***3.212 ***2.957 **
* < 0.10, ** <0.05, *** < 0.01. *, **, *** indicate significance at the 10%, 5%, 1% levels, respectively.
Table 20. Additional results for Hypothesis 1 (Social Responsibility standpoint, n = 42).
VariablesROAROE
βt-ValueVIFβt-ValueVIF
Intercept−1.280−1.951 *0.000−2.238−1.861 *0.000
Social Responsibility−0.456−1.3461.182−0.443−0.7141.182
FOREIGN−0.324−1.0951.713−0.600−1.1061.713
LARGEST0.1511.4691.2360.0990.5291.236
SIZE0.0522.024 *2.4790.0931.984 *2.479
LEV−0.165−1.751 *1.272−0.412−2.394 **1.272
BIG40.0080.2221.3330.0330.5291.333
GRW0.1942.617 **1.2390.3072.254 **1.239
Adj_R_square29.38%27.67%
F-value3.132 ***2.960 **
* < 0.10, ** <0.05, *** < 0.01. *, **, *** indicate significance at the 10%, 5%, 1% levels, respectively.
Table 21. Additional results for Hypothesis 2 (Social Responsibility standpoint, n = 42).
VariablesTQMB
βt-ValueVIFβt-ValueVIF
Intercept−0.426−0.1330.0001.7930.3500.000
Social Responsibility3.2762.044 **1.2464.1181.5991.246
FOREIGN−1.420−1.0231.775−0.761−0.3411.775
LARGEST0.6321.2951.3161.2291.5671.316
SIZE0.0540.4342.786−0.038−0.1892.786
LEV−0.800−1.768 *1.3900.6860.9431.390
BIG40.0810.5081.3350.1000.3911.335
GRW−0.170−0.4531.4960.1150.1901.496
ROA0.2220.2771.7590.0610.0471.759
Adj_R_square22.46%21.94%
F-value2.320 **2.280 **
* < 0.10, ** <0.05. *, ** indicate significance at the 10%, 5% levels, respectively.
Publisher’s Note: MDPI stays neutral with regard to jurisdictional claims in published maps and institutional affiliations.