Article

Using Isotopic Labeling to Investigate Artemisia ordosica Root Water Uptake Depth in the Eastern Margin of Mu Us Sandy Land

1
State Key Laboratory of Water Resource Protection and Utilization in Coal Ming, Beijing 102211, China
2
School of Geosciences and Surveying Engineering, China University of Mining and Technology (Beijing), Beijing 100083, China
3
State Key Laboratory of Coal Resources and Safe Mining, China University of Mining and Technology (Beijing), Beijing 100083, China
4
Shendong Coal Technology Research Institute, Shendong Coal Group Co., Ltd., Shenmu 719315, China
*
Author to whom correspondence should be addressed.
Sustainability 2022, 14(22), 15149; https://doi.org/10.3390/su142215149
Submission received: 8 October 2022 / Revised: 11 November 2022 / Accepted: 13 November 2022 / Published: 15 November 2022

Abstract

:
The annual precipitation in the eastern Mu Us sandy land is about 400 mm, but the precipitation varies greatly between years and seasons and severe meteorological and seasonal droughts often occur, which makes the ecological environment very fragile. Artemisia ordosica is the most dominant species in the area. We used depth-controlled deuterium labeling technology to study the root water uptake depth of adult Artemisia ordosica to explore how Artemisia ordosica can survive in extreme droughts. In addition, the soil moisture content was analyzed after the rainy season in October 2020 and the dry season in June 2021. We found that under the influence of an extreme seasonal drought in the study area, the soil layer below 180 cm in depth still maintained high water content of more than 2%; the dry sandy soil in the surface layer inhibited the loss of soil water below 180 cm. The maximum water uptake depth of the roots of adult Artemisia ordosica can reach 240–260 cm. In periods of drought, Artemisia ordosica can still maintain life by absorbing deep soil water. In drought-prone environments, Artemisia ordosica evolved a deeper vertical root system to survive dry periods by absorbing soil water from deeper layers, showing a broad water intake capacity and strong adaptability to arid environments. This study can provide a reference for afforestation projects and ecological restoration in Mu Us sandy land and also provide a reference for the ecological restoration of coal mining areas in this area.

1. Introduction

The eastern margin of Mu Us sandy land has an annual output of hundreds of millions of tons of coal, causing it to be an important coal production area in China. Coal mining poses a threat to the fragile local ecological environment. The study of water use patterns of plants in this region is of great significance for coal mining and the ecological restoration of coal mining subsidence areas.
The eastern margin of Mu Us sandy land belongs to a moderate desertification area [1], but its annual precipitation is about 400 mm, which can theoretically provide water for vegetation growth. However, in the semi-arid Mu Us sandy land, most of the precipitation occurs in the form of summer rainstorms and the short and rapid precipitation flows away quickly along the gully in the form of flooding. At the same time, the deep gully drains the groundwater in the formation, resulting in extensive, deep groundwater in the region. The aeolian sand covered by the land surface has good water permeability and poor water holding capacity, so it is difficult to store more water [2]. Therefore, drought occurs frequently in this area and water resources are the short board, restricting the growth and development of plants. However, xerophytes represented by Artemisia ordosica thrive here, especially in the eastern margin of Mu Us sandy land. With gully development, Artemisia ordosica has become the most widely distributed plant. In the study area, a long-term seasonal drought often occurs in spring. In a very harsh environment, Artemisia ordosica can still grow and reproduce normally and fix the sand dune [3], so it is called the “pioneer of sand control.” This led us to wonder how plants in the region absorb and use water under extreme drought conditions.
In arid and semi-arid environments, water resources become a constraint for plant survival. Plants often adapt to the environment and develop deep roots to obtain more water and nutrients [4,5,6,7,8,9]. At the same time, deeper root growth means that more biomass of the plants lies underground, occupying more ecological niches and having more survival opportunities [10,11,12,13]. In addition, the presence of deep roots can cause plants to be more adaptable in response to climate change and interspecific competition [14,15,16,17,18]. In the global hydrological cycle, plant water transpiration is an important link in the soil–plant–atmosphere hydrological cycle [19] and plant-root depth is also an important parameter of the SVAT model [20]. In addition, root depth is also an important parameter for calculating deep soil water seepage and calculating the intensity and duration of precipitation replenishing groundwater [21].
For plants in arid and semi-arid regions, deep root research is of great significance. However, due to the complexity and concealability of deep root research, there are not many studies on deep roots of plants at present. The traditional method of studying root depth is excavation technology, even using explosives to excavate plant roots [22]. Artificial excavation of trenches [20] and drilling of soil are the most commonly used excavation methods [23]. The ground penetrating radar, which has been gradually emerging in recent years, can also detect plant root density nondestructively and reliably [24,25]. However, the existence of other plant roots and dead roots will bias the results of this method. In the past 20 years, water stable isotopes (18O and 2H) have rapidly risen as new methods to track the near-surface hydrological cycle [26,27,28,29,30]. Water stable isotopes are considered to be the best tracers for tracing complex hydrological processes in the vadose zone due to their stability and reliability [28]. Water stable isotope evidence can directly link the process of water cycling among soil, plants, and the atmosphere [31,32,33] and can also show the active proportions of plant roots in different soil layers [34]. Water stable isotope tracing technology can reveal the infiltration, evaporation, transpiration, and interception of water in vadose zone [26,29,34]. Water stable isotope fractionation and enrichment in different environments is the basis of the water stable isotope technique. The water in the soil can be buried at very different depths, due to great differences in the environment. The different depths of soil water stable isotopes can be due to natural differences or artificial tracers checking in the soil water gradient difference by stable isotopes. Such man-made or natural differences provide a material basis for studying the water use strategies of plants. By using these differences, the water use strategies of plants in different species, regions, and seasons are revealed [35,36,37,38,39,40]. Because the vadose zone is an important source of plant water in the arid region, understanding the range of plant water sources in the arid region is of great significance for studying the water cycle process and soil-vegetation-atmosphere exchange process in the arid region. At the same time, it is important to understand the adaptive evolution of plants to arid areas and the niche differentiation of plants in arid areas to study the sources of water absorption of plants and the process of soil water change in arid areas.
In this study, depth-controlled deuterium labeling was used to study the water absorption depths of roots of representative plants, Artemisia ordosica, in the eastern margin of Mu Us sandy land in October, when a drought began. The deuterium tracer (2H2O) was used to label soil at different depths and the 2H signals of plant branch xylem water were compared to determine whether the depth of plant root growth reached the labeled layer. Combined with the soil moisture content in drought and rain, the significance of the root distribution characteristics of Artemisia ordosica in a semi-arid climate and its adaptability to live in an arid environment are discussed. This study provides a decision-making basis for the desert greening project and effective utilization of plant resources in eastern Mu Us sandy land, which is of great significance for promoting ecological sustainable development in Mu Us sandy land. This study also provides reference significance for coal loss reduction mining and the ecological restoration project of coal mining subsidence on the eastern margin of Mu Us sandy land.

2. Materials and Methods
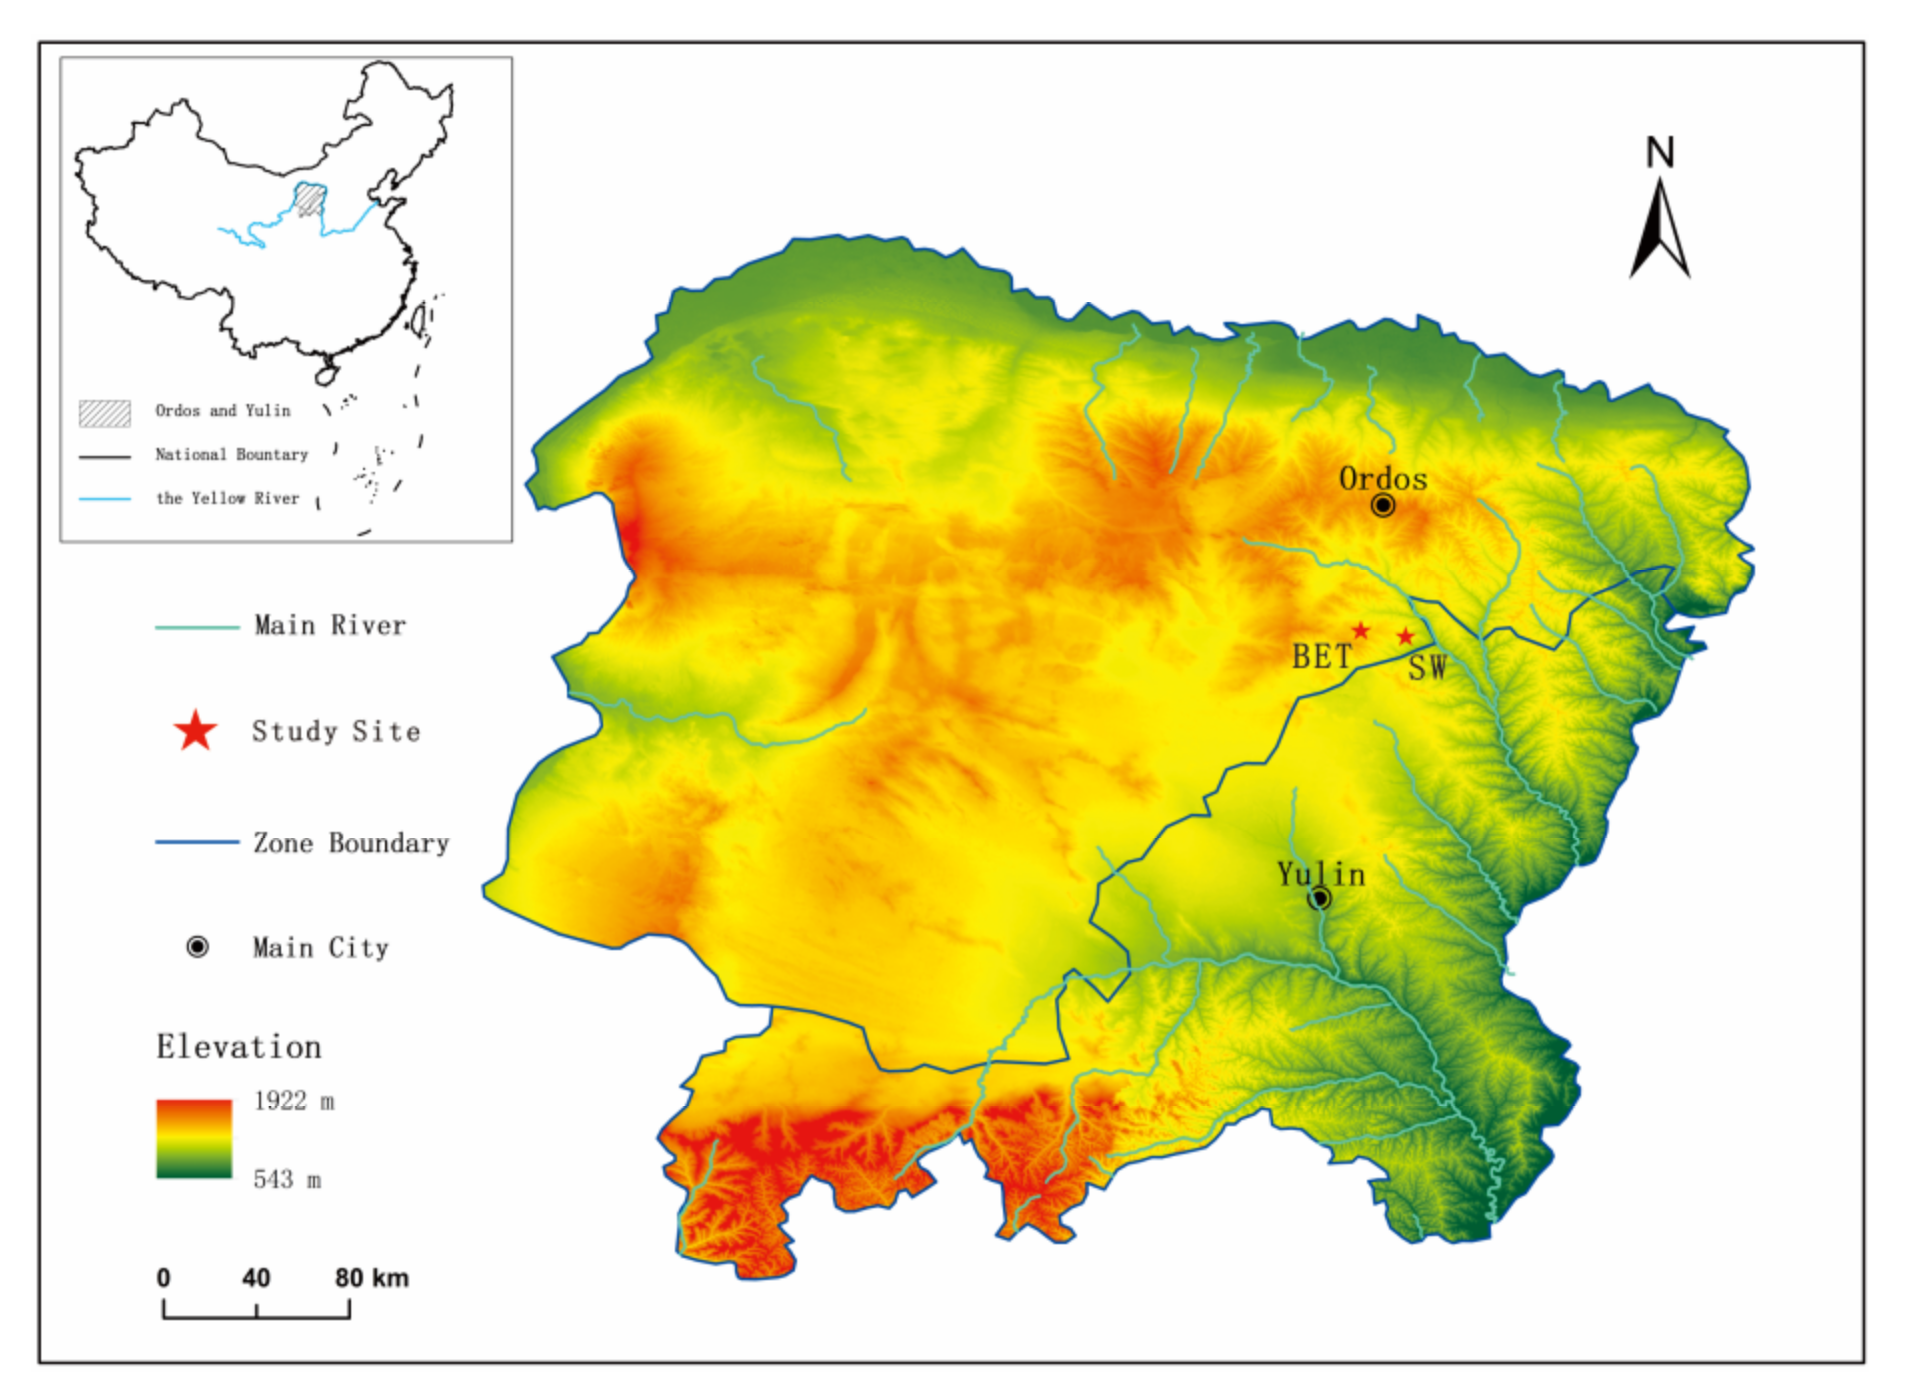
2.1. Study Area

The Mu Us Desert (36°48′–40°12′ N, 106°10′–111°53′ E) spans the Yulin City of the Shaanxi Province and Ordos City of the Inner Mongolia Autonomous Region and a small area in the west belongs to the Ningxia Hui Autonomous Region, forming a total area of 42,200 square kilometers. The Mu Us Desert is located in the central and southern parts of the Ordos Plateau and is an important geomorphic unit of the Ordos Plateau. It is also located at the edge of the monsoon region in eastern China. Due to its special geographical location, the Mu Us sandy land has become a multi-level ecological transition zone, which is in the transition zone from a semi-humid area to an arid and semi-arid area. The annual average temperature is 6.0–8.5 °C and the annual average precipitation drops from 480 mm to 250 mm from east to west. About 80% of the precipitation is concentrated from June to September, which is mainly brief and high-intensity precipitation. The average annual wind speed is 2.9 m/s; there are strong winds from March to June. The maximum wind speed is more than 17 m/s. The annual average surface evaporation is more than 2000 mm. Droughts occur frequently in the region, especially from February to May. The study area is located on the eastern edge of the Mu Us sandy land, which is the outflow area of the Mu Us sandy land. The surface of the area is mostly covered by aeolian sand. Gullies have developed and light-yellow chestnut soil can be seen under the aeolian sand layer. Due to more annual precipitation and relatively developed vegetation in this area, poplars, salix, and sea-buckthorn are mostly grown in river valleys. Caragana korshinskii and Salix psammophila are also present, but a large number of fixed and semi-fixed dunes and Artemisia ordosica are the most widely distributed plants [41]. In this study, two relatively flat semi-fixed dunes, SW (39°16′32″ E, 110°5′53″) and BET (39°25′12″ E, 109°58′41″), were selected in the south of the Ejin Horo Banner of Ordos City as test sites (Figure 1). The terrain of the two places is relatively high and flat and the thickness of aeolian sand layer was large. Artemisia ordosica is widespread on the surface.

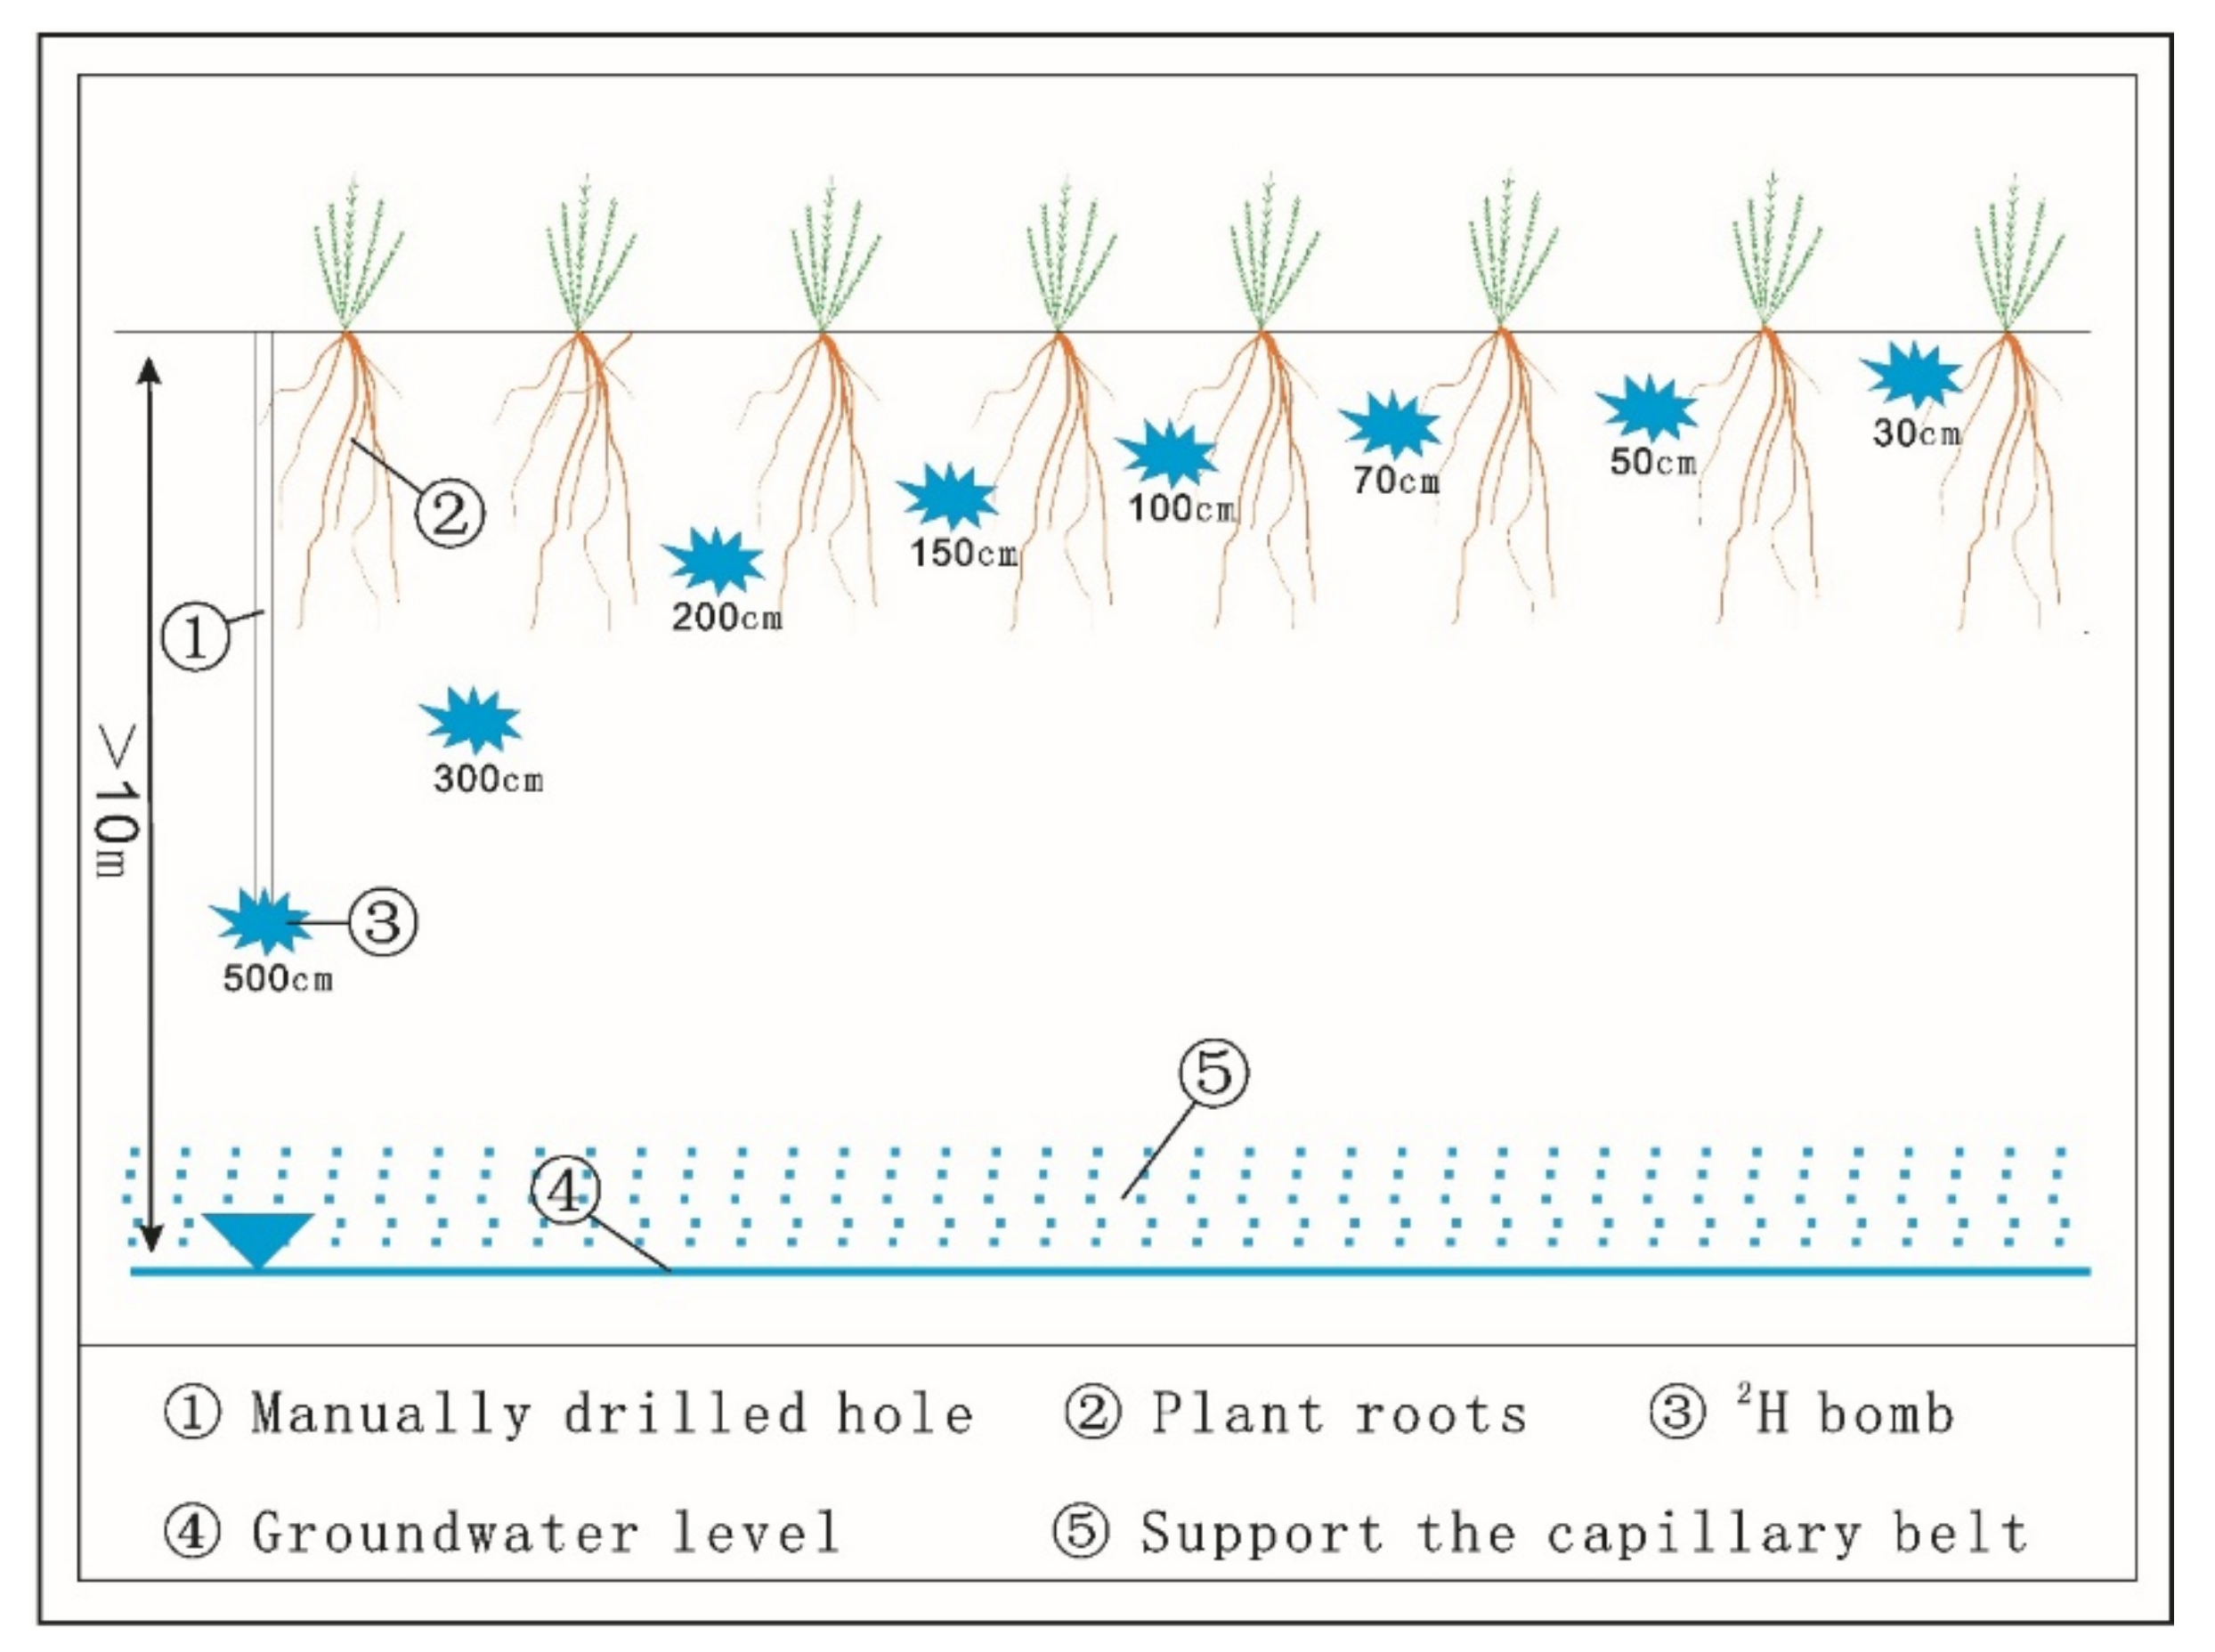
2.2. Experimental Design and Sample Collection

The meteorological data of the eastern margin of Mu Us sandy land were investigated and analyzed, including daily average temperature, daily maximum temperature, daily minimum temperature, sunshine duration, daily average pressure, daily average relative humidity, daily average wind speed at 2 m height, and precipitation data of the last 12 years. All the data were provided by the China Meteorological Science Data Center (http://www.data.cma.cn/, accessed on 8 May 2022).
Eight adult Artemisia ordosica plants similar in size (height 70 ± 5 cm, crown width 105 ± 10 cm) were selected at SW and BET sites. In order to avoid the interaction of deuterium tracers (2H2O), each plant was spaced at least 100 m apart. In relatively flat aeolian sand areas, it would be almost impossible for soil water to move horizontally at 100 m during the study period (7 days). Before the experiment, the selected plants were sampled for three consecutive days (from 1 October 2020 to 3 October 2020). In order to avoid 2H enrichment caused by plant transpiration, the sampling time was from 6:00 to 8:00 in the morning every day [42]. One branch of Artemisia ordosica was selected each time and the leaves and phloem were removed and the plant samples were cut into 3–4 cm segments. We immediately put them into glass bottles and sealed them with sealing film. After capping the bottles, we stored them in field sampling boxes at 4 °C and stored them in freezers at −20 °C after returning to the laboratory. On 3 October 2020, two sampling holes with a depth of 500 cm were drilled with a hand drill with a bit diameter of 5.5 cm at two randomly selected points in each experimental site and 200 g of soil samples were collected every 20 cm in depth. The soil samples were divided into two parts, one for the extraction of soil water and the other for the determination of soil moisture content. They were stored in 250 mL polyethylene plastic bottles and sealed with sealing film. After capping the bottles, they were stored in the field sampling box at 4 °C and stored in a freezer at −20 °C after returning to the laboratory.
According to the preliminary investigation, Artemisia ordosica is a xerophytic plant with straight roots. The roots are extremely developed in the vertical direction, but the expansion range is not large in the horizontal plane [43]. In order to avoid deviation between the soil marked by deuterium tracer and the rooting range of Artemisia ordosica, a hand drill with a bit diameter of 5.5 cm was used to drill holes with depths of 30, 50, 70, 100, 150, 200, 300, and 500 cm, 10 cm away from the selected Artemisia ordosica plants (Figure 2). All the soil samples removed during drilling were placed in sequential core boxes and covered with plastic film to prevent soil moisture loss. The deuterium tracer was 15% abundant and was formulated from 99.9% deuterium water and pure water. The abundance of deuterium tracers in this study was 1000 times higher than the natural abundance of deuterium, which is about 0.015%, ensuring our system is sufficient to mark both the high deuterium areas in the soil and the water transport process in plants. The plan was to inject 1 L of deuterium tracer at the bottom of each borehole. The configured deuterium tracer was injected into a balloon every 250 mL. The balloon’s mouth was completely closed, the water on the surface of the balloon was dried, the four balloons were put into the borehole, and then a long rod with sharp spikes was used to puncture them (Figure 2). This tracer placement method can effectively avoid the contamination of the tracer on the surface soil and the borehole wall [31]. After the deuterium tracer fully infiltrated the bottom of the borehole, the soil extracted from the borehole was introduced into the borehole in sequence, and the soil was compacted every 1 m.
The deuterium tracers were placed in the soil at the specified depth and the labeled Artemisia ordosica plants were sampled for 7 consecutive days starting from the next day (from 5 October 2020 to 11 October 2020). In order to avoid 2H enrichment caused by plant transpiration, one branch of Artemisia ordosica was selected at 6:00–8:00 in the morning every day and the leaves and phloem were removed. The plant samples were cut into 3–4 cm pieces, immediately put into glass bottles, and then sealed with sealing film. After capping the bottles, they were stored in field sampling boxes at 4 °C and stored in freezers at −20 °C after returning to the laboratory.
After the dry season on 8 June 2021, we used a hand drill to drill a 480 cm deep hole at the SW test site and BET test site, one meter from the borehole where soil samples were collected on 3 October 2020 (the hand drill could not continue drilling after the borehole reached 480 cm) and 100 g soil samples were collected every 20 cm. The soil samples were divided into two parts. The jars were sealed with 250 mL polyethylene plastic film. The moisture content was determined after the samples were brought back to the laboratory.

2.3. Sample Processing

A total of 160 plant samples and 450 soil samples were collected for 2H detection. The water in plant and soil samples was extracted using an automatic vacuum condensation extraction system (LI-2100, LICA, Beijing, China) in the laboratory; the water extraction rate of soil and plants using this method is >98%. All the extracted water samples were analyzed using deuterium isotope mass spectrometry (MAT 253 Plus, Thermo Scientific, Waltham, MA, USA). The measured values of δ2H were expressed in thousandths relative to the Vienna Standard Mean Ocean Water (VSMOW) as in Equation (1):
δ 2 H = R sample R standard 1 × 1000
where RSample is the ratio (2H/1H) of the less abundant isotope to the more abundant isotope in the sample, and RStandard is the ratio (2H/1H) in a standard solution.

2.4. Data Analysis

The 2H values of Artemisia ordosica samples collected before the deuterium labeling tests and soil profile samples were used as background values. In order to analyze the transport of 2H in Artemisia ordosica and the diffusion of 2H in the soil, we needed to find a criterion to determine whether 2H is present. We set the sum of four standard deviations of the 2H maximum and 2H background value of Artemisia ordosica as the standards to determine the existence of deuterium tracer (2H2O) in Artemisia ordosica and used δ2H = 100 as the standard to determine the existence of deuterium tracer (2H2O) in the soil [31]. When the δ2H value of the sample was greater than this standard, it was believed that the deuterium tracer (2H2O) was transferred to the location of the sample.

3. Results

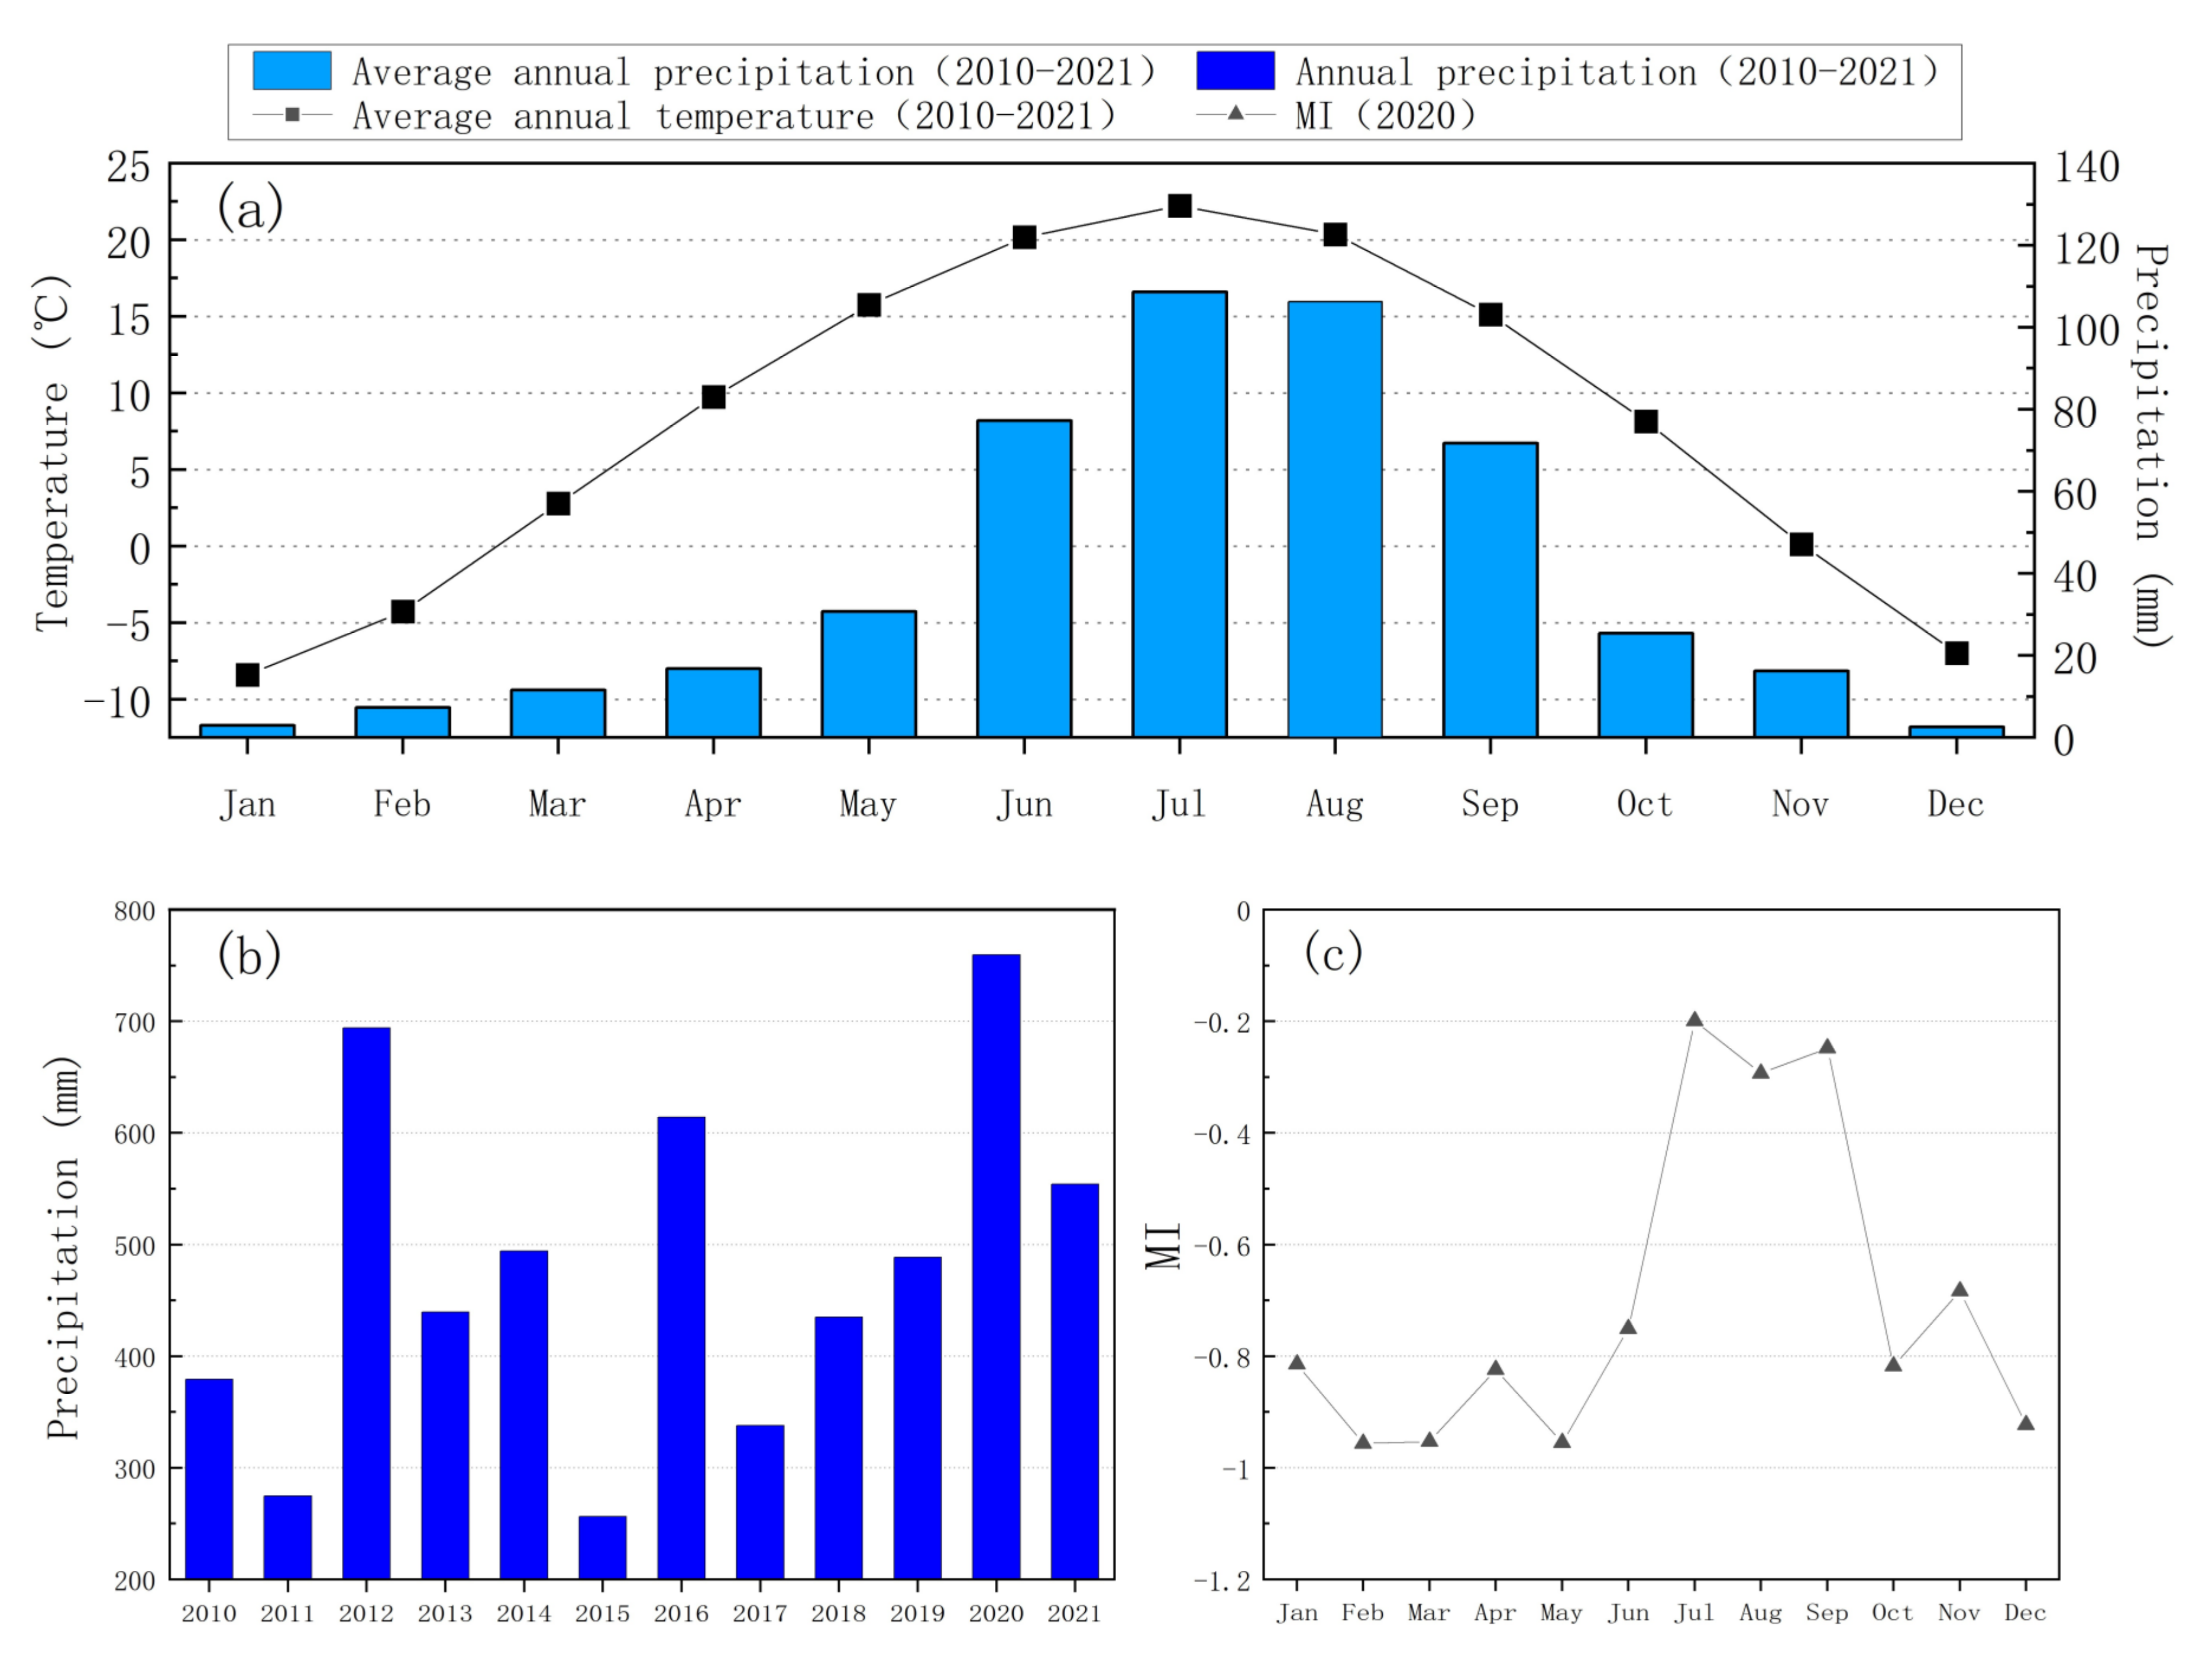
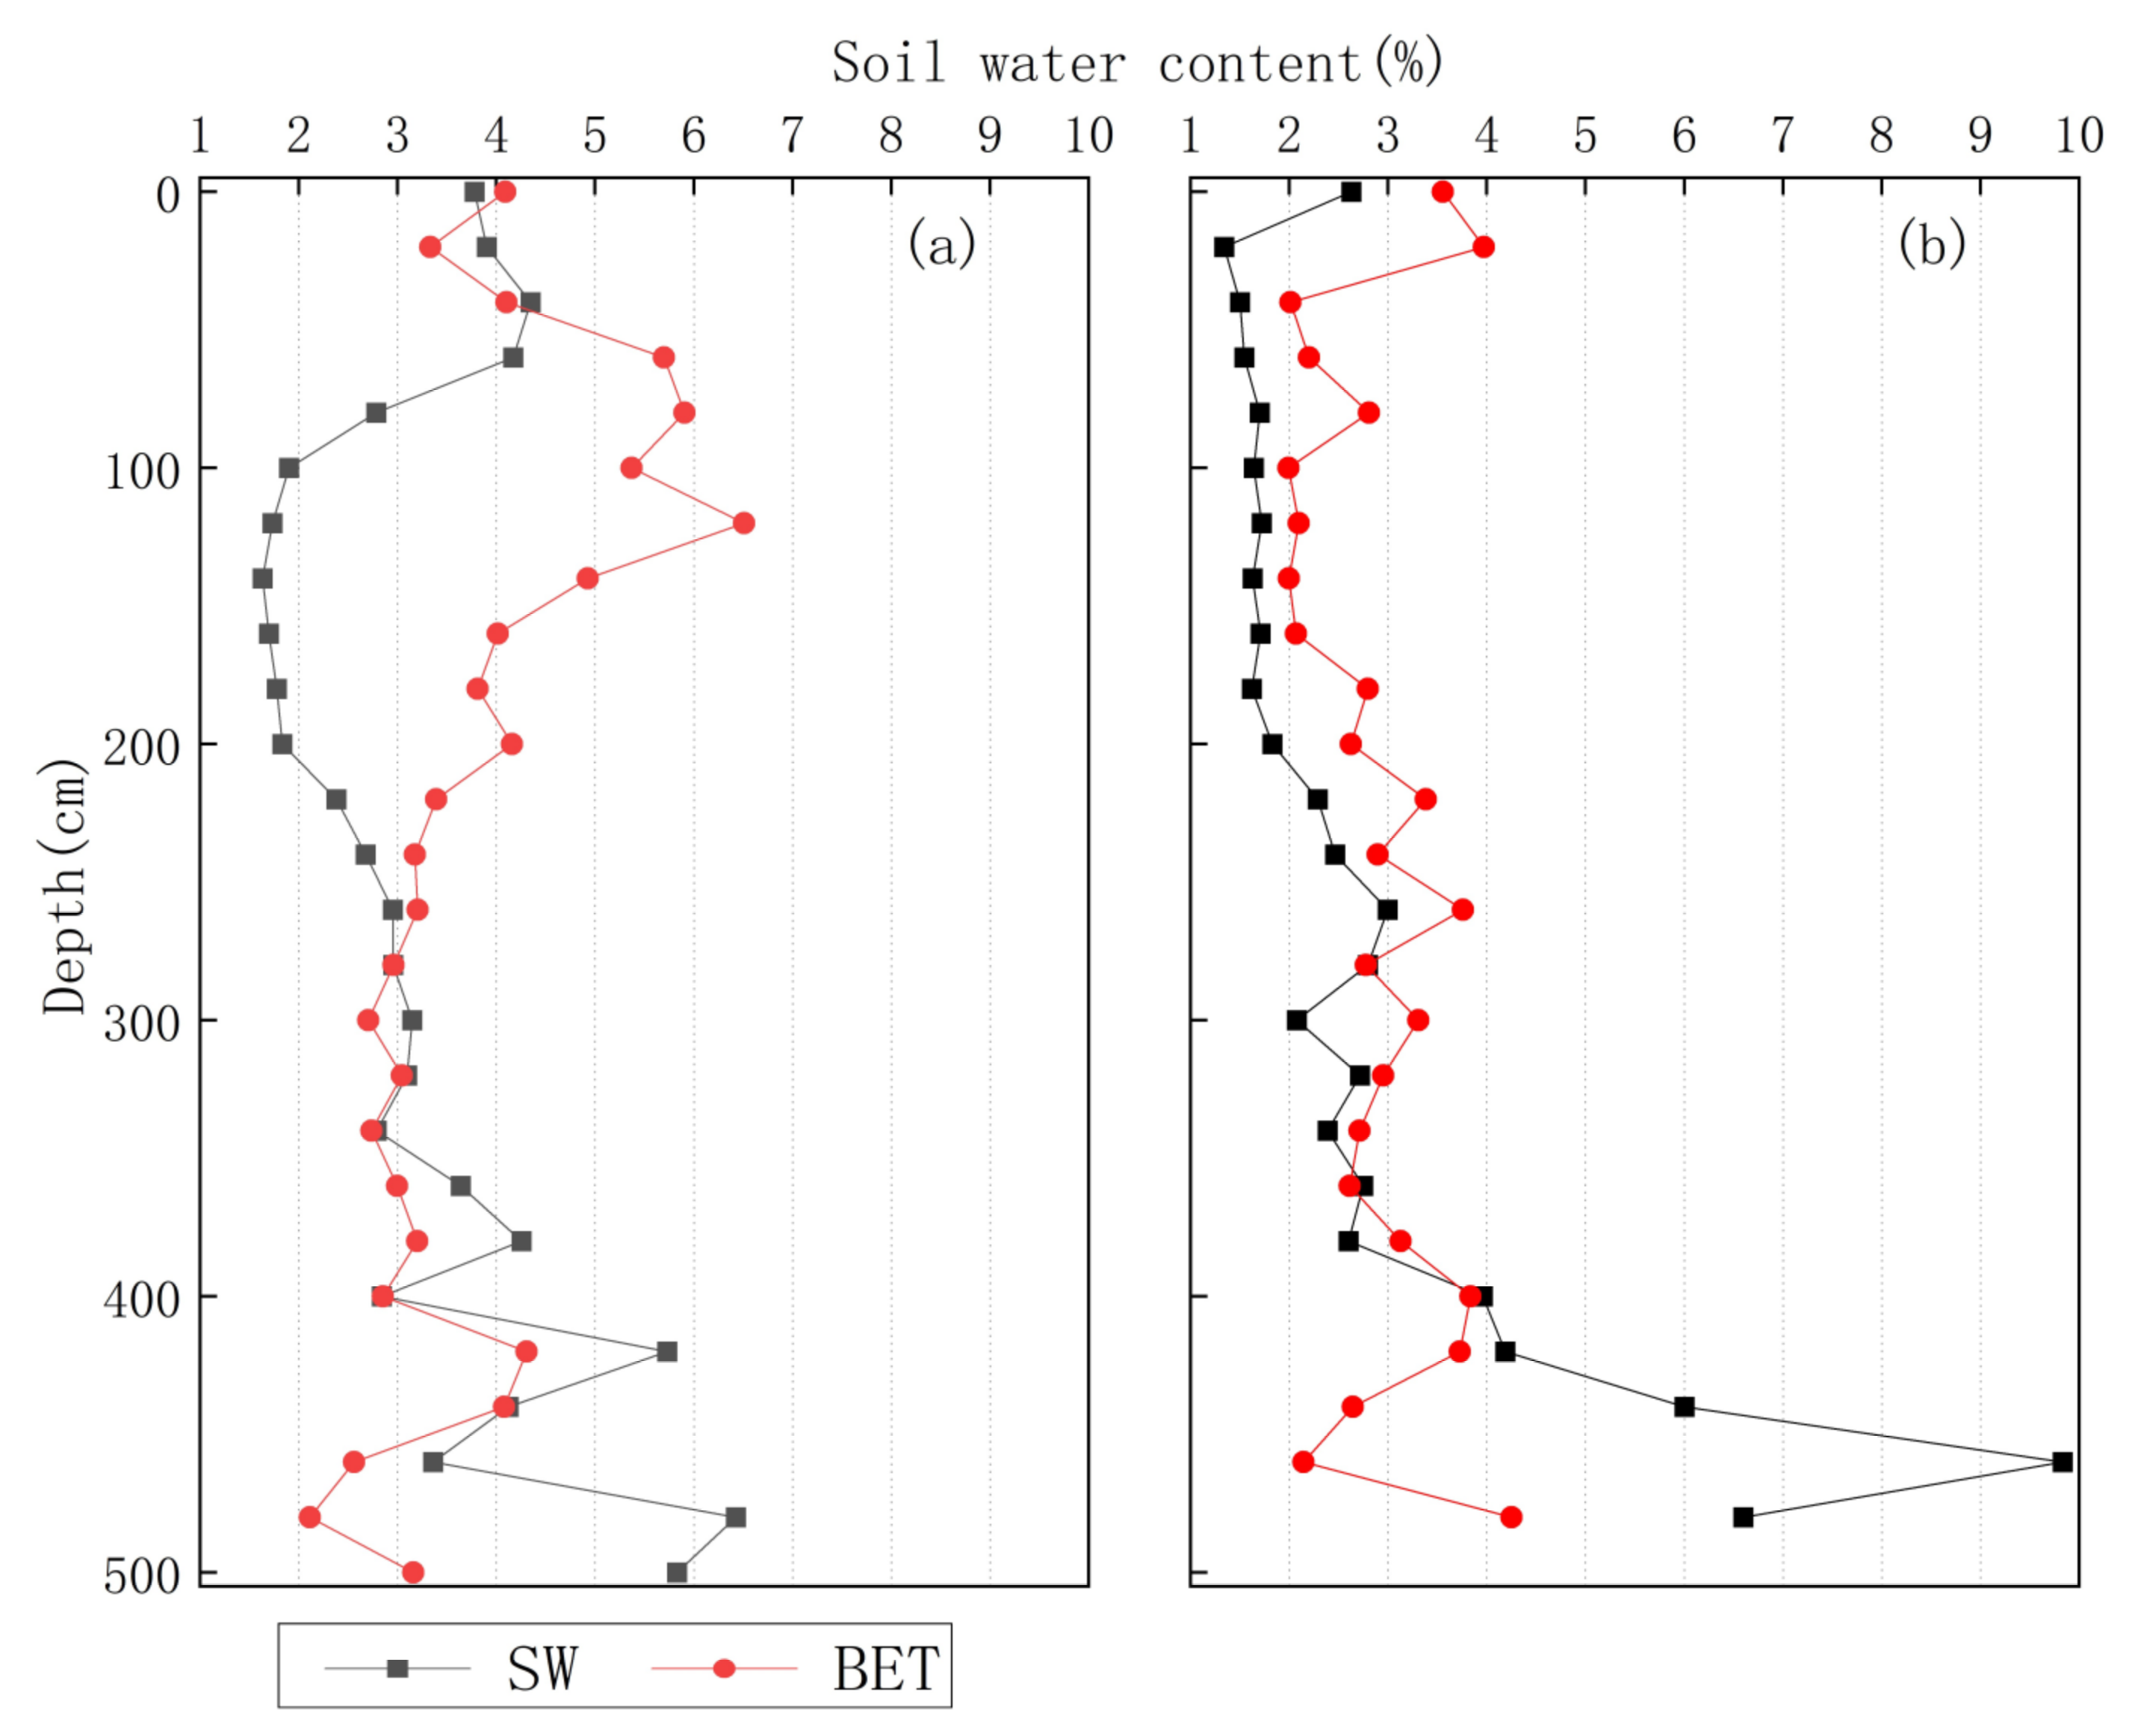
3.1. Precipitation and Soil Water

The arithmetic mean of precipitation in the study area is 477 mm (2010–2021), but the annual precipitation varies greatly; the maximum precipitation was 759.6 mm and the minimum precipitation was 256.4 mm in the past six years. The standard deviation of annual precipitation is 151 mm (Figure 3a). The seasonal variation of precipitation is large and precipitation is mostly concentrated in the summer (Figure 3b). Using the relative humidity index recommended by China’s National Standard “Meteorological Drought Grade” (GB/T20481-2017) [44], the variation characteristics of dry and wet conditions in the study area in 2020 were quantitatively analyzed:
M I = P P E P E
where MI is the relative humidity index, P is the precipitation in a certain time period (mm), and PET is the potential evapotranspiration in a certain time period (mm). The PET was calculated using the FAO Penman-Monteith method. According to the criteria in Table 1, February, March, and May of 2020 are classified as mega drought; January, April, and October are classified as serious drought; and June and November are classified as moderate drought (Figure 3c).
Three soil profiles with a depth of 500 cm were collected at the test site and the soil moisture content of the test site was studied using the drying method. We thought that the arithmetic mean of the moisture content of the three profiles could represent the soil moisture content of the test site. After the rainy season in October 2020, the average moisture content of the SW soil profile was 3.3% and that of the BET soil profile was 3.78%. In June 2021, after a dry season, the average moisture content of the SW site soil profile was 2.9% and that of the BET site soil profile was 2.89%. Climatic drought reduced the mean moisture content of the SW site and BET site soil profiles by 12% and 23.5%, respectively (Figure 4). As shown in Figure 4a, the soil profile moisture content on 3 October 2020 was characterized by high water content in the shallow layer, low water content in the middle layer, and high water content in the deep layer. After the rainy season, the near-surface soil moisture content of the two test sites was higher due to the influence of precipitation. The moisture content of the SW site decreased rapidly from 60 to 100 cm depth, was very low from 100 to 200 cm depth, and slowly increased from 200 to 300 cm depth. The water content of the BET site decreased from 120 cm depth to 300 cm depth. The water content of the deep soil (300–500 cm) in the two test sites fluctuated slowly and the overall water content was relatively high. As shown in Figure 4b, the overall soil profile moisture content on 8 June 2020 showed a slow increase from shallow to deep layers. The soil moisture content at the surface was slightly higher than elsewhere due to sporadic precipitation and the soil moisture content at the depth of 400–500 was high.

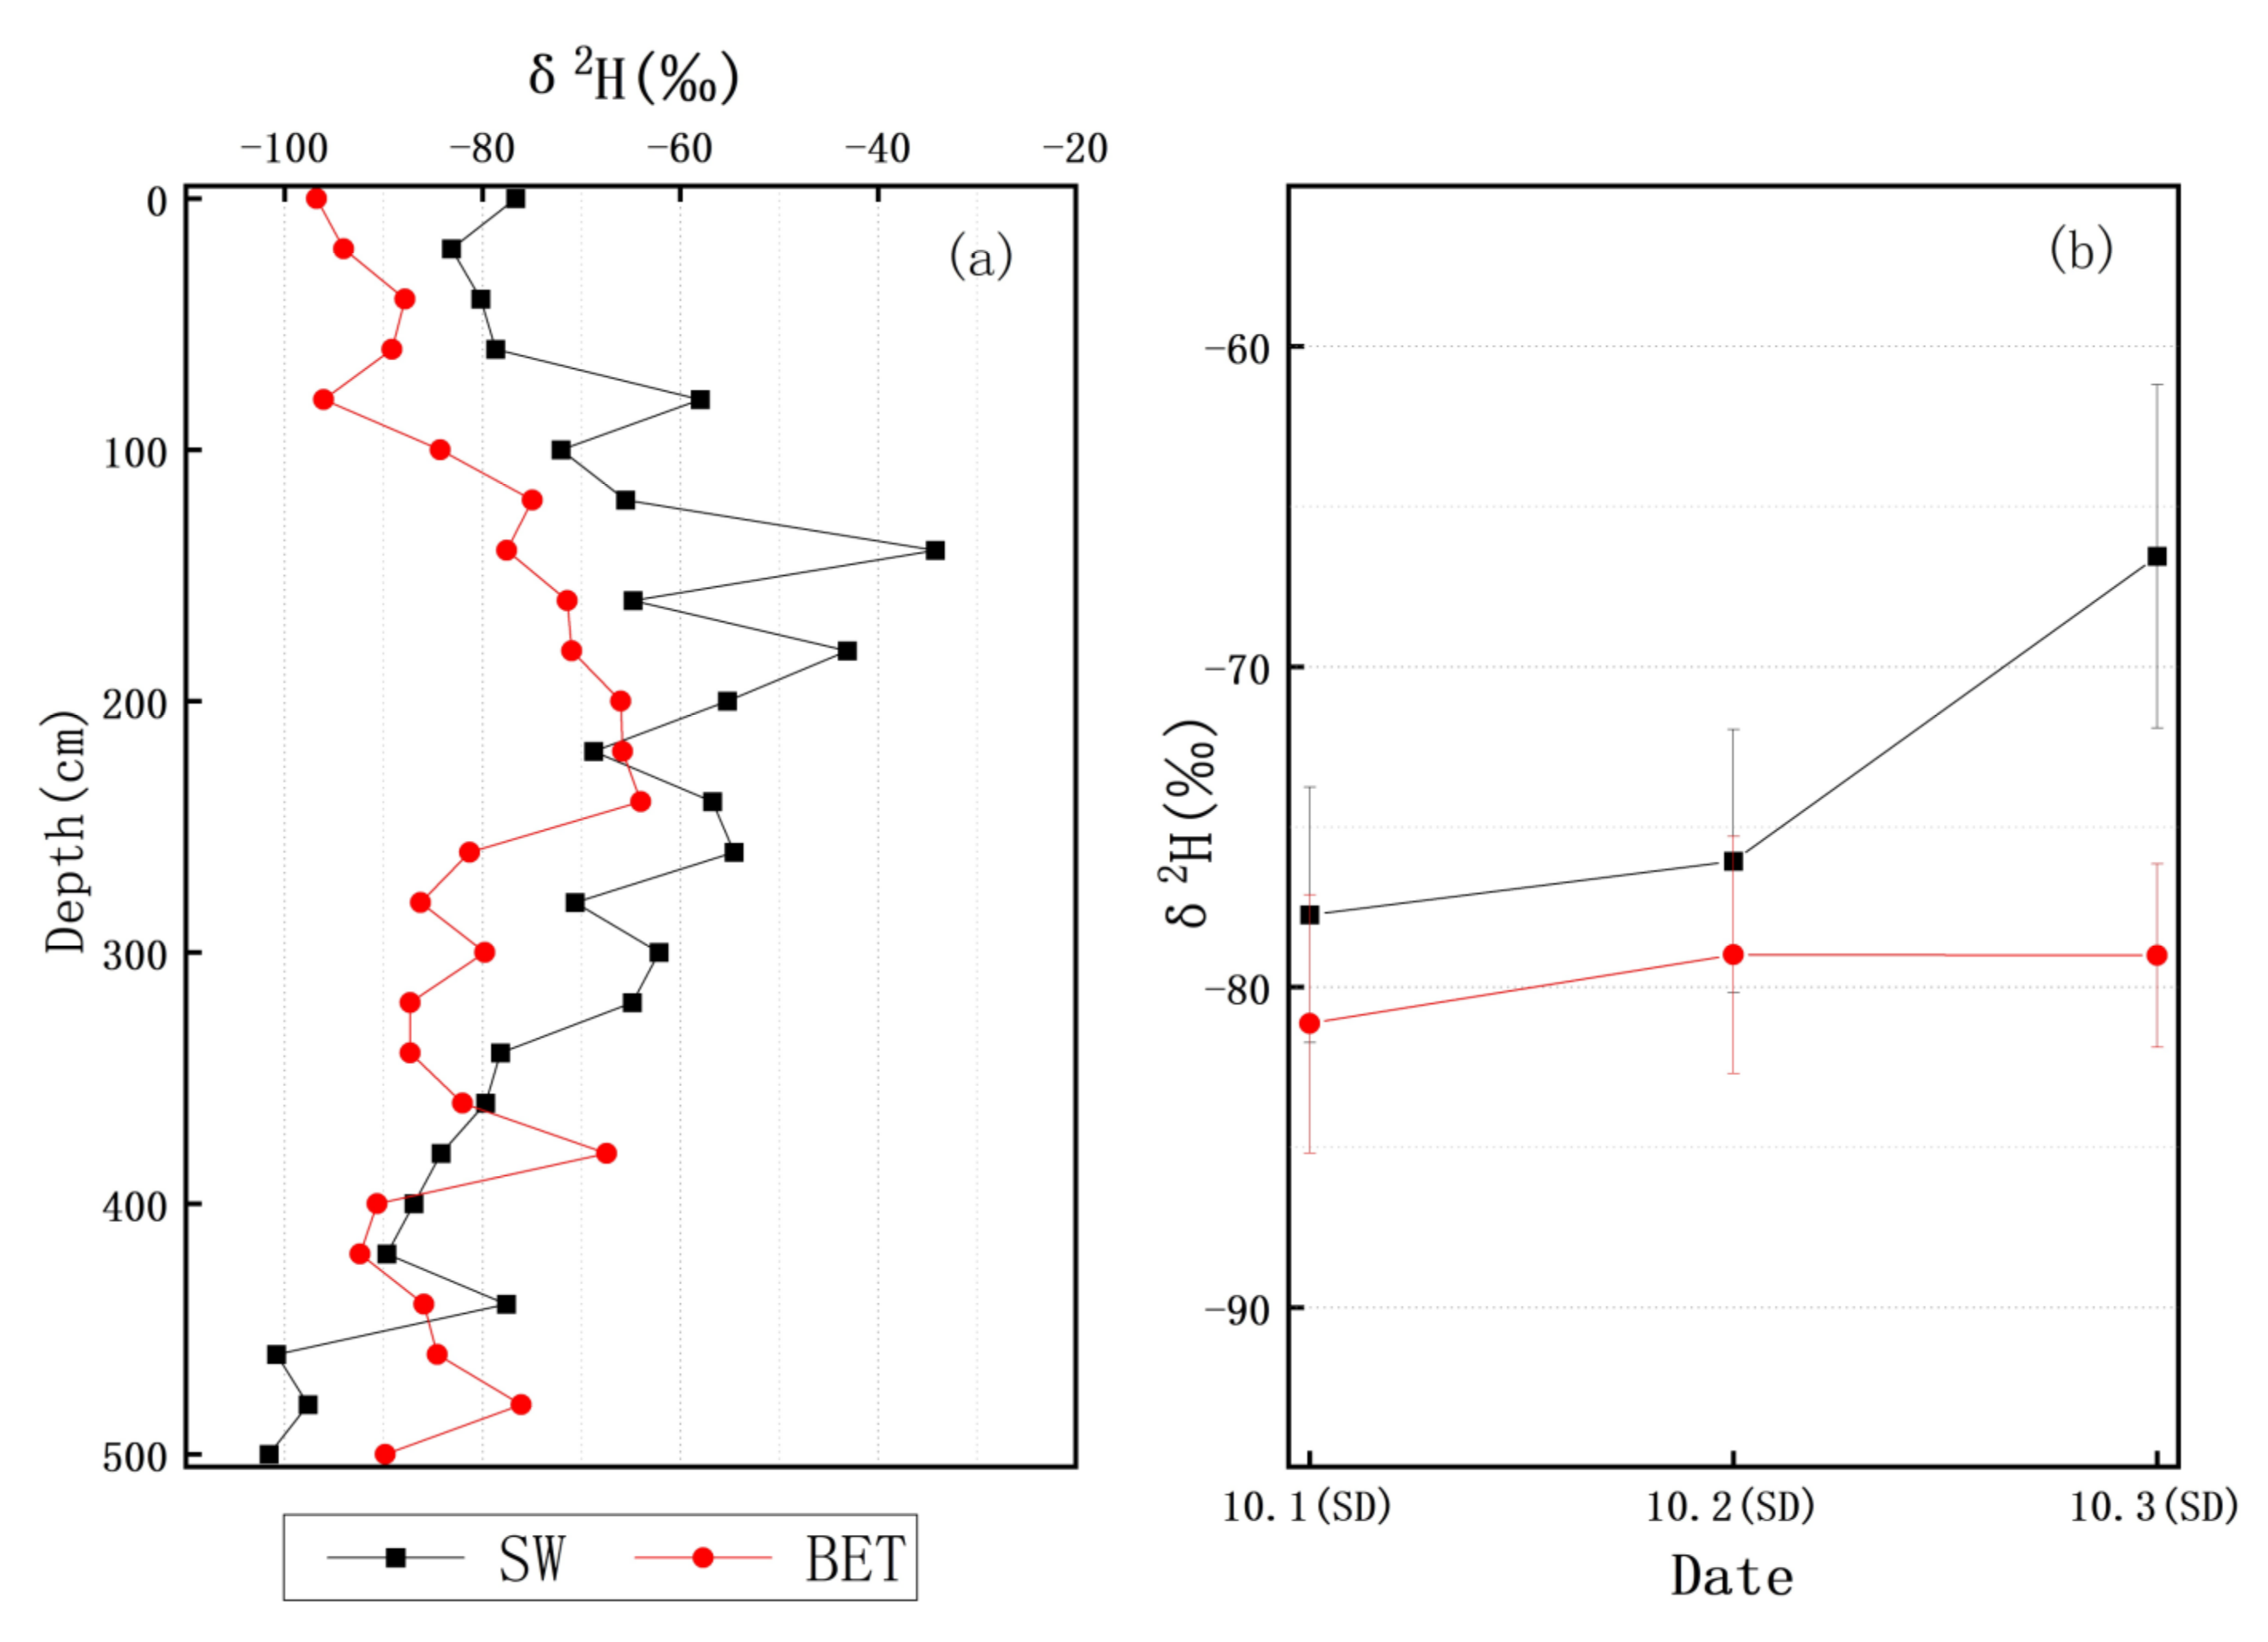
3.2. δ2H Background Values of Soil Water and Xylem Water

The δ2H background values of soil water at the BET and SW sites were derived from soil profiles collected in October 2020 at a depth of 500 cm. The BET and SW sites’ δ2H values had the same trend as the depth (Figure 5a). All first increased then decreased and a trend of local, obvious fluctuation was observed. This is because the near-surface soil moisture by evaporation caused the enrichment of 2H, but the rainy season’s concentrated rainfall produced rain and residual soil water mix and infiltrate. The soil moisture at 0–100 cm depth was basically replaced by external rain, presenting a small δ2H value, and the soil moisture at 100–300 cm depth was a mixture of precipitation and residual soil moisture. The δ2H fluctuated obviously in this section and showed an obvious trend of rising first and then decreasing. The maximum δ2H value of the BET soil water was −64‰, the minimum was −96.8‰, the average was 81.9‰, and the standard deviation was 9.59‰. The maximum δ2H value of the SW soil water was −34.2‰, the minimum was −101.57‰, the mean value was 72.5‰ and the standard deviation was 16.4‰. They were used as the background values for the deuterium labeling experiment and as references to determine whether Artemisia ordosica absorbed the deuterium tracer to improve the reliability of the experiment.
The δ2H background values of plant xylem water at BET and SW sites were derived from plant xylem collected before the tracer experiment in October 2020 and Figure 5b shows the arithmetic mean and error bars of these values. The δ2H values of water from SW and BET xylem water increased slightly with time and the overall variation was not large. The δ2H values of SW xylem water were slightly larger than those of the BET xylem water (Figure 5b), which might have been because the δ2H values of soil water from the SW site were larger than those of the BET site. The δ2H value of the BET xylem water varied from −59.3‰ to −83.6‰; the average value was −73.5‰, and the standard deviation was 6.5‰. Therefore, the standard for judging the uptake of deuterium tracer by Artemisia ordosica was δ2H = −33.3‰. The δ2H values of SW xylem water varied from −68.1‰ to 87.7‰. The average value was −78.1‰ and the standard deviation was 5.1‰. Therefore, the standard for determining the uptake of the deuterium tracer by Artemisia ordosica was δ2H = −47.7‰. When the δ2H of the xylem water of Artemisia ordosica was greater than −47.7‰, we believed that the roots of Artemisia ordosica had absorbed deuterium tracer.

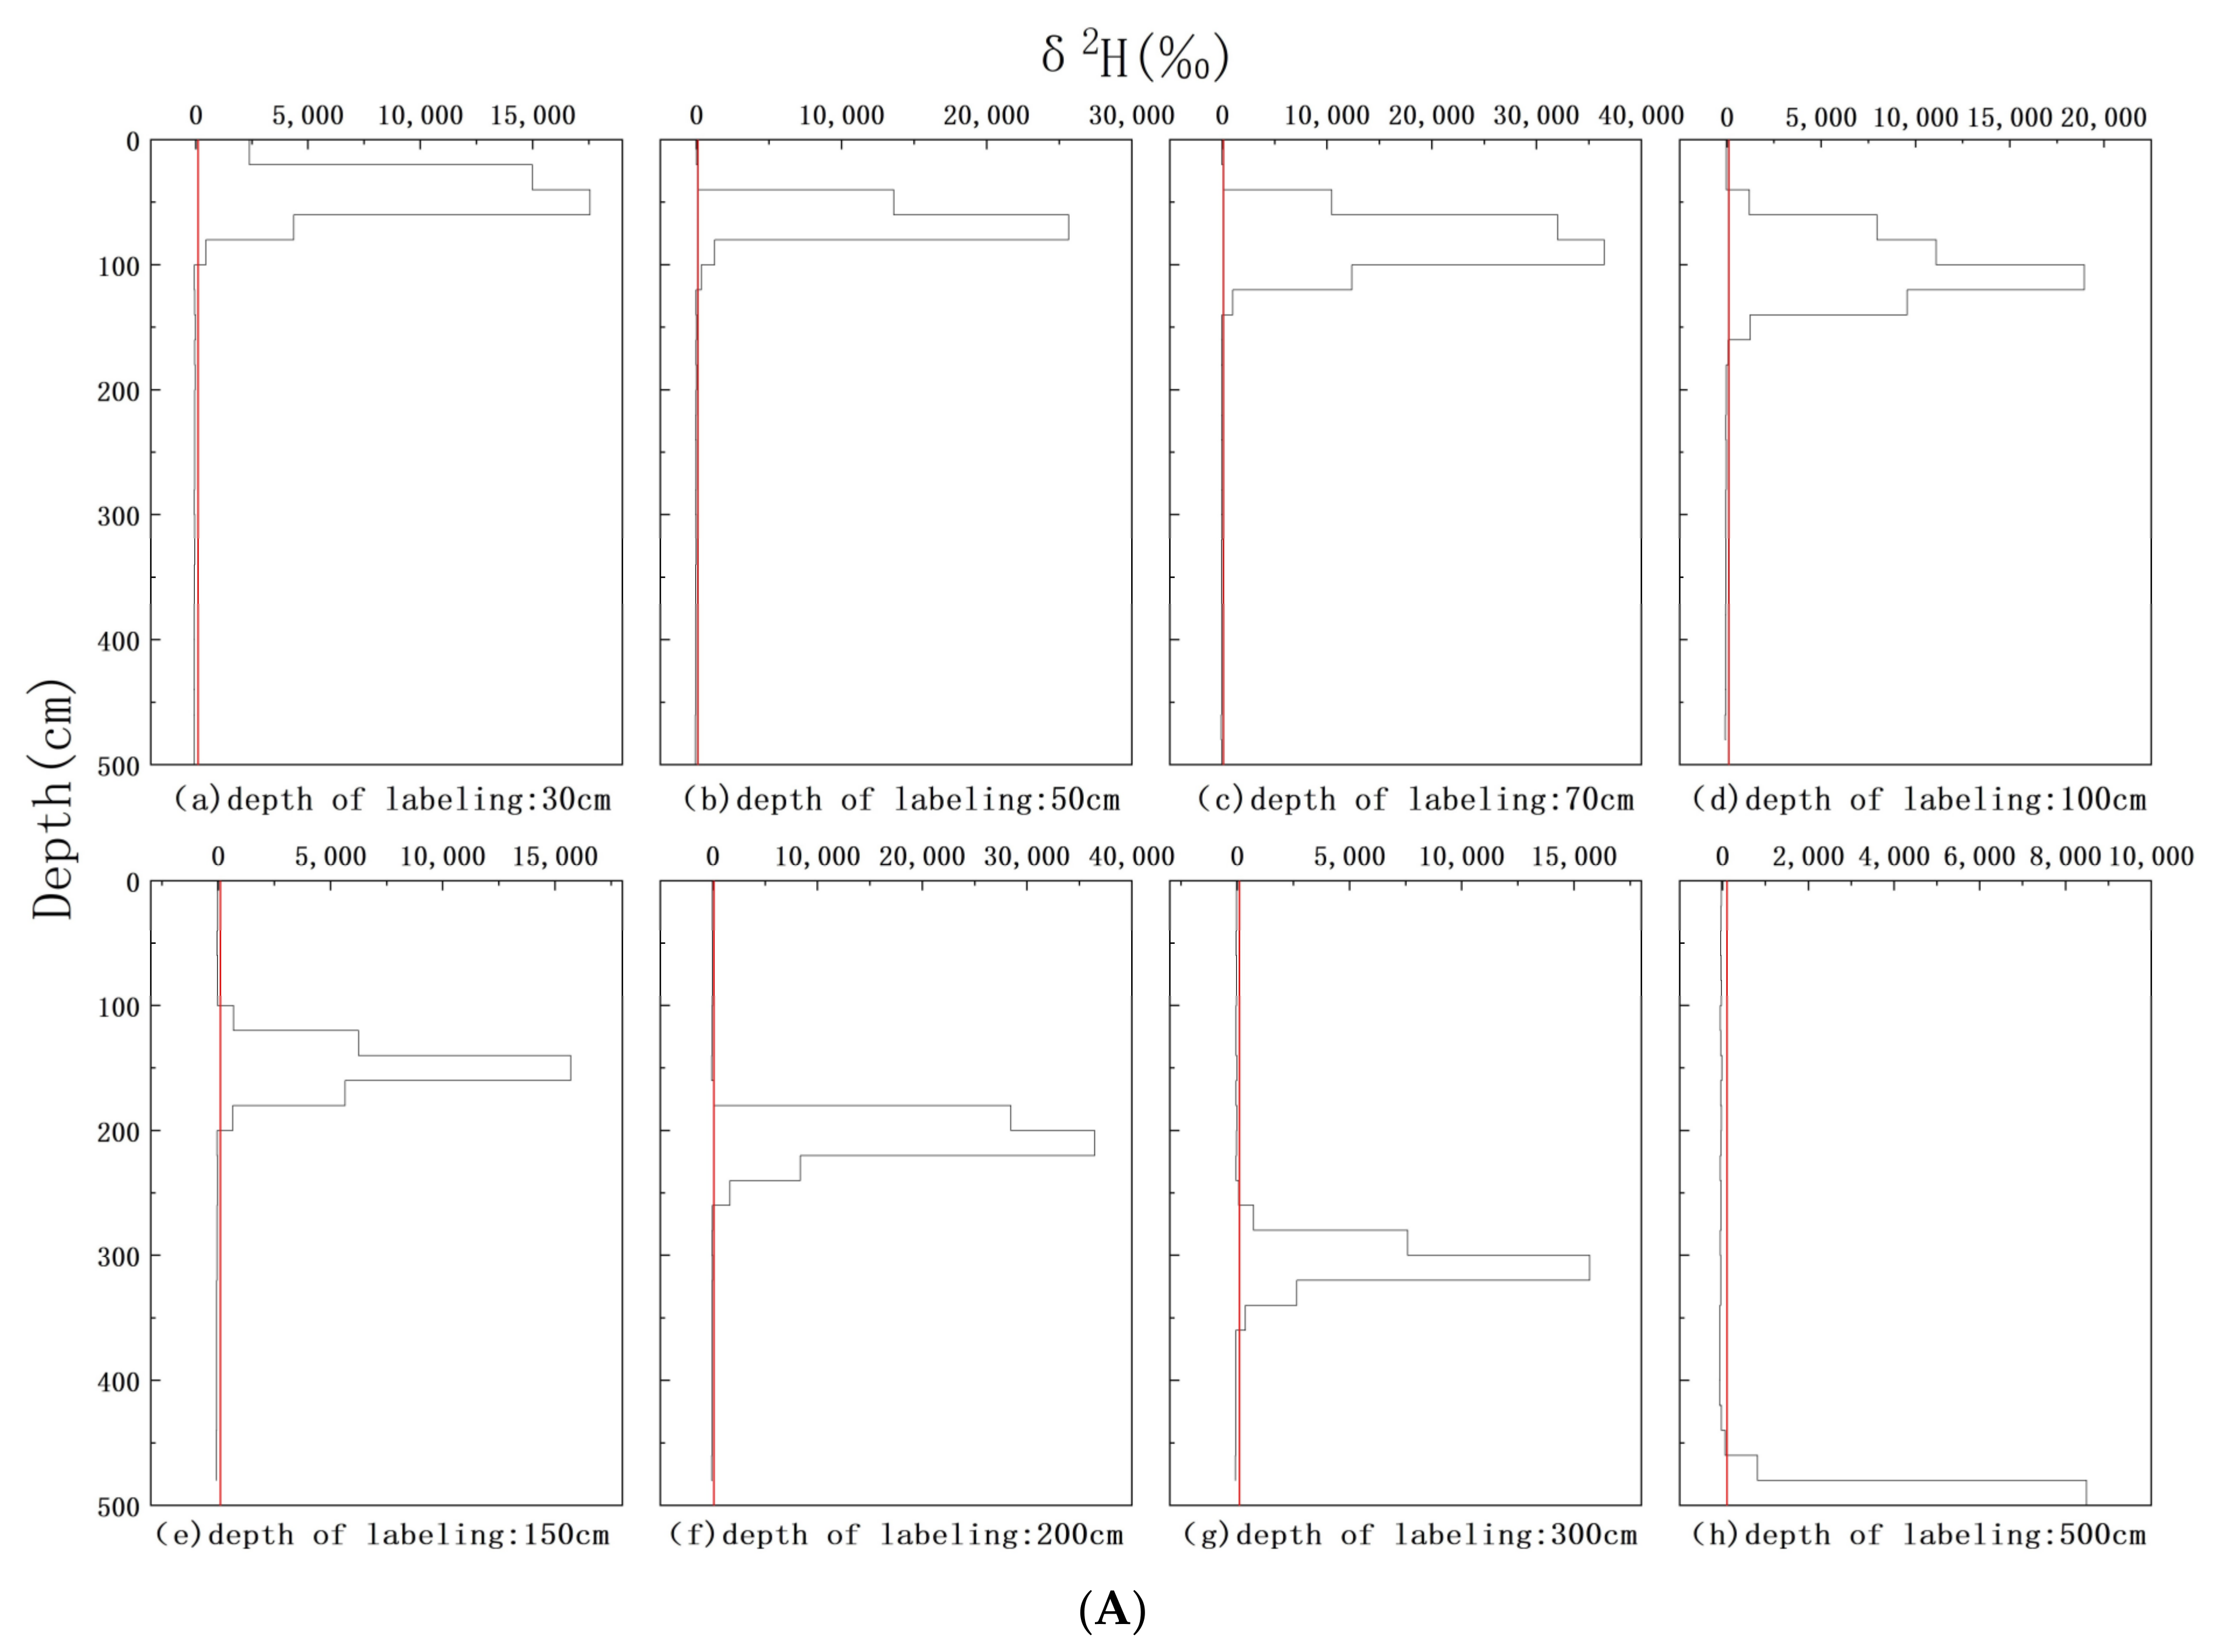
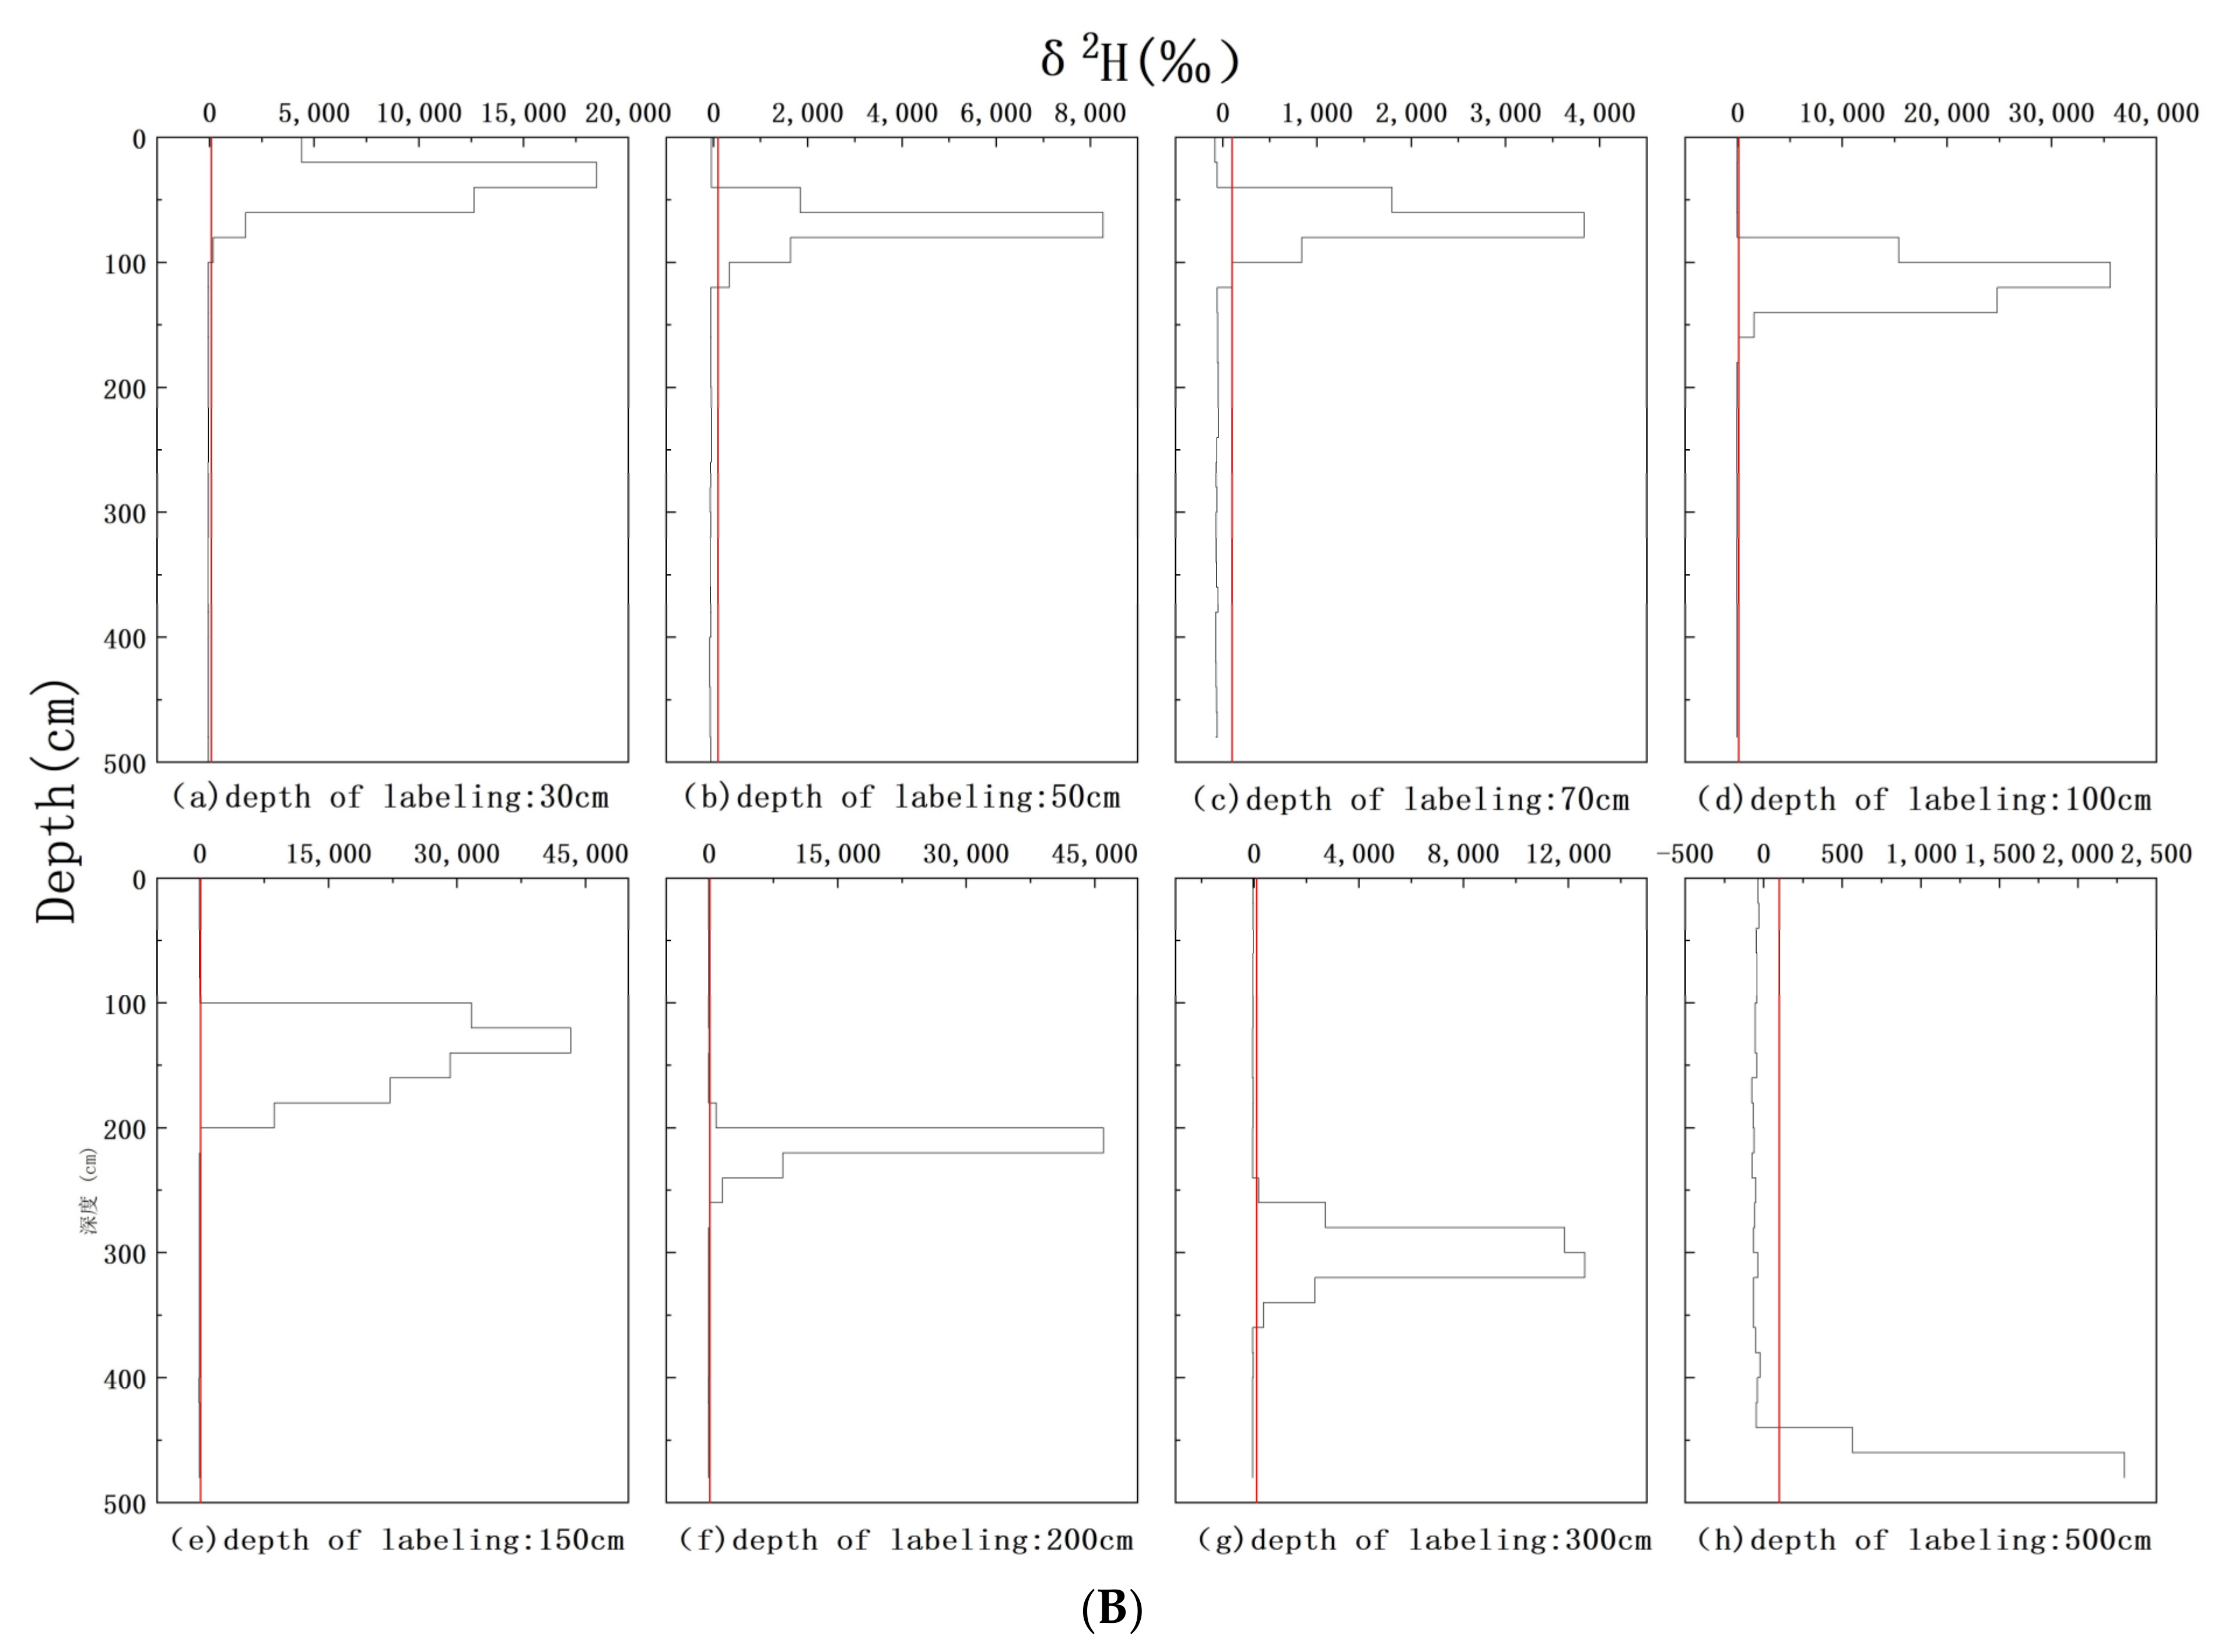
3.3. δ2H Characteristics of Soil Water

After the deuterium tracer is injected into a specific deep soil layer, the deuterium tracer will spread to a certain area in the soil layer due to the influence of gravity and the capillary effect. The determination of the vertical tracer range in the soil layer is decisive for studying the water uptake depth of the roots of Artemisia ordosica. We studied the deuterium tracer’s vertical distribution in the soil, as shown in Figure 6, Figure 6 shows the δ2H values of the soil profile collected after the tracer test. A deuterium tracer will slowly migrate in soil.
Deuterium tracers formed effective labeling peaks in the soil, with the minimum labeling peak δ2H = 3834‰ (Figure 6B(c)) and the maximum labeling peak δ2H = 45,988.4‰ (Figure 6A(c)), resulting in local deuterium enrichment. δ2H > 100‰ was used as the standard for soil water labeling with deuterium tracers. The deuterium tracers marked vertical layers of 60–100 cm in thickness (Figure 6A,B). There is an 2H peak for a certain depth in the soil, but the peak value is 20–40 cm below the release depth of the tracer; the decline in concentration was faster toward the shallower soil. The tracer test marked a region of 2H peaks decreasing in both directions below the tracer release location (Figure 6A,B).

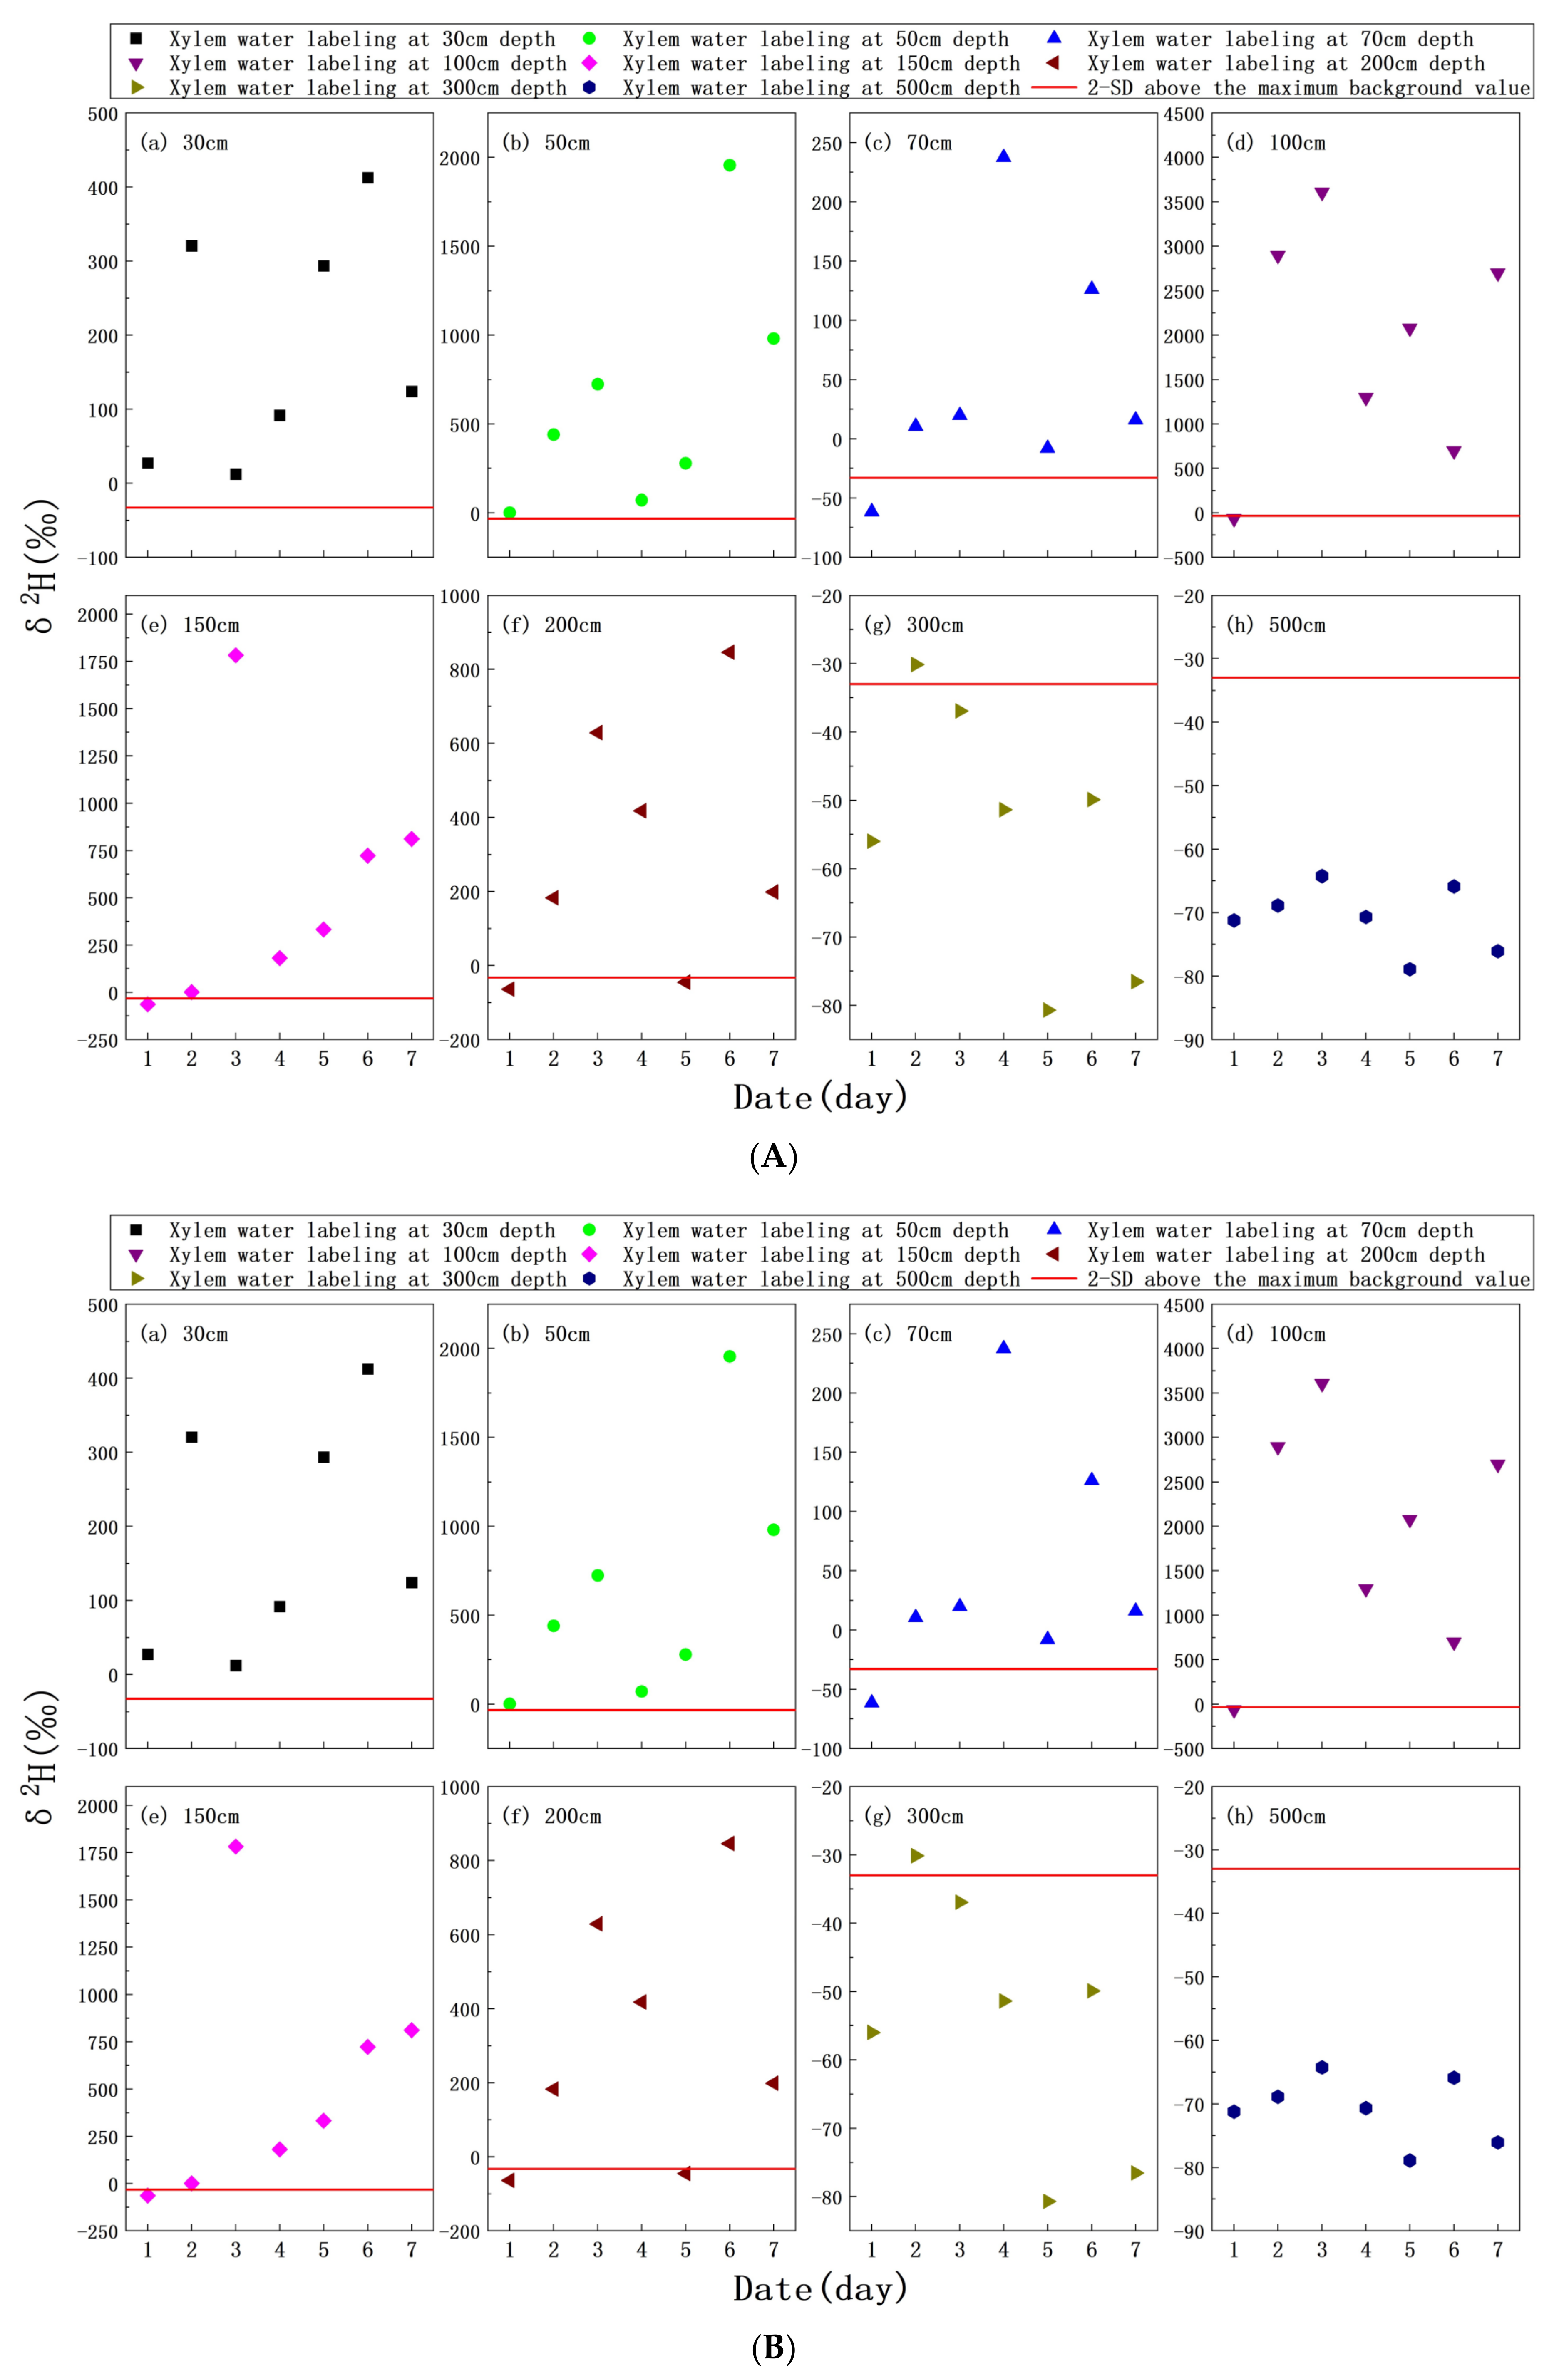
3.4. δ2H Characteristics of Xylem Water

The δ2H characteristics of water from Artemisia ordosica xylem water are the most direct evidence to judge the water uptake depth of Artemisia ordosica roots. Figure 7 shows the δ2H change of water in the xylem water of each labeled Artemisia ordosica plant in SW and BET sites after 7 days.
The maximum background value of water from Artemisia ordosica xylem water plus four times the standard deviation was taken as the standard of whether the Artemisia ordosica plants had absorbed deuterium tracer. The tracer released 500 cm deep in the SW and BET sites and was not absorbed by Artemisia ordosica plants. We believe that the labeled depth exceeded the water uptake limit of Artemisia ordosica plants. However, deuterium tracers released at depths of 30, 50, 70, 100, 150, 200, and 300 cm at the two test sites could be absorbed by Artemisia ordosica plants and were expressed in the xylem water of Artemisia ordosica. Although all 14 plants were able to absorb deuterium tracers, the δ2H values of their xylem water were significantly different. At the same time, we noted that in the two sites, we released tracers at the same depths (70, 100, and 150 cm) and the ranges of the tracers in the soil were roughly the same (Figure 7A(c–e),B(c–e)), but the δ2H values of water in the xylem water of Artemisia ordosica were significantly different. The heterogeneity of soil may cause an uneven distribution of tracers in the soil layer and there was a little coincidence between the tracer markers and the distribution area of the roots of Artemisia ordosica, so the roots of Artemisia ordosica can only absorb a small amount of tracers.

4. Discussion

4.1. Root Uptake Depth

Deuterium tracer technology is the most effective method for detecting the water uptake depths of plant roots [28,45,46]. In this study, the Artemisia ordosica plants in the two test sites could absorb tracer released at a depth of 300 cm at most, as shown in Figure 7A(g),B(g), but it could not be concluded that the water uptake depth of these two Artemisia ordosica roots was limited to 300 cm. This is because the deuterium tracer was diffused up to a certain extent after 300 cm in depth due to the capillary action of the soil particles. As can be seen in Figure 7A(g), the maximum effective tracer range released at SW300 cm was 260 cm and the effective label value of the deuterium tracer at SW300 cm decreased to δ2H = 728.5‰, which also corresponds with the weak tracer signal in the water of Artemisia ordosica xylem water in Figure 7A(g). As can be seen in Figure 7B(g), the maximum effective tracer range of the tracer released at SW300 cm was 240 cm, where δ2H = 171.6‰. Therefore, in Figure 7B(g), only the water collected from Artemisia ordosica xylem on the second day showed a deuterium tracer signal. Since the detection resolution of the distribution range of deuterium tracer in the soil in this study was 20 cm, the maximum resolution was 20 cm for delimiting the limit depth of water tracer signal of Artemisia ordosica xylem water. Therefore, we concluded that the limit water uptake depth of Artemisia ordosica roots marked at the SW test site was 260 cm. The depth limit of the water uptake was 3.71 times plant height. The water uptake depth limit of Artemisia ordosica roots marked in the BET test site was 240 cm; the water uptake depth limit of Artemisia ordosica roots was 3.43 times plant height.

4.2. Meaning of Deep Roots

The study area was a semi-arid region of Northwest China, but its annual average precipitation reaches 477 mm (2010–2021), which is a relatively large amount of precipitation; behind such precipitation, however, there are huge inter-annual and seasonal variations (Figure 3a,b). Indeed, 76.2% of the precipitation is concentrated in June, July, August, and September. At the same time, the air humidity in the study area is low and the wind speed is high, leading to meteorological drought for 9 months in a year (Figure 3c). In such a harsh environment, most of the areas around the lake and valley are only suitable for xerophytes. The study area was on the eastern margin of Mu Us sandy land and the surface was mostly covered by aeolian sand layer, which has good water permeability but poor water holding capacity. There is not much water stored in the near-surface soil during the rainy season (Figure 4a). With the advent of the dry season, the near-surface soil water is almost exhausted (Figure 4b). The low near-surface soil water content has adverse effects on the survival and growth of plants in the dry season.
For more than 40 years, Artemisia ordosica has been the pioneering plant for sand control in Mu Us sandy land and has become the most widely distributed shrub plant in Mu Us sandy land. This study found that the Artemisia ordosica root has a deep water absorbing depth. At the SW site, Artemisia ordosica can absorb the soil moisture at 240 cm deep. At the BET site, Artemisia ordosica plants can absorb the soil moisture 260 cm deep. The extremely deep uptake depth is an important reason why it can survive the extreme drought period in Mu Us sandy land [14,18]. After the rainy season, the soil water content at the water uptake depth of Artemisia ordosica in the study area increased significantly (SW 0–240 cm, BET 0–260 cm) (Figure 4a). Sufficient water at this stage was beneficial to the growth and reproduction of Artemisia ordosica. After the dry season, the shallow soil water content was low, but the deep soil still maintained a high soil water content. The soil water content in the SW test site increased from 180 cm deep onward and there was no significant difference between the two seasons from 220 cm deep onward (p > 0.05). The roots of Artemisia ordosica could still absorb water from 180 and 240 cm down in the soil to maintain its life activities. The soil moisture content increased from 160 to 220 cm depth and there was no significant difference between the two seasons (p > 0.05). In this study, it was found that the soil moisture content of 0–200 cm deep soil at the eastern edge of Mu Us sandy land was easily affected by weather changes, but the soil moisture content of 200 cm deep soil was not easily affected by weather changes, and maintained high moisture content, which became a stable water supply for perennial plants in the study area. This is conducive to stably supplying perennial plants in this area with water in response to extreme drought years and seasons [20,45]. The stable and continuous existence of perennial plants can also better fix the surface dunes, stop the deep soil water from being emitted into the atmosphere and cause the natural ecological environment in this area continue to improve.

4.3. Niche Differentiation of Roots in an Arid Environment

In the study area, the expansion range of Artemisia ordosica roots in the horizontal plane was not large [45]; its root distribution in the soil is mainly vertical. The variation of soil moisture in the vertical direction in the study area changed greatly with the seasons (Figure 4). The root depth of Artemisia ordosica increased and more root biomass was spread in the vertical direction, in order to absorb more soil moisture in the deep layer in the dry season [4]. In a semi-arid environment, it occupies a wide ecological niche [46,47], which is the result of its continuous adaptation to arid environments [6]. In the wild, we have observed that Artemisia ordosica can grow on the most barren sand dunes and sand beams, and it always appears in patches, but the different plants are about 1 m apart. We speculate that this may be associated with the root strategy of Artemisia ordosica. The soil moisture in the study area changes significantly vertically; the near-surface soil water in the dry season is scarce, not enough to supply the growth of plants, so that the Artemisia ordosica‘s root strategy is helpful. Such niche differentiation helps to reduce the competition of species for underground water resources, improve species’ coexistence, and promote community stability [11,48], which makes Artemisia ordosica show great vitality in barren sandy land.

5. Conclusions

The depth-controlled deuterium labeling technique was used to study the maximum water absorption depth of mature individuals (70 ± 5 cm in height, 105 ± 10 cm in crown width) in SW and BET test sites on the eastern edge of Mu Us sandy land. The following conclusions were drawn: (1) The maximum water uptake depth of Artemisia ordosica root in the SW site was 260 cm, which was 3.71 times its plant height. The maximum water absorption depth of Artemisia ordosica roots in the BET experimental site reached 240 cm, which was 3.43 times its plant height. (2) In this study, the water absorption depth of Artemisia ordosica roots in Mu Us sandy land was obtained to reveal the ecological niche occupied by Artemisia ordosica in the arid environment.
The deep root water absorption depth of Artemisia ordosica plants in the study area can ensure that they always use the water of deep soil with high moisture content during the dry season and rainy season. This water use mode can not only cause the efficient use of soil water, but also allow obtain a stable water supply in extremely dry seasons and years, so that it occupies an ecological niche in arid Mu Us sandy land. Therefore, we suggest that coal mining in this area should reduce the disturbances to soil structure and water within three meters of the surface and drought-tolerant plants with deep roots should be selected for afforestation projects in this area. The study of a water stable isotope is a powerful means for revealing the eco-hydrological cycle near the surface. In the future, a study of the water cycle near the surface could be carried out in the coal mining subsiding area to clarify the influences of coal mining on the water in the vadose zone in Mu Us sandy land. This study provided a reference for the study of vegetation restoration and ecological environment management in Mu Us sandy land.

Author Contributions

Conceptualization, Y.H., Y.Y. and X.W.; methodology, X.W.; software, X.W.; validation, X.W. and Y.Y.; formal analysis, X.W.; investigation, Y.H.; resources, Y.Y., W.Z. and G.L.; data curation, Y.Y. and F.M.; writing—original draft preparation, X.W.; writing—review and editing, X.W.; visualization, X.W., F.M. and K.Z.; supervision, Y.H.; project administration, Y.H.; funding acquisition, Y.H. All authors have read and agreed to the published version of the manuscript.

Funding

The project was financially supported by the National Natural Science Foundation of China (42272286), the Fundamental Research Funds for the Central Universities (2021YQMT01), the National Natural Science Foundation of China (52004012), the Open Fund of Hebei State Key Laboratory of Mine Disaster Prevention, and the North China Institute of Science and Technology (KJZH2022K02, KJZH2022K03).

Institutional Review Board Statement

Not applicable.

Informed Consent Statement

Not applicable.

Data Availability Statement

The data presented in this study are available on request from the corresponding author.

Acknowledgments

The authors would like to thank teachers and classmates from China University of Mining and Technology (Beijing) and Shandong University of Science and Technology for their help in sample collection and laboratory analysis.

Conflicts of Interest

The authors declare no conflict of interest.

References

  1. Han, X.; Yang, G.; Qin, F.; Jia, G.; Ling, X.; Gao, G. Spatial and temporal dynamic patterns of sandy land in Mu Us in the last 30 years. Res. Soil Water Conserv. 2019, 26, 144–157. [Google Scholar]
  2. Gu, Z.-K.; Shi, C.-X. Dynamical characteristics of geomorphologic evolution of the basins covered by Pisha-sandstone in the eastern wing of the Ordos Plateau, China. J. Mt. Sci. 2018, 15, 1046–1056. [Google Scholar] [CrossRef]
  3. Yang, H.; Zhang, J.; lI, Z.; Wu, B.; Zhang, Z.; Wang, Y. Comparative study on spatial patterns of Artemisia ordosica populations in the Mu Us sandy land. Acta Ecol. Sin. 2008, 28, 1901–1910. [Google Scholar]
  4. Wang, T.-Y.; Wang, P.; Wang, Z.-L.; Niu, G.-Y.; Yu, J.-J.; Ma, N.; Wu, Z.-N.; Pozdniakov, S.P.; Yan, D.-H. Drought adaptability of phreatophytes: Insight from vertical root distribution in drylands of China. J. Plant Ecol. 2021, 14, 1128–1142. [Google Scholar] [CrossRef]
  5. Rhizopoulou, S.; Kapolas, G. In situ study of deep roots of Capparis spinosa L. during the dry season: Evidence from a natural “rhizotron” in the ancient catacombs of Milos Island (Greece). J. Arid. Environ. 2015, 119, 27–30. [Google Scholar] [CrossRef]
  6. Schenk, H.J.; Jackson, R.B. Mapping the global distribution of deep roots in relation to climate and soil characteristics. Geoderma 2005, 126, 129–140. [Google Scholar] [CrossRef]
  7. Li, C.; Zeng, F.; Zhang, B.; Liu, B.; Guo, Z.; Gao, H.; Tiyip, T. Optimal root system strategies for desert phreatophytic seedlings in the search for groundwater. J. Arid. Land 2015, 7, 462–474. [Google Scholar] [CrossRef]
  8. Collins, D.B.G.; Bras, R.L. Plant rooting strategies in water-limited ecosystems. Water Resour. Res. 2007, 43, W06407. [Google Scholar] [CrossRef]
  9. Wang, L.; Zhao, C.; Li, J.; Liu, Z.; Wang, J. Root Plasticity of Populus euphratica Seedlings in Response to Different Water Table Depths and Contrasting Sediment Types. PLoS ONE 2015, 10, e0118691. [Google Scholar] [CrossRef]
  10. Gang, G.Z.; Xia, L.H.; Rong, W.Y.; Min, W.S.; Dong, C.G. Suitability of lucerne cultivars, with respect to root development, to semi-arid conditions in west China. N. Z. J. Agric. Res. 2004, 47, 51–59. [Google Scholar] [CrossRef]
  11. Li, H.; He, Y.; Sirimuji; Wang, B.; Liu, K. Research progress on the effects of root niche differences on ecosystems. Pratacultural Sci. 2021, 38, 501–513. [Google Scholar]
  12. Oliveira, R.S.; Bezerra, L.; Davidson, E.A.; Pinto, F.; Klink, C.A.; Nepstad, D.C.; Moreira, A. Deep root function in soil water 473 dynamics in cerrado savannas of central Brazil. Funct. Ecol. 2005, 19, 574–581. [Google Scholar] [CrossRef]
  13. Tomlinson, K.W.; Sterck, F.J.; Bongers, F.; da Silva, D.A.; Barbosa, E.R.M.; Ward, D.; Bakker, F.T.; van Kaauwen, M.; Prins, H.H.T.; de Bie, S.; et al. Biomass partitioning and root morphology of savanna trees across a water gradient. J. Ecol. 2012, 100, 1113–1121. [Google Scholar] [CrossRef]
  14. Brum, M.; Teodoro, G.S.; Abrahao, A.; Oliveira, R.S. Coordination of rooting depth and leaf hydraulic traits defines drought-related strategies in the campos rupestres, a tropical montane biodiversity hotspot. Plant Soil 2017, 420, 467–480. [Google Scholar] [CrossRef]
  15. Tumber-Davila, S.J.; Schenk, H.J.; Du, E.; Jackson, R.B. Plant sizes and shapes above and belowground and their interactions with climate. New Phytol. 2022, 235, 1032–1056. [Google Scholar] [CrossRef] [PubMed]
  16. Wang, T.; Wang, P.; Wu, Z.; Yu, J.; Pozdniakov, S.P.; Guan, X.; Wang, H.; Xu, H.; Yan, D. Modeling revealed the effect of root dynamics on the water adaptability of phreatophytes. Agric. For. Meteorol. 2022, 320, 108959. [Google Scholar] [CrossRef]
  17. Yang, F.; Feng, Z.; Wang, H.; Dai, X.; Fu, X. Deep soil water extraction helps to drought avoidance but shallow soil water uptake during dry season controls the inter-annual variation in tree growth in four subtropical plantations. Agric. For. Meteorol. 2017, 234, 106–114. [Google Scholar] [CrossRef]
  18. Zegada-Lizarazu, W.; Kanyomeka, L.; Izumi, Y.; Iijima, M. Pearl millet developed deep roots and changed water sources by competition with intercropped cowpea in the semiarid environment of northern Namibia. Plant Prod. Sci. 2006, 9, 355–363. [Google Scholar] [CrossRef]
  19. Good, S.P.; Noone, D.; Bowen, G. Hydrologic connectivity constrains partitioning of global terrestrial water fluxes. Science 2015, 349, 175–177. [Google Scholar] [CrossRef] [Green Version]
  20. Hashemian, M.; Ryu, D.; Crow, W.T.; Kustas, W.P. Improving root-zone soil moisture estimations using dynamic root growth and crop phenology. Adv. Water Resour. 2015, 86, 170–183. [Google Scholar] [CrossRef]
  21. Seyfried, M.S.; Schwinning, S.; Walvoord, M.A.; Pockman, W.T.; Newman, B.D.; Jackson, R.B.; Phillips, E.M. Ecohydrological control of deep drainage in arid and semiarid regions. Ecology 2005, 86, 277–287. [Google Scholar] [CrossRef]
  22. Guo, L.; Chen, J.; Cui, X.; Fan, B.; Lin, H. Application of ground penetrating radar for coarse root detection and quantification: A review. Plant Soil 2012, 362, 1–23. [Google Scholar] [CrossRef] [Green Version]
  23. Talebnejad, R.; Sepaskhah, A.R. Effects of deficit irrigation and groundwater depth on root growth of direct seeding rice in a column experiment. Int. J. Plant Prod. 2014, 8, 563–585. [Google Scholar]
  24. Yu, B.; Xie, C.; Cai, S.; Chen, Y.; Lv, Y.; Mo, Z.; Liu, T.; Yang, Z. Effects of Tree Root Density on Soil Total Porosity and Non-Capillary Porosity Using a Ground-Penetrating Tree Radar Unit in Shanghai, China. Sustainability 2018, 10, 4640. [Google Scholar] [CrossRef]
  25. Hirano, Y.; Yamamoto, R.; Dannoura, M.; Aono, K.; Igarashi, T.; Ishii, M.; Yamase, K.; Makita, N.; Kanazawa, Y. Detection frequency of Pinus thunbergii roots by ground-penetrating radar is related to root biomass. Plant Soil 2012, 360, 363–373. [Google Scholar] [CrossRef]
  26. Wen, X.; Yang, B.; Sun, X.; Lee, X. Evapotranspiration partitioning through in-situ oxygen isotope measurements in an oasis cropland. Agric. For. Meteorol. 2016, 230–231, 89–96. [Google Scholar] [CrossRef] [Green Version]
  27. Penna, D.; Hopp, L.; Scandellari, F.; Allen, S.T.; Benettin, P.; Beyer, M.; Geris, J.; Klaus, J.; Marshall, J.D.; Schwendenmann, L.; et al. Ideas and perspectives: Tracing terrestrial ecosystem water fluxes using hydrogen and oxygen stable isotopes—Challenges and opportunities from an interdisciplinary perspective. Biogeosciences 2018, 15, 6399–6415. [Google Scholar] [CrossRef] [Green Version]
  28. Sprenger, M.; Leistert, H.; Gimbel, K.; Weiler, M. Illuminating hydrological processes at the soil-vegetation-atmosphere interface with water stable isotopes. Rev. Geophys. 2016, 54, 674–704. [Google Scholar] [CrossRef] [Green Version]
  29. Hu, Z.; Wen, X.; Sun, X.; Li, L.; Yu, G.; Lee, X.; Li, S. Partitioning of evapotranspiration through oxygen isotopic measurements of water pools and fluxes in a temperate grassland. J. Geophys. Res. Biogeosci. 2014, 119, 358–372. [Google Scholar] [CrossRef]
  30. Lyu, S.; Wang, J.; Song, X.; Wen, X. The relationship of δD and δ18O in surface soil water and its implications for soil evaporation along grass transects of Tibet, Loess, and Inner Mongolia Plateau. J. Hydrol. 2021, 600, 123533. [Google Scholar] [CrossRef]
  31. Beyer, M.; Hamutoko, J.T.; Wanke, H.; Gaj, M.; Koeniger, P. Examination of deep root water uptake using anomalies of soil water stable isotopes, depth-controlled isotopic labeling and mixing models. J. Hydrol. 2018, 566, 122–136. [Google Scholar] [CrossRef]
  32. Beyer, M.; Koeniger, P.; Gaj, M.; Hamutoko, J.T.; Wanke, H.; Himmelsbach, T. A deuterium-based labeling technique for the investigation of rooting depths, water uptake dynamics and unsaturated zone water transport in semiarid environments. J. Hydrol. 2016, 533, 627–643. [Google Scholar] [CrossRef]
  33. Volkmann, T.H.M.; Haberer, K.; Gessler, A.; Weiler, M. High-resolution isotope measurements resolve rapid ecohydrological dynamics at the soil-plant interface. New Phytol. 2016, 210, 839–849. [Google Scholar] [CrossRef] [PubMed] [Green Version]
  34. Warren, C.P.; Kulmatiski, A.; Beard, K.H. A combined tracer/evapotranspiration model approach estimates plant water uptake in native and non-native shrub-steppe communities. J. Arid. Environ. 2015, 121, 67–78. [Google Scholar] [CrossRef]
  35. Gessler, A.; Bachli, L.; Rouholahnejad Freund, E.; Treydte, K.; Schaub, M.; Haeni, M.; Weiler, M.; Seeger, S.; Marshall, J.; Hug, C.; et al. Drought reduces water uptake in beech from the drying topsoil, but no compensatory uptake occurs from deeper soil layers. New Phytol. 2022, 233, 194–206. [Google Scholar] [CrossRef]
  36. Kahmen, A.; Buser, T.; Hoch, G.; Grun, G.; Dietrich, L. Dynamic H-2 irrigation pulse labelling reveals rapid infiltration and mixing of precipitation in the soil and species-specific water uptake depths of trees in a temperate forest. Ecohydrology 2021, 14, e2322. [Google Scholar] [CrossRef]
  37. Landgraf, J.; Tetzlaff, D.; Dubbert, M.; Dubbert, D.; Smith, A.; Soulsby, C. Xylem water in riparian willow trees (Salix alba) reveals shallow sources of root water uptake by in situ monitoring of stable water isotopes. Hydrol. Earth Syst. Sci. 2022, 26, 2073–2092. [Google Scholar] [CrossRef]
  38. Li, Y.; Zhu, F.; Wang, Y.; Cheng, J. Soil Water Use Strategies of Dominant Tree Species Based on Stable Isotopes in Subtropical Regions, Central China. Water 2022, 14, 954. [Google Scholar] [CrossRef]
  39. Huang, W.; Zhong, Y.; Song, X.; Zhang, C.; Ren, M.; Du, Y. Seasonal Differences in Water-Use Sources of Impatiens hainanensis (Balsaminaceae), a Limestone-Endemic Plant Based on “Fissure-Soil” Habitat Function. Sustainability 2021, 13, 8721. [Google Scholar] [CrossRef]
  40. Zheng, L.; Ma, J.; Sun, X.; Guo, X.; Cheng, Q.; Shi, X. Estimating the Root Water Uptake of Surface-Irrigated Apples Using Water Stable Isotopes and the Hydrus-1D Model. Water 2018, 10, 1624. [Google Scholar] [CrossRef] [Green Version]
  41. Duan, Y.; Li, J.; Du, Z.; Kang, F. Analysis of biodiversity and flora characteristics of natural plants in Mu Us sandy land. Acta Bot. Boreali-Occident. Sin. 2018, 38, 770–779. [Google Scholar]
  42. Zhang, Y.; Zhang, M.; Qu, D.; Duan, W.; Wang, J.; Su, P.; Guo, R. Water Use Strategies of Dominant Species (Caragana korshin- skiiandReaumuria soongorica) in Natural Shrubs Based on Stable Isotopes in the Loess Hill, China. Water 2020, 12, 1923. [Google Scholar] [CrossRef]
  43. Yue, Y.; Sun, Y.; Pang, Y.; Cheng, L.; Zhou, H.; Jia, X.; Zhao, Y.; Zhao, H.; Wu, B. Root characteristics of Artemisia ordosica in the process of sand dunes activation in Mu Us sandland. J. Desert Res. 2020, 40, 177–184. [Google Scholar]
  44. GB/T20481–2017; Meteorological Drought Grade. General Administration of Quality Supervision, Inspection and Quarantine of the People’s Republic of China: Beijing, China, 2017.
  45. Wang, S.; An, J.; Zhao, X.; Gao, X.; Wu, P.; Huo, G.; Robinson, B.H. Age- and climate- related water use patterns of apple trees on China’s Loess Plateau. J. Hydrol. 2020, 582, 124462. [Google Scholar] [CrossRef]
  46. Bing, W.; Lijian, Z.; Juanjuan, M.; Xihuan, S.; Xianghong, G.; Fei, G. Effective root depth and water uptake ability of winter wheat by using water stable isotopes in the Loess Plateau of China. Int. J. Agric. Biol. Eng. 2016, 9, 6. [Google Scholar]
  47. Cahill, J.F.; McNickle, G.G. The Behavioral Ecology of Nutrient Foraging by Plants. Annu. Rev. Ecol. Evol. Syst. 2011, 42, 289–311. [Google Scholar] [CrossRef] [Green Version]
  48. Levine, J.M.; HilleRisLambers, J. The importance of niches for the maintenance of species diversity. Nature 2009, 461, 254–257. [Google Scholar] [CrossRef]
Figure 1. Locations of the study area and test sites.
Sustainability 14 15149 g001
Figure 2. Schematic visualization of the depth-controlled deuterium labeling technique.
Sustainability 14 15149 g002
Figure 3. Climatic characteristics of the study area. (a) Monthly mean temperature and precipitation in the study area during 2010–2021. (b) Inter-annual precipitation variation in the study area during 2010–2021. (c) Monthly drought index in the study area in 2020.
Sustainability 14 15149 g003
Figure 4. Soil moisture content of SW and BET test sites. (a) Soil moisture content on 3 October 2020 and (b) soil moisture content on 8 June 2021.
Sustainability 14 15149 g004
Figure 5. δ2H background values of SW and BET test sites, (a) δ2H background values of soil moisture, (b) δ2H background values of Artemisia ordosica xylem water (mean ± S.D., N = 3).
Sustainability 14 15149 g005
Figure 6. Deuterium labeling values of SW and BET test sites. (A) Soil water δ2H values at SW test site. (B) Soil water δ2H value at BET test site.
Sustainability 14 15149 g006aSustainability 14 15149 g006b
Figure 7. δ2H value of xylem water in Artemisia ordosica of SW and BET test sites. The abscissa represents the sampling time (5–11 October 2020). (A) δ2H value of xylem water in Artemisia ordosica in the SW site. (B) δ2H value of BET Artemisia ordosica xylem water.
Sustainability 14 15149 g007
Table 1. Different meteorological drought grades.
GradeTypeRelative Humidity Index
1Data non-drought−0.40 < MI
2Data slight drought−0.65 < MI ≤ −0.40
3Moderate drought−0.80 < MI ≤ −0.65
4Serious drought−0.95 < MI ≤ −0.80
5Mega-droughtMI ≤ −0.95
Publisher’s Note: MDPI stays neutral with regard to jurisdictional claims in published maps and institutional affiliations.

