


Genetic Diversity of Trichoderma harzianum Isolates in Sunflower Rhizosphere: The Application of the URP Molecular Marker

 ,
,  ,
, 


Abstract
1. Introduction
2. Materials and Methods
2.1. Fungal Isolates
2.2. Preparation of Mycelia Mass
2.3. DNA Extraction
2.4. PCR and Electrophoresis
2.5. Assay of Morphological Traits of the Fungi
2.6. Data Analysis
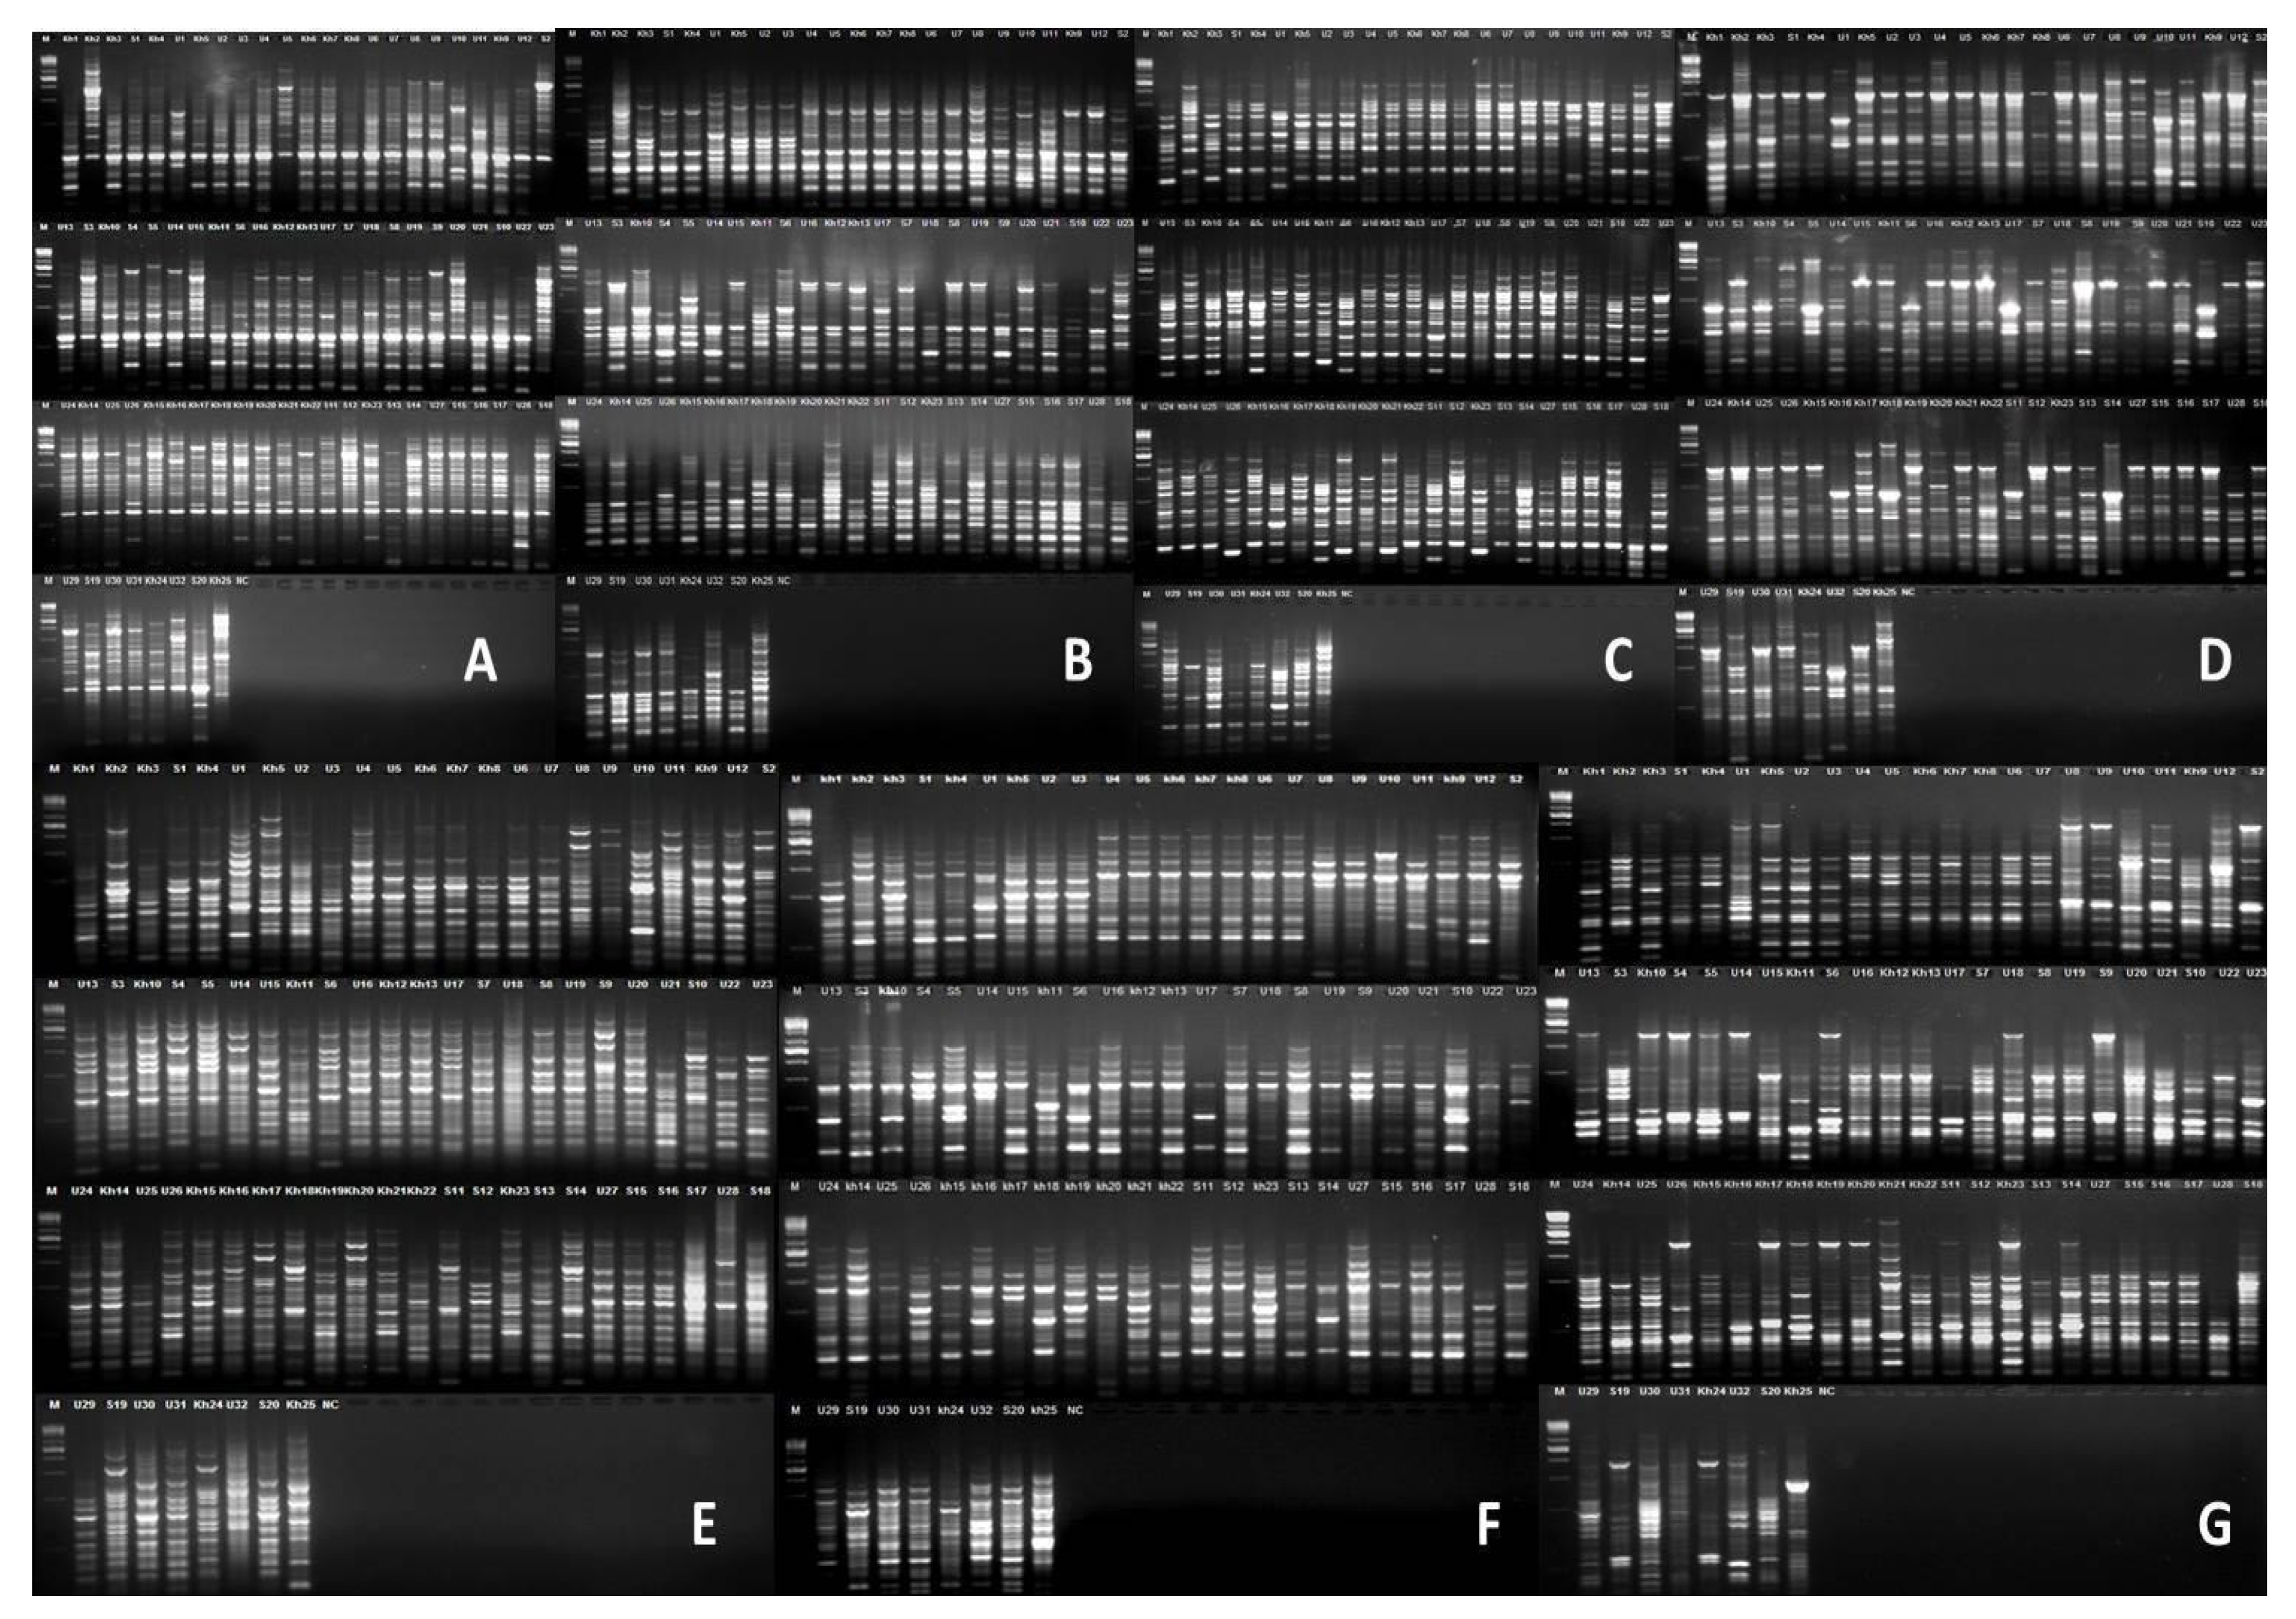
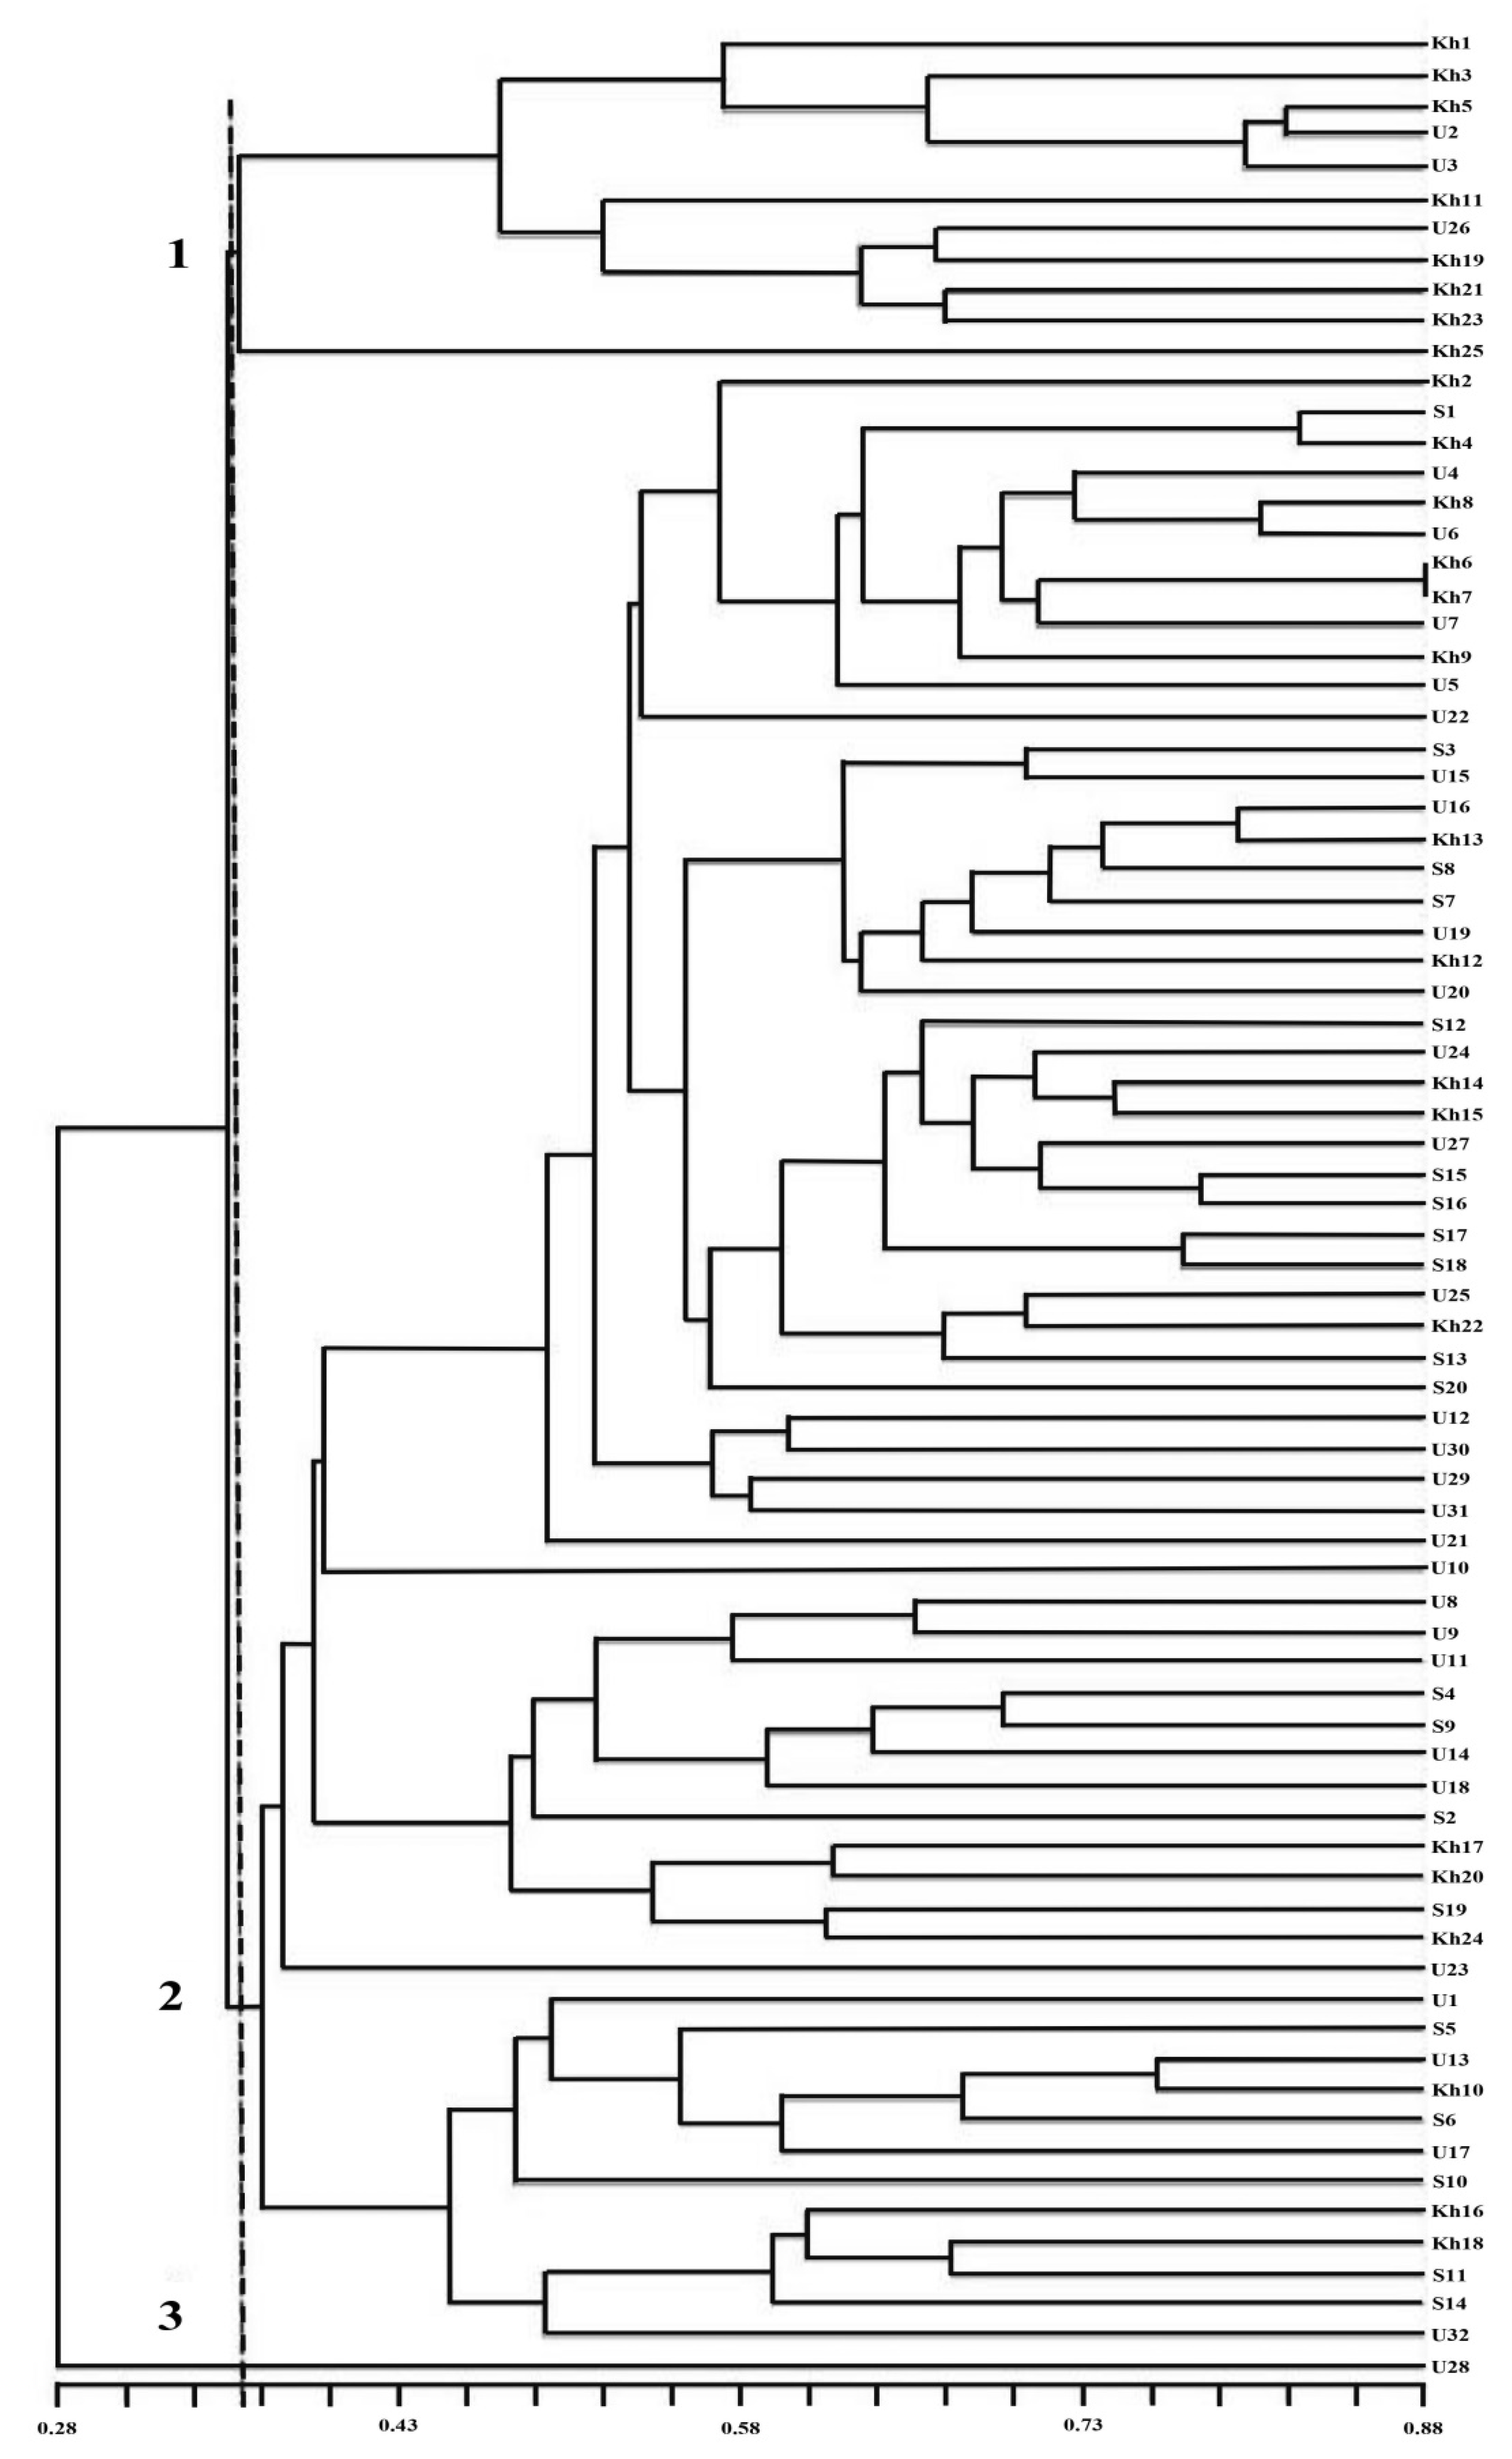
3. Results
4. Discussion
5. Conclusions
Author Contributions
Funding
Institutional Review Board Statement
Informed Consent Statement
Data Availability Statement
Conflicts of Interest
References
- Khodaei, S.; Arzanlou, M. Morphology, phylogeny and pathogenicity of Alternaria species, involved in leaf spot disease of sunflower in northern Iran. Arch. Phytopathol. Plant Prot. 2013, 46, 2224–2234. [Google Scholar] [CrossRef]
- Bhutta, A. Biological Studies on Some Fungi Associated with Sunflower in Pakistan. Ph.D. Thesis, Sindh Agriculture University, Tando Jam, Pakistan, 1998. [Google Scholar]
- Purdy, R.H. High oleic sunflower: Physical and chemical characteristics. J. Am. Oil Chem. Soc. 1986, 63, 1062–1066. [Google Scholar] [CrossRef]
- Fass, M.I.; Rivarola, M.; Ehrenbolger, G.F.; Maringolo, C.A.; Montecchia, J.F.; Quiroz, F.; García-García, F.; Blázquez, J.D.; Hopp, H.E.; Heinz, R.A.; et al. Exploring sunflower responses to Sclerotinia head rot at early stages of infection using RNA-seq analysis. Sci. Rep. 2020, 10, 133–147. [Google Scholar] [CrossRef] [PubMed]
- Cook, R.J. Advances in Plant Health Management in the Twentieth Century. Annu. Rev. Phytopathol. 2000, 38, 95–116. [Google Scholar] [CrossRef] [PubMed]
- O’Sullivan, C.A.; Belt, K.; Thatcher, L.F. Tackling Control of a Cosmopolitan Phytopathogen: Sclerotinia. Front. Plant Sci. 2021, 12, 707509. [Google Scholar] [CrossRef] [PubMed]
- Keel, C.; Défago, G. Interactions between Beneficial Soil Bacteria and Root Pathogens: Mechanisms and Eco-logical Impact. In Multitrophic Interactions in Terrestrial Systems: The 36th Symposium of the British Ecological Society; Gange, A.C., Brown, V.K., Eds.; Blackwell Science Ltd.: Oxford, UK, 1997; pp. 27–46. [Google Scholar]
- Dos Santos, A.F.; Dhingra, O.D. Pathogenicity of Trichoderma spp. on the sclerotia of Sclerotinia sclerotiorum. Can. J. Bot. 1982, 60, 472–475. [Google Scholar] [CrossRef]
- Burmeister, L.; Hau, B. Control of the bean rust fungus Uromyces appendiculatus by means of Trichoderma harzianum: Leaf disc assays on the antibiotic effect of spore suspensions and culture filtrates. BioControl 2009, 54, 575–585. [Google Scholar] [CrossRef]
- Migheli, Q.; Balmas, V.; Komoñ-Zelazowska, M.; Scherm, B.; Fiori, S.; Kopchinskiy, A.G.; Kubicek, C.P.; Druzhinina, I.S. Soils of a Mediterranean hot spot of biodiversity and endemism (Sardinia, Tyrrhenian Islands) are inhabited by pan-European, invasive species of Hypocrea/Trichoderma. Environ. Microbiol. 2009, 11, 35–46. [Google Scholar] [CrossRef]
- Druzhinina, I.S.; Kopchinskiy, A.G.; Kubicek, C.P. The first 100 Trichoderma species characterized by molecular data. Mycoscience 2006, 47, 55–64. [Google Scholar] [CrossRef]
- Gromovich, T.I.; Gukasian, V.M.; Golovanova, T.I.; Shmarlovskaya, S.V. Trichoderma Harzianum Rifai Aggr. as a Factor Enhancing Tomato Plants Resistance to the Root Rotting Pathogens. Mikol. Fitopatol. 1998, 32, 73–78. [Google Scholar]
- Lyu, R.-T.; Huang, C.-H. Supplementation of Manure Compost with Trichoderma asperellum Improves the Nutrient Uptake and Yield of Edible Amaranth under Field Conditions. Sustainability 2022, 14, 5389. [Google Scholar] [CrossRef]
- Guo, Y.; Fan, Z.; Yi, X.; Zhang, Y.; Khan, R.; Zhou, Z. Sustainable Management of Soil-Borne Bacterium Ralstonia solanacearum In Vitro and In Vivo through Fungal Metabolites of Different Trichoderma spp. Sustainability 2021, 13, 1491. [Google Scholar] [CrossRef]
- Peng, Y.; Li, S.J.; Yan, J.; Tang, Y.; Cheng, J.P.; Gao, A.J.; Yao, X.; Ruan, J.J.; Xu, B.L. Research Progress on Phytopathogenic Fungi and Their Role as Biocontrol Agents. Front. Microbiol. 2021, 12, 670135. [Google Scholar] [CrossRef] [PubMed]
- Chaverri, P.; Castlebury, L.; Samuels, G.J.; Geiser, D.M. Multilocus phylogenetic structure within the Trichoderma harzianum/Hypocrea lixii complex. Mol. Phylogenetics Evol. 2003, 27, 302–313. [Google Scholar] [CrossRef]
- Chaverri, P.; Samuels, G.J. Evolution of habitat preference and nutrition mode in a cosmopolitan fungal genus with evidence of interkingdom host jumps and major shifts in ecology. Evolution 2013, 67, 2823–2837. [Google Scholar] [CrossRef]
- Henson, J.M.; French, R. The Polymerase Chain Reaction and Plant Disease Diagnosis. Annu. Rev. Phytopathol. 1993, 31, 81–109. [Google Scholar] [CrossRef]
- Ezeonuegbu, B.A.; Abdullahi, M.D.; Whong, C.M.Z.; Sohunago, J.W.; Kassem, H.S.; Yaro, C.A.; Hetta, H.F.; Mostafa-Hedeab, G.; Zouganelis, G.D.; Batiha, G.E.-S. Characterization and phylogeny of fungi isolated from industrial wastewater using multiple genes. Sci. Rep. 2022, 12, 2094. [Google Scholar] [CrossRef]
- Kwak, Y. An Update on Trichoderma Mitogenomes: Complete De Novo Mitochondrial Genome of the Fungal Biocontrol Agent Trichoderma harzianum (Hypocreales, Sordariomycetes), an Ex-Neotype Strain CBS 226.95, and Tracing the Evolutionary Divergences of Mitogenomes in Trichoderma. Microorganisms 2021, 9, 1564. [Google Scholar] [CrossRef]
- Choudary, K.A.; Reddy, K.R.N.; Reddy, M.S. Antifungal Activity and Genetic Variability of Trichoderma harzianum Isolates. J. Mycol. Plant Pathol. 2007, 37, 1–6. [Google Scholar]
- Muthumeenakshi, S.; Mills, P.R.; Brownd, A.E.; Seaby, D.A. Intraspecific molecular variation among Trichoderma harzianum isolates colonizing mushroom compost in the British Isles. Microbiology 1994, 140, 769–777. [Google Scholar] [CrossRef]
- Sharma, K.; Mishra, A.K.; Misra, R.S. Morphological, Biochemical and Molecular Characterization of Trichoderma harzianum Isolates for their Efficacy as Biocontrol Agents. J. Phytopathol. 2009, 157, 51–56. [Google Scholar] [CrossRef]
- Siameto, E.M.; Okoth, S.; Amugune, N.; Chege, N.C. Molecular Characterization and Identification of Bio-control Isolates of Trichoderma harzianum from Embu District, Kenya. Trop. Subtrop. Agroecosyst. 2010, 13, 81–90. [Google Scholar]
- Hassan, M.M.; Gaber, A.; El-Hallous, E. Molecular and Morphological Characterization of Trichoderma harzianum from Different Egyptian Soils. Wulfenia J. 2014, 21, 80–96. [Google Scholar]
- Sharma, V.; Salwal, R. Molecular Markers and Their Use in Taxonomic Characterization of Trichoderma spp. In Molecular Markers in Mycology: Diagnostics and Marker Developments; Singh, B.P., Gupta, V.K., Eds.; Springer International Publishing: Cham, Switzerland, 2017; pp. 37–52. ISBN 978-3-319-34106-4. [Google Scholar]
- Sivasithamparam, K.; Ghisalberti, E. Secondary Metabolism in Trichoderma. Trichoderma Gliocladium. Vol 1. Basic Biol. Taxon. Genet. 2002, 1, 139. [Google Scholar]
- Zin, N.A.; Badaluddin, N.A. Biological functions of Trichoderma spp. for agriculture applications. Ann. Agric. Sci. 2020, 65, 168–178. [Google Scholar] [CrossRef]
- Papavizas, G.C. Trichoderma and Gliocladium: Biology, Ecology, and Potential for Biocontrol. Annu. Rev. Phytopathol. 1985, 23, 23–54. [Google Scholar] [CrossRef]
- Tyśkiewicz, R.; Nowak, A.; Ozimek, E.; Jaroszuk-Ściseł, J. Trichoderma: The Current Status of Its Application in Agriculture for the Biocontrol of Fungal Phytopathogens and Stimulation of Plant Growth. Int. J. Mol. Sci. 2022, 23, 2329. [Google Scholar] [CrossRef]
- Samuels, G.J. Trichoderma: A review of biology and systematics of the genus. Mycol. Res. 1996, 100, 923–935. [Google Scholar] [CrossRef]
- Kang, H.-W.; Park, D.S.; Go, S.-J.; Eun, M.-Y. Fingerprinting of Diverse Genomes Using PCR with URP Primers Generated from Repetitive Sequence of Korean Weedy Rice. Mol. Cells 2002, 13, 281–287. [Google Scholar]
- Safei, N.; Alizadeh, A.A.; Saeidi, A.; Adam, G.; Rahimian, H. Molecular Characterization and Genetic Diversity among Iranian Populations of Fusarium graminearum, the Causal Agent of Wheat Headblight. Iran J. Plant Pathol. 2005, 41, 171–189. [Google Scholar]
- Rohlf, F. NTSYS-Pc—Numerical Taxonomy and Multivariate Analysis System, Version 2; Applied Biostatistics Inc.: New York, NY, USA, 1988.
- Chadha, S.; Gopalakrishna, T. Comparative Assessment of REMAP and ISSR Marker Assays for Genetic Polymorphism Studies, in Magnaporthe Grisea. Curr. Sci. 2007, 93, 688–692. [Google Scholar]
- Powell, W.; Morgante, M.; Andre, C.; Hanafey, M.; Vogel, J.; Tingey, S.; Rafalski, A. The comparison of RFLP, RAPD, AFLP and SSR (microsatellite) markers for germplasm analysis. Mol. Breed. 1996, 2, 225–238. [Google Scholar] [CrossRef]
- Yeh, F.C.; Yeh, F.C.; Yang, R.; Boyle, T.; Ye, Z.; Mao, J.; Yang, R.C.; Boyle, T.; Ye, Z. PopGene, the User-Friendly Shareware for Population Genetic Analysis, Molecular Biology and Biotechnology Center. In Molecular Biology and Biotechnology Centre; University of Alberta: Edmonton, AB, Canada, 1997; Volume 10, pp. 295–301. [Google Scholar]
- Samuels, G.J.; Petrini, O.; Manguin, S. Morphological and Macromolecular Characterization of Hypocrea schweinitzii and Its Trichoderma Anamorph. Mycologia 1994, 86, 421–435. [Google Scholar] [CrossRef]
- Gopal, K.; Sreenivasulu, Y.; Gopi, V.; Prasadbabu, G.; Kumar, T.B.; Madhusudhan, P.; Ahemed, S.K.; Palanivel, S.G. Genetic Variability and Relationships among Seventeen Trichoderma Isolates to Control Dry Root Rot Disease Using RAPD Markers. Z. Nat. C 2008, 63, 740–746. [Google Scholar] [CrossRef] [PubMed]
- Keller, N.P.; Hohn, T.M. Metabolic Pathway Gene Clusters in Filamentous Fungi. Fungal Genet. Biol. 1997, 21, 17–29. [Google Scholar] [CrossRef]
- Hernández, A.; Jiménez, M.; Arcia, A.; Ulacio, D.; Méndez, N. Caracterización Molecular de Doce Aislamientos de Trichoderma Spp. Mediante Rapd y RADN-ITS. Bioagro 2013, 25, 167–174. [Google Scholar]
- Kumar, V.; Sharma, S.N. Comparative potential of phenotypic, ISSR and SSR markers for characterization of sesame (Sesamum indicum L.) varieties from India. J. Crop Sci. Biotechnol. 2011, 14, 163–171. [Google Scholar] [CrossRef]
- Aggarwal, R.; Tripathi, A.; Yadav, A. Pathogenic and genetic variability in Tilletia indica monosporidial culture lines using universal rice primer-PCR. Eur. J. Plant Pathol. 2010, 128, 333–342. [Google Scholar] [CrossRef]
- Iqbal, N.; Ali, H.; Alam, S.S. Genetic and Pathogenic Variability of Ascochyta rabiei Isolates from Pakistan and Syria as Detected by Universal Rice Primers. J. Plant Pathol. Microbiol. 2013, 4, 212. [Google Scholar] [CrossRef]
- Mann, M.B.; Spadari, C.C.; Feltrin, T.; Frazzon, A.P.G.; Germani, J.C.; Van Der Sand, S.T. Genetic variability of Bipolaris sorokiniana isolates using URP-PCR. Trop. Plant Pathol. 2014, 39, 163–171. [Google Scholar] [CrossRef]


| Primer | Sequence | Annealing Temperature (°C) |
|---|---|---|
| URP-1F | 5′-ATCCAAGGTCCGAGACAACC-3′ | 51 |
| URP-2F | 5′-GTGTGCGATCAGTTGCTGGG-3′ | 47 |
| URP-2R | 5′-CCCAGCAACTGATCGCACAC-3′ | 49 |
| URP-4R | 5′-AGGACTCGATAACAGGCTCC-3′ | 54 |
| URP-6R | 5′-GGCAAGCTGGTGGGAGGTAC-3 | 53 |
| URP-13R | 5′-TACATCGCAAGTGACACAGG-3′ | 46 |
| URP-25F | 5′-GATGTGTTCTTGGAGCCTGT-3′ | 51 |
| Primer | Number of Gene Loci | β | PIC | EMR | MI |
|---|---|---|---|---|---|
| URP-1F | 32 | 91% | 0.36 | 29.33 | 10.60 |
| URP-2F | 24 | 72% | 0.36 | 17.40 | 6.34 |
| URP-2R | 22 | 100% | 0.29 | 22 | 6.41 |
| URP-4R | 27 | 100% | 0.35 | 27 | 9.68 |
| URP-6R | 29 | 100% | 0.37 | 29 | 10.98 |
| URP-13R | 20 | 100% | 0.34 | 20 | 6.84 |
| URP-25F | 32 | 100% | 0.28 | 32 | 9.12 |
| Population | Number of Samples | Ne | Na | H | I | PPL |
|---|---|---|---|---|---|---|
| Urmia | 32 | 1.56 | 1.95 | 0.33 | 0.49 | 95.70 |
| Khoy | 25 | 1.56 | 1.94 | 0.32 | 0.49 | 94.62 |
| Salmas | 20 | 1.49 | 1.89 | 0.29 | 0.44 | 89.78 |
| Mean | - | 1.53 | 1.92 | 0.31 | 0.47 | 94.36 |
| Population | Khoy | Salmas | Urmia |
|---|---|---|---|
| Khoy | - | 0.96 | 0.98 |
| Salmas | 0.035 | - | 0.97 |
| Urmia | 0.020 | 0.021 | - |
Publisher’s Note: MDPI stays neutral with regard to jurisdictional claims in published maps and institutional affiliations. |
© 2022 by the authors. Licensee MDPI, Basel, Switzerland. This article is an open access article distributed under the terms and conditions of the Creative Commons Attribution (CC BY) license (https://creativecommons.org/licenses/by/4.0/).
Share and Cite
Rezaee Danesh, Y.; Pellegrini, M.; Kariman, K.; Boyno, G.; Djebaili, R.; Farda, B.; Najafi, S. Genetic Diversity of Trichoderma harzianum Isolates in Sunflower Rhizosphere: The Application of the URP Molecular Marker. Sustainability 2022, 14, 15111. https://doi.org/10.3390/su142215111
Rezaee Danesh Y, Pellegrini M, Kariman K, Boyno G, Djebaili R, Farda B, Najafi S. Genetic Diversity of Trichoderma harzianum Isolates in Sunflower Rhizosphere: The Application of the URP Molecular Marker. Sustainability. 2022; 14(22):15111. https://doi.org/10.3390/su142215111
Chicago/Turabian StyleRezaee Danesh, Younes, Marika Pellegrini, Khalil Kariman, Gökhan Boyno, Rihab Djebaili, Beatrice Farda, and Solmaz Najafi. 2022. "Genetic Diversity of Trichoderma harzianum Isolates in Sunflower Rhizosphere: The Application of the URP Molecular Marker" Sustainability 14, no. 22: 15111. https://doi.org/10.3390/su142215111
APA StyleRezaee Danesh, Y., Pellegrini, M., Kariman, K., Boyno, G., Djebaili, R., Farda, B., & Najafi, S. (2022). Genetic Diversity of Trichoderma harzianum Isolates in Sunflower Rhizosphere: The Application of the URP Molecular Marker. Sustainability, 14(22), 15111. https://doi.org/10.3390/su142215111