Article

Processing Coalmine Overburden Waste Rock as Replacement to Natural Sand: Environmental Sustainability Assessment

1
Department of Civil Engineering, Indian Institute of Technology Dhanbad, Dhanbad, JH 826004, India
2
Department of Civil, Materials, and Environmental Engineering, University of Illinois Chicago, Chicago, IL 60607, USA
*
Author to whom correspondence should be addressed.
Sustainability 2022, 14(22), 14853; https://doi.org/10.3390/su142214853
Submission received: 28 September 2022 / Revised: 2 November 2022 / Accepted: 7 November 2022 / Published: 10 November 2022

Abstract

:
Waste rock dumped beside a surface coal mining site is termed coalmine overburden (OB) and is found suitable as a construction material. It requires preprocessing to be converted into the final construction material. The waste rock (cradle) processing to the final product (gate) involves transportation to the processing plant, crushing, screening, washing, and transportation from the processing plant to the client or project site. Preprocessing will cause environmental impacts. The present study performs a cradle-to-gate environmental impact assessment of waste rock to replace natural sand at a coal mine near Dhanbad, India. Life cycle environmental sustainability is assessed using the SimaPro® CML-IA baseline V3.07/EU+3 2000 impact method with the Ecoinvent 3.0 inventory. The data used was collected from an operational plant in the nearby area. The layout of a typical processing plant is also proposed in the study. The environmental impacts are reported in terms of abiotic depletion, global warming potential, ozone depletion potential, terrestrial ecotoxicity, human toxicity, eutrophication, acidification, and eutrophication. The manufacture of overburden sand (OBS) using a sustainable fuel and energy mix is more environmentally friendly. The environmental impacts can be drastically reduced if crushing is carried out using an onsite or mobile crushing plant.

1. Introduction

Silica is the most used mineral by mass in manufacturing and construction and is becoming increasingly scarce. The situation is grave. Growing demand is harming the environment, causing social problems, and raising concerns about sand scarcity [1]. The building sector of the global economy accounts for a significant portion of global energy and raw material/natural resource use. This largely stems from the fact that most industrialized building materials utilized today have substantial environmental effects during production [2]. Coalmine waste rock, generally termed as overburden (OB), is an excellent alternative to natural sand that can collectively resolve the sustainability issues of the building and mining industries if bulk utilization is carried out in construction practices. It is composed chiefly of sandstone, shale, greystone, and soil [3,4]. The waste rock (cradle) processing to the final product (gate) involves transportation to the processing plant, crushing, screening, washing, and transportation from the processing plant to the client or project site. An installation that meets the necessary production requirements; operates at a competitive cost; complies with strict environmental regulations; and is constructible at an affordable price, despite the rising costs of construction materials, energy, and equipment, is the fundamental aim for the design of a crushing plant. The increasing demand for environmentally friendly products and the rise in environmental consciousness worldwide are driving the industry to adopt the “sustainability” paradigm. As a result, the industry is gradually beginning to use materials that have less embodied energy, have fewer adverse effects on the environment, and are more suitable for factors such as the local climate [2]. All this preprocessing will have environmental impacts. Even if the material is suitable for construction, these environmental impacts must be quantified.
Literature covering the environmental impacts of production and processing is available. Life cycle impact assessments of the production of aluminum [5], cement mortar and concrete [6,7,8], geopolymer concrete [9,10], aggregates production [11], and asphalt pavement aggregate [12] are available. Limited literature on the comparative environmental assessment of recycled aggregate [13], shredded tires [14], and construction and demolition waste [15] is available. Only literature covering OB as a sub-blast in railways [16] is available as per the authors’ current knowledge. Around the world, coal is mined for various purposes using either underground or surface mining techniques, depending on the depth of the coal seam. Waste rocks produced by the mining of coal are discarded nearby. Managing these waste rocks is a significant challenge in most coal mining sites.
In most cases, the use of waste rocks and the environmental viability of turning them into aggregates have not been investigated. The present study examines the environmental impacts of processing OB waste rock to replace natural sand. The processing data used is collected from an operational plant in the nearby area. The layout of a typical processing plant is also proposed in the study. The environmental impacts are reported in terms of mid-point indicators such as abiotic depletion (ADP), abiotic depletion fossil fuels (ADP F), global warming potential (GWP), ozone depletion potential (ODP), terrestrial ecotoxicity (TET), human toxicity (HT), freshwater aquatic ecotoxicity (FAET), marine aquatic ecotoxicity (MAET), photochemical oxidation (PCOD), acidification (AP), and eutrophication (EP). A comparison of different scenarios involving the impact of change in fuels and energy sources, change of source and quantity of water to be used, and change of location of a processing unit with the conventional baseline processing technique is studied. The most critical impact categories are identified, and sustainable solutions are recommended to reduce the environmental load.

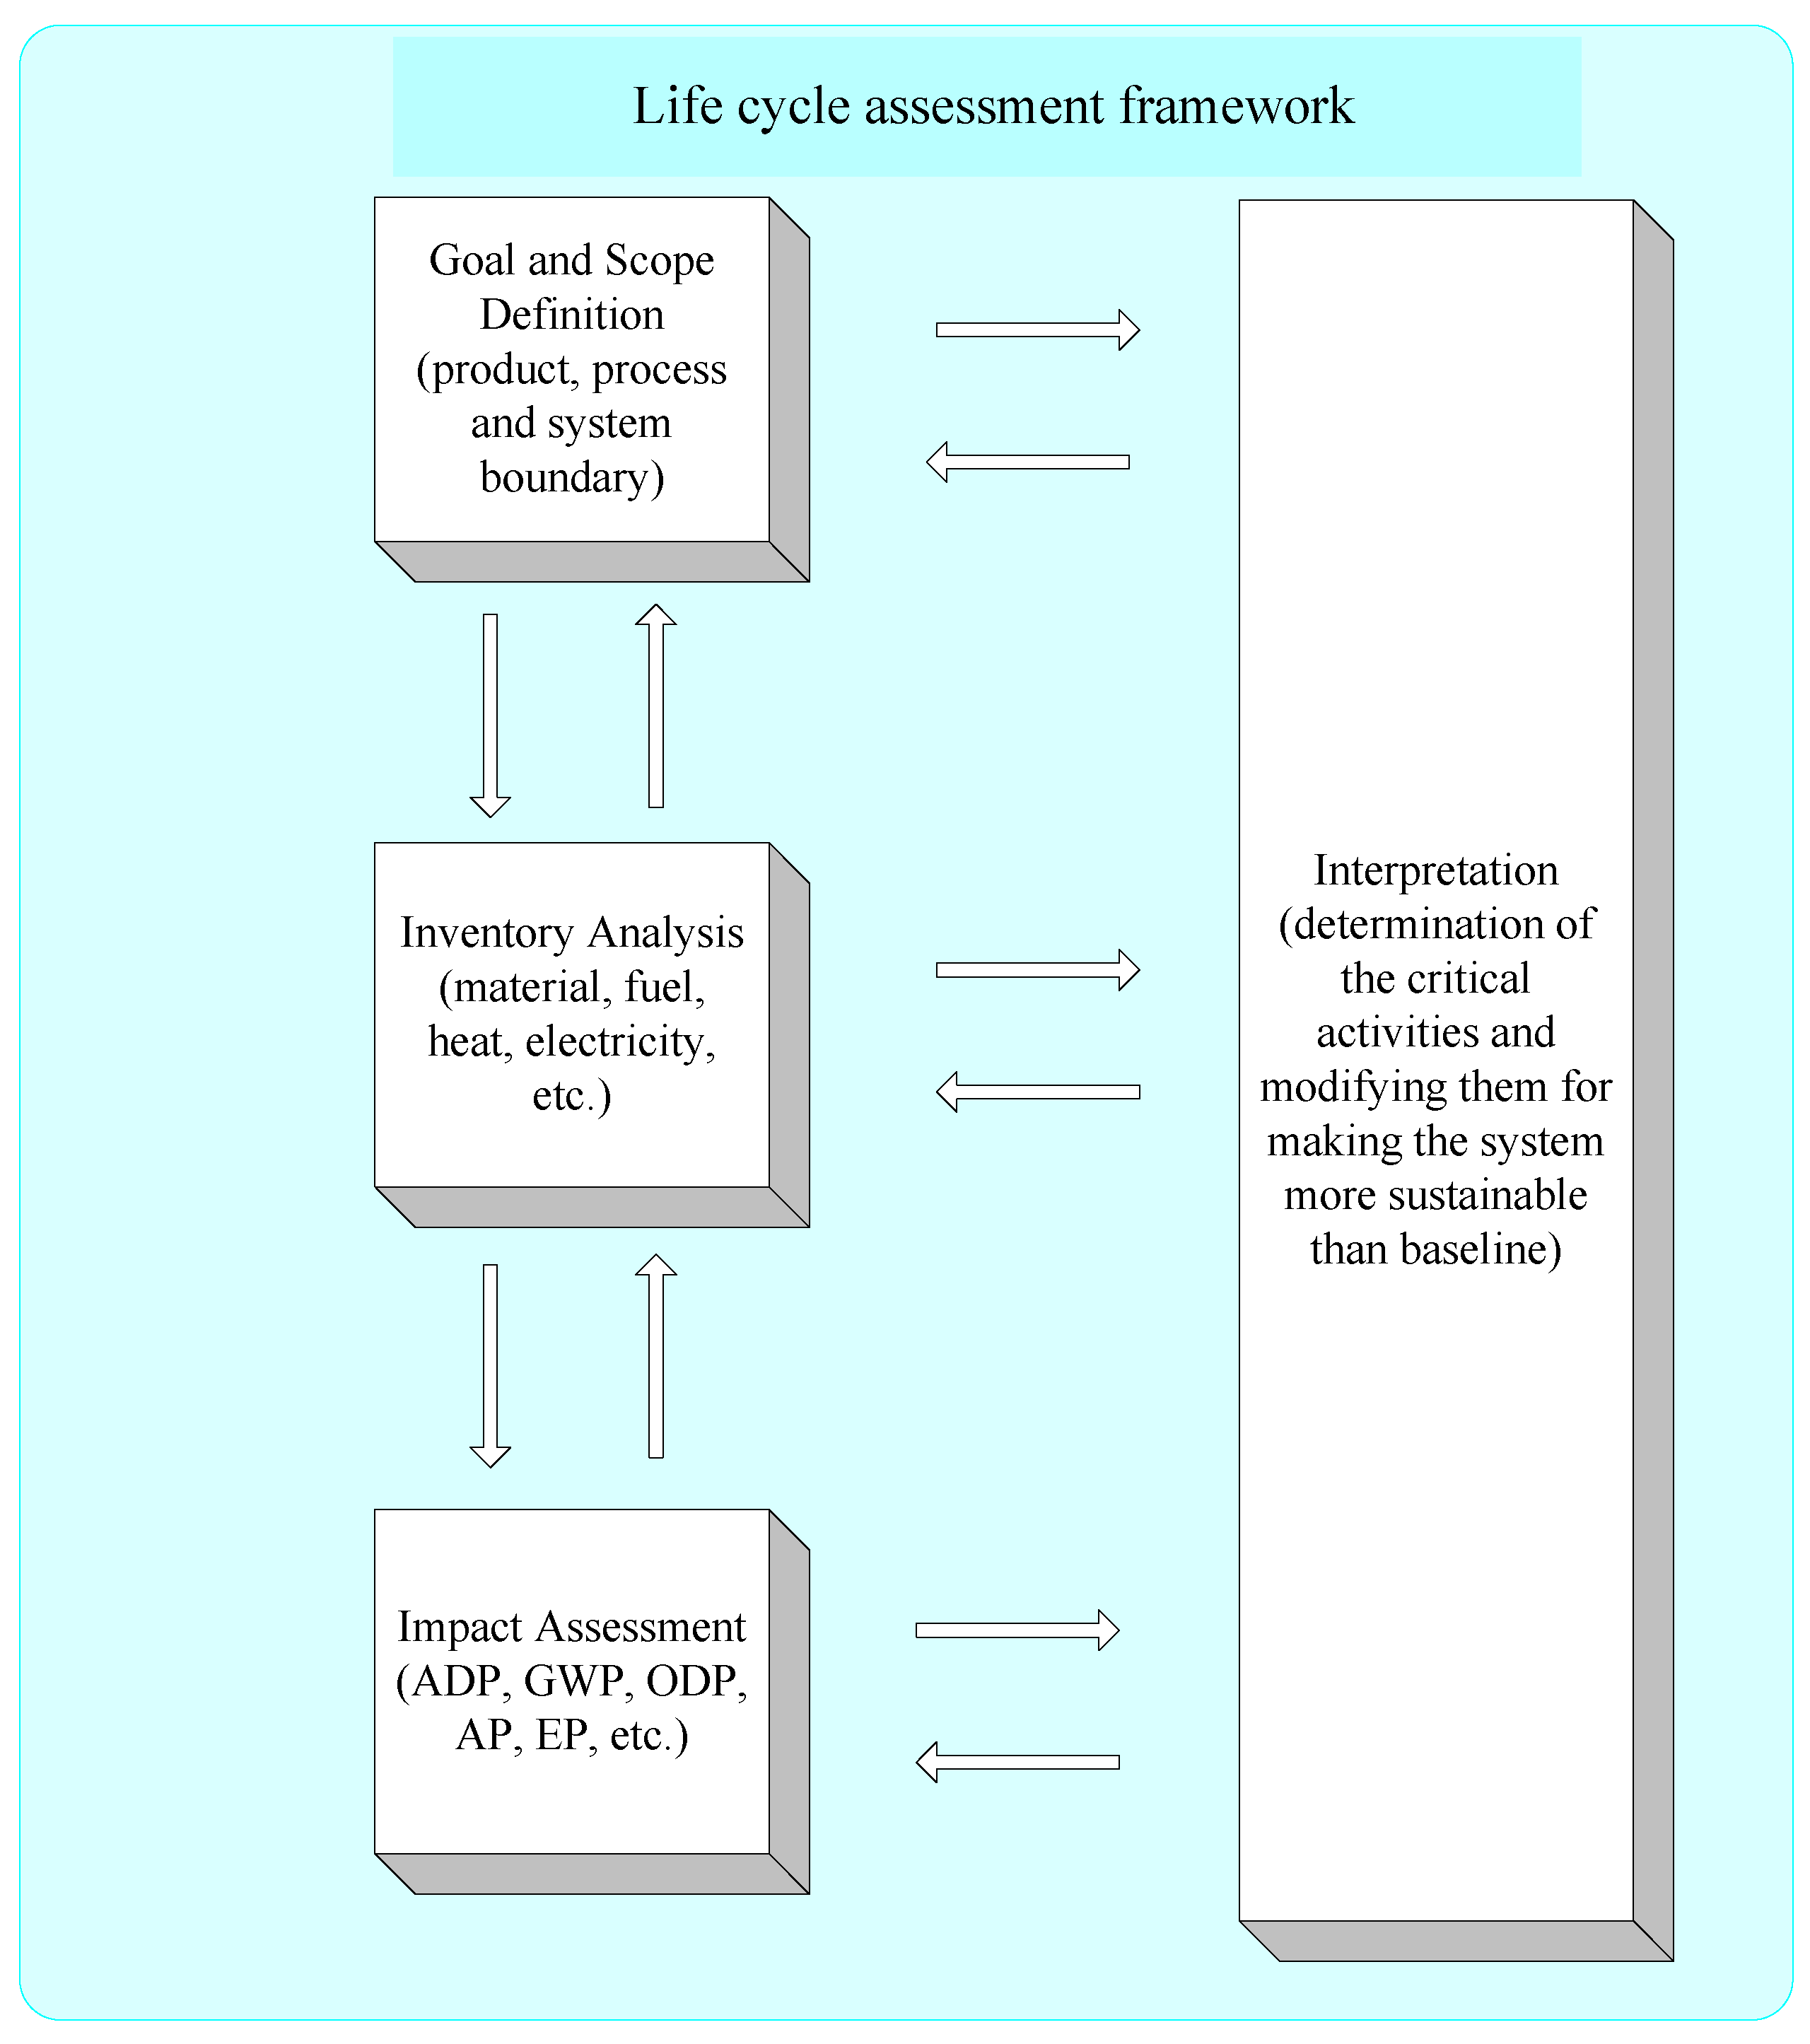
2. Life Cycle Assessment (LCA)

A boulder and cobble size fraction greater than 600 mm is considered for processing into a sand fraction. The procedure to assess the environmental effects of a process, product, or system across the course of its life cycle is defined by ISO 14040 (2006) [17] and ISO 14044 (2006) [18]. As shown in Figure 1, the LCA methodology framework is divided into the following steps per ISO standards: 1. Goal and scope definition; 2. Inventory analysis; 3. Impact evaluation; and 4. Interpretation.

2.1. Goal and Scope Definition

This phase includes determining the product, process, or system to be examined, creating a valid basis for contrasting the processes or products under evaluation, and selecting the proper level of detail or system boundaries. The aim of the present study is to (1) evaluate the environmental impacts of processing a unit mass of coalmine overburden waste rock (OBR) into overburden sand (OBS) using a conventional crushing process (M1), (2) evaluate the environmental impacts of processing a unit mass of OBR into OBS using renewable energy sources (M2), (3) compare the LCA of M1 and M2, (4) assess the influence of change in source and quantity of water in method M1, and (5) assess the impact of a change in the location of the processing plant. The analysis of the different processes is carried out as per ISO 14040 (2006) [17] and ISO 14044 (2006) [18]. For the analysis, the product’s life is considered from cradle to gate.
Cradle to gate LCA: The study examines a product’s whole life cycle, from the point at which waste rock is placed onto a dump truck for transport to a processing facility to the point at which the finished product (processed sand) is loaded into a dump truck for delivery to the site. The emissions caused during transportation, crushing, washing, and conveying are considered. Based on a nearby coarse aggregate processing plant, the capacity of the proposed plant is considered to be 150 TPH (tons per hour) and the processing machinery’s specifications are based on the material and plant capacity.

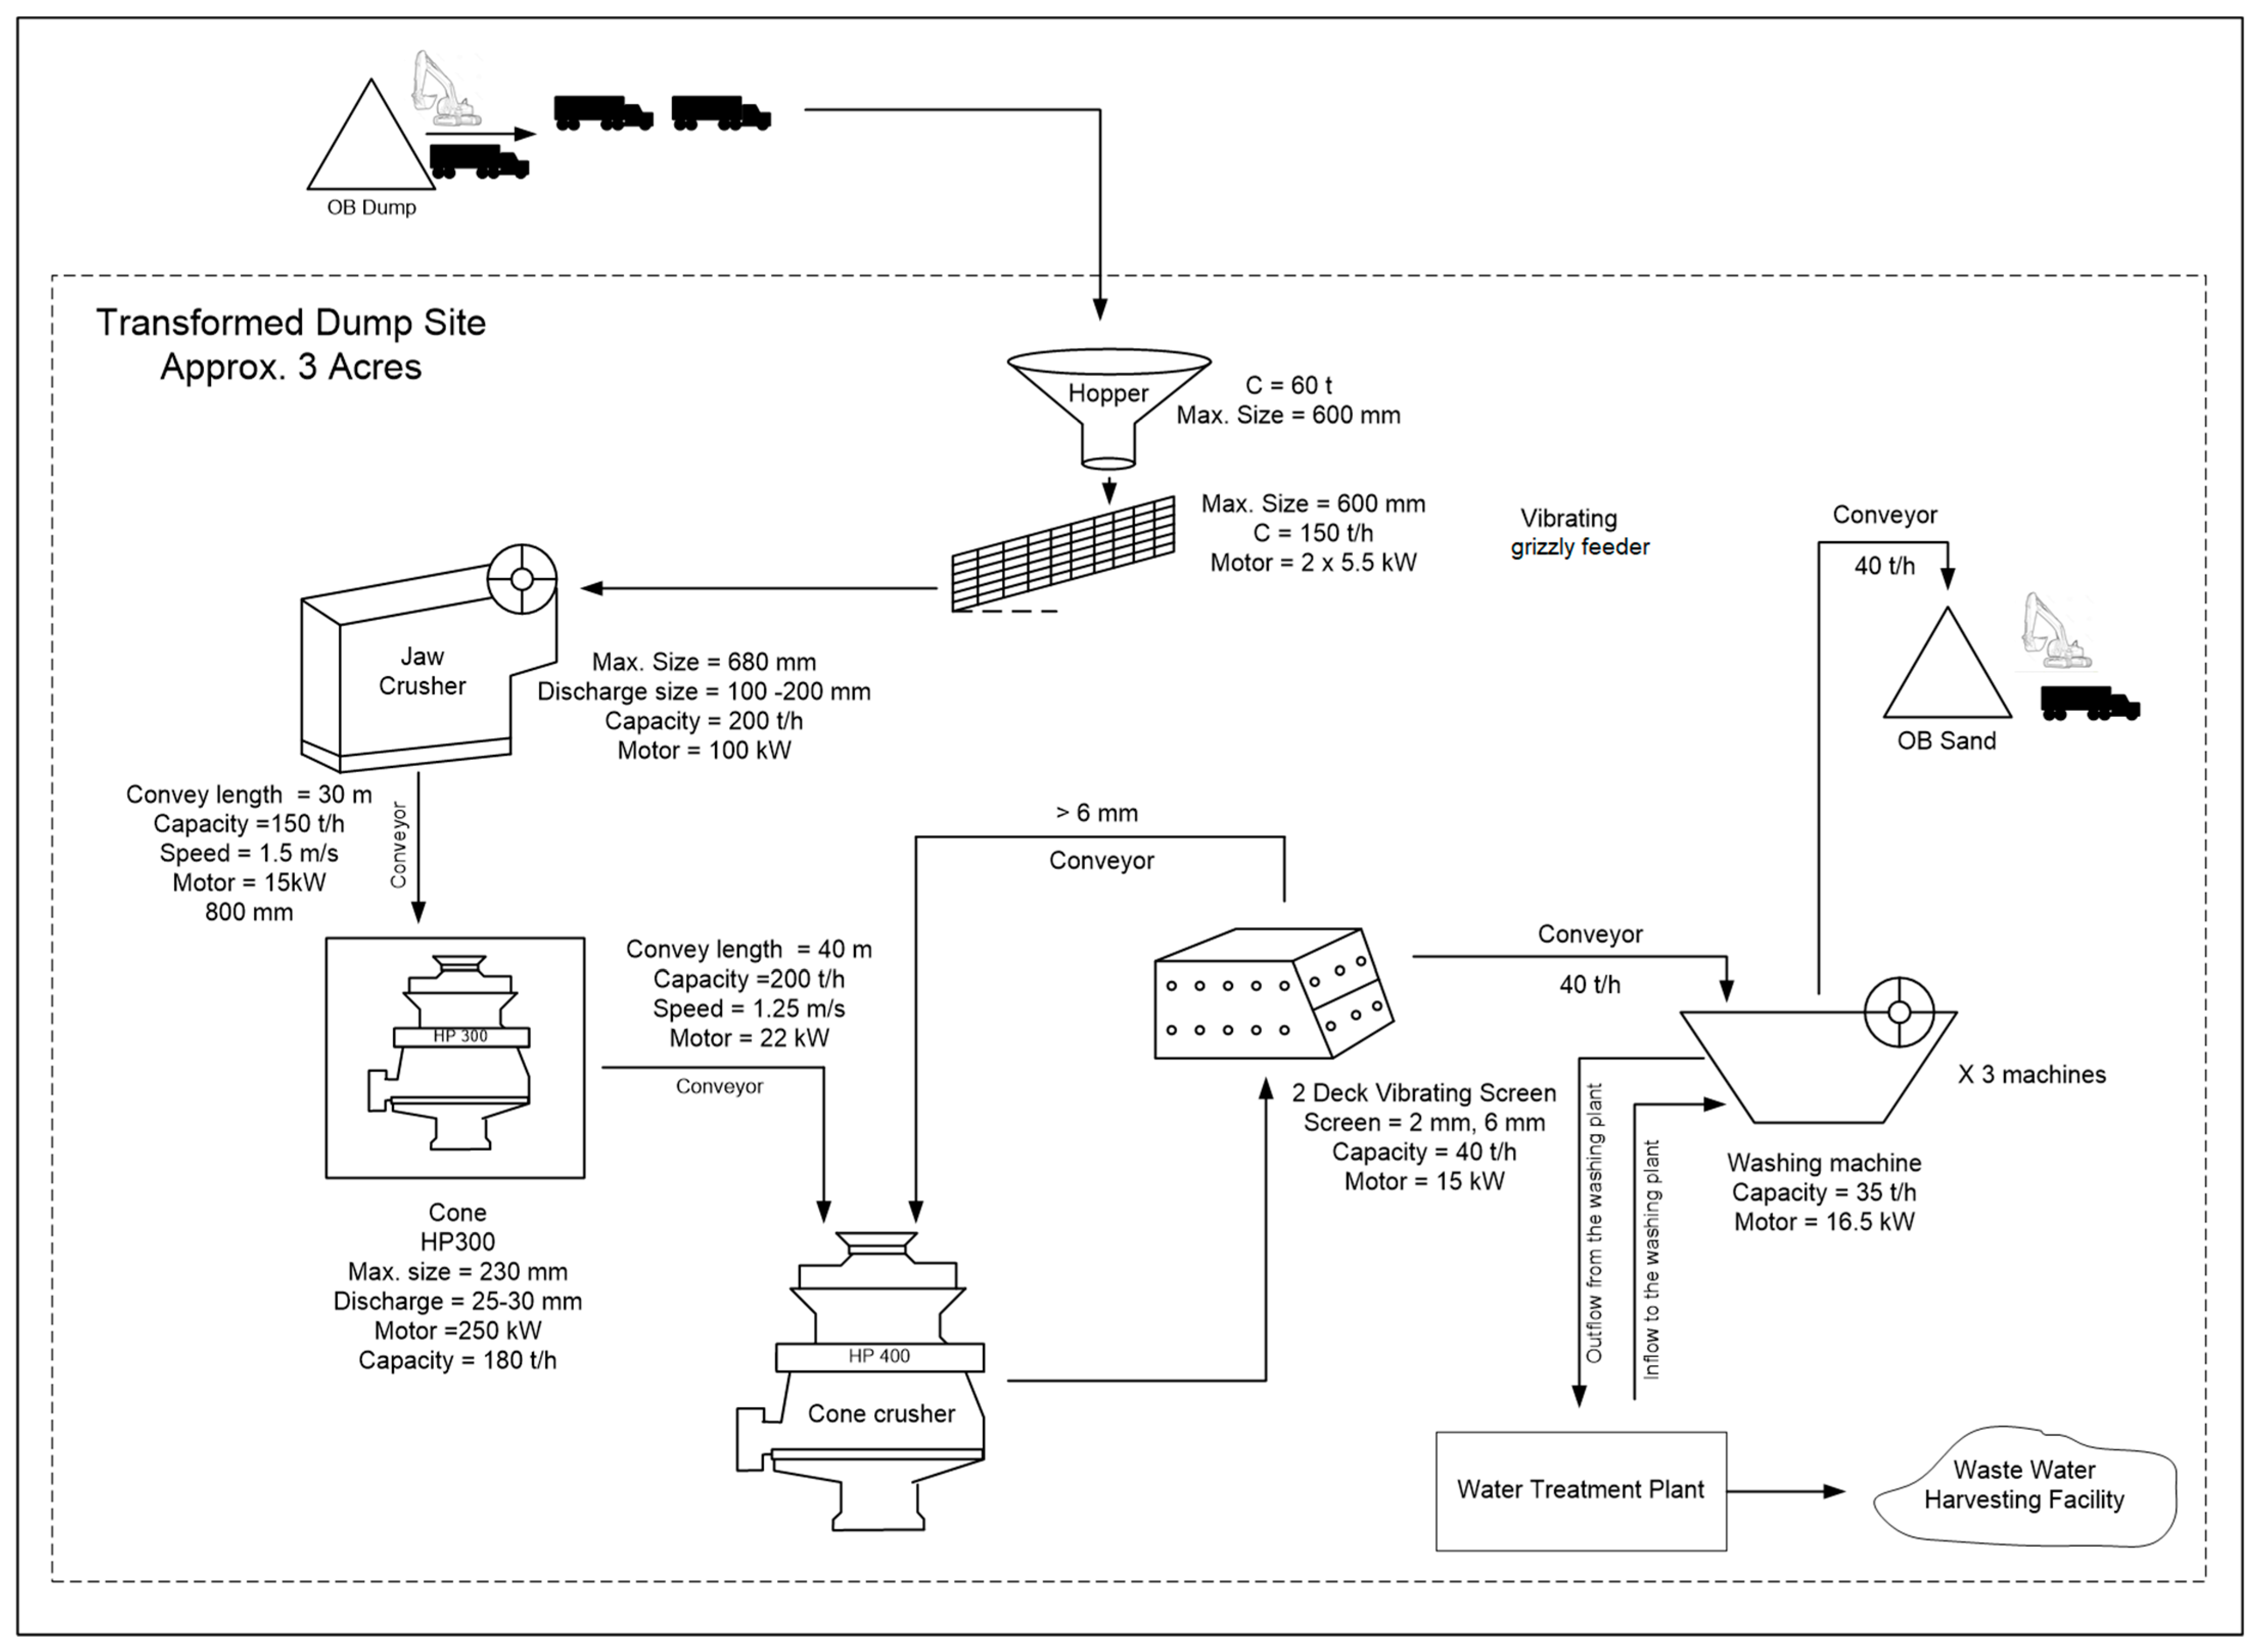
2.1.1. System Boundary

The system boundary for the present study includes transportation of the OBR from the dump site to the processing plant, crushing of the OBR to OBS, conveyancing to the processing subunits, washing of the sand fraction, stocking of the finished product, and loading of the finished product into the lorry for transportation to the site as shown in Figure 2. The acquisition of land for setting up the plant is considered, and groundwater consumption estimated as 2 L per kg of sand washing is assumed for the calculation as input from nature.

2.1.2. Functional Unit

The functional unit in the present study is defined as the processing of 1 ton of OBS from 1 ton of OBR starting from the acquisition of land to the final finished product.

2.2. Life Cycle Inventory (LCI)

This phase covers identifying and quantifying the environmental loads caused by the different processes involved in the processing plant. Since OBR is not a well-known building material, the data used in the present study was collected from an operational plant for natural aggregate near the institute campus with some modifications (capacity of sand crusher, sand washing unit, screen size, size of conveyor belt, and related power consumption, for optimal operational efficiency) for operating a similar processing plant for producing OBS. The LCI of transportation, fuel, natural gas, electricity, solar heat, and water consumption were obtained from the Ecoinvent 3.0 database. A land area of 3 acres is considered for setting up a processing plant of 150TPH capacity operating 8 h per day. The distance of the processing unit from the dump site to the processing plant is varied (0.5 km, 5 km, 50 km, and 200 km) to calculate the impact of location distance on environmental indicators. In a similar way, the change in the quantity (2 L, 5 L, and 10 L) and source (nature or the technosphere) of water used to wash the sand are also investigated
OBR obtained from the dumpsite is not considered for impact assessment, regarded as the industrial waste of coal mining industries during coal extraction. The impact evaluation is deemed to begin from transforming dumpsite land to setting up the processing plant. The life cycle of OBR involves loading the dump truck using poclain at a diesel consumption rate of 9 L/h (liters per hour), and the density of diesel is considered as 0.85 g/cc. The dump truck transporting the OBR to the processing plant consumes diesel at 2 L/h. The installed grizzly feeder, cone crusher, conveyor, vibrating screen and washing plant, and the number of units are selected in line with the plant’s capabilities of 150 TPH. The input feed size, discharge size, capacity, and motor power of each equipment are obtained from the JXCE mine machinery factory database available on the company’s website [19]. The complete processing under the system boundary is modelled and analyzed using the commercially available software package SimaPro 9®. SimaPro is a sustainability assessment tool created by the Dutch business PRé Sustainability to model and examine the environmental effects of various processes, goods, and systems based on ISO 14040. SimaPro’s accessibility to numerous databases and impact assessment techniques facilitates simple modelling and produces incredibly transparent findings [16].

2.3. Life Cycle Impact Assessment (LCIA)

This phase quantifies the potential environmental impacts due to the quantified environmental load in the LCI phase of the product or process [20]. The LCIA of 1 ton of OBS produced from processing OBR is considered in the present study. In this stage, the environmental damage caused by each inventory process is linked. The database used is the Ecoinvent 3.0 database, and the method of impact assessment is CML-IA baseline/ EU3+ 2000. Several effect categories and characterization techniques for the impact assessment stage were proposed in 2001 by a team of scientists working under the direction of the CML (Center of Environmental Science of Leiden University). The CML-IA impact assessment approach is described as the midpoint strategy. If there are many options for compulsory impact categories, the baseline indicator is chosen using the best practice standard. These “baseline indicators” (problem-oriented approach) are category indicators at the “mid-point” level [21]. This method includes 11 mid-point impact categories that include ADP (kg Sb eq.), ADP_F (MJ), GWP (kg CO2 eq), ODP (kg CFC -11 eq), HT (kg 1,4-DB eq), FAET (kg 1,4-DB eq), MAET (kg 1,4-DB eq), TET (kg 1,4-DB eq), PCOD (kg C2H4 eq), AP (kg SO2 eq), and EP (kg PO4−3 eq).

3. Results

According to the CML-IA baseline technique, the results for several midpoint indicators for process M1, process M2, comparison of M1 and M2, the impact of change in source and quantity of water source, and the impact of changes in the location of the plant are discussed in this section.

3.1. Scenario Analysis

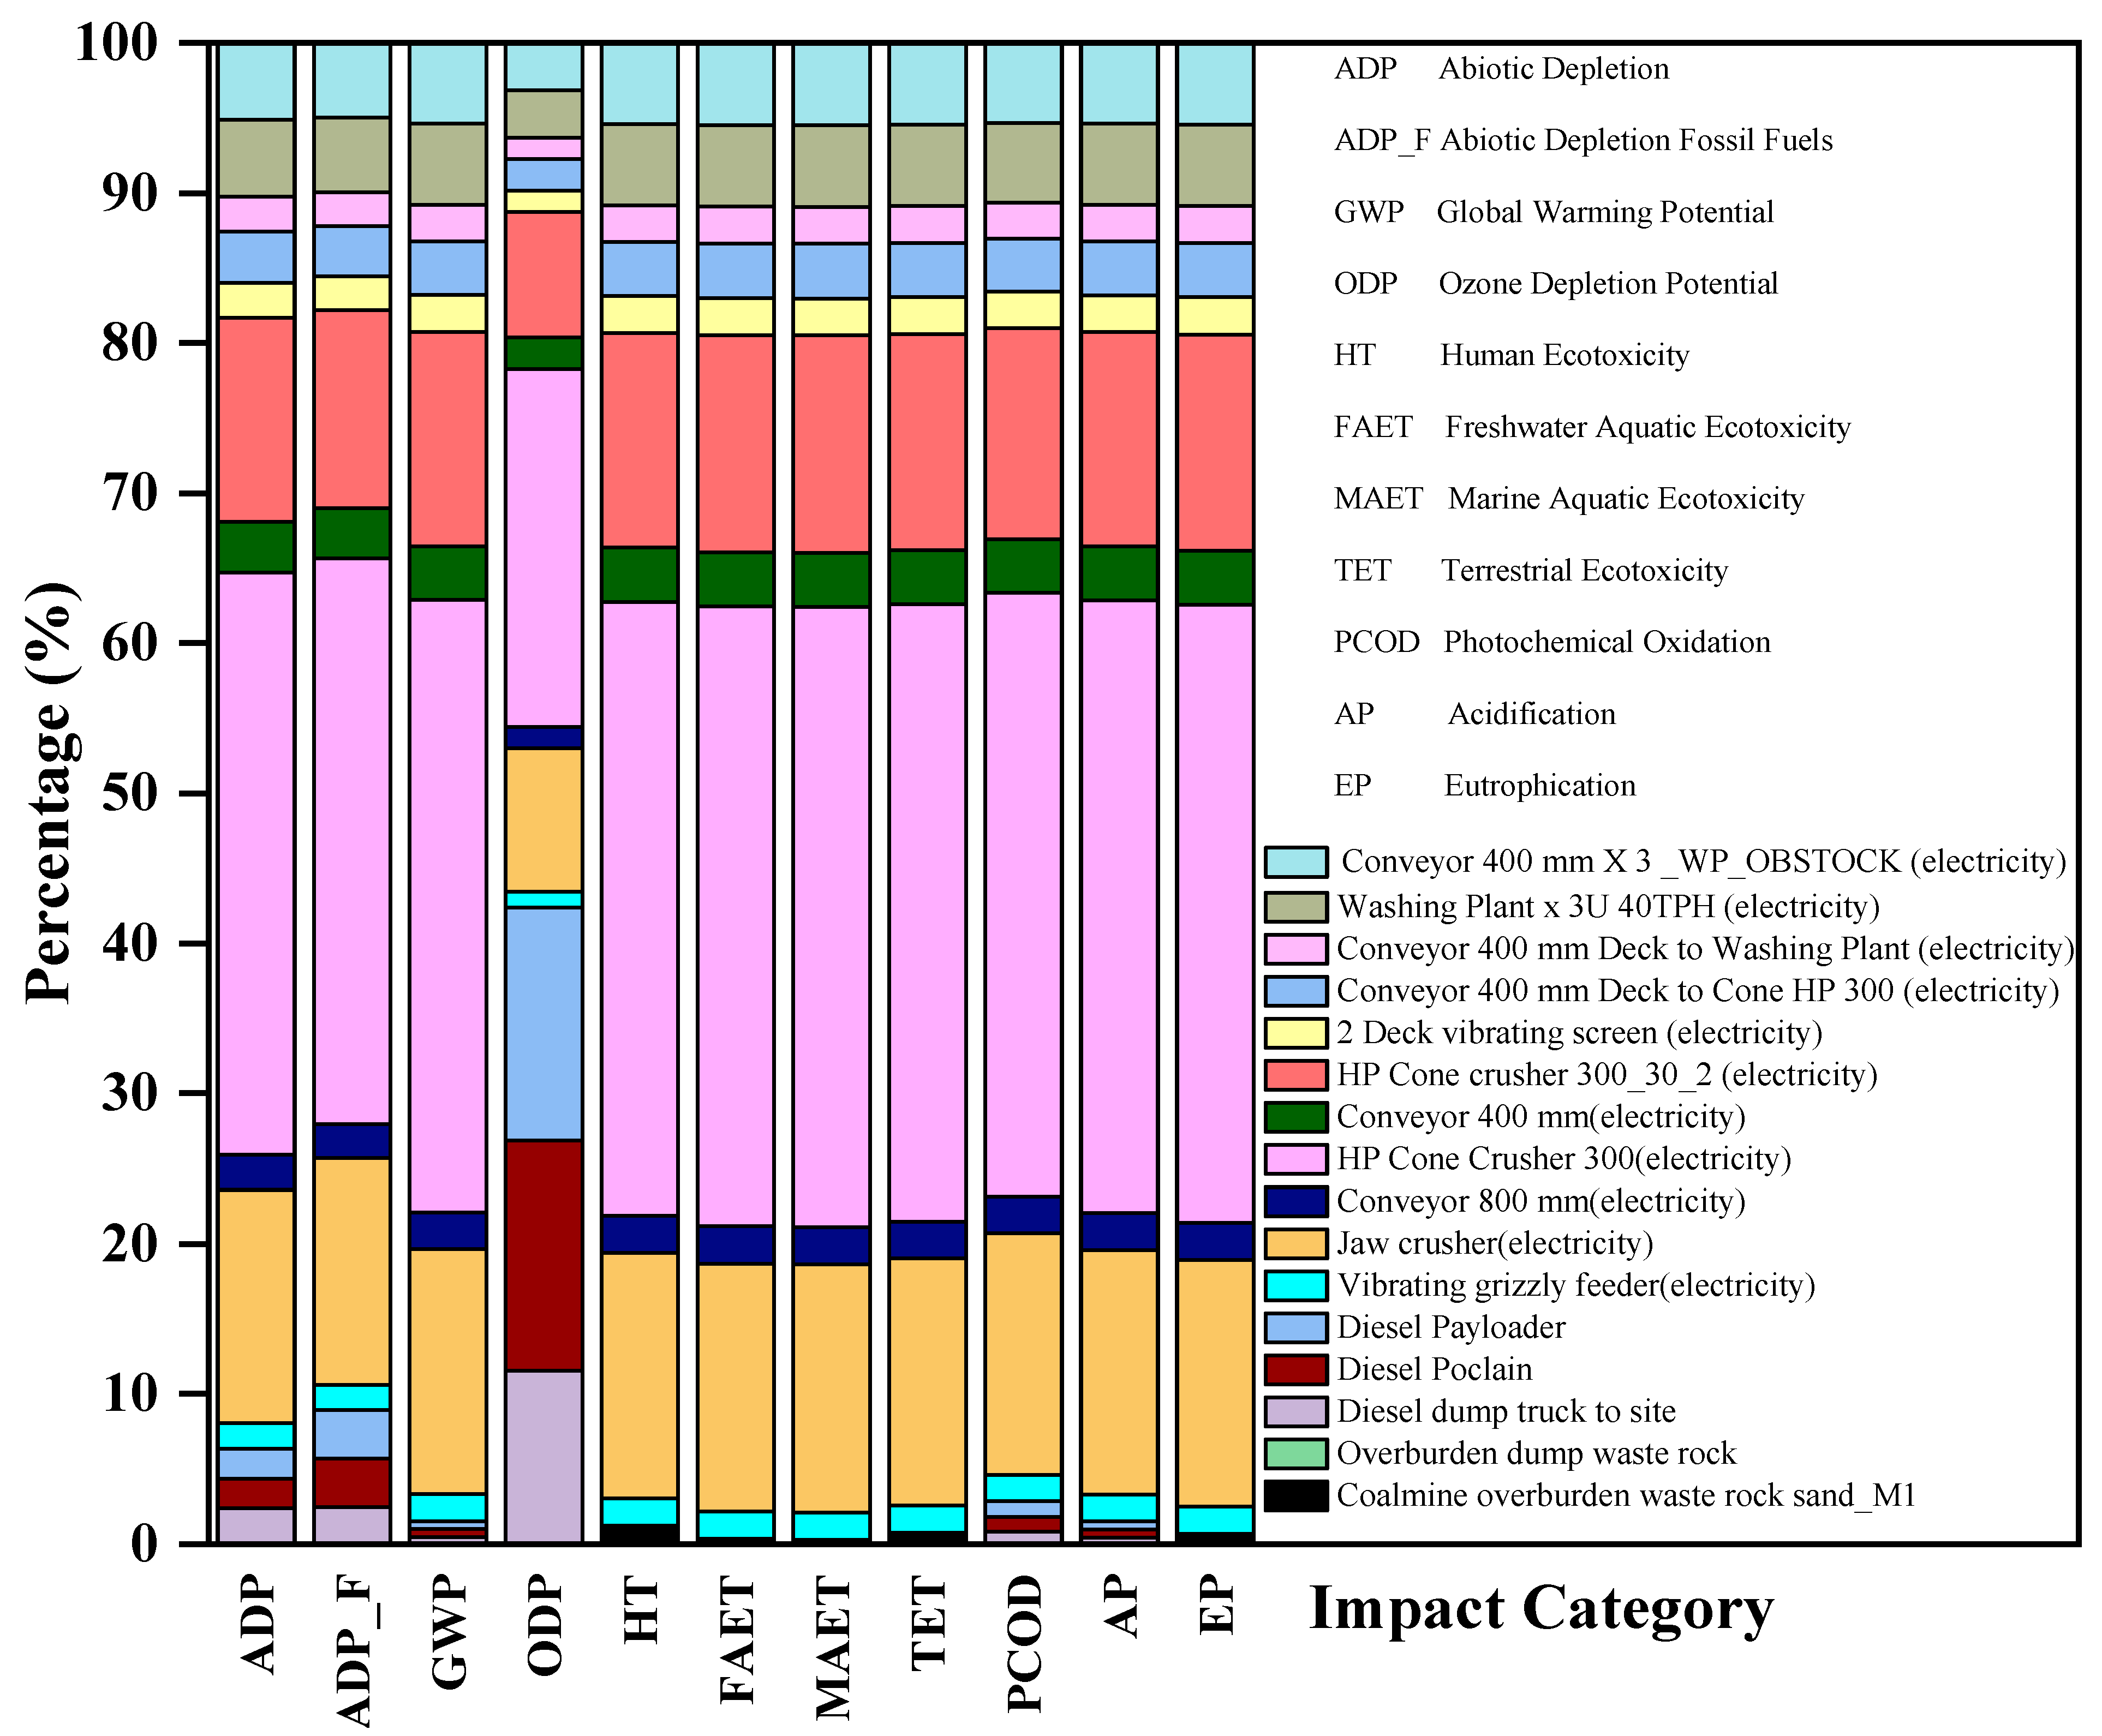
3.1.1. Environmental Impacts Due to Processing OBR to OBS Using M1

The processing of 1 ton OBR to 1 ton OBS through M1 contributes 8.30 × 10⁻⁷ kg Sb eq. of ADP, 86.13 MJ of ADP_F, 5.81 kg CO2 eq of GWP, 8.58 × 10⁻⁸ kg CFC-11 eq of ODP, 1.48 kg 1,4-DB eq of HT, 1.32 kg 1,4-DB eq of FAET, 8192.33 kg 1,4-DB eq of MAET, 0.00375 kg 1,4-DB eq of TET, 0.0014 kg C2H4 eq of PCOD, 0.0399 kg SO2 eq of AP, and 0.0093 kg PO4−3 eq of EP as shown in Table 1. The percentage contribution of the different subprocesses is shown in Figure 3. The crushing of OBR to OBS is the most critical process contributing 68% and 66% of ADP and ADP_F, respectively, due to the extraction of mineral and fossil fuels for the electricity requirement of the crushers. It contributes 72% of the total for HT, FAET, MAET, TET, and EP, each due to the emission of toxic substances during electricity production into the human environment, freshwater ecosystems, marine ecosystems, and terrestrial ecosystems, and the release of macronutrients in the environment. It also contributes 71% of the GWP and PCOD, respectively, due to the emission of greenhouse gases and the formation of reactive substances harmful to human health and the ecosystem. However, the emissions caused by the process M1 are 0.75% in ADP, 2.36% in ADP_F, 1.5% in AP, 3.8% in EP, 1.8% in GWP, and 0.98% in PCOD impact categories compared to that of processing zircon sand [22]. Compared to silica sand beneficiation by simulation, the emission caused by M1 is 17.6% in GWP, 1.84% in ODP, and 0.41% in PCOD impact categories [23]. It is important to note that the ReCiPe model is used to evaluate the emission in silica sand beneficiation.

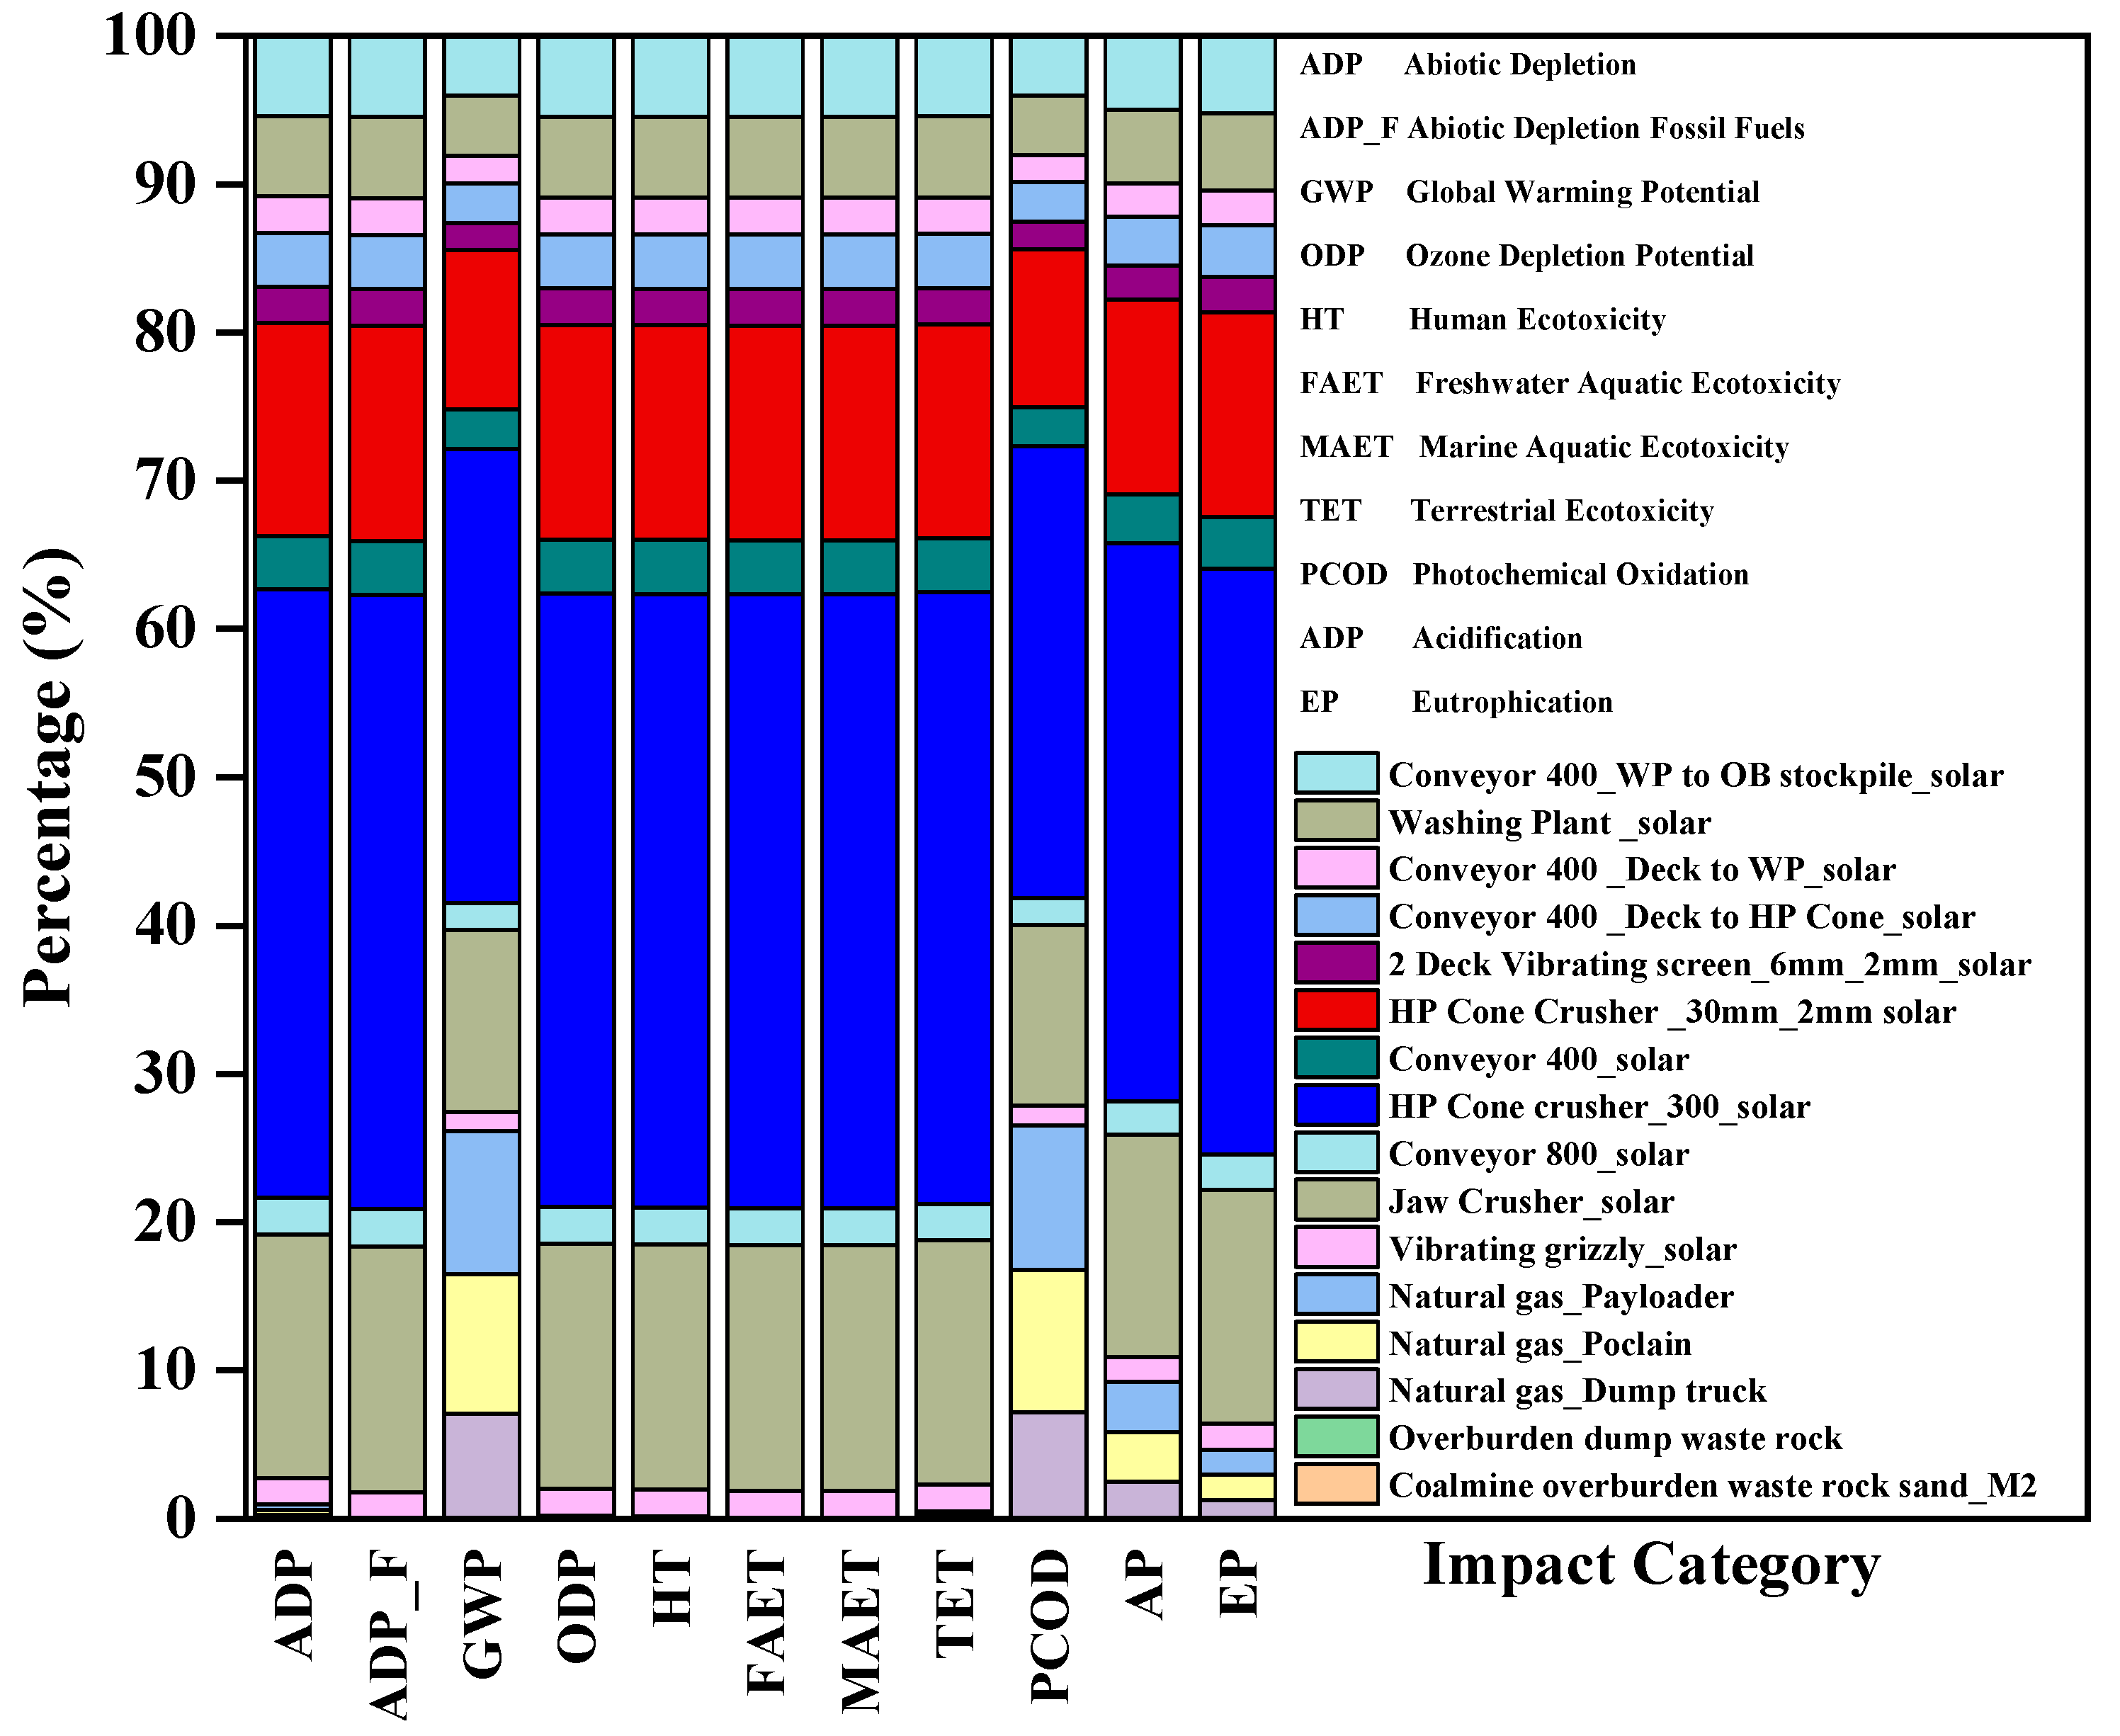
3.1.2. Environmental Impacts Due to Processing OBR to OBS Using M2

The processing of 1 ton OBR to 1 ton OBS through M2 contributes 4.36 × 10⁻⁶ kg Sb eq. of ADP, 2.59 MJ of ADP_F, 0.259 kg CO2 eq of GWP, 1.36 × 10⁻⁸ kg CFC-11 eq of ODP, 0.39 kg 1,4-DB eq of HT, 0.21 kg 1,4-DB eq of FAET, 890.43 kg 1,4-DB eq of MAET, 0.0060 kg 1,4-DB eq of TET, 0.00012 kg C2H4 eq of PCOD, 0.0023 kg SO2 eq of AP, and 0.000903 kg PO4−3 eq of EP as shown in Table 2. The percentage contributions of the different sub-processes are shown in Figure 4. Similar to M1, crushing is the most critical subprocess contributing the maximum fraction of the environmental impact at an almost similar percentage. This may be due to the significant portion of input energy consumed in the crushing process. The GWP and PCOD impact categories are reduced by 18% and 17%; there is a 4% increase in each of the ADP and ADP_F categories. The other indicators are impacted to the same extent as in the case of M1. However, the emission caused by the process M2 is 3.96% in ADP, 0.06 % in ADP_F, 0.09 % in AP, 0.37 % in EP, and 0.08 % in both GWP and PCOD impact categories compared to that of processing zircon sand [22]. Compared to silica sand beneficiation by simulation, the emission caused by M2 is 0.78 % in GWP, 0.29% in ODP, and 0.03% in PCOD impact categories [23].
For the contribution of different subprocesses in the midpoint impact categories, refer to the Supplementary Material provided.

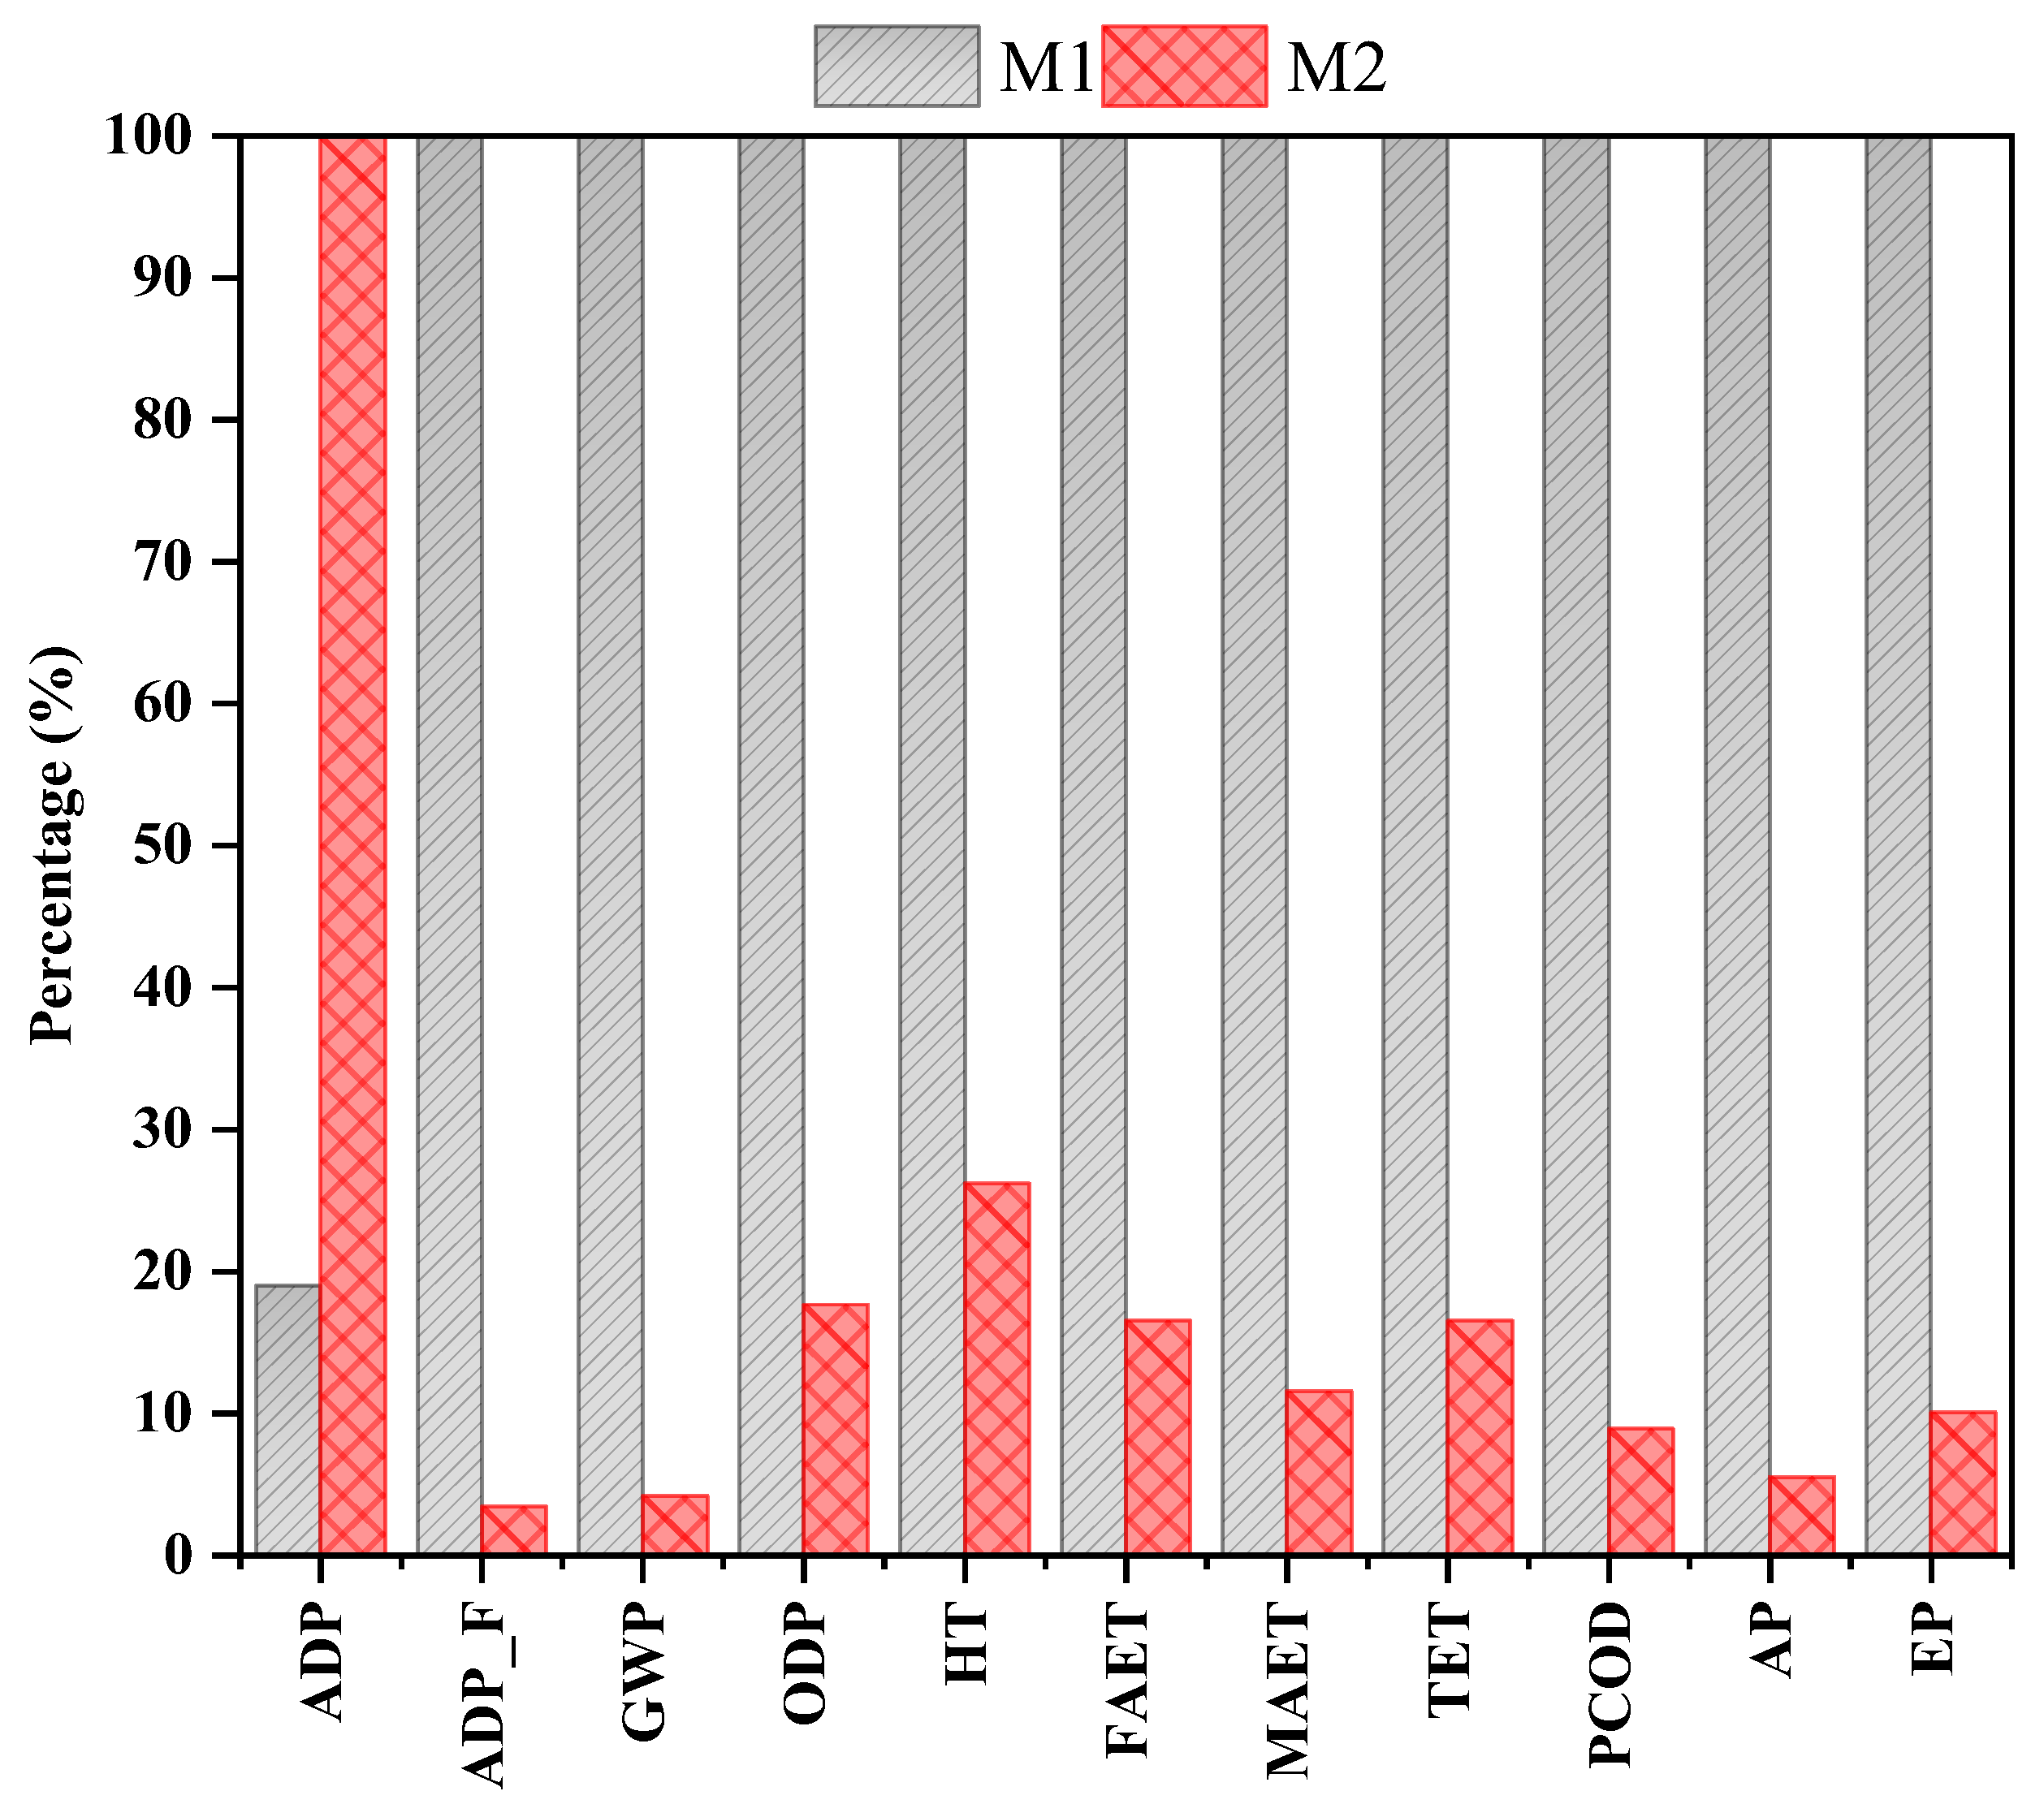
3.1.3. Comparison of M1 and M2

The comparative analysis of the conventional process (M1) and the replacement sustainable process (M2) is shown in Table 3. The processing of OBR to OBS through M2 reduced the ADP_F to 3%, GWP to 4%, ODP to 17%, HT to 27%, FAET to 17%, MAET to 11%, TET to 16%, PCOD to 8%, AP to 6%, and EP to 10% in comparison to M1. Although the ADP increased by 81%, considering the contribution of M1 as 100%, this may be due to natural gas processing requiring the extraction of minerals. The percentage contribution of the different subprocesses in M1 and M2 is shown in Figure 5. The replacement of diesel with natural gas and coal-powered electricity with solar power reduced emissions to a large extent.

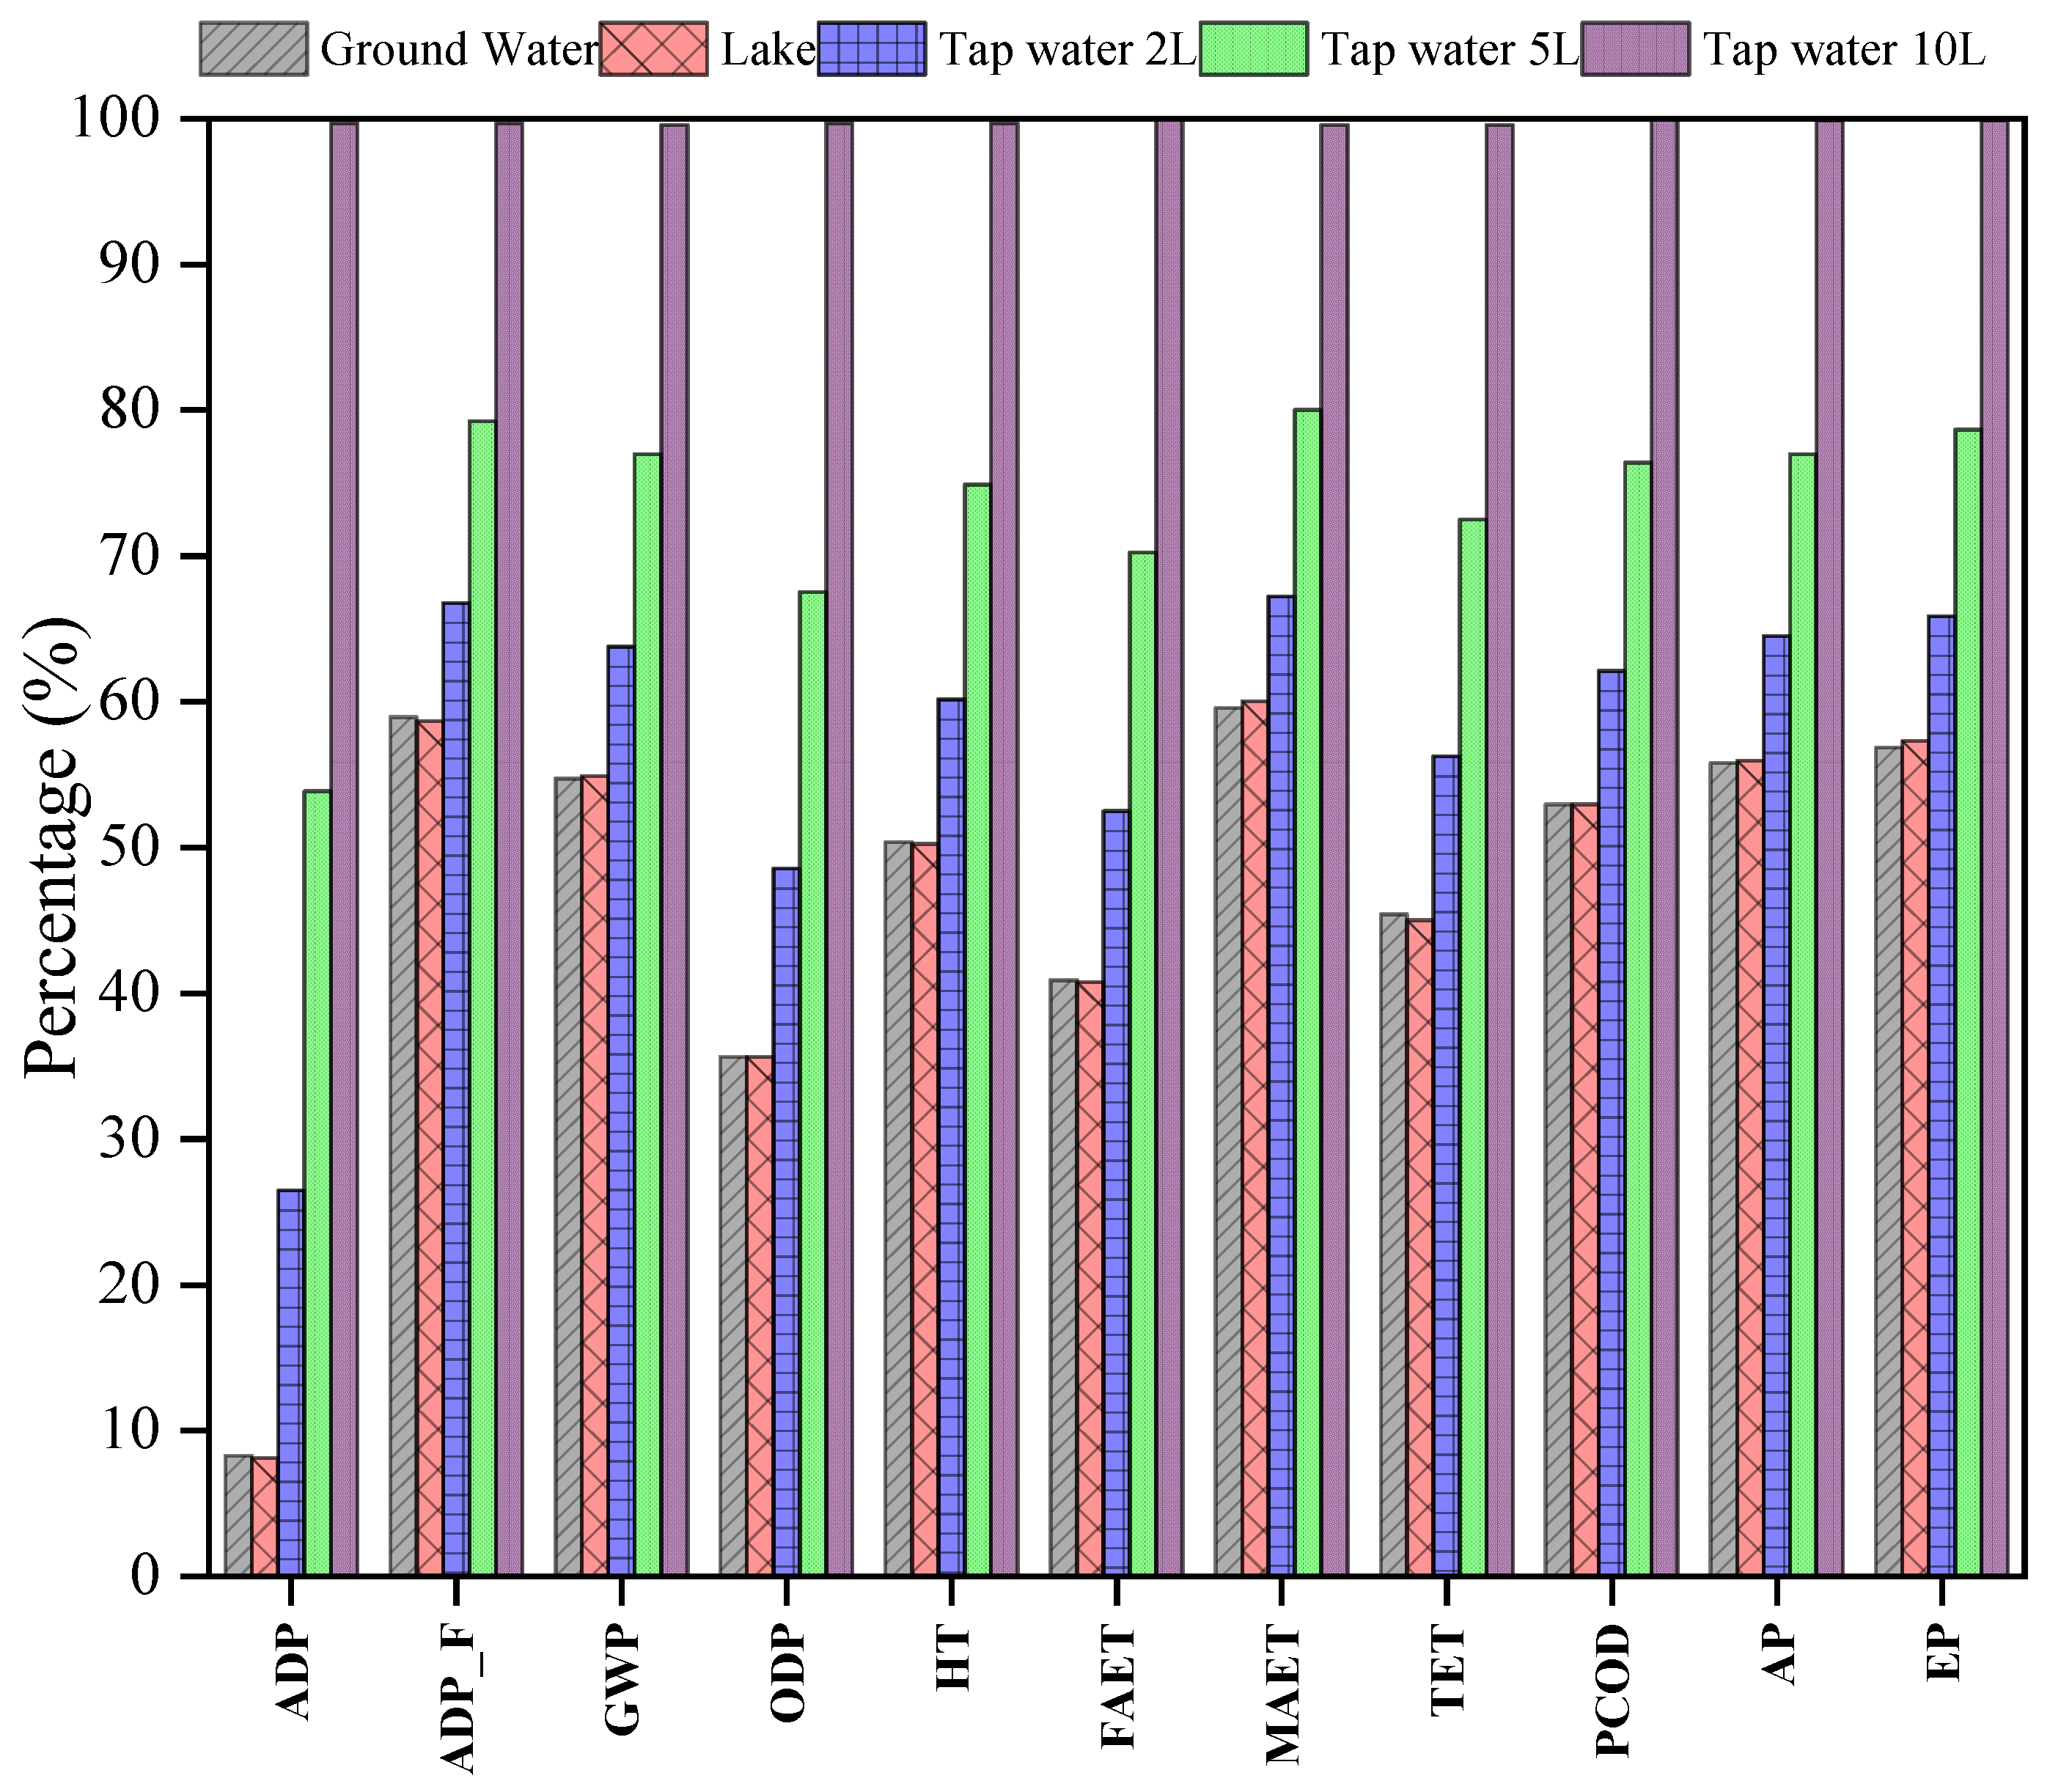
3.1.4. Impact of Change of Source and Quantity of Water

The impact of the change of water source to be used for washing the processed OBS is studied by changing the source from groundwater to lake water as input from nature, and then to tap water from the technosphere for the industrial process, as shown in Table 4. It is observed that there is no change in the indicators when the source changes from groundwater to lake water; this may be due to both the inputs being from nature so that they contribute equally to the indicators. However, when the source was changed from groundwater to tap water, it was observed that the ADP increased by 70%, ADP_F increased by 12%, GWP increased by 14%, ODP increased by 27%, HT increased by 17%, FAET increased by 23%, MAET increased by 12%, TET increased by 19%, PCOD increased by 15%, AP increased by 14%, and EP increased by 13%, considering 2 L of water per kg of sand washing using the process M1 as the baseline. The increase in the indicators may be collectively attributed to the emissions caused by processing and supplying tap water to the site.
The per liter increase in tap water quantity is found to increase the ADP by 1.2 × 10⁻⁶ kg Sb eq, ADP_F by 2.9 MJ, GWP by 2 kg CO2 eq, ODP by 3.8 × 10⁻⁸ kg CFC-11 eq, HT by 5.4 × 10 −1 kg 1,4-DB eq, FAET by 5.4 × 10 −1 kg 1,4-DB eq, MAET by 2.7 × 10 +3 kg 1,4-DB eq, TET by 1.4 × 10 −3 kg 1,4-DB eq, PCOD by 5.3 × 10 −4 kg C2H4 eq, AP by 1.4 × 10 −2 kg SO2 eq, and EP by 3.2 × 10⁻³ kg PO4−3 eq. The percentage contribution of each case is shown in Figure 6. These increases may be due to the reason stated above.

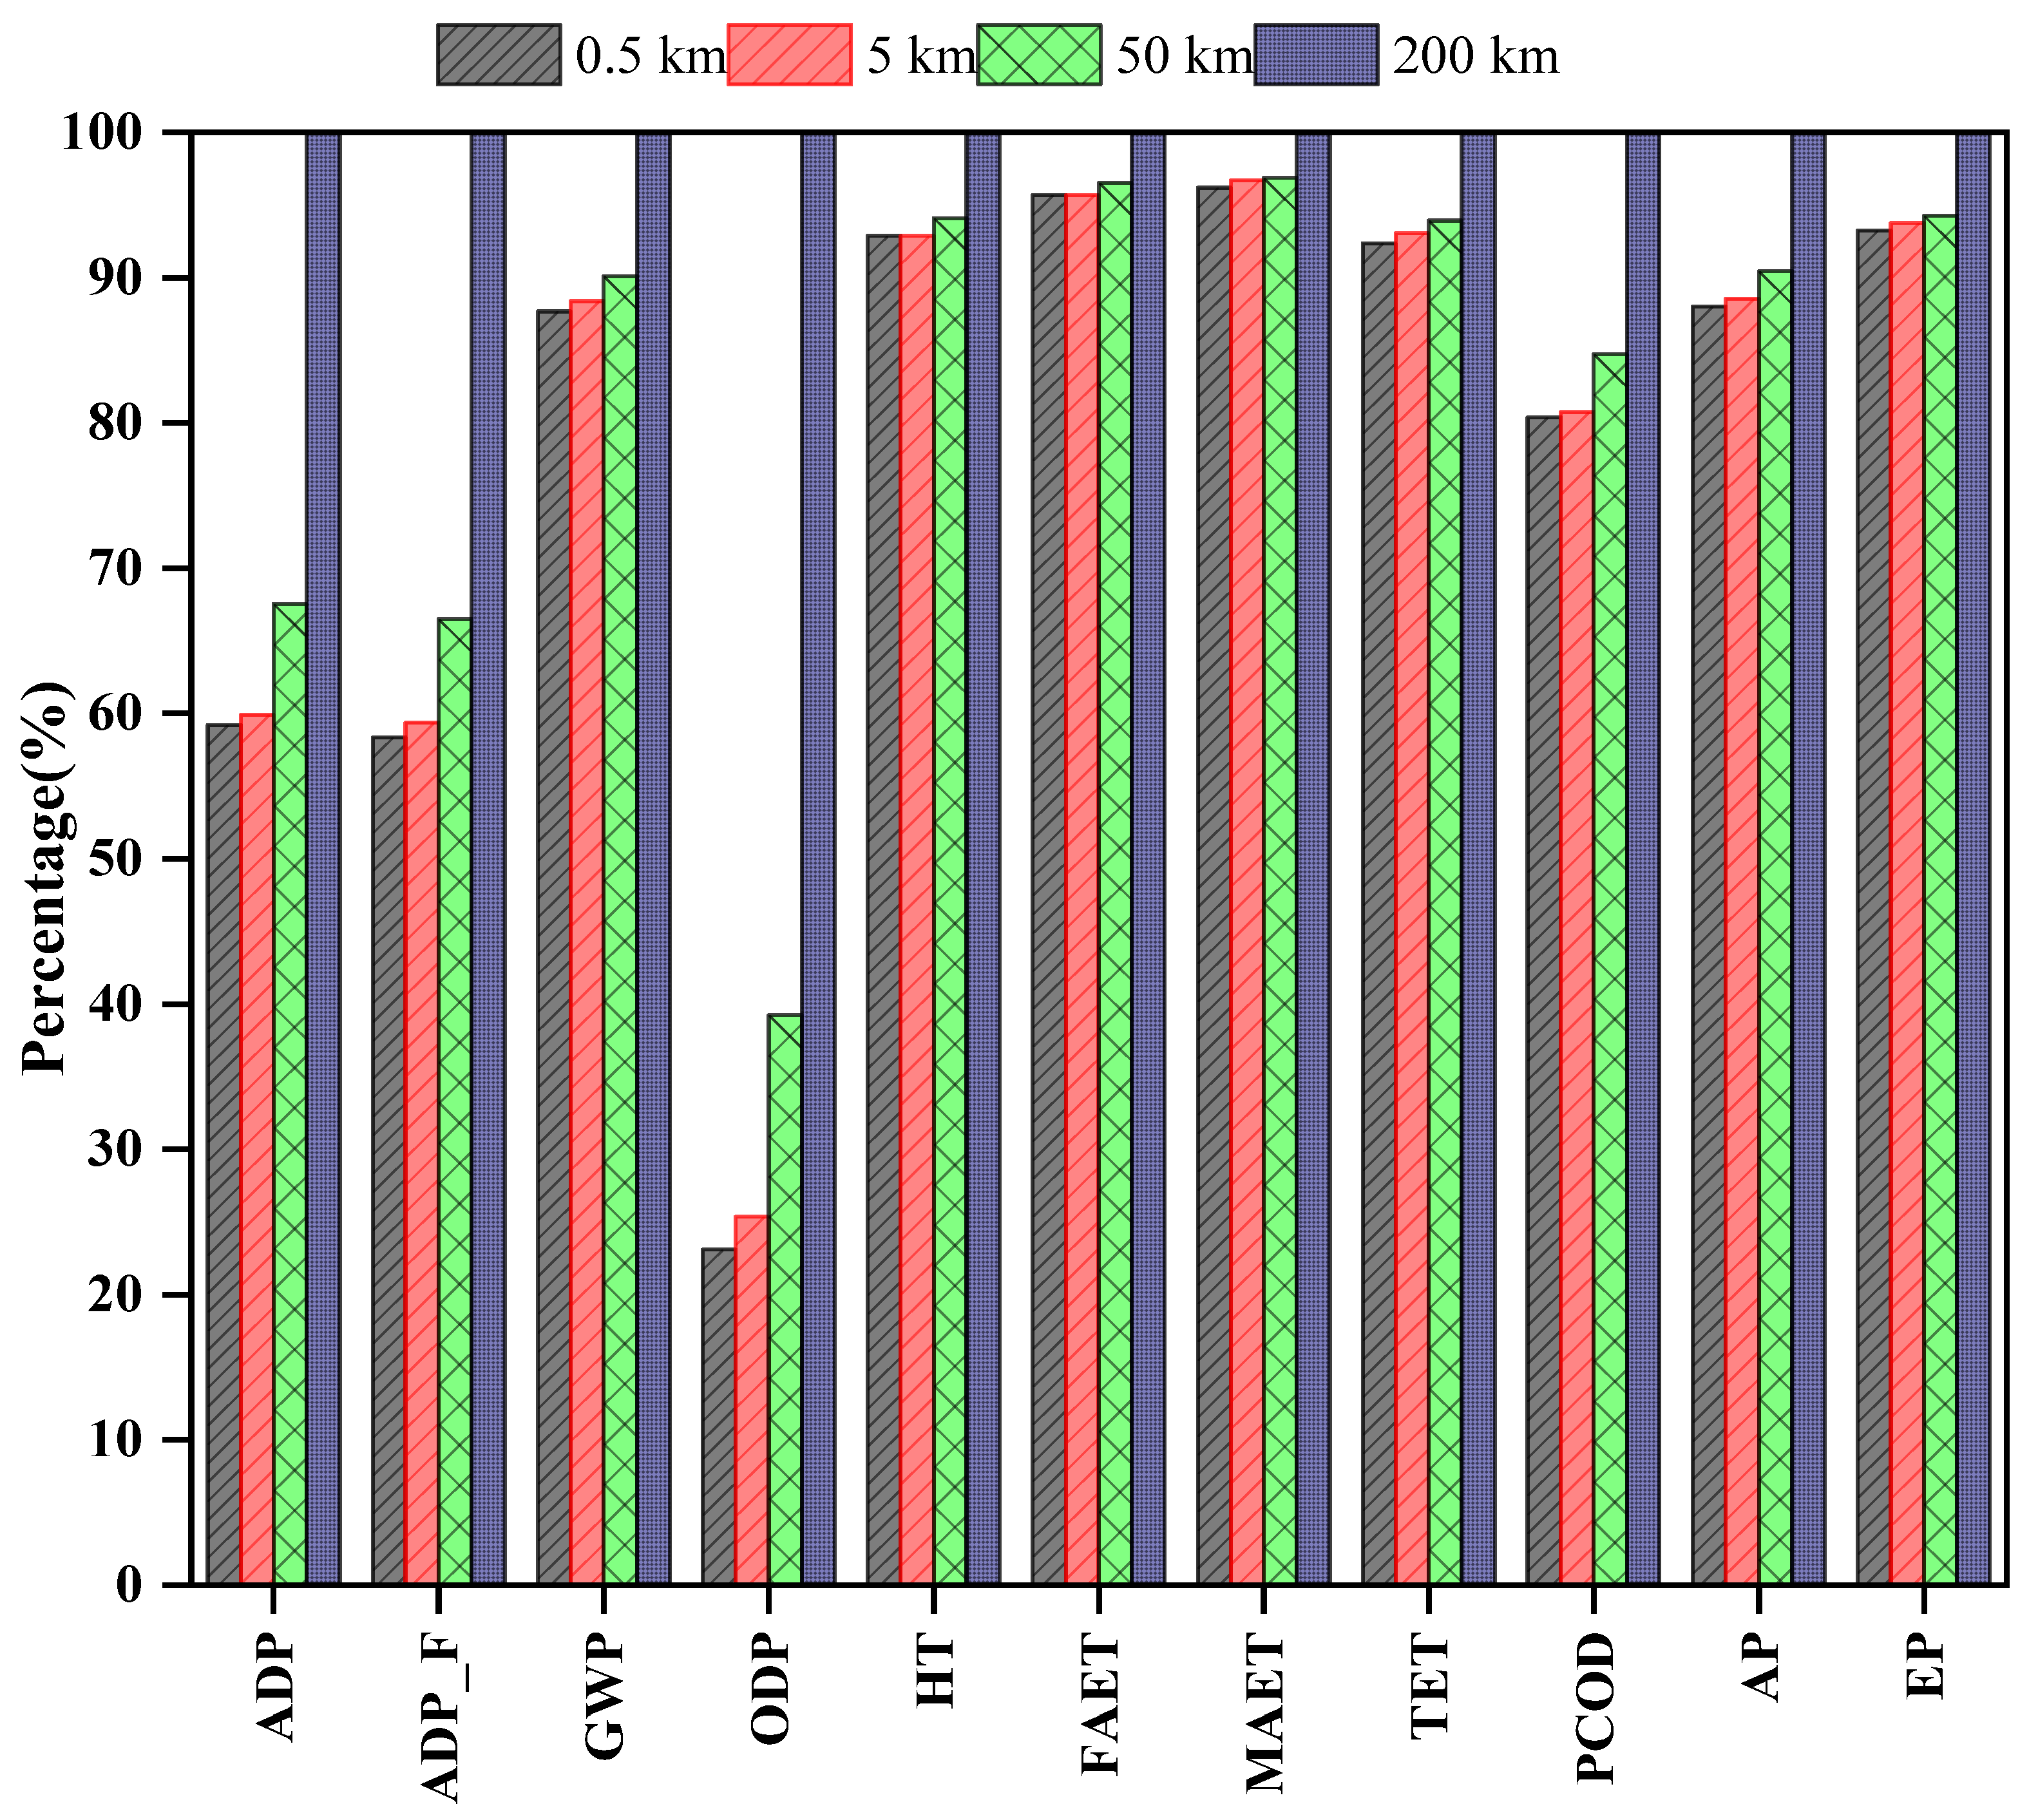
3.1.5. Impact of Change in Location of the Processing Plant

The impact of a change in the location of the processing plant is studied by considering the minimum distance of haulage from the dump to be 0.5 km, 5 km, 50 km, and 200 km. It was assumed that an already operational crushing plant exists 5 km, 50 km, and 200 km from the dump site. The percentage contribution of each case is shown in Figure 7, and the absolute contribution is tabulated in Table 5. It is observed that ADP and ADP_F increased by 2%, ODP increased by 9%, and POF increased by 1%. There was an insignificant impact on GWP, HT, FAET, MAET, TET, AP, and EP when the distance was assumed to be 5 km compared to 0.5 km (baseline). When the distance was considered to be 50 km, ADP and ADP_F increased by 14%, ODP increased by 64%, GWP and AP increased by 3%, POF increased by 5%, and HT, FAET, MAET, and TET increased by 1% in comparison to the baseline. In the case of the 200 km assumed location, it is found that ADP and ADP_F increased by approximately 60%, GWP increased by 12%, ODP increased by 195%, PCOD increased by 22%, and AP increased by 12%. HT and TET increased by 7%, EP increased by 6%;, and FAET and MAET increased by 3% compared to the baseline. The increase in the indicators is considered to be due to the emissions caused by diesel-burning in the dump truck for conveying the OBR to the processing unit.

4. Conclusions

Based on the analysis of different scenarios using the Ecoinvent 3.0 database as the LCI and CML_IA baseline for the impact assessment method, the following conclusions may be drawn:
  • M2 processing of OBR to OBS compared to M1 is more environmentally sustainable in all impact categories other than ADP, which increased by 81%. Natural gas-operated engines is used for loading and hauling. Solar energy is used to operate the processing equipment in place of conventional coal-powered electricity.
  • The use of tap water for industrial purposes increases the environmental load due to the processing and transfer of water to the site. This can be improved by recycling water at the site by installing a wastewater treatment plant, but the treatment plant’s life cycle assessment also needs to be studied. A better-optimized use of water is required to control the environmental load due to water consumption.
  • The change of location within a 5 km radius of the dump does not significantly contribute to the environmental load. Transportation is the major contributing factor in the processing of OBR to OBS. This can be resolved by developing a mobile crushing unit to produce application-specific gradation wherever possible, whether at the dump or the site of the application of OBS.
  • The outcomes show that OBR processing as an alternative to natural sand can be accomplished sustainably, ending several mining-related problem activities. Additionally, this will create employment opportunities for the local population, with a beneficial impact on society.
  • Current material specifications and standards do not encompass OB as an aggregate. Hence, the future efforts of researchers and policymakers should be directed towards this issue.

Supplementary Materials

The following supporting information can be downloaded at: https://www.mdpi.com/article/10.3390/su142214853/s1.

Author Contributions

Conceptualization, A.M., S.K.D. and K.R.R.; methodology, A.M., S.K.D. and K.R.R.; software, K.R.R. and S.K.D.; formal analysis, K.R.R., S.K.D. and A.M.; writing—original draft preparation, A.M.; writing—review and editing, K.R.R. and S.K.D.; supervision, K.R.R. and S.K.D.; project administration, S.K.D.; funding acquisition, S.K.D. All authors have read and agreed to the published version of the manuscript.

Funding

This research was funded by Ministry of Education, Government of India, SPARC Project No. P1207 titled “Geoenvironmental and Geotechnical Issues of Coal Mine Overburden”.

Institutional Review Board Statement

Not Applicable.

Informed Consent Statement

Not Applicable.

Data Availability Statement

All the data is reported within this article.

Conflicts of Interest

The authors declare no conflict of interest.

References

  1. Torres, A.; Simoni, M.U.; Keiding, J.K.; Müller, D.B.; zu Ermgassen, S.O.; Liu, J.; Jaeger, J.A.; Winter, M.; Lambin, E.F. Sustainability of the Global Sand System in the Anthropocene. One Earth 2021, 4, 639–650. [Google Scholar] [CrossRef]
  2. Fernandes, J.; Peixoto, M.; Mateus, R.; Gervásio, H. Life Cycle Analysis of Environmental Impacts of Earthen Materials in the Portuguese Context: Rammed Earth and Compressed Earth Blocks. J. Clean. Prod. 2019, 241, 118–286. [Google Scholar] [CrossRef] [Green Version]
  3. Skarzyńska, K.M. Reuse of Coal Mining Wastes in Civil Engineering—Part 1: Properties of Minestone. Waste Manag. 1995, 15, 3–42. [Google Scholar] [CrossRef]
  4. Skarzyńska, K.M. Reuse of Coal Mining Wastes in Civil Engineering-Part 2: Utilization of Minestone. Waste Manag. 1995, 15, 83–126. [Google Scholar] [CrossRef]
  5. Farjana, S.H.; Huda, N.; Mahmud, M.A.P. Impacts of Aluminum Production: A Cradle to Gate Investigation Using Life-Cycle Assessment. Sci. Total Environ. 2019, 663, 958–970. [Google Scholar] [CrossRef]
  6. Sjunnesson, J. Life Cycle Assessment of Concrete. Master’s Thesis, Lund University, Lund, Sweden, 2005. [Google Scholar]
  7. Teh, S.H.; Wiedmann, T.; Castel, A.; de Burgh, J. Hybrid Life Cycle Assessment of Greenhouse Gas Emissions from Cement, Concrete and Geopolymer Concrete in Australia. J. Clean. Prod. 2017, 152, 312–320. [Google Scholar] [CrossRef] [Green Version]
  8. Huntzinger, D.N.; Eatmon, T.D. A Life-Cycle Assessment of Portland Cement Manufacturing: Comparing the Traditional Process with Alternative Technologies. J. Clean. Prod. 2009, 17, 668–675. [Google Scholar] [CrossRef]
  9. Weil, M.; Dombrowski, K.; Buchwald, A. Life-Cycle Analysis of Geopolymers. In Geopolymers Structures, Processing, Properties and Industrial Applications; Woodhead Publishing: Cambridge, UK, 2009; pp. 194–210. [Google Scholar] [CrossRef]
  10. Salas, D.A.; Ramirez, A.D.; Ulloa, N.; Baykara, H.; Boero, A.J. Life Cycle Assessment of Geopolymer Concrete. sConstr. Build. Mater. 2018, 190, 170–177. [Google Scholar] [CrossRef]
  11. Korre, A.; Durucan, S. Life Cycle Assessment of Aggregates. In EVA025—Final Report: Aggregates Industry Life Cycle Assessment Model: Modelling Tools and Case Studies; Waste and Resources Action Programme: Oxon, UK, 2009; pp. 1–41. [Google Scholar]
  12. Shi, X.; Mukhopadhyay, A.; Zollinger, D. Sustainability Assessment for Portland Cement Concrete Pavement Containing Reclaimed Asphalt Pavement Aggregates. J. Clean. Prod. 2018, 192, 569–581. [Google Scholar] [CrossRef]
  13. Park, W.J.; Kim, T.; Roh, S.; Kim, R. Analysis of Life Cycle Environmental Impact of Recycled Aggregate. Appl. Sci. 2019, 9, 1021. [Google Scholar] [CrossRef] [Green Version]
  14. Djadouni, H.; Trouzine, H.; Gomes Correia, A.; Miranda, T.F.d.S. Life Cycle Assessment of Retaining Wall Backfilled with Shredded Tires. Int. J. Life Cycle Assess. 2019, 24, 581–589. [Google Scholar] [CrossRef]
  15. Cuenca-Moyano, G.M.; Martín-Morales, M.; Bonoli, A.; Valverde-Palacios, I. Environmental Assessment of Masonry Mortars Made with Natural and Recycled Aggregates. Int. J. Life Cycle Assess. 2019, 24, 191–210. [Google Scholar] [CrossRef]
  16. Suresh, D.; Chawla, S. Comparative Life Cycle Assessment of Railway Subballast Layer with Natural and Coal Overburden Aggregates in India. Int. J. Life Cycle Assess. 2022, 27, 704–718. [Google Scholar] [CrossRef]
  17. ISO 14040; Environmental Management-Life Cycle Assessment, Principles and Guidelines. International Organization for Standardization: Geneva, Switzerland, 2006.
  18. ISO 14044; Environmental Management-Life Cycle Assessment, Life Cycle Impact Assessment. International Organization for Standardization: Geneva, Switzerland, 2006.
  19. JXCE JXCE Mining Equipment. Available online: https://www.jxscmachine.com/product/ (accessed on 17 October 2022).
  20. Rebitzer, G.; Ekvall, T.; Frischknecht, R.; Hunkeler, D.; Norris, G.; Rydberg, T.; Suh, S.; Weidema, B.P.; Pennington, D.W. Life Cycle Assessment Part 1: Framework, Goal and Scope Definition, Inventory Analysis, and Applications. Environ. Int. 2004, 30, 701–720. [Google Scholar] [CrossRef] [PubMed]
  21. SimaPro Database Manual Methods Library, Database & Support Team at PRé Sustainabilit. 2022, pp. 1–56. Available online: https://simapro.com/wp-content/uploads/2022/07/DatabaseManualMethods.pdf (accessed on 27 September 2022).
  22. Gediga, J.; Morfino, A.; Finkbeiner, M.; Schulz, M.; Harlow, K. Life Cycle Assessment of Zircon Sand. Int. J. Life Cycle Assess. 2019, 24, 1976–1984. [Google Scholar] [CrossRef] [Green Version]
  23. Grbeš, A. A Life Cycle Assessment of Silica Sand: Comparing the Beneficiation Processes. Sustainability 2016, 8, 11. [Google Scholar] [CrossRef]
Figure 1. Life cycle assessment framework.
Sustainability 14 14853 g001
Figure 2. Layout of the proposed processing plant.
Sustainability 14 14853 g002
Figure 3. Environmental impact due to individual subprocesses in M1.
Sustainability 14 14853 g003
Figure 4. Environmental impacts due to individual subprocesses in M2.
Sustainability 14 14853 g004
Figure 5. Comparative environmental impacts caused by M1 and M2 in percent.
Sustainability 14 14853 g005
Figure 6. Environmental impacts due to change in source and quantity of water for washing OBS.
Sustainability 14 14853 g006
Figure 7. Environmental impacts due to change in location of the processing unit.
Sustainability 14 14853 g007
Table 1. Environmental impacts due to process M1.
Impact CategoryADPADP_FGWPODPHTFAETMAETTETPCODAPEP
Unitkg Sb eqMJkg CO2 eqkg CFC-11 eqkg 1,4-DB eqkg 1,4-DB eqkg 1,4-DB eqkg 1,4-DB eqkg C2H4 eqkg SO2 eqkg PO4---eq
Total8.31 × 10−78.61 × 10+015.81 8.58 × 10−81.48 1.32 8.19 × 10+033.74 × 10−31.48 × 10−34.00 × 10−29.37 × 10−3
Coalmine overburden waste rock sand_M100006.83 × 10−3000000
Overburden dump
waste rock
00000000000
Diesel, low sulfur {RoW}|market for Dump truck _to site|Alloc Def, U1.97 × 10−82.11 2.59 × 10−29.94 × 10−93.50 × 10−31.60 × 10−37.59 9.16 × 10−61.20 × 10−51.74 × 10−41.92 × 10−5
Diesel {RoW}|market for Poclain|Alloc Def, U1.64 × 10−82.77 3.16 × 10−21.31 × 10−83.92 × 10−31.61 × 10−37.90 9.73 × 10−61.50 × 10−52.09 × 10−42.16 × 10−5
Diesel {RoW}|market for Payloader|Alloc Def, U1.67 × 10−82.82 3.21 × 10−21.33 × 10−83.98 × 10−31.64 × 10−38.03 9.88 × 10−61.52 × 10−52.12 × 10−42.19 × 10−5
vibrating grizzly feeder (electricity)1.42 × 10−81.43 1.04 × 10−19.01 × 10−102.67 × 10−22.40 × 10−21.49 × 10+026.76 × 10−52.63 × 10−57.18 × 10−41.70 × 10−4
Jaw Crusher
(electricity)
1.29 × 10−71.30 × 10+019.48 × 10−18.19 × 10−92.43 × 10−12.18 × 10−11.35 × 10+036.14 × 10−42.39 × 10−46.53 × 10−31.54 × 10−3
Conveyor 800 mm (electricity)1.93 × 10−81.95 1.42 × 10−11.23 × 10−93.64 × 10−23.27 × 10−22.03 × 10+029.21 × 10−53.58 × 10−59.79 × 10−42.31 × 10−4
HP Cone Crusher 300 (electricity)3.22 × 10−73.25 × 10+012.37 2.05 × 10−86.07 × 10−15.45 × 10−13.38 × 10+031.54 × 10−35.97 × 10−41.63 × 10−23.85 × 10−3
Conveyor 400 mm (electricity)2.84 × 10−82.86 2.09 × 10−11.80 × 10−95.34 × 10−24.80 × 10−22.98 × 10+021.35 × 10−45.25 × 10−51.44 × 10−33.39 × 10−4
HP Cone Crusher 300_30_2 (electricity)1.13 × 10−71.14 × 10+018.30 × 10−17.17 × 10−92.12 × 10−11.91 × 10−11.18 × 10+035.37 × 10−42.09 × 10−45.71 × 10−31.35 × 10−3
2 Deck Vibrating Screen (electricity)1.93 × 10−81.95 1.42 × 10−11.23 × 10−93.64 × 10−23.27 × 10−22.03 × 10+029.21 × 10−53.58 × 10−59.79 × 10−42.31 × 10−4
Conveyor 400 mm deck to cone HP 300 (electricity)2.84 × 10−82.86 2.09 × 10−11.80 × 10−95.34 × 10−24.80 × 10−22.98 × 10+021.35 × 10−45.25 × 10−51.44 × 10−33.39 × 10−4
Conveyor 400 mm Deck to Washing Plant(electricity)1.93 × 10−81.95 1.42 × 10−11.23 × 10−93.64 × 10−23.27 × 10−22.03 × 10+029.21 × 10−53.58 × 10−59.79 × 10−42.31 × 10−4
Washing Plant x 3U 40TPH(electricity)4.25 × 10−84.29 3.13 × 10−12.70 × 10−98.01 × 10−27.20 × 10−24.47 × 10+022.03 × 10−47.88 × 10−52.15 × 10−35.09 × 10−4
Conveyor 400 mm x 3_WP_OBSTOCK (electricity)4.25 × 10−84.29 3.13 × 10−12.70 × 10−98.01 × 10−27.20 × 10−24.47 × 10+022.03 × 10−47.88 × 10−52.15 × 10−35.09 × 10−4
Wastewater treatment, other emissions00000000000
Table 2. Environmental impacts due to process M2.
Impact CategoryADPADP_FGWPODPHTFAETMAETTETPCODAPEP
Unitkg Sb eqMJkg CO2 eqkg CFC-11 eqkg 1,4-DB eqkg 1,4-DB eqkg 1,4-DB eqkg 1,4-DB eqkg C2H4 eqkg SO2 eqkg PO4---eq
Total4.4 × 10−62.6 2.6 × 10−11.4 × 10−84.0 × 10−12.2 × 10−18.9 × 10+026.1 × 10−41.2 × 10−42.3 × 10−39.1 × 10−4
Coalmine overburden waste
rock sand_M2
00000000000
Overburden dump
waste rock
00000000000
Dump truck Natural gas_
Dump_to_plant
1.1 × 10−80.0 1.8 × 10−27.8 × 10−121.6 × 10−43.2 × 10−51.7 × 10−17.8 × 10−78.8 × 10−65.9 × 10−51.2 × 10⁻⁵
Poclain Natural gas_
Loading_dumptruck
1.5 × 10−80.0 2.5 × 10−21.0 × 10−112.1 × 10−44.3 × 10−52.3 × 10−11.0 × 10−61.2 × 10−57.8 × 10−51.5 × 10⁻⁵
Payloader Natural gas_
Loading_sand_truck
1.5 × 10−80.0 2.5 × 10−21.1 × 10−112.2 × 10−44.4 × 10−52.3 × 10−11.1 × 10−61.2 × 10−57.9 × 10−51.6 × 10⁻⁵
Vibrating grizzly
solar energy
7.9 × 10−84.7 × 10−23.5 × 10−32.5 × 10−107.2 × 10−34.0 × 10−31.6 × 10+011.1 × 10−51.6 × 10−63.9 × 10−51.6 × 10−5
Jaw crusher
solar energy
7.2 × 10−74.3 × 10−13.2 × 10−22.3 × 10−96.5 × 10−23.6 × 10−21.5 × 10+021.0 × 10−41.5 × 10−53.5 × 10−41.4 × 10−4
Conveyor_800_
_solar energy
1.1 × 10−76.5 × 10−24.8 × 10−33.4 × 10−109.8 × 10−35.4 × 10−32.2 × 10+011.5 × 10−52.2 × 10−65.3 × 10−52.1 × 10−5
HP_Cone_crusher_
300_solar energy
1.8 × 10−61.1 8.0 × 10−25.6 × 10−91.6 × 10−19.1 × 10−23.7 × 10+022.5 × 10−43.7 × 10−58.8 × 10−43.6 × 10−4
Conveyor_400__
solar energy
1.6 × 10−79.5 × 10−27.0 × 10−35.0 × 10−101.4 × 10−28.0 × 10−33.2 × 10+012.2 × 10−53.3 × 10−67.7 × 10−53.2 × 10−5
HP_Cone_crusher_
30mm_2mm_solar energy
6.3 × 10−73.8 × 10−12.8 × 10−22.0 × 10−95.7 × 10−23.2 × 10−21.3 × 10+028.8 × 10−51.3 × 10−53.1 × 10−41.3 × 10−4
2_Deck_vibrating Screen
_6mm_2mm__solar energy
1.1 × 10−76.5 × 10−24.8 × 10−33.4 × 10−109.8 × 10−35.4 × 10−32.2 × 10+011.5 × 10−52.2 × 10−65.3 × 10−52.1 × 10−5
Conveyor_400_Deck_
HP_Cone_solar energy
1.6 × 10−79.5 × 10−27.0 × 10−35.0 × 10−101.4 × 10−28.0 × 10−33.2 × 10+012.2 × 10−53.3 × 10−67.7 × 10−53.2 × 10−5
Conveyor_400_Deck_to_
Washing_plant__solar energy
1.1 × 10−76.5 × 10−24.8 × 10−33.4 × 10−109.8 × 10−35.4 × 10−32.2 × 10+011.5 × 10−52.2 × 10−65.3 × 10−52.1 × 10−5
Washing plant_
_solar energy
2.4 × 10−71.4 × 10−11.0 × 10−27.5 × 10−102.2 × 10−21.2 × 10−24.9 × 10+013.3 × 10−54.9 × 10−61.2 × 10−44.7 × 10−5
Conveyor_400_washingplan
t_to_OBstockpile_solar energy
2.4 × 10−71.4 × 10−11.0 × 10−27.5 × 10−102.2 × 10−21.2 × 10−24.9 × 10+013.3 × 10−54.9 × 10−61.2 × 10−44.7 × 10−5
Table 3. Comparative environmental impacts of methods M1 and M2.
Impact CategoryADPADP_FGWPODPHTFAETMAETTETPCODAPEP
Unitkg Sb eqMJkg CO2 eqkg CFC-11 eqkg 1,4-DB eqkg 1,4-DB eqkg 1,4-DB eqkg 1,4-DB eqkg C2H4 eqkg SO2 eqkg PO4---eq
Coalmine overburden
waste rock sand_M1
8.18 × 10−78.47 × 10+015.80 7.92 × 10−81.48 1.32 8.19 × 10+033.73 × 10−31.48 × 10−33.99 × 10−29.36 × 10−3
Coalmine overburden
waste rock sand_M2
4.35 × 10−62.60 2.48 × 10−11.36 × 10−83.95 × 10−12.19 × 10−18.90 × 10+026.08 × 10−41.17 × 10−42.30 × 10−38.99 × 10−4
Table 4. Comparative environmental impacts due to change in the source of water.
Impact CategoryADPADP_FGWPODPHTFAETMAETTETPCODAPEP
Unitkg Sb eqMJkg CO2 eqkg CFC-11 eqkg 1,4-DB eqkg 1,4-DB eqkg 1,4-DB eqkg 1,4-DB eqkg C2H4 eqkg SO2 eqkg PO4---eq
Coalmine overburden waste rock
sand_M1_2L
8.31 × 10−78.61 × 10+015.81 8.58 × 10−81.48 1.32 8.19 × 10+033.74 × 10−31.48 × 10−34.00 × 10−29.37 × 10−3
Coalmine overburden waste rock
sand_M1_2L_lake
8.31 × 10−78.61 × 10+015.81 8.58 × 10−81.48 1.32 8.19 × 10+033.74 × 10−31.48 × 10−34.00 × 10−29.37 × 10−3
Coalmine overburden waste rock sand_M1_2L_watertransformation2.79 × 10−69.82 × 10+016.76 1.17 × 10−71.78 1.71 9.32 × 10+034.62 × 10−31.75 × 10−34.63 × 10−21.08 × 10−2
Coalmine overburden waste rock sand_M1_5L_watertransformation5.73 × 10−61.16 × 10+028.18 1.64 × 10−72.22 2.28 1.10 × 10+045.95 × 10−32.15 × 10−35.57 × 10−21.28 × 10−2
Coalmine overburden waste rock sand_M1_10L_watertransformation1.06 × 10−51.47 × 10+021.06 × 10+012.41 × 10−72.95 3.25 1.38 × 10+048.16 × 10−32.81 × 10−37.15 × 10−21.63 × 10−2
Table 5. Comparative environmental impacts due to change in location of the processing plant.
Impact categoryADPADP_FGWPODPHTFAETMAETTETPCODAPEP
Unitkg Sb eqMJkg CO2 eqkg CFC-11 eqkg 1,4-DB eqkg 1,4-DB eqkg 1,4-DB eqkg 1,4-DB eqkg C2H4 eqkg SO2 eqkg PO4--- eq
Coalmine overburden waste rock sand_M1_2L_0.5km8.31 × 10−78.61 × 10+015.81 8.58 × 10−81.48 1.32 8.19 × 10+033.74 × 10−31.48 × 10−34.00 × 10−29.37 × 10−3
Coalmine overburden waste rock sand_M1_2L_5km8.46 × 10−78.77 × 10+015.83 9.33 × 10−81.49 1.32 8.20 × 10+033.74 × 10−31.49 × 10−34.01 × 10−29.38 × 10−3
Coalmine overburden waste rock sand_M1_2L_50km9.49 × 10−79.88 × 10+015.97 1.45 × 10−71.50 1.33 8.24 × 10+033.79 × 10−31.56 × 10−34.10 × 10−29.48 × 10−3
Coalmine overburden waste rock sand_M1_2L_200km1.39 × 10−61.46 × 10+026.55 3.70 × 10−71.58 1.37 8.41 × 10+034.00 × 10−31.83 × 10−34.50 × 10−29.92 × 10−3
Publisher’s Note: MDPI stays neutral with regard to jurisdictional claims in published maps and institutional affiliations.

