Abstract
Urbanization and carbon emissions have received more attention in the context of “double carbon”, but the existing research on the relationship between the two has not reached a consistent conclusion. By introducing meta-regression analysis, based on the existing research results, this paper retests the relationship between urbanization and carbon emissions, and discusses the reasons for the differences in previous research results from the perspectives of publication bias and research heterogeneity. The results show that (1) urbanization in China has a strong positive impact on carbon emissions and meets the inverted U-shaped Kuznets curve relationship, and (2) there are significant temporal and spatial differences in the impact of urbanization on carbon emissions in China. Temporally, the positive impact is the strongest in the first decade of the 21st century, and in regional terms, the positive impact is the strongest in the eastern region. In addition, the selection of indicators will not interfere with the measurement of the impact of urbanization on carbon emissions.
1. Introduction
From a global perspective, the rapid development of urbanization not only promotes economic growth, but also leads to ecological and environmental problems such as energy consumption and pollution emissions. Among them, climate change such as global warming caused by carbon dioxide emissions is one of the most challenging problems facing human society today. In the process of urbanization, changes in multiple dimensions, such as economic scale, energy structure, industrial structure, and residents’ consumption level, directly or indirectly affect energy demand, resulting in a substantial increase in coal-based primary energy consumption and ultimately large-scale carbon emissions. In 2014, the U.S. Environmental Protection Agency announced that human activities in urban areas are the world’s largest source of carbon dioxide emissions. Urban areas consume about 60% of the world’s energy and emit about 70% of human society’s CO2 [1]. Since the reform and opening up in 1978, China has experienced a rapid urbanization process, which has largely contributed to the rapid development of China’s economy as well as rapidly growing carbon emissions. At present, China has become the world’s largest carbon emitter, and the Chinese government faces considerable international pressure to reduce carbon emissions. Reducing carbon emissions is China’s responsibility as a large country contributing to addressing climate change. The results of China’s seventh national census show that in 2020, the urbanization rate of China’s permanent population reached 63.9%, which is still in a period of rapid development of 30% to 70%. China’s urbanization rate still has a certain gap compared with that of developed countries, and it is expected that China’s urbanization will continue in the near future. Therefore, a correct understanding of the impact of urbanization on carbon emissions will be important for the formulation of China’s carbon emission reduction policies and the achievement of carbon emission reduction targets. “Carbon emission reduction” is an inevitable requirement for China’s economy to achieve green transformation and promote high-quality development. In this regard, China has made it clear that it will be guided by new development concepts, promote high-quality economic development, and promote a comprehensive green transformation of economic and social development. China will work hard to achieve the peak of carbon dioxide emissions by 2030, strive to achieve the goal of carbon neutrality by 2060, and make greater contributions to the global response to climate change [2]. In this context, it is necessary to study the impact of China’s urbanization on carbon emissions. This is not only conducive to realizing the coordination among economy, population, energy, and environment, and promoting the sustainable development of urbanization, but also conducive to the smooth realization of carbon peaking and carbon neutrality goals.
Scholars have carried out many empirical studies on the relationship between urbanization and carbon dioxide emissions. After reviewing the existing literature, we found that the existing empirical studies have not reached a consistent conclusion on the relationship between urbanization and carbon dioxide emissions. Some studies posit that there is a positive relationship between urbanization and carbon emissions [3,4,5,6], but some studies show that there is a negative relationship between urbanization and carbon emissions as well [7,8]. Some studies also show that the impact of urbanization on carbon emissions is nonlinear. For example, Zarzoso and Maruotti consider the heterogeneity of different countries and believe that the relationship between urbanization and carbon emissions is an inverted U-shaped relationship that increases first and then decreases [9]; Qiu found that the relationship between the two is characterized by an inverted n-type [10,11]. In addition, some scholars such as Ji and Asumadu Sarkodie found that the impact of urbanization on carbon emissions is not significant [12,13]. It is difficult to draw a useful and consistent research conclusion on urbanization and carbon emissions according to these empirical results. In this situation, a meta-analysis is necessary to provide a single estimate of the effect of urbanization on carbon emissions computed as the weighted average of the study-specific effect estimates. Differences in sample characteristics, research designs, data sources, and the selection of indicators in different studies may lead to different empirical conclusions. For example, in the selection of data indicators, if the carbon emission coefficient of the Energy Research Institute of the National Development and Reform Commission (NDRC) is used to calculate carbon emissions [14], the average value of China’s carbon emissions estimate in 2010 is about 1.724 billion tons. However, if the IPCC carbon emission coefficient is used [15], the average value is about 2.271 billion tons, which is 31.74% (547 million tons) higher than the carbon emission coefficient of the National Development and Reform Commission Energy Research Institute. In addition, the difference in the selection of urbanization level indicators also produces significant differences in the estimation results of carbon emissions [16].
To summarize, most of the existing studies try to examine the impact of urbanization on carbon emissions by selecting different calculation coefficients, estimation methods, observation samples, etc., but due to the inconsistency of research perspectives and dimensions, consistent estimates cannot be obtained. Therefore, this paper systematically sorted out related studies on the impact of urbanization on carbon emissions to explore the real relationship between them and draw a unified conclusion. Based on the existing research, this paper attempts to introduce the relevant theories of evidence-based medicine, use the meta-regression analysis method, systematically study the consistency of the impact of urbanization on carbon emissions according to the existing literature, and quantitatively analyze the main factors that lead to the difference in the research results, so as to provide a reference for subsequent research and energy conservation and emission reduction. Meta-analysis is a statistical method used to compare and synthesize research results on the same scientific question. Through the integrated analysis of all research results, the effect of research variables can be estimated more accurately than a single study, and it is helpful to explore the consistency of the evidence and the differences between the studies. When the results of multiple studies are inconsistent or have no statistical significance, meta-analysis can be used to obtain statistical analysis results that are close to the real situation.
2. Materials and Methods
2.1. Meta-Regression
The meta-regression method is derived from the meta-analysis statistical method in the evidence-based medicine field, for example, to estimate the effect and risk of medical prevention, treatment, and rehabilitation; to provide more reliable diagnostic test accuracy calculation; or to provide more reliable estimates of causes and risk factors. It is a review method that comprehensively and quantitatively analyzes the correlation between variables by applying statistical methods to the statistical indicators contained in the relevant research results. Compared with other methods, the term meta-analysis refers to the analysis of the data obtained from a collection of studies that answer similar research questions. These studies are known as primary studies. Meta-analysis uses statistical methods to produce an overall estimate of an effect, explore between-study heterogeneity, and investigate the impact of publication bias or, more generally, small-study effects on the final results. Meta-regression is an application branch of meta-analysis statistical method in economics. Therefore, the meta-regression method has the general function of meta-analysis, but also has particularity. First, it can resolve the differences in research results and reveal the real relationship between the research variables. Secondly, it enlarges the sample size, so it solves some problems in small sample study. As a quantitative empirical research method, meta-regression analysis takes the heterogeneity of the regression model in the sample literature as the independent variable, and the comprehensive statistical index estimation results of the existing literature research conclusions are used as the dependent variable for multiple regression. It can effectively identify changes in empirical results caused by differences in specific characteristics of statistical methods, model errors, and research datasets, and measure the degree to which these factors affect inconsistent research results [17].
The basic model of meta-analysis is:
In model (1), Yi represents the estimated value of a key variable in the i-th document; the independent variable Xij is an important explanatory variable of the study. The coefficient αi is the deviation effect of a characteristic variable of the existing literature and other literature, and ε is the random disturbance term. When performing meta-regression, it is necessary to focus on two aspects: first, the influence of sample heterogeneity on the regression results; second, the heteroscedasticity between samples may lead to model validity. The first problem can be solved by adding dummy variables that characterize the sample, and the second problem can be solved by weighted regression with the sample size as the weight.
2.2. Sample Selection
The basis of meta-regression analysis is to collect and screen the original research literature comprehensively and accurately [18]. We choose China to be a sample region because China is currently the country with the largest carbon emissions in the world and China has experienced a rapid urbanization process since 1978. In order to ensure the validity and reliability of the research data and improve the quality of meta-analysis, the samples analyzed in this paper are based on the collection of relevant literature from different online databases such as Elsevier, Springer, and CNKI.
The method of collecting research samples in this paper is as follows: with “urbanization”, “carbon emission”, or “urbanization level” as topics or keywords, relevant papers were searched on the databases, and screened according to the research topic. (1) In order to ensure the homogeneity of the included studies, both “urbanization” and “carbon emissions” must be included in the title or keywords of the literature, and the content of the article involves changes in carbon emissions caused by urbanization. (2) The literature must be an empirical study, and the t-value, standard error of regression coefficient, or other data indicators of the effect size of urbanization on carbon emissions must be reported in the regression results for meta-regression. (3) Elimination of theoretical literature of literature review or case analysis does not meet the empirical research requirements of this paper. Samples must be independent between studies. (4) If the samples between the two studies are the same, select the study with more detailed report content or a larger sample to be included in the analysis. After screening, a total of 49 valid studies were finally obtained (see Table 1 for details) [16,19,20,21,22,23,24,25,26,27,28,29,30,31,32,33,34,35,36,37,38,39,40,41,42,43,44,45,46,47,48,49,50,51,52,53,54,55,56,57,58,59,60,61,61,62,63,64,65].

Table 1.
Characteristics of the sample studies.
In common empirical studies, regression models are usually established to analyze the impact of urbanization on carbon emissions, and the coefficients of urbanization on carbon emissions are used to indicate the size of the effect. As a meta-analysis, the elastic coefficient of the impact of urbanization on carbon emissions is selected as the effect size. Then, 51 effective statistical effect sizes are obtained. The extraction criteria for effect size information is as follows. (1) When multiple models and empirical conclusions appear in a paper, the optimal estimation result preferred by the author or the estimation result with the highest goodness of fit (R2) of the model was selected. (2) When the literature uses different explained variables, such as total CO2 emissions (TCO2), per capita CO2 emissions (PCO2), and CO2 emission intensity (GCO2), or uses different standard explanatory variables (such as the proportion of urban permanent population to the total population, non-agricultural household registration population), or if the optimal model estimation result is not specified in the text, all estimation results in the same paper can be used as a sample to calculate the required effect size. According to this standard, 51 effective effect values suitable for meta-regression analysis were extracted from the 49 selected studies.
2.3. Model Settings
In order to examine which factors affect the effect of urbanization on carbon emissions, we adopted the following meta-regression model:
is the elasticity coefficient of the impact of urbanization on carbon emissions in the j-th estimate of the i-th document. is a series of heterogeneous variables related to model design that cause differences in empirical results of different studies, such as sample data characteristics, variable index selection, control variables, etc. Most of these variables are discrete, and they are assigned in the form of virtual binary variables. is a random disturbance term.
2.3.1. Explained Variable
In meta-regression, the effect size represents the strength of the phenomenon, that is, the strength of the independent variable affecting the dependent variable. Stanley and Doucouliagos pointed out that, different from the effect size based on experimental results in the field of medicine or psychology, in the field of economics, the effect size of meta-regression analysis should be an economic indicator to measure the relationship between variables. It should contain certain economic significance, such as correlation coefficient, elasticity, marginal rate of change, etc. [66]. In studies that empirically test the impact of urbanization on carbon emissions, the following regression equation is generally used:
In Formula (3), C represents the carbon emission (carbon emission intensity) of the study area, P represents the population (population density), A represents the per capita wealth, U represents the urbanization level, and T represents the energy intensity (technical level). Different studies have slight differences in the selection of the above variables. X is the control variable. Since Formula (3) takes logarithmic processing of each variable, its regression coefficient β is the elastic coefficient of the influence of the independent variable on the dependent variable, indicating the degree of response of the dependent variable to the change in the independent variable. The elastic effect size has no unit, does not need to consider the order of magnitude, and has a certain economic meaning, which can adequately express the internal connection of economic phenomena. Therefore, this paper adopts the elasticity coefficient of the impact of urbanization on carbon emissions as the explained variable (effect size).
2.3.2. Explanatory Variables
The independent variables of the meta-regression were selected from those factors that led to differences in the results of the literature. These factors include sample data characteristics, variable selection and index construction variables, and publication characteristics (year of publication). Since there are many factors that affect the bias of estimated results, it is necessary to be as comprehensive as possible when setting independent variables. The detailed variable descriptions and statistical descriptions are given in Table 2.
Table 2.
Descriptions of meta-regression analysis variables.
- (1)
- Data characteristic variable
For the sample size of the literature data, we use the collected literature sample sizes to examine the influence of the size of the regression samples on the heterogeneity among studies. The year of publication was used to examine the influence of publication characteristics of the research sample on the heterogeneity. The sample starting time and sample ending time, which are centered around the year 2008, and the time span of the sample study reflect the time structure effect of urbanization on carbon emissions. The year 2008 was chosen as the base year because since then, China has announced plans to develop a low-carbon economy. The geographic location of the research sample is assigned a dummy binary variable according to the three different regions of the mainland, eastern region, or central and western regions of China to investigate the impact of the regional structure effect of heterogeneity. Data type is used to examine whether differences in data types lead to differences in regression results.
- (2)
- Indicator Construction Variables
In the existing literature, different scholars have constructed different proxy indicators to measure the level of urbanization and carbon emissions. In this paper, the index construction variable is set to explore the heterogeneity of the primary studies. The proxy indicator of urbanization level has four types: (a) the proportion of city permanent population, (b) the proportion of non-agricultural population according to China’s registered residence system, (c) the index synthesized by the author, and (d) the proportion of city built-up area. Carbon emissions are assigned to three different indicators: (a) total CO2 carbon emissions (TCO2), (b) per capita CO2 carbon emissions (PCO2), and (c) CO2 carbon emission intensity (GCO2). When calculating energy carbon emissions, IPCC coefficient, NDRC energy coefficient, conversion coefficient, and other conversion coefficients are also used in order to assign values.
- (3)
- Control variable
In addition to the urbanization level, this paper collects and incorporates common control variables in the sample literature as other factors affecting carbon emissions, including coefficient of GDP per capita, coefficient of energy intensity, coefficient of population, and coefficient of proportion of secondary industry to study whether the selection of these control variables affects the meta-regression results.
3. Results
3.1. The Main Effect of Urbanization on Carbon Emissions
Table 3 reports the main effect meta-regression results of the impact of urbanization on carbon emissions in China. The arithmetic mean of the elasticity coefficient (Elasticity_UR) is 0.392; that is, on average, every 1% increase in the urbanization level will lead to an increase of 0.392% in carbon emissions. Using the arithmetic mean method to calculate the main effect and assigning the same weight to samples of different sizes will ignore the difference in sample size and reduce the accuracy of the estimation results. The fixed-effects model or random-effects model can effectively improve the accuracy of statistical estimation. Since the meta-regression in this paper uses a random effect model, the random effect is used to calculate the mean of the main effect, and the mean value of the elastic coefficient regression is 0.360. The above regression results show that there is a positive correlation between urbanization and carbon emissions in China’s mainland. Referring to the definition of Doucouliagos, if the absolute value of the main effect of the partial correlation coefficient is between 0.07 and 0.17, it is considered that the impact of urbanization on economic growth is small, and if it is greater than 0.33, it is considered that the impact is large. A value between 0.17 and 0.33 is considered moderate [67]. The main effects were higher than 0.33 for both fixed-effects and random-effects models. Therefore, in general, China’s urbanization has a positive impact on the increase in carbon emissions and has a greater degree of impact.
Table 3.
Main effect of urbanization on carbon emission.
In order to test whether there is a nonlinear environmental Kuznets curve between China’s urbanization and carbon emissions, we studied the effect of the quadratic variable of urbanization on carbon emissions. The results in Table 3 show that the arithmetic mean and random effect mean of the quadratic term of urbanization on the carbon emission elasticity coefficient (Elasticity_UR) are −0.104 and −0.057, respectively, and the elasticity coefficient corresponding to the quadratic term of urbanization is negative. It shows that the relationship between China’s urbanization level and carbon emissions satisfies the inverted U-shaped Kuznets curve relationship.
In order to assess the heterogeneity caused by study design and conduct, we use subgroup meta-analysis of indicator construction variables and data type in Table 4. The Q statistic of urbanization, CO2, calculation, and data_type are 0.91, 4.59, 0.75, and 2.54, respectively. None of them are statistically significant, which means study design and conduct variables have no heterogeneity between groups. However, as Table 4 shows, studies using variables calculated by the proportion of non-agricultural population in urbanization, GCO2 and TCO2 in CO2, NDRC coefficient in carbon emissions, time series data, and panel data report different statistically significant effects.
Table 4.
Main effect of urbanization on carbon emissions in different subgroups of study design and conduct.
3.2. The Spatial–Temporal Differentiation Effects of Urbanization on Carbon Emissions
3.2.1. Temporal Differentiation Effects
Column (1) in Table 5 reports the hierarchical regression estimation results of the time coverage of the selected samples in the literature on the impact of urbanization on the carbon emission elasticity coefficient. The regression coefficient of the variable SampleStartTime is −0.029, which is significant at the 10% significance level.
Table 5.
Effect of urbanization on carbon emissions in meta-regression.
This result shows that, other things being equal, the impact (elasticity coefficient) of China’s urbanization on carbon emissions obtained by the regression estimation declined over time, which is shown more obviously in Figure 1. The above results reflect the time structure effect of China’s urbanization on carbon emissions: urbanization has a stronger effect on carbon emissions at the beginning of urbanization, but after 2008, the promoting effect of urbanization on carbon emissions was significantly weakened. In the early stage of urbanization, large-scale rural populations flowed into cities and towns, the proportion of secondary and tertiary industries in the existing industrial structure gradually increased, and people’s living and consumption patterns became more and more carbonized. At this stage, the scale effect of urbanization has not yet formed, so it shows that urbanization has a positive impact on carbon emissions. After the development of urbanization to a certain stage, the scale effect and technology diffusion effect brought by urbanization gradually appeared and played a positive role, which together led to the slowing down of the promotion effect of urbanization on carbon emissions [68].

Figure 1.
The bubble plot of the effect size.
3.2.2. Spatial Differentiation Effects
Column (2) in Table 5 reports the hierarchical regression estimation results of the impact of urbanization on the carbon emission elasticity coefficient by the geographic location of the selected samples in the literature. The regression coefficients of the eastern region and the central and western regions are 0.394 and −2.117, respectively, and central and western regions is significant at the 10% level. This shows that the estimation of the elasticity coefficient of urbanization and carbon emissions in the central and western regions is lower than in the mainland, and there is no difference between the eastern region and the mainland. Table 6 shows the subgroup meta-analysis between mainland China, the eastern region, and the central and western regions. It shows that the effect between groups varies greatly, with 0.966 in mainland China, 1.280 in the eastern region, and −1.291 in the central and western regions, but with no significant difference. These results should be treated with caution because the sample number of the eastern region is only five and that of the central and western regions is only four. The results of this paper are consistent with the research results of Xu, which shows that affected by the initial natural conditions of the region and policy conditions such as reform and opening up, the level of urbanization in eastern China is the highest, and population resources and important industries are concentrated in developed cities in the east, resulting in higher carbon emissions [69]. Urbanization has a significant positive impact on the growth of carbon emissions in the eastern region, and the coefficient of influence is relatively large. The eastern region is the fastest-growing region in China’s urbanization process, and it is also the first to enjoy “preferential development” policies such as reform and opening up. The proportion of output value, per capita wealth, and population of the secondary industry with high energy consumption is much higher than that of the central and western regions, which has promoted the rapid growth of carbon emissions in the eastern region and formed a huge scale of carbon emissions.
Table 6.
Main effect of urbanization on carbon emissions in different regions.
3.2.3. Influence of Other Factors
Column (3) in Table 5 reports the common control variables of the regression affecting the effects of urbanization on carbon emission. It shows that the coefficients of PGDP and En_Tech are significant, with 0.244 and −0.152, respectively. With a 1% increase in PGDP, the effect of urbanization on urbanization increases by 0.244%, and with a 1% increase in energy technology level, the effect of urbanization on urbanization decreases by 0.152%.
4. Discussion
4.1. Publication Bias Test
Meta-regression analysis uses the existing literature as the research sample, and the research results are greatly affected by the sample literature. Therefore, it is necessary to test the possible publication bias to improve the accuracy of the results.
Publication bias refers to the subjective preference of researchers and journal editors for research results during the publication process of articles, which often tends to lead to positive research results that are more likely to be published in journals [70]. The appearance of publication bias will greatly reduce the accuracy of meta-analysis: publication bias may lead to the inclusion of literature in meta-analyses that are not comprehensive enough to effectively reflect the real situation of the question to be evaluated, especially in the field of economic research [71].
We first tested for publication bias by means of a funnel plot. Funnel plots are a classic graphical method for qualitatively measuring publication bias. A funnel plot is a scatterplot of individual effect sizes. The horizontal axis is usually the standardized effect size—in this case, the elastic coefficient—and the vertical axis is the elastic coefficient standard deviation. Generally speaking, scatter points with small sample sizes and low precision tend to be distributed at the bottom of the funnel plot and have a wider width. With the increase in the sample size and the improvement of the precision, the scatter points gradually tend to be distributed at the top of the funnel plot, the width is smaller, and there is a tendency to concentrate in the middle. If there is little or no publication bias, the scatter points will be symmetrically distributed along the center line, forming a funnel shape. Otherwise, publication bias may exist [72].
As shown in Figure 2, the scatter points in the funnel plot are mostly concentrated at the top, and the overall distribution is symmetrical along the midline, and there is a certain degree of right bias. This result shows that the publication status of each literature containing different research conclusions on the relationship between urbanization and carbon emissions in China is generally good. However, the positive and significant empirical results of the impact of urbanization on carbon emissions may be easier to publish.
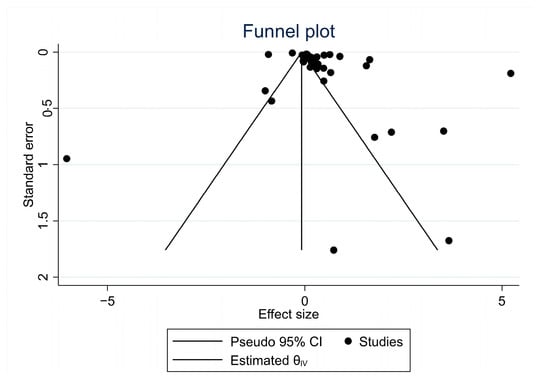
Figure 2.
Funnel plot of the main effect of urbanization on carbon emission.
Since funnel plot symmetry only relies on visual inspection to judge publication bias, which is highly subjective, in order to ensure the accuracy and rigor of the results, Stanley and Doucouliagos proposed to use the funnel symmetry detection method to further test and correct publication bias. This method is used in this paper to express the elastic coefficient as a linear function of its standard deviation, as follows:
Among them, the coefficient β1 represents the degree of publication bias, and the constant term β0 represents the true effect of urbanization on carbon emissions after removing publication bias. The subscripts i and j represent the j-th estimation result of the i-th sample. In order to improve the robustness of publication bias detection, we further tested publication bias by a rigorous funnel symmetry test. In the test results, the regression coefficient β1 of the constant term is 0.53 and is not significant. That is, there is no obvious publication bias in the publication process of the research on the relationship between urbanization and carbon emissions in China.
4.2. Sensitivity Test Caused by Other Factors
Subgroup testing is one of the commonly used methods for analyzing main effect moderating variables in meta-analysis. The subgroup test was divided into groups according to the size of the potential moderator variable, and the comprehensive effect value of each group was statistically tested to explain whether there was heterogeneity among moderator variables. The subgroup test results are shown in Table 7. The results show that:
Table 7.
Results of subgroup analysis.
- (1)
- There was no significant difference in the effect value between the fixed-effects model and the non-fixed-effects model in the literature model (Qb = 1.13, p > 0.1). It shows that the choice of literature model does not play a moderating role in the relationship between urbanization and carbon emissions.
- (2)
- Grouped by the time span of the research samples in the literature, the effect size of a group with a large time span is 0.315, the effect size of a group with a small time span is 0.144, and the difference between the two is significant at the 1% significance level (Qb = 4.76, p < 0.05). It shows that the smaller the time span of the research sample, the stronger the positive relationship between urbanization and carbon emissions.
- (3)
- The average sample size in the research literature is 180, the effect size of the large sample group is −0.079, and the effect size of the small sample group is 0.308; there is no significant difference between the two effect sizes (Qb = 0.5, p > 0.1). It shows that the size of the sample has no effect on the positive relationship between urbanization and carbon emissions.
4.3. The Verification of the Results
To analyze whether there is any study affecting the meta-analysis results, a leave-one-out forest plot graph is shown in Figure 3. For each study, the displayed effect size corresponds to an overall effect size computed from a meta-analysis excluding that study. Figure 3 shows that all the overall effect sizes from the leave-one-out meta-analysis are close to the overall effect size vertical line, and their CI lines intersect with the vertical red line based on all the studies, which means that there are no studies that substantially influence the results of our meta-analysis.

Figure 3.
The leave-one-out forest plot of the main effect [16,19,20,21,22,23,24,25,26,27,28,29,30,31,32,33,34,35,36,37,38,39,40,41,42,43,44,45,46,47,48,49,50,51,52,53,54,55,56,57,58,59,60,61,62,63,64,65].
5. Conclusions
Regarding the relationship between urbanization and carbon emissions, the existing literature has not reached a unified conclusion. In order to explore the real relationship between the two, we selected 49 valid documents and organized 51 conclusions that meet the research requirements by using a meta-analysis in a new perspective. The meta-regression model was used to analyze the factors that affect the difference in empirical research conclusions. The results of the meta-analysis reveal some conclusions. (a) There is a strong positive effect of China’s urbanization on carbon emissions, with a mean value of 0.360, and carbon emissions satisfy an inverted U-shaped Kuznets curve relationship. (b) China’s urbanization had a stronger effect on carbon emissions at the beginning of urbanization and then significantly weakened since 2008 at a rate of 0.028 per year, when China announced the pursuit of a low-carbon economy. (c) The estimation of the elasticity coefficient of urbanization and carbon emissions in the central and western regions is lower than in the mainland with a rate of −2.117. (d) We also found that GDP per capita has a positive effect on carbon emissions, with a coefficient of elasticity of about 0.244, while energy technology level has a negative effect on carbon emissions, with a coefficient of elasticity of about 0.152. This result further emphasizes the importance of developing low-carbon technologies in the process of urbanization.
This research is limited to assessing urbanization’s contribution to carbon emissions in China. Further research can also be carried out on urbanization in other countries and its impact on carbon emissions, and compare differences between countries to draw more general conclusions. This research contributes uniquely to the existing literature by analyzing urbanization’s impact on carbon emissions through meta-analysis. This research offers a guideline for other researchers in this field.
Author Contributions
Conceptualization, A.L. and Y.L.; methodology, X.L.; software, A.L.; validation, H.W. and H.Z.; resources, X.L.; data curation, X.L.; writing—original draft preparation, A.L.; writing—review and editing, Y.L.; visualization, H.W.; supervision, H.Z.; project administration, Y.L. All authors have read and agreed to the published version of the manuscript.
Funding
This research was funded by the National Social Science Foundation Youth Project “Research on the Spatial Mechanism and Policy Choice of the Impact of Urban Agglomeration Development on Population Distribution (No.17CRK009)” supported by National Office for Philosophy and Social Sciences.
Institutional Review Board Statement
Not applicable.
Informed Consent Statement
Not applicable.
Data Availability Statement
All data presented in this study are available in this manuscript.
Acknowledgments
We want to thank Tingting Yao for her valuable comments.
Conflicts of Interest
The authors declare no conflict of interest.
References
- Rosalía, P.T.; Julio, R.; Gago, E.J.; Javier, O. Assessing the relationship between urban planning options and carbon emissions at the use stage of new urbanized areas: A case study in warm climate location. Energy Build. 2017, 136, 73–85. [Google Scholar]
- Che, C.; Geng, X.; Zheng, H.X.; Chen, Y.; Zhang, X.G. The Pricing Mechanism Analysis of China’s Natural Gas Supply Chain under the “Dual Carbon” Target Based on the Perspective of Game Theory. Sustainability 2022, 14, 9510. [Google Scholar] [CrossRef]
- Parikh, J.; Shukla, V. Urbanization, energy use and greenhouse effects in economic development: Results from across—National study of developing countries. Glob. Environ. Change 1995, 5, 87–103. [Google Scholar] [CrossRef]
- Cole, M.A.; Neumayer, E. Examining the impact of demographic factors on air pollution. Popul. Environ. 2004, 26, 5–21. [Google Scholar] [CrossRef]
- Lin, B.Q.; Liu, X.Y. Carbon emissions in China’s urbanization stage: Influencing factors and emission reduction strategies. Econ. Res. 2010, 45, 66–78. [Google Scholar]
- Zhou, K.; Dai, X.W. An empirical study on the relationship between China’s urbanization process and carbon emissions. China’s Popul. Resour. Environ. 2013, 23, 41–48. [Google Scholar]
- Sharma, S. Determinants of carbon dioxide emissions: Empirical evidence from 69 countries. Appl. Energy 2011, 88, 376–382. [Google Scholar] [CrossRef]
- Bindzar, P.; Macuga, D.; Brodny, J.; Tutak, M.; Malindzakova, M. Use of Universal Simulation Software Tools for Optimization of Signal Plans at Urban Intersections. Sustainability 2022, 14, 2079. [Google Scholar] [CrossRef]
- Martínez-Zarzoso, I.; Maruotti, A. The impact of urbanization on CO2 emissions: Evidence from developing countries. Ecol. Econ. 2011, 70, 1344–1353. [Google Scholar] [CrossRef]
- Qiu, Q.; Fang, X.; Zuo, X. Research on the nonlinear decoupling effect of urbanization on carbon emissions: Estimation based on the Tapio decoupling model. Mod. Econ. Discuss. 2017, 5, 76–82. [Google Scholar]
- Bindzar, P.; Sang, S.; Gasanov, E.; Aliyarov, R. Sustainable Development as a Global Trend and an Economic Priority for the Nation. E3S Web Conf. 2018, 41, 04033. [Google Scholar] [CrossRef]
- Ji, S.D.; Wu, H.; Wang, Z. Trade Openness, Urbanization Development and Carbon Dioxide Emissions: Analysis of Frontier Cointegration Test Based on Panel Data of Chinese Cities. Econ. Issues 2013, 12, 31–35. [Google Scholar]
- Asumadu-Sarkodie, S.; Owusu, P.A. A multivariate analysis of carbon dioxide emissions, electricity consumption, economic growth, financial development, industrialization, and urbanization in Senegal. Energy Sources Part B Econ. Plan. Policy 2017, 12, 77–84. [Google Scholar] [CrossRef]
- Xu, G.Q.; Liu, Z.Y.; Jiang, Z.H. Factor decomposition model and empirical analysis of China’s carbon emissions: 1995–2004. Chin. Popul. Resour. Environ. 2006, 16, 158–161. [Google Scholar]
- 2006 IPCC Guidelines for National Greenhouse Gas Inventories. Available online: https://www.ipcc.ch (accessed on 20 October 2022).
- Liu, M.Q.; Liu, Y.J. The relationship between urbanization development and carbon emissions in China: An empirical study based on data from 30 provinces. Urban Dev. Res. 2011, 18, 27–32. [Google Scholar]
- Peng, Y.C.; Gu, L.L. META Regression Analysis in Economics. Econ. Dyn. 2014, 2, 126–131. [Google Scholar]
- Zhang, P.; Cai, G.Q.; Zhang, P.P. Meta regression analysis of the impact of environmental regulation on technological innovation. Stat. Decis. Mak. 2018, 34, 112–116. [Google Scholar]
- Wang, J.; Wei, W.; Ma, S.C. Economic development, urbanization and carbon dioxide emission in China. Econ. Surv. 2013, 6, 18–24. [Google Scholar]
- Wang, X. Impact of China’s urbanization on carbon emissions—Analysis based on provincial panel data. Urban Probl. 2016, 7, 23–29. [Google Scholar]
- Wang, S.J. Research on the effect mechanism and regional difference of new urbanization on carbon emissions in China. Mod. Econ. Res. 2017, 7, 103–109. [Google Scholar]
- Lu, Z.D. Research on the impact of urbanization on carbon emissions. Forum Sci. Technol. China 2011, 7, 134–140. [Google Scholar] [CrossRef]
- Sun, H.H. Urbanization, economic development level and carbon dioxide emission in China: An empirical test based on Chinese provincial panel data. East China Econ. Manag. 2012, 26, 69–74. [Google Scholar]
- Xu, S.C.; Long, R.Y. Economic growth, urbanization and carbon dioxide emissions. J. Guangdong Univ. Financ. Econ. 2014, 29, 23–31+42. [Google Scholar]
- Ren, H.J.; Liu, G.L. Study on the difference of influencing factors of carbon emission in different urbanization stages: Based on provincial panel data. Econ. Surv. 2014, 31, 1–7. [Google Scholar]
- Zhang, H.W.; Wang, K.Y.; Xiang, B.W. Differences in the effects of urbanization on CO2 emission. China Popul. Resour. Environ. 2013, 23, 152–157. [Google Scholar]
- Sun, X.; Zhang, K.M. Empirical analysis of influencing factors of carbon emission intensity in China. Stat. Res. 2014, 31, 61–67. [Google Scholar]
- Xiao, Z.Y. Study on the relationship between urbanization development stage and CO2 emission in China. China Popul. Resour. Environ. 2011, 21, 139–145. [Google Scholar]
- Xu, L.J. Research on the relationship between China’s urbanization and carbon emissions. Macroecon. Res. 2014, 6, 63–70+79. [Google Scholar]
- Guan, H.l.; Chen, J.C.; Cao, W. Empirical study on the relationship between carbon emission and urbanization. China Popul. Resour. Environ. 2013, 23, 111–116. [Google Scholar]
- Hu, J.H.; Jiang, X. Effects of urbanization on carbon emissions from the perspective of urban agglomeration. J. China Univ. Geosci. 2015, 15, 11–21. [Google Scholar]
- Wang, X.B.; Shao, Y.F. Urbanization, energy consumption and carbon dioxide emissions research in China—From the 1995~2011 provincial panel pata. J. Ind. Technol. Econ. 2014, 33, 115–123. [Google Scholar]
- Feng, D.; Li, J. Impacts of urbanization on carbon dioxide emissions in the three urban agglomerations of China. Resour. Environ. Yangtze Basin 2018, 27, 2194–2200. [Google Scholar]
- Wang, X.B.; Shao, Y.F. Impact of urbanization on energy consumption and carbon dioxide emission: Empirical study based on China’s provincial panel data during 1995–2011. J. Technol. Econ. 2014, 33, 55–63. [Google Scholar]
- Li, W.D.; Yu, J.J. An empirical analysis on the influence of urbanization on CO2 emission in China based on panel data. J. Beijing Jiaotong Univ. 2017, 16, 50–56. [Google Scholar]
- Zhou, W.X.; Mao, A.L.; Zhu, X.P. Economic growth, urbanization, industrial structure and carbon emissions: An empirical analysis based on provincial panel data. Mod. Manag. 2015, 35, 76–78. [Google Scholar]
- Lui, H.J. The influence of urbanization on carbon dioxide emissions: An empirical evidence from China. Shanghai J. Econ. 2012, 24, 24–35. [Google Scholar]
- Zhao, H.; Chen, Y.M. Research on relationship between urbanization process and carbon emission reduction in China. China Soft Sci. 2013, 3, 184–192. [Google Scholar]
- Xu, Y.; Zhou, S.F. An empirical study on urbanization and CO2 emissions in China. Resour. Environ. Yangtze Basin 2011, 20, 1304–1309. [Google Scholar]
- Wu, L.J.T.; Wang, Y.D. An empirical study on the relationship between urbanization and carbon emissions in China. Stat. Decis. 2012, 3, 151–154. [Google Scholar]
- Lin, J.; Yang, L.K. On the effect of urbanization, economic growth on the regional emission of carbon dioxide—An empirical research based on provincial penal data in China. Mod. Financ. Econ. J. Tianjin Univ. Financ. Econ. 2013, 33, 29–35. [Google Scholar]
- Zhuang, Y.; Xia, B. Impact of industrialization and urbanization on CO2 emissions in China. Sci. Technol. Manag. Res. 2017, 37, 203–209. [Google Scholar]
- Sarwar, S.; Alsaggaf, M.I. Role of urbanization and urban income in carbon emissions: Regional analysis of China. Appl. Ecol. Env. Res. 2019, 17, 10303–10311. [Google Scholar] [CrossRef]
- Zhang, W.; Xu, H. Effects of land urbanization and land finance on carbon emissions: A panel data analysis for Chinese provinces. Land Use Policy 2017, 63, 493–500. [Google Scholar] [CrossRef]
- Zhang, Y.J.; Yi, W.C.; Li, B.W. The impact of urbanization on carbon emission: Empirical evidence in Beijing. Energy Procedia 2015, 75, 2963–2968. [Google Scholar] [CrossRef]
- Xu, H.; Zhang, W. The causal relationship between carbon emissions and land urbanization quality: A panel data analysis for Chinese provinces. J. Clean. Prod. 2016, 137, 241–248. [Google Scholar] [CrossRef]
- Zhu, Q.; Peng, X. The impacts of population change on carbon emissions in China during 1978–2008. Environ. Impact Assess. Rev. 2012, 36, 1–8. [Google Scholar]
- Lv, T.; Hu, H.; Zhang, X.; Xie, H.; Wang, L.; Fu, S. Spatial spillover effects of urbanization on carbon emissions in the Yangtze River Delta urban agglomeration, China. Environ. Sci. Pollut. Res. 2022, 29, 33920–33934. [Google Scholar] [CrossRef]
- Wang, F.; Fan, W.; Chen, C.; Liu, J.; Chai, W. The dynamic time-varying effects of financial development, urbanization on carbon emissions in the Yangtze River Delta, China. Environ. Sci. Pollut. Res. 2019, 26, 14226–14237. [Google Scholar] [CrossRef]
- Yi, M.; Gong, M.; Wu, T.; Wang, Y. Nonlinear effects of urbanization and outward foreign direct investment on carbon emissions in China. Sustainability 2018, 10, 4411. [Google Scholar]
- Wu, S.; Zhang, K. Influence of urbanization and foreign direct investment on carbon emission efficiency: Evidence from urban clusters in the Yangtze River economic belt. Sustainability 2021, 13, 2722. [Google Scholar]
- Zhang, C.; Lin, Y. Panel estimation for urbanization, energy consumption and CO2 emissions: A regional analysis in China. Energy Policy 2012, 49, 488–498. [Google Scholar] [CrossRef]
- Zhang, Y.J.; Liu, Z.; Zhang, H.; Tan, T.D. The impact of economic growth, industrial structure and urbanization on carbon emission intensity in China. Nat. Hazards 2014, 73, 579–595. [Google Scholar] [CrossRef]
- Liu, X.; Bae, J. Urbanization and industrialization impact of CO2 emissions in China. J. Clean. Prod. 2018, 172, 178–186. [Google Scholar] [CrossRef]
- Liu, Y.; Yan, B.; Zhou, Y. Urbanization, economic growth, and carbon dioxide emissions in China: A panel cointegration and causality analysis. J. Geogr. Sci. 2016, 26, 131–152. [Google Scholar] [CrossRef]
- Li, J.; Huang, X.; Kwan, M.P.; Yang, H.; Chuai, X. The effect of urbanization on carbon dioxide emissions efficiency in the Yangtze River Delta, China. J. Clean. Prod. 2018, 188, 38–48. [Google Scholar] [CrossRef] [PubMed]
- Zhou, C.; Wang, S.; Wang, J. Examining the influences of urbanization on carbon dioxide emissions in the Yangtze River Delta, China: Kuznets curve relationship. Sci. Total Environ. 2019, 675, 472–482. [Google Scholar] [CrossRef]
- Meng, L.; Crijns-Graus, W.H.J.; Worrell, E.; Huang, B. Impacts of booming economic growth and urbanization on carbon dioxide emissions in Chinese megalopolises over 1985–2010: An index decomposition analysis. Energy Effic. 2018, 11, 203–223. [Google Scholar] [CrossRef]
- Wang, F.; Wang, G.; Liu, J.; Chen, H. How does urbanization affect carbon emission intensity under a hierarchical nesting structure? Empirical research on the China Yangtze River Delta urban agglomeration. Environ. Sci. Pollut. Res. 2019, 26, 31770–31785. [Google Scholar] [CrossRef]
- Wang, F.; Gao, M.; Liu, J.; Qin, Y.; Wang, G.; Fan, W.; Ji, L. An empirical study on the impact path of urbanization to carbon emissions in the China Yangtze River delta urban agglomeration. Appl. Sci. 2019, 9, 1116. [Google Scholar] [CrossRef]
- Sun, Z.; Sun, T. The impact of multi-dimensional urbanization on China’s carbon emissions based on the spatial spillover effect. Pol. J. Environ. Stud. 2020, 29, 3317–3327. [Google Scholar] [CrossRef]
- Liu, Y.; Han, Y. Impacts of urbanization and technology on carbon dioxide emissions of yangtze river economic belt at two stages: Based on an extended stirpat model. Sustainability 2021, 13, 7022. [Google Scholar]
- Fan, J.; Zhou, L. Impact of urbanization and real estate investment on carbon emissions: Evidence from China’s provincial regions. J. Clean. Prod. 2019, 209, 309–323. [Google Scholar] [CrossRef]
- Shi, X.; Li, X. Research on three-stage dynamic relationship between carbon emission and urbanization rate in different city groups. Ecol. Indic. 2018, 91, 195–202. [Google Scholar] [CrossRef]
- Qi, X.; Han, Y.; Kou, P. Population urbanization, trade openness and carbon emissions: An empirical analysis based on China. Air Qual. Atmos. Health 2020, 13, 519–528. [Google Scholar] [CrossRef]
- Stanley, T.D.; Doucouliagos, H. Meta-Regression Analysis in Economics and Business; Routledge: London, UK, 2012. [Google Scholar]
- Doucouliagos, C. How Large is Large? Preliminary and Relative Guidelines for Interpreting Partial Correlations in Economics. Available online: https://econpapers.repec.org/paper/dkneconwp/eco_5f2011_5f5.htm (accessed on 1 November 2022).
- Wang, F.; Lin, X.Y.; Liu, J.; Chen, H.T.; Fan, W.N.; Gao, M.N. A review of research on the effect of urbanization on regional carbon emissions. J. Ecol. Environ. 2018, 27, 1576–1584. [Google Scholar]
- Zeng, X.T.; Ren, X.Q. Meta-Analysis Using STATA; China Medical University Press: Beijing, China, 2017; p. 68. [Google Scholar]
- Doucouliagos, C.; Stanley, T.D. Are All Economic Facts Greatly Exaggerated? Theory Competition and Selectivity. Economics 2013, 27, 316–339. [Google Scholar] [CrossRef]
- Peng, Y.C.; Zhu, Y.H.; Gu, L.L. The Structural Effect of Financial Development on Economic Growth—Based on META Regression Analysis Method. Nankai Econ. Res. 2017, 5, 20–36. [Google Scholar]
- Stanley, T.D.; Doucouliagos, H. Picture This: A Simple Graph that Reveals Much Ado about Research. J. Econ. Surv. 2010, 24, 170–191. [Google Scholar] [CrossRef]
Publisher’s Note: MDPI stays neutral with regard to jurisdictional claims in published maps and institutional affiliations. |
© 2022 by the authors. Licensee MDPI, Basel, Switzerland. This article is an open access article distributed under the terms and conditions of the Creative Commons Attribution (CC BY) license (https://creativecommons.org/licenses/by/4.0/).