1. Introduction
Achieving the Sustainable development goals (SDGs) [
1] of Clean water and sanitation, Affordable and clean energy, Responsible consumption and production with the urban wastewater treatment plants (UWWTPs) and their by-product sewage sludge will be possible only with efficient facility operations. The Fitness Check of the EU Water Regulation [
2,
3] as a comprehensive policy evaluation of the Water Frame Directive (WFD) [
4] and its components, the Environmental Quality Standards Directive (EQSD) [
5], the Groundwater Directive (GWD) [
6], and the Flood Directive [FD) [
7], assesses whether the Directives are fit for performing the five criteria set out in the Commission’s Better Regulation agenda [
8]: (i) effectiveness, (ii) efficiency, (iii) coherence, (iv) relevance, and (v) EU added value. The evaluation’s key findings are (i) the Directives are broadly fit for purpose, (ii) water is an essential societal need of great value in the EU economy, and the Directives contribute to achieving a range of SDGs [
1]. In addition, the conclusions are as follows: (i) on the one hand, the WFD [
4] has been successful in setting up a governance framework for integrated water management for the more than 110,000 water bodies in the EU [
9], slowing down the deterioration of water status and reducing chemical pollution; (ii) on the other hand, the Directive’s implementation has been significantly delayed, and less than half of the EU’s water bodies are in good status, even though the deadline for achieving this was 2015; and finally, (iii) good status of water bodies also critically depends on the full implementation of other pieces of EU legislation, such as the Nitrate Directive (ND) [
10] and the Urban wastewater treatment Directive (UWWTD) [
11], as well as better integration of water objectives in other policy areas such as agriculture, energy, or transport, which has not happened yet at the scale necessary. Chemicals are an important key area where there is room to improve and achieve better results on good water status [
2]. The Wilkinson et al. [
12] study concerning pharmaceutical pollution of the world’s rivers presents the findings of a global survey of pharmaceutical pollution in waterways. The study monitored 1052 sampling sites along 258 rivers in 104 countries on all continents, thus representing the pharmaceutical fingerprint of 471.4 million people. It shows that the presence of these contaminants in surface waters poses a threat to environmental and human health in more than a quarter of the studied locations. The study also included the Ljubljanica river, with measurements upstream and downstream of the Central wastewater treatment plant Ljubljana (CWWTPL) [
13]. Regarding the level of cumulative active ingredients, the Ljubljanica river has 124th place out of 137 rivers that were quantified in the study. This means that the sewer system of Ljubljana, along with the CWWTPL, greatly contributes to the good status of the Ljubljanica river, a clean environment, and good public health. The CWWTPL generates the pellets, which are the subject of the present study.
Additional requirements to protect receiving waters may positively or negatively affect the UWWTP’s capacity to recycle sludge. Any cost-benefit analyses conducted to increase provisions for water treatment should also consider the impact on the quality of sludge, so the decision is taken with a global picture of the consequences [
14]. Sewage sludge does not automatically fit into existing definitions of waste. It may be reused and not discarded [
14]. The total amount of sludge produced in Europe in 2018 was 8.67 million tonnes of dry matter [
15]. The data show a slight trend towards reducing landfills, land reclamation, and agricultural uses. In contrast, incineration and, in particular, other uses of sewage sludge like phosphorus recovery increased [
15].
The energy-intensive industries are looking for alternative solid fuels to reduce primary fuel consumption and enforce the sustainable utilisation of treated, non-hazardous renewable combustible waste [
16,
17,
18]. In the 2018 revised EU Renewable Energy Directive (RED) [
19], Part A of Annex IX made a significant shift in the evaluation of sewage sludge by placing it among advanced biofuels as a renewable energy source for the production of fuels for transport (biogas utilisation) and electricity production to accelerate the take-up of renewables in the EU. Further, to achieve the EU’s objective of climate neutrality by 2050 [
20], in May 2022, the proposed new revision of RED [
21] and the REPowerEU Plan [
22] suggest increasing the target amount of renewable energy—currently set at 32% by 2030—to 45%. Advanced biofuels/SRFs must be adequately prepared to achieve this goal [
19,
21].
The treated and properly mixed combustible waste must have reliable quality and be utilised successfully regarding economic and environmental aspects. The Technical Report [
16] gives background information on critical properties used for establishing a classification system for the SRF and a proposal for the quality classes of SRF. Specifications in that document concern key information about potential risks for different combustion technologies and plants. The SRF is used only by combustion facilities complying with the emission limit values set by the EU Industry Emission Directive (IED) [
23]. Following the IED and required BAT’s reference documents [
24,
25], the SRF must also fulfil the technical request of the installations. The proposed classification system, the classes, and the specifications should help the authorities in (i) writing the permits, (ii) be a help for the final user to understand better what has to be taken into account when dealing with an SRF, and (iii) should increase the positive perception of the public on the use of SRF by saving of natural resources. Currently, the main stakeholders of SRFs [
15,
16] are cement kilns [
26], pulverised coal-fired power plants, fluidised bed combustion plants, and cogeneration plants. The primary sources of SRFs are municipal solid waste, sewage sludge, and commercial and industrial process-related waste [
16]. In order to increase the energy efficiency of the incineration plant, the best available technique (BAT) [
27] is used, and drying sewage sludge is an appropriate technique to increase energy efficiency if alternative energy is used for the drying process [
28]. Regarding the energy efficiency levels associated with the best available techniques (BAT-AEELs) for sewage sludge incineration, the boiler’s energy efficiency is 60–70% [
28]. Own biogas produced at the site of sewage sludge origin could be the source of low-grade heat for treated sludge drying. Suppose waste collect from different sources of input material for the production of SRF. In this case, the treated sewage sludge must not be dried. The operator of the incineration facility determines the ratio of input material. The Technical Standard [
18] states the different origins code by specifying a source of waste.
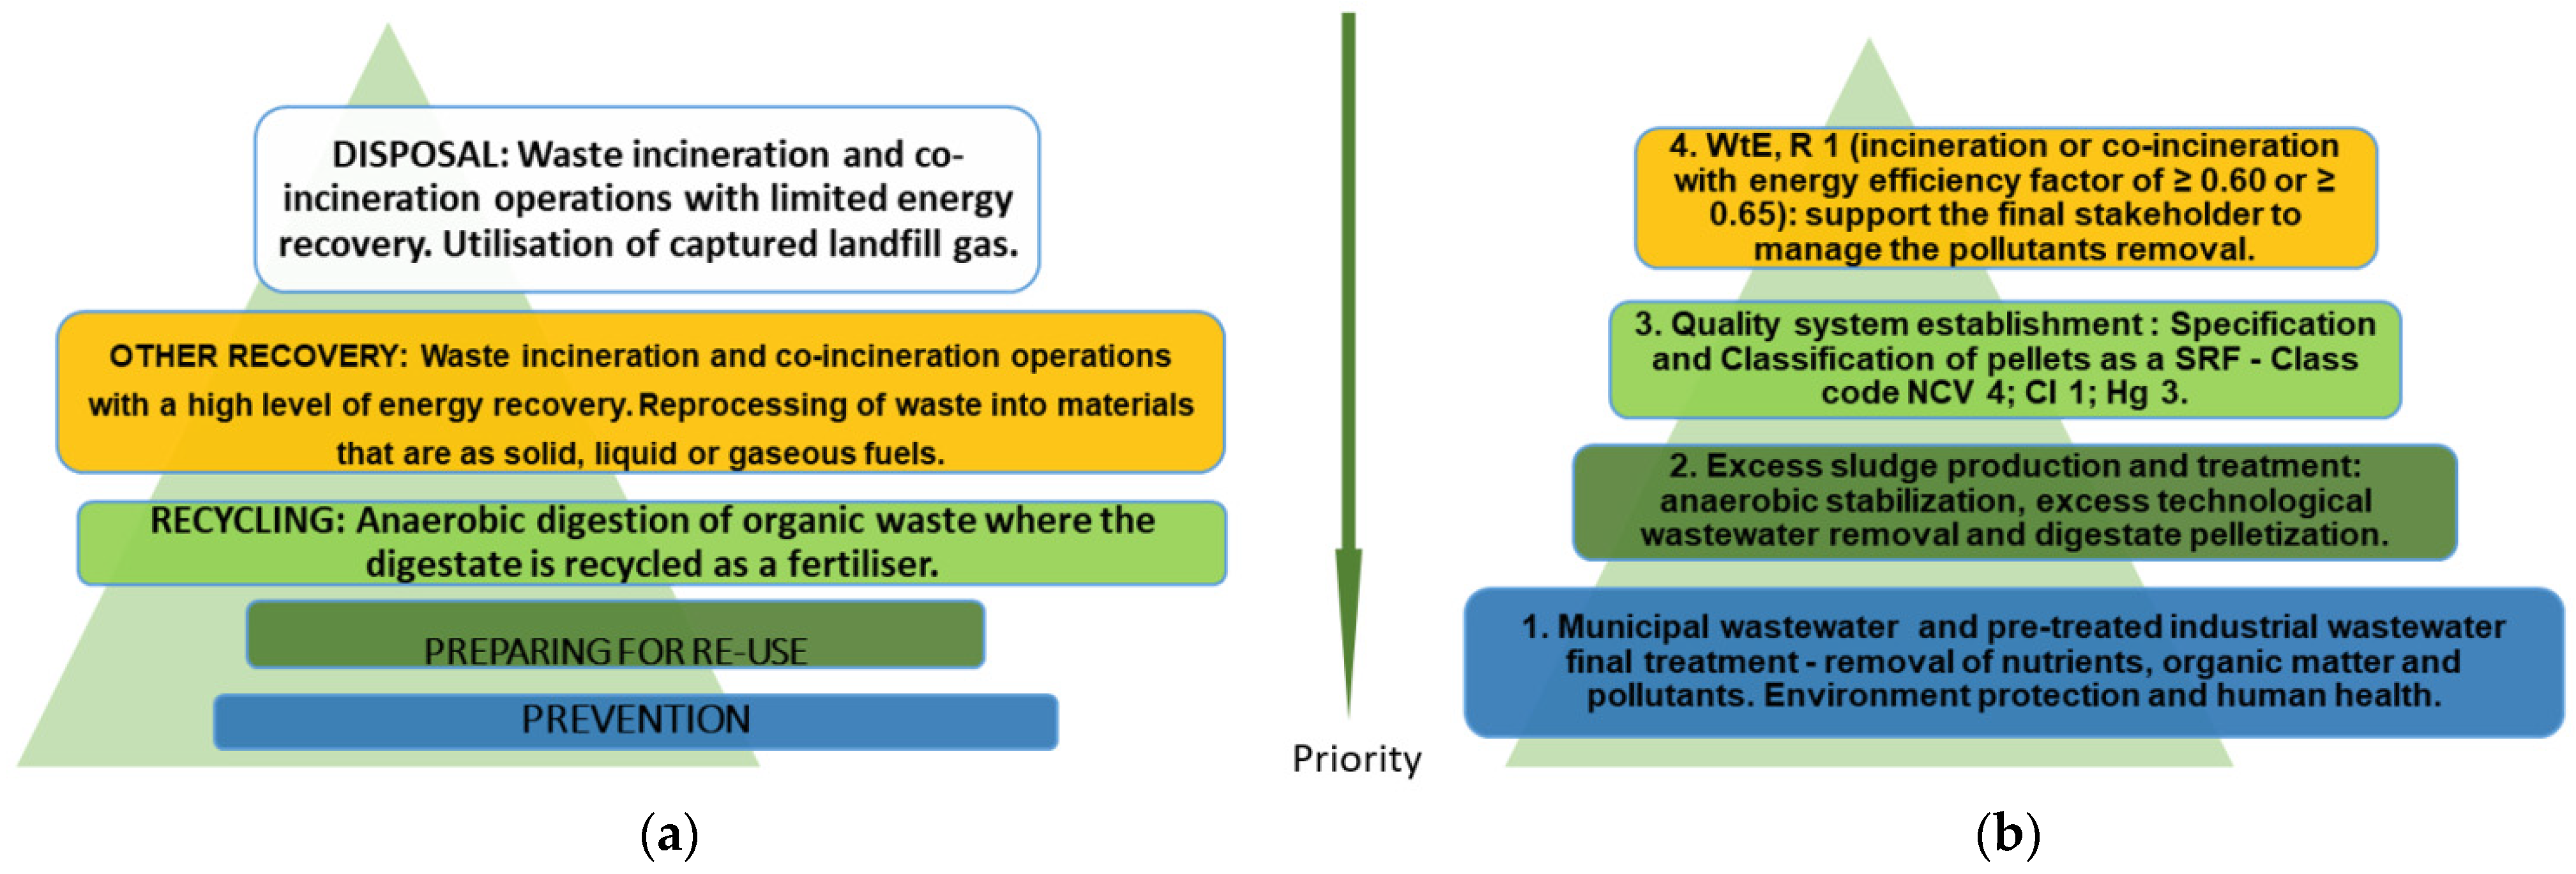
Figure 1 illustrates the waste hierarchy, waste-to-energy (WtE) processes according to the role of WtE in the CE [
29], and the mission of an urban wastewater treatment plant, where SRF is produced [
30].
Energy recovery of waste with a high energy efficiency factor (waste recovery operation, R 1) has an advantage over waste incineration, where the purpose is only to reduce its amount. The energy efficiency factor must be ≥0.60 for installations in operation before 1 January 2009 and ≥0.65 for installations in operation after 31 December 2008 [
31] (
Figure 1a). Only treated sludge can achieve the relevant energy efficiency factor. The term “treated sludge” is set by the SSFD [
32] as sludge that has undergone biological, chemical, or heat treatment, long-term storage, or any other appropriate process so as significantly to reduce its fermentability and the health hazards resulting from its use. Following the Technical Standard [
18], the term “sludge from the treatment of urban wastewater” in mono-stream SRF means dried anaerobically stabilised excess sludge, which has undergone classification and specification.
In terms of the waste hierarchy and the basic approach to waste prevention, the view of sewage sludge is much more complex (
Figure 1b). Sewage sludge is a by-product of municipal wastewater treatment, and its larger quantities are conditioned by the growth of an agglomeration infrastructure [
33]. Its larger quantities mean more treated municipal wastewater, cleaner surface waters, better-protected groundwater, and larger quantities of renewable bioresources for sustainable CE (
Figure 1b).
Waste that should be utilised as an alternative to fossil fuels has to be sustainable, of renewable source, with known properties and appropriate quality, which are the feature of smart materials. To achieve the objectives of the WtE, it is necessary to consider all possible uses in the direction of energy and material use while following the protection of the environment and human health [
34]. The latter is possible only with a thorough knowledge of all relevant sludge properties and the elimination components that limit this particular use. The emphasis is on substances removed from municipal wastewater using sewage sludge as a smart biogen material. Not managed adequately during recovery procedures, they can re-enter the environment. Alternatively, producing green energy from the incineration of that biogen material can also be considered carbon capture. The period until 2050 should consider a transition phase to reach carbon neutrality according to the local constraints to trial new technologies and solutions.
With the efficient operation of UWWTPs, the SDGs [
1] of Clean water and sanitation, Affordable and clean energy, and Responsible consumption and production can be achieved. The present paper is an addition to the two previous studies about sludge generation and characterisation at the CWWTPL [
35]. They comprehensively addressed the wastewater treatment quality system and sewage sludge preparation for sustainable energy use [
30] and the basis of morphological, physicochemical, and thermal properties of pellets as raw material for the CE [
36].
In terms of a “sewage sludge footprint assessment in the WtE”, the pre-treated excess sludge must be considered from several points of view, namely, whether the quality of this material is predictable, comparable with other combustible materials, stable, regularly controlled, and harmless for use in the environment and for human health. It is necessary to look at the economic benefits and environmental consequences of sewage sludge use in the WtE in terms of the quality of treated polluted air, newly generated industrial wastewater and the quality of its recipients, soil and consequently, drinking water and human health [
23].
It is necessary to have a holistic approach to evaluate the municipal wastewater from the extensive contribution area and, consequently, to the generated sewage sludge, to solve the problems due to its inadequate quality. The most significant identified limitation is the quality of pre-treated industrial wastewater, and the question is how to manage related risks [
14]. First, according to the UWWTP’s mission, a bridge between “treated sewage sludge as a tool to remove pollutants from wastewater” and “a valuable material useful for SRF that fulfils customer-specific requirements” must be created. The reference investigations and present study evaluate the critical properties of pellets for their use as a fossil fuel alternative to accelerate the renewable energy technologies in the transition period to clean energy transformation [
37]. A comprehensive review and assessment of their key properties essential to the functioning of energy production plants evaluate the pellets as a sustainable and smart material for SRF preparation. The crucial and characteristic data on sludge’s SRF between 2010 and 2021 are listed, which enables the safe energy use of pellets and adequate cleaning of flue gases by preventing the circulation of pollutants in the environment.
3. Results and Discussion
Since treated sludge represents the fingerprint of a UWWTP catchment area, treatment efficiency, and excess sludge management system, a holistic approach to its evaluation as an SRF must be done. An integral part of processed excess sludge is mechanically biologically removed and anaerobically stabilised organic substances with energy potential, which is desirable for SRF stakeholders. At the same time, HMs are present in processed excess sludge, which is burdensome for stakeholders, as they can adversely affect the environment and human health. First, to resolve this point of view, taken into account was the amount of treated wastewater, and the effect of removing organic substances (expressed as COD) and HMs from raw municipal wastewater, which is prescribed for controlling the quality of treated flue gases and released wastewater of the combustion facility [
23]. In addition, molybdenum (Mo) was analysed as an essential analyte in assessing receiving surface water quality [
44] and the inertness of the resulting ash [
45]. Second, the environmental footprint of the combustion plant must be linked to the quality of the treated sludge as input material, with the aim of preventing the further circulation of pollutants.
The use of sewage sludge for energy production has advantages and disadvantages. It can be assessed from different engineering aspects: (i) UWWTP capacity, (ii) stage of wastewater treatment, (iii) aerobic- or anaerobic stabilisation, (iv) dehydration equipment, (v) thermal treatment or drying, and (vi) natural and economic conditions (the location of the UWWTP, the arrangement of the transport route, and the available facilities for the final treatment of sludge). The national and local level of public awareness of the usefulness of sludge as a material for the WtE is also essential, which is also important for achieving the global SDGs.
To have confidence in the sewage sludge quality, it is necessary to have a suitable sampling procedure, a targeted end user and a list of required specified characteristics. The assessment of the usability of sewage sludge must be made in terms of several options, dynamism, reliability, and feasibility. The final utilisation of sewage sludge must be adaptable to local seasonal conditions. Thorough knowledge of the physicochemical properties of the SRF input is the basis for the holistic prevention of pollutant recycling in nature.
3.1. The Mission of the CWWTPL to Achieve SDGs in Clean Water and Sanitation and Responsible Consumption and Production
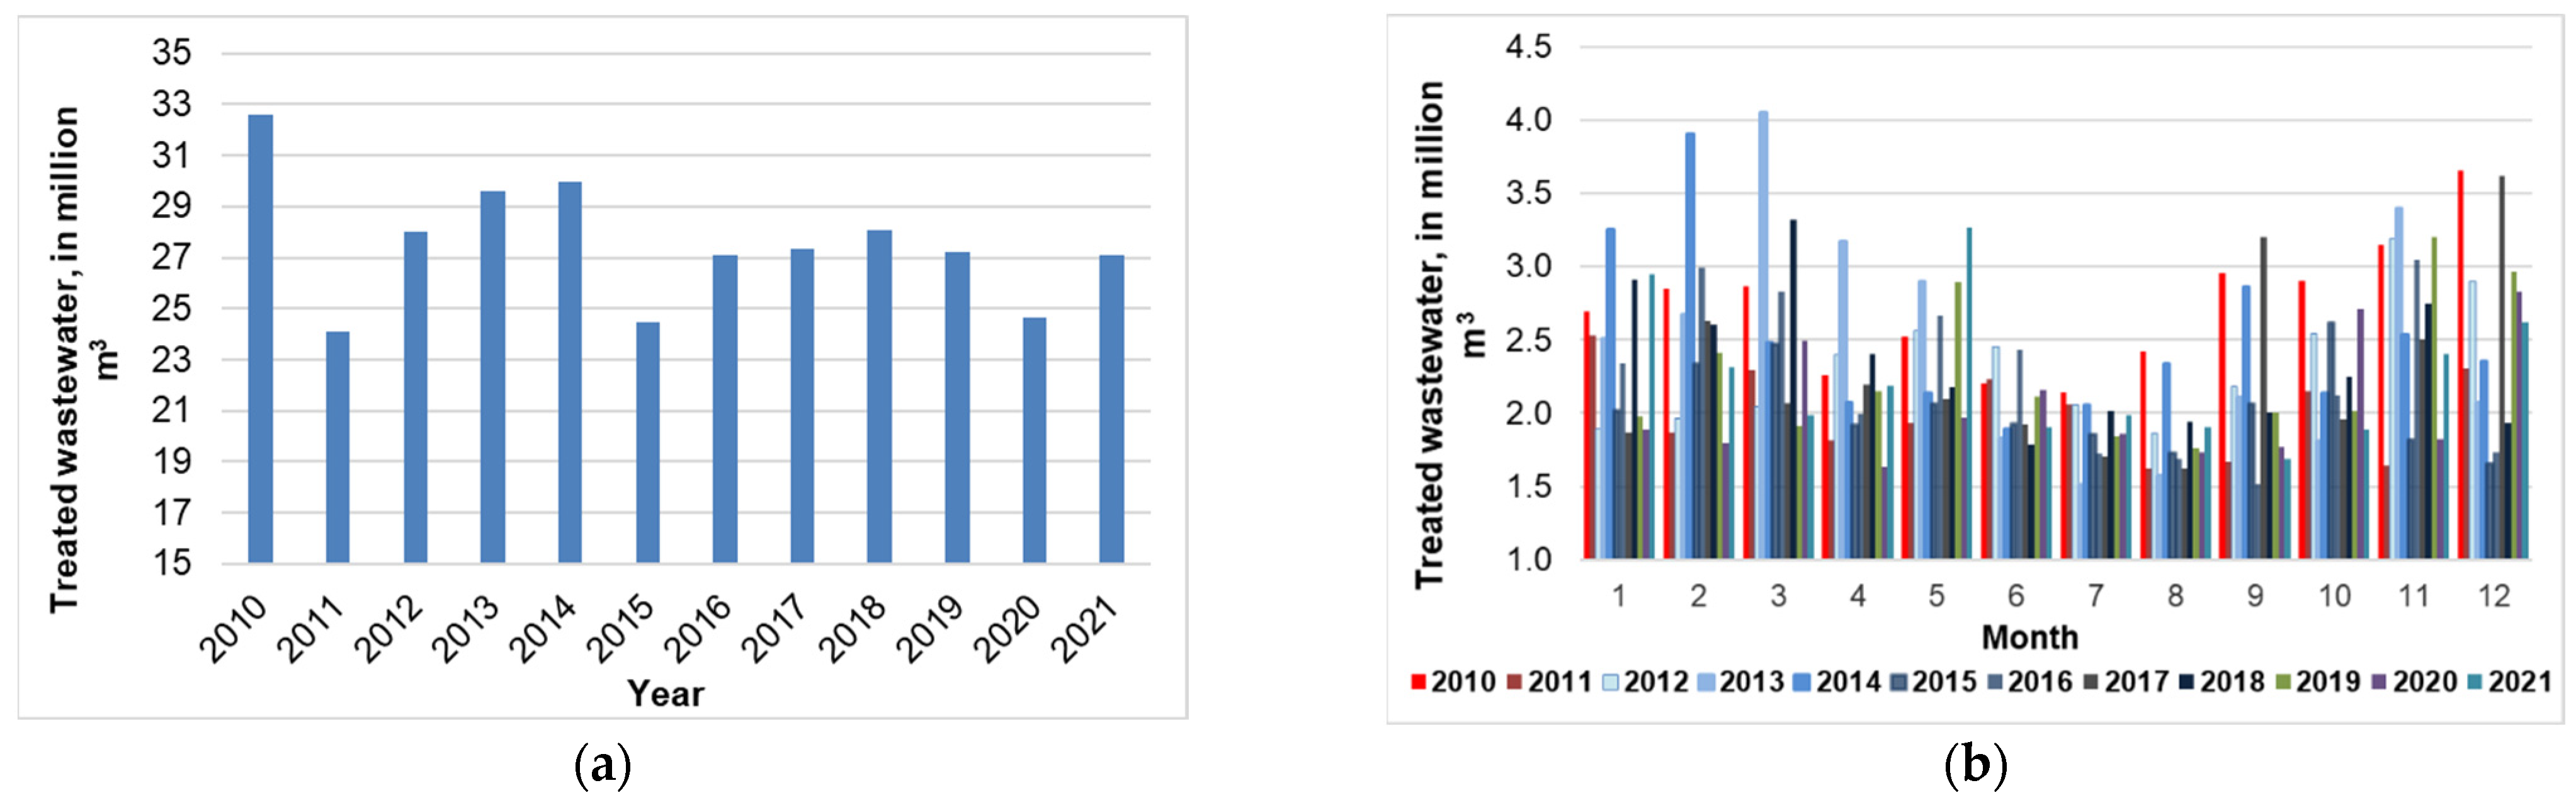
To estimate the treatment efficiency of organic pollution, nutrients, and potentially toxic metals (PTMs), and predict their concentration level in the pellets, it is necessary to monitor the quantity and quality of inlet and outlet of a UWWTP. The quantity and flow rate of municipal wastewater, and the organic load expressed as COD in tonnes of oxygen, are the most critical parameters for determining the treatment efficiency of a UWWTP. The total annual amount of treated wastewater at the CWWTPL varies between (in million m
3) 32.59 (2010, a rainy year), 24.10 (2011), 28.02 (2012), 30.00 (2014), and 27.09 (2021) (
Figure 3a). The monthly amount of treated wastewater at the CWWTPL ranges from 1.5 million m
3 in the dry summer of 2016 to 4.05 million m
3 during the rainfalls in the spring of 2013 (
Figure 3b). In the period 2010–2021, the average daily organic load (PE
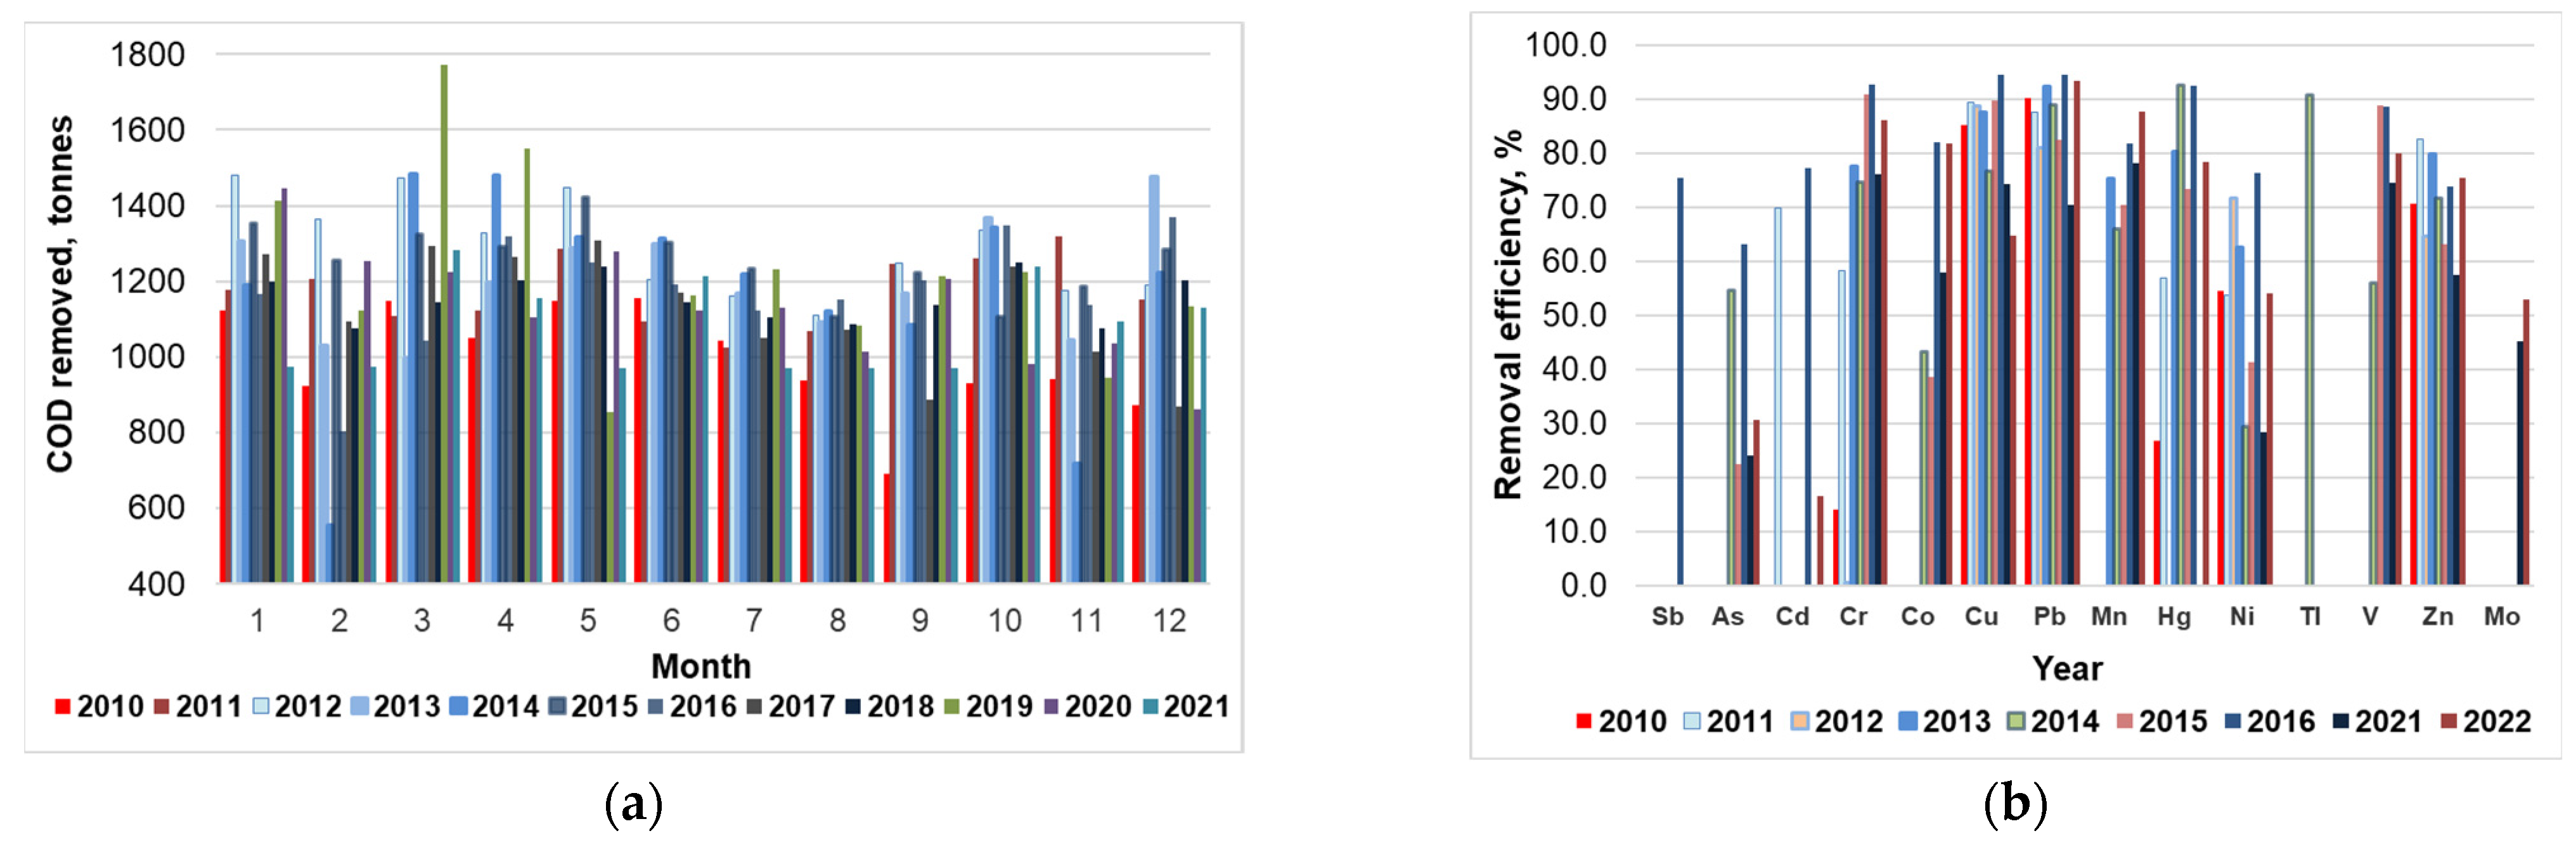
COD) varied between 299,200 (2010, a rainy year), 345,400 (2011), 373,800 (2012), 340,300 (2014), and 293,000 (2021, a COVID-19 year). The CWWTPL’s geographical area characterises a pronounced rainy season in early spring and late autumn. On the contrary, compared to the apparent seasonal changes in the amount of treated wastewater, the monthly amounts of COD removed are only slightly increased in the spring period (
Figure 4a). On average, in 2010–2021, the treatment efficiency of COD was 92.5%, while the annual amount of removed COD fluctuated between (in tonnes of oxygen) 15.51 (2012), 14.04 (2014), 12.94 (2021), and 11.96 (2010).
HMs most often characterise the environmental quality of generated sewage sludge. The scope and content of the list of HMs as limit parameters differ in EU Directives. EU Directives EQSD [
5] and PSD [
40] prescribe the list of pollutants, which is the basis for the chemical and ecological status assessment of the receiving water body. The following HMs and their compounds are on the list: (i) the Priority Hazardous Substances Cd (in µg L
−1 for a surface water body) and Hg (in µg L
−1 for a surface water body and µg kg
−1 wet weight for biota), (ii) the Priority Substances Ni and Pb (in µg L
−1 for a surface water body), and (iii) the non-synthetic Special Pollutants—the list with their limit values is in the domain of each EU Member State separately (in µg L
−1 for a surface water body) B, Sb, As, Co, Cr, Cu, Mo, Se, and Zn [
44]. By the E-PRTR Regulation [
47], a register is kept about the released and transferred pollutants from large UWWTPs (organic load ≥ 100,000 PE). Among other parameters, the following metals’ content and their compounds are monitored (in kg year
−1): As, Cd, Cr, Cu, Hg, Ni, Pb, and Zn. According to the IED [
23], the following metals and their compounds are monitored for emissions of substances into (i) the air (in mg Nm
−3) Sb, As, Cd, Co, Cr, Cu, Hg, Mn, Ni, Pb, Tl, and V, and (ii) into the receiving water body (in mg L
−1) As, Cd, Cr, Cu, Hg, Ni, Pb, Tl, and Zn. Following the SSFD [
32], the quality of treated sewage sludge for agricultural use is judged on the content of (in mg kg
−1DM) Cd, Cr, Cu, Hg, Ni, Pb, and Zn. The parameters determining the treated sludge quality differ from its intended final utilisation. For example, the requirement for determining tin (Sn) is given only in the Technical Standard [
18]. In nature, the pollutants are circulating in the environment and the EU Commission should unify the parameters to establish a holistic approach to environmental protection and human health. Many different EU Directives on environmental quality complicate the transparency of the requirements for the holistic consideration of the quality of pre-treated sludge.
Figure 4b shows heavy metals’ average annual removal efficiencies from raw wastewater between 2010 and 2022. The treatment efficiency was monitored twice a year only for As, Cd, Co, Cr, Cu, Hg, Ni, Pb, and Hg (
SM: Tables S2–S5 and S7). For Sb, Tl, V, and Mn, the treatment efficiency has been monitored since 2013 (
SM: Tables S3, S6 and S8), and for Mo, only in the last two years (
SM: Table S8). In June 2022, the concentrations of heavy metals in raw wastewater follow in the order (in mg L
−1) Zn (0.28) > Mn (0.25) > Pb (0.024) > Cr (0.019) > Ni (0.017) > Cu (0.015) > V (0.0031) > Co (0.0029) > Tl (0.0025 = LOD/2) > As (0.00093) > Mo (0.00054) > Sb (0.00035) > Cd = Hg (0.00019) (
SM: Tables S2–S8). On average, the order of treatment efficiency in 2010–2022 is (in %) Pb (86.8) > Cu (83.4) > V (77.6) > Mn (76.6) > Hg (71.5) > Zn (71.0) > Cr (63.5) > Cd (54.6) > Ni (52.5) > Mo (49.1) > As (32.5) (
Figure 4b,
SM: Tables S2–S8). From the data on the removal efficiency of PTMs, no distinct trend can be observed. The mixture of large amounts of precipitation and municipal wastewater in 2010 (
Figure 3b) reflects poorer removal efficiency only for Cr and Hg (
Figure 4b). Active sludge is undoubtedly a suitable tool for removing such pollutants based on adsorption [
48], absorption, and biological processes. Only one measurement was quantified for Sb at inflow (2.1 µg L
−1; 75.5% treatment efficiency). Other results were below LOD = 0.001 mg L
−1 at inflow and outflow (
SM: Table S3). In addition, for Tl, it was possible to estimate the treatment efficiency with only one measurement (90.8% removal efficiency), which was higher than LOD at inflow and outflow (
SM: Table S5). In the mentioned time period, only two measurements were performed for Mo (1.8 µg L
−1 at inflow with 45.3% removal efficiency and 0.54 µg L
−1 at inflow with 53.0% removal efficiency).
3.2. The CWWTPL as a Point of Acceptance of Non-Hazardous Waste to Produce the SRF
The pellets are non-hazardous waste (
SM: Table S9) [
49,
50,
51,
52,
53,
54], which is also a precondition for using waste to prepare an SRF. A bridge must be made from “Agreed acceptance criteria” to “Customer specific requirements” [
17,
18]. According to the UWWTP’s mission, this means that a bridge between “treated sludge as a tool to remove pollutants from wastewater” and “a valuable material useful for SRF that fulfils customer-specific requirements” must be created.
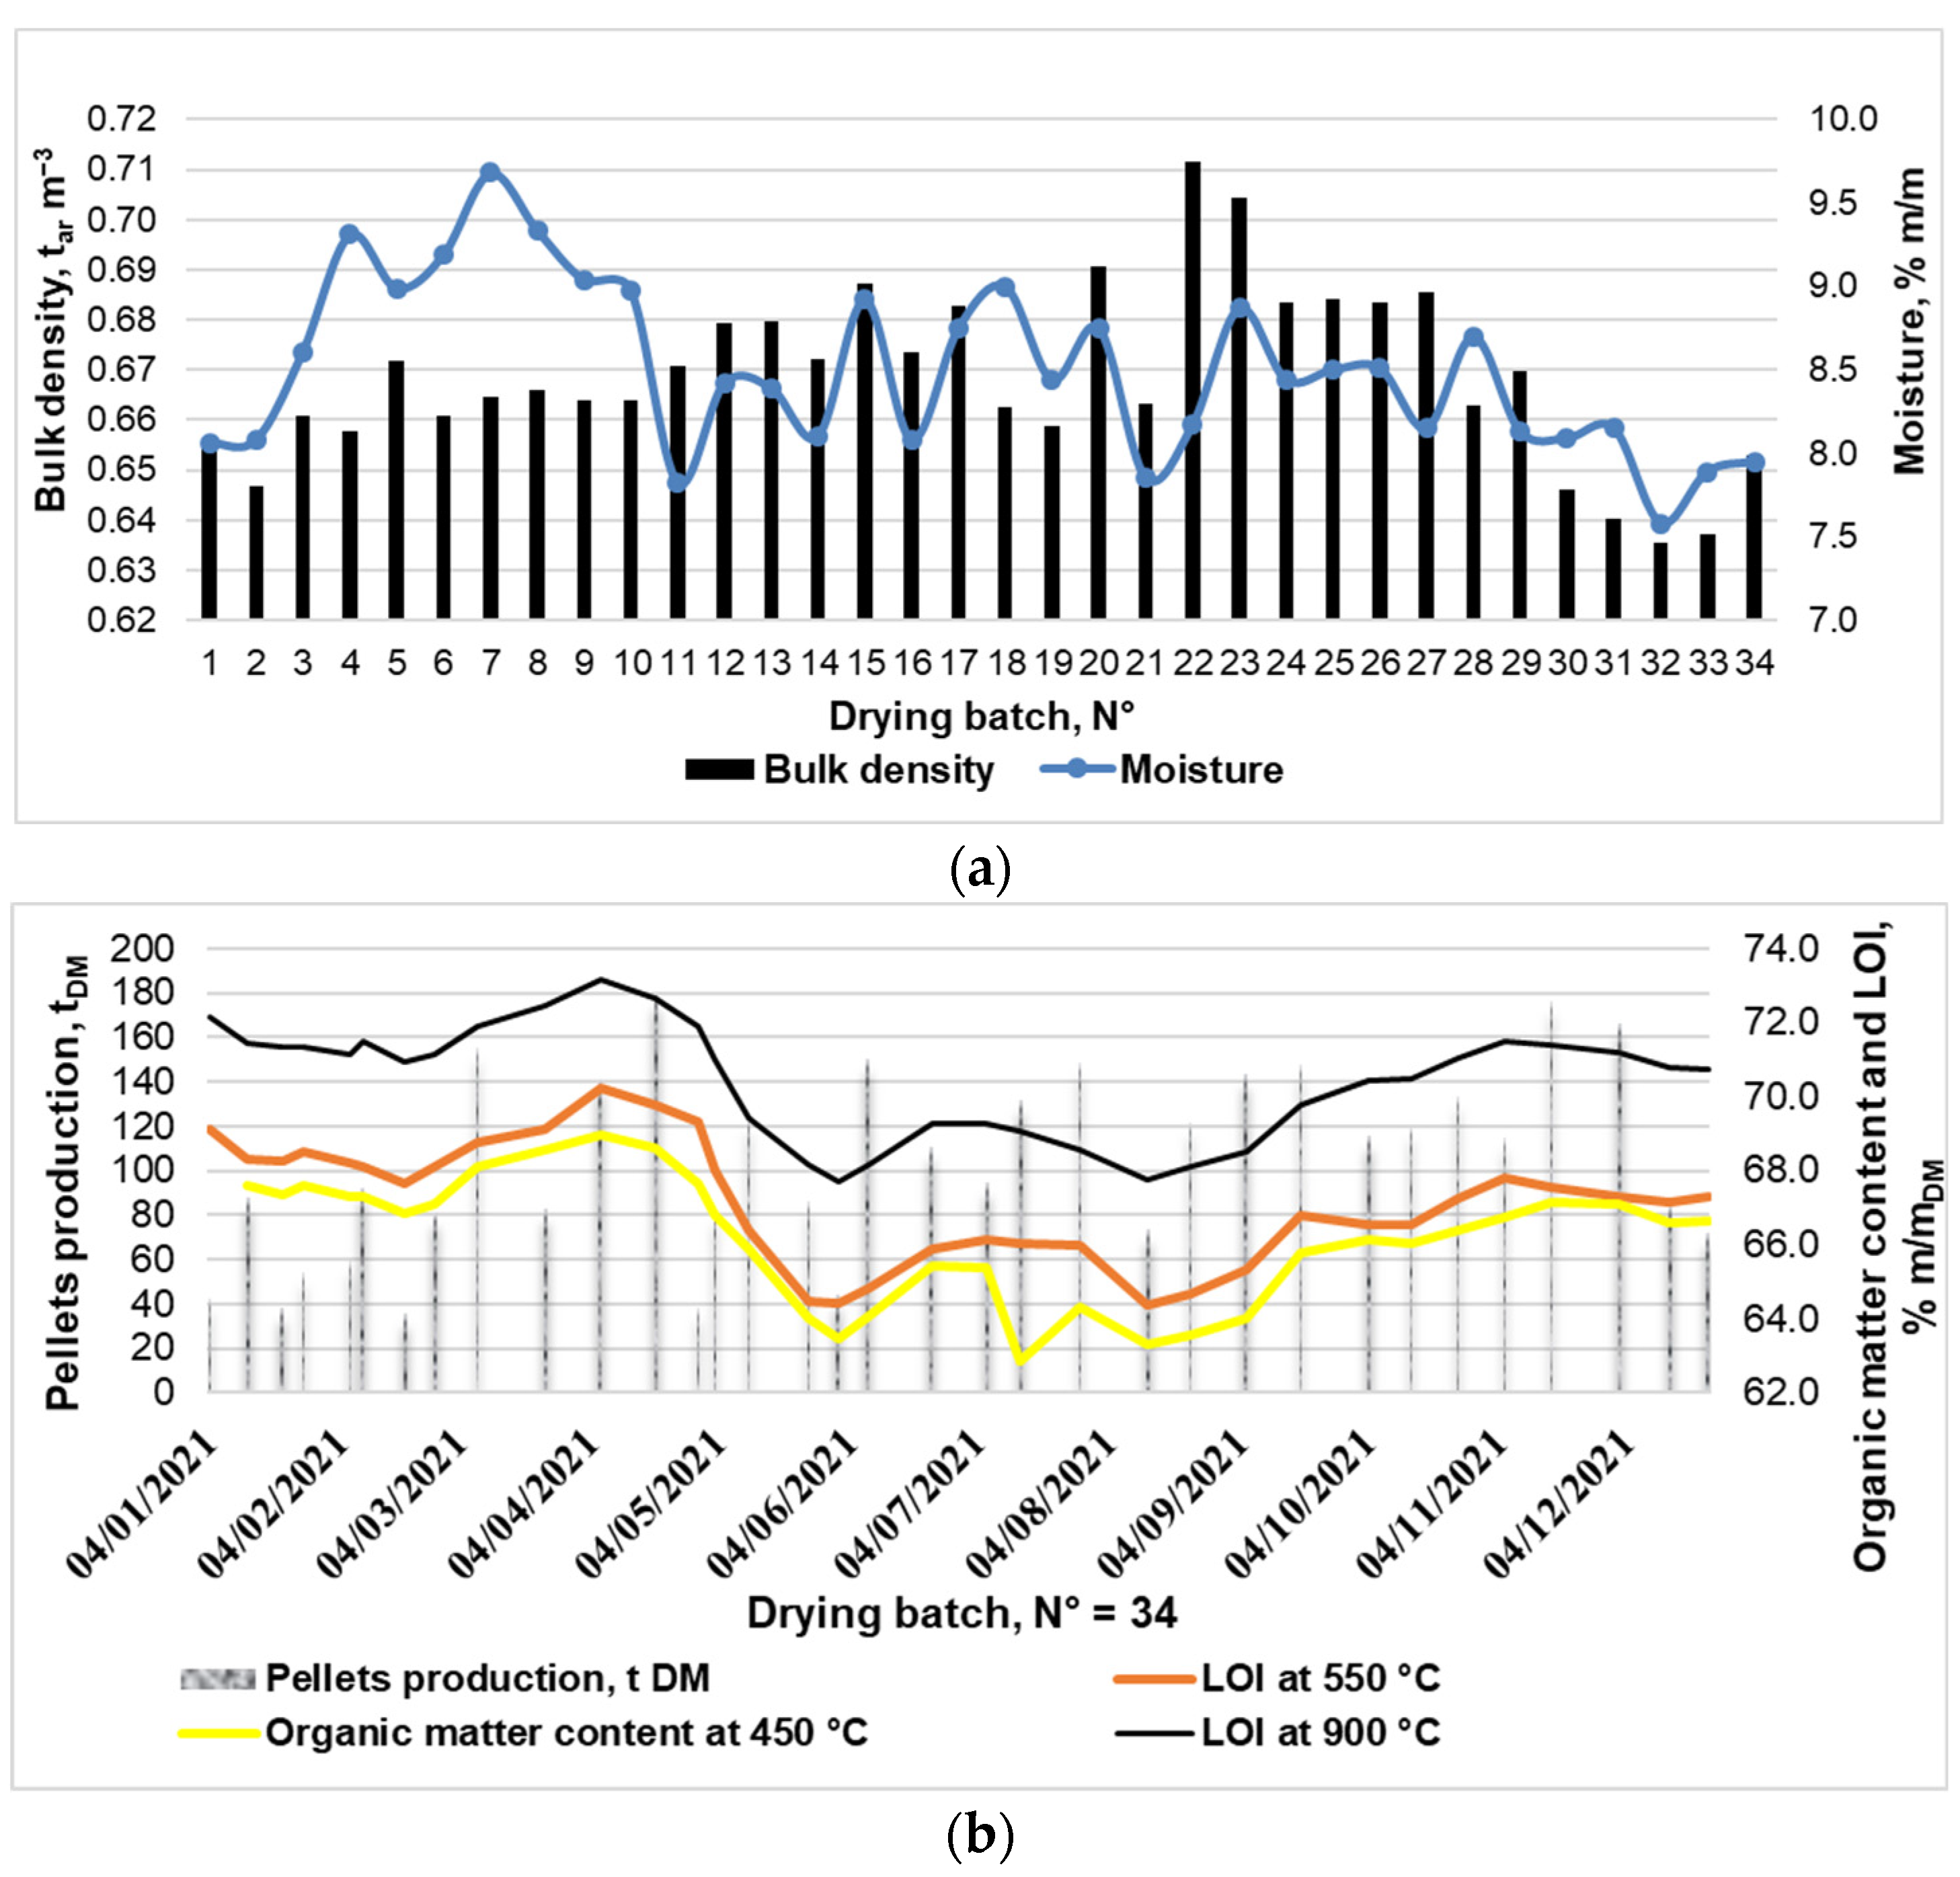
At the CWWTPL [
35], the digestate drying process is performed in batch mode [
36]. In 2021, there were 34 single batches (
Figure 5a), and the quality of representative samples of a single batch series fluctuates markedly seasonally (
Figure 5b). The period of a single batch is of different lengths, so the mass of pelletised digestate during one batch varies from 38 tonnes to 175 tonnes (
Figure 5b).
The moisture content fluctuates from 7.5% m/m to 9.5% m/m, and the bulk density from 635 kg m
−3 to 711 kg m
−3 (
Figure 5a). The pellets’ biomass content (LOI at 450 °C as an organic matter content) is characterized as the lowest over the summer. In contrast, the mineral content, determined as the difference between LOI at 550 °C and LOI at 450 °C, is the highest (
Figure 5b). The latter mass loss is probably due to the thermal decomposition of MgCO
3 or minerals containing magnesium, phosphorus, and carbonates [
36]. The CaCO
3 content, evaluated as the difference between LOI at 900 °C and LOI at 550 °C, is stable over the year (
Figure 5b).
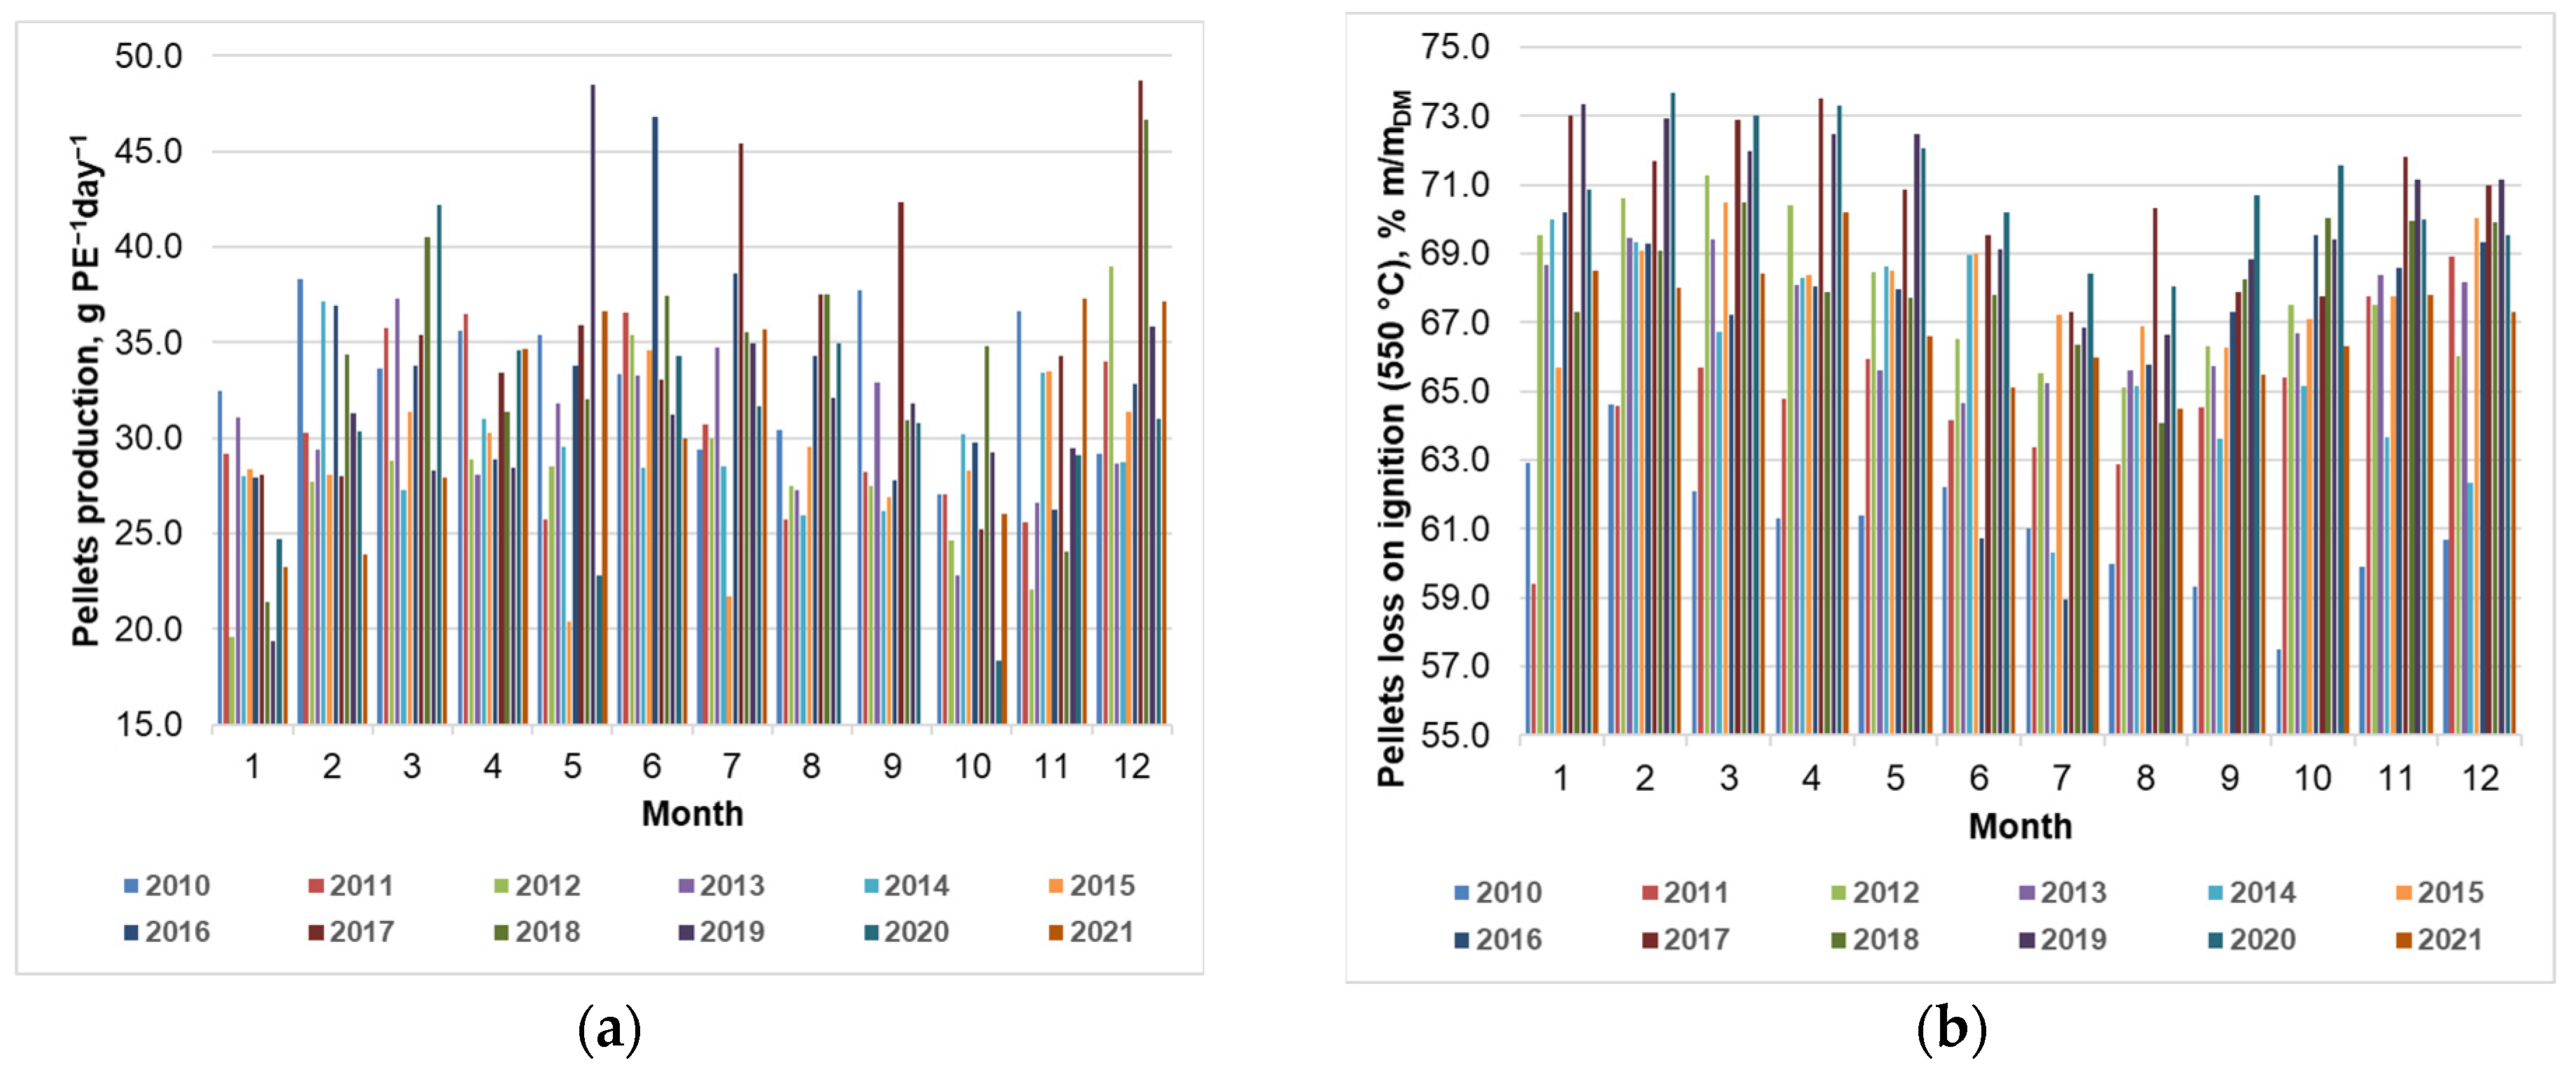
On average, the pellets production from 2010 to 2021 was (i) 31.4 g
DM ± 5.6 g
DM per 1 PE
COD in one day (
Figure 6a), (ii) 10.6 ± 0.6 (in tonnes
DM per day), (iii) 322.0 ± 55.9 (in tonnes
DM per month), and (iv) 3864 ± 1 (in tonnes
DM per year). In the summer months, the production of pellets is higher (
Figure 6a), while their volatile fraction is lower (
Figure 6b), namely, 65.5% m/m
DM on average, while the average of the other months is 68.1% m/m
DM. Received quantity at stakeholders fluctuates between (in tonnes) 3915 (2014), 3930 (2010), 4012 (2021), and 4158 (2012).
3.3. The Pellet’s Specification
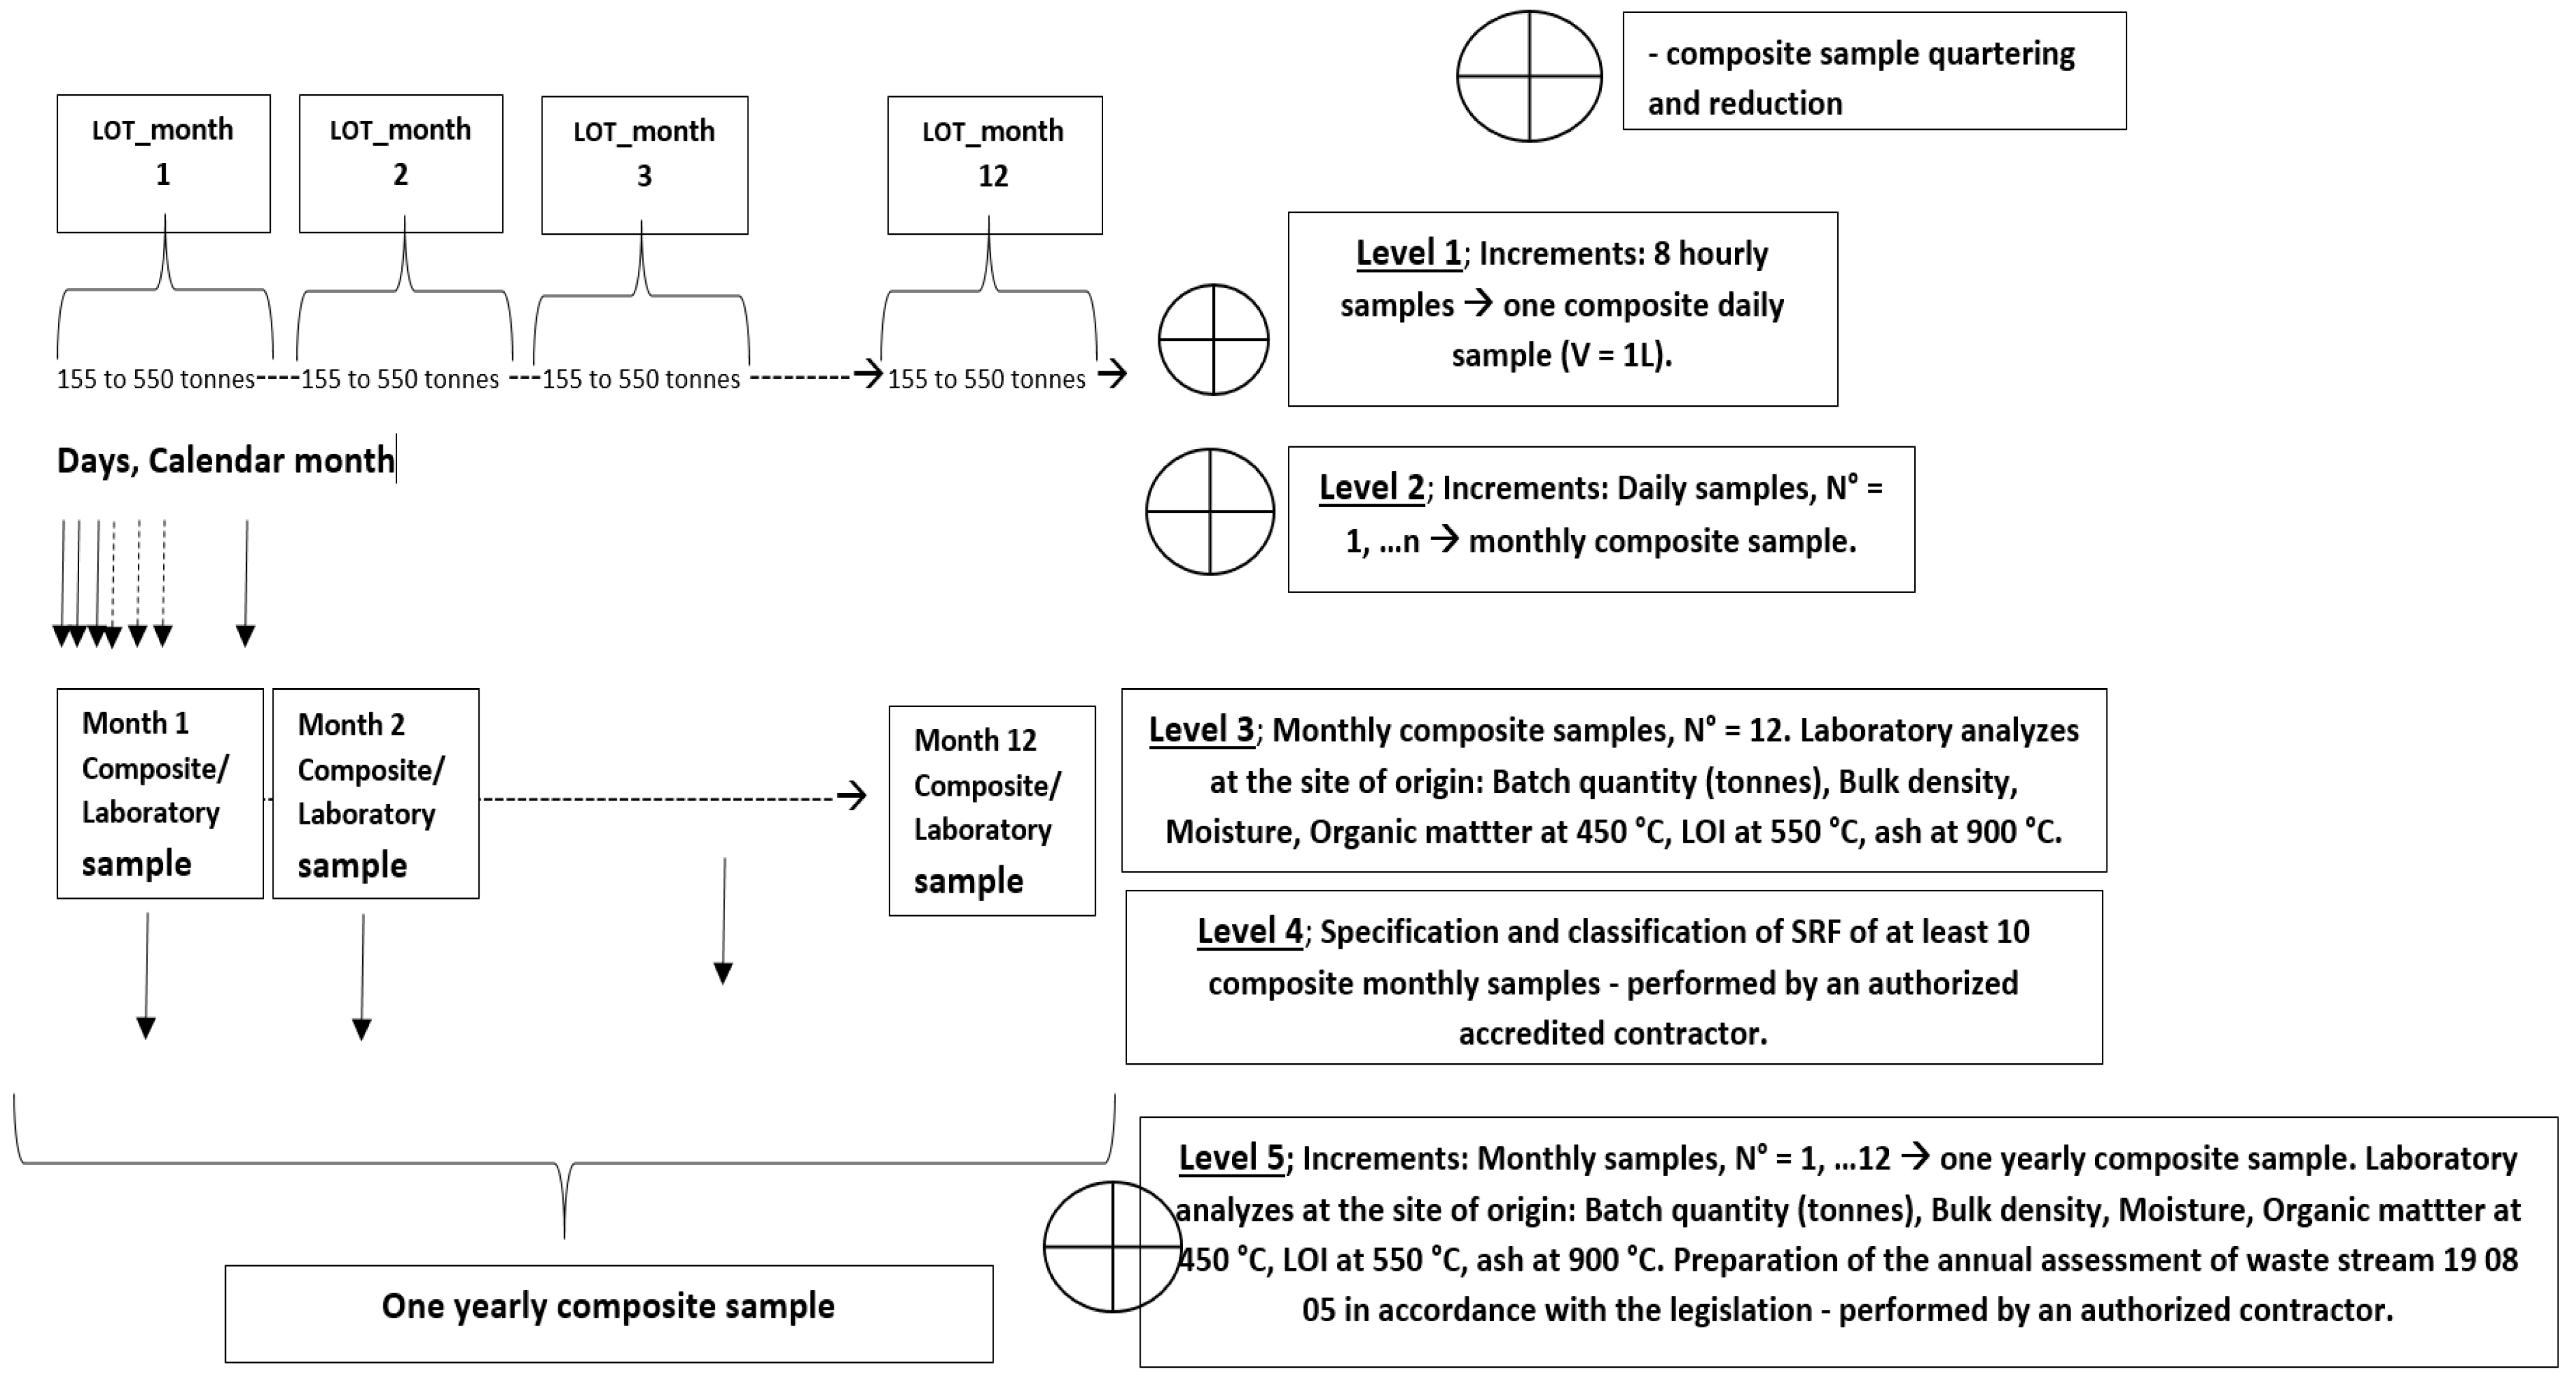
Technical standards [
17,
18] are the source of the SRF sampling concept and characterisation procedure. The samples and subsamples preparation and their storage take place in 5 levels (
Figure 2): (i) Level 1—one sample increment (grab sample) every three hours of pellets production, (ii) Level 2—daily representative samples, (iii) Level 3 and Level 4—batch/monthly samples, and (iv) Level 5—annual representative sample.
Due to the mechanical treatment of raw wastewater, no visible particles are detected in the pellets as macroscopic impurities (MIs) as the glass, metal, and plastics are. Results of content tests are MIs < 0.5% m/mDM.
According to the SRF characterisation procedure, the volatile matter determined at 550 °C presents the combustible share of SRF in question. The share of volatile matter in annual representative samples, expressed as LOI at 550°, ranges from 61.1% m/m
DM (in 2010) to 70.9% m/m
DM (in 2020), which contributes to the NCV and economically favourable energy use (
Table 1). Ash content presents the mass of inorganic residue after fuel ignition under specific temperature conditions.
The sources of carbon (organic and inorganic), nitrogen, hydrogen, and sulphur in pellets are biological macromolecules (proteins, carbohydrates, lipids, and some coenzymes) and the mineralogic structure of microorganisms (as a carbonate content). The latter are carriers of biological processes of municipal wastewater treatment. Because pellets are a biogen material, they contain (i) vital elements (C, H, N, S, O), (ii) nutrients and macroelements (N, P, Si, Ca, Mg, K, and Na), and (iii) essential PTMs (Fe, Mn, Co, Zn, Cu, Cr, and Mo), (iv) non-essential PTM (Al), and (v) highly toxic PTMs (Hg, Cd, Pb, and metalloid As) [
55,
56].
Table 2 shows from 2010 to 2021, the content (in % m/m
DM) of nitrogen (2010–2021; c (N) = 5.35 ± 1.05), hydrogen (2010–2014, 2021; c (H) = 4.65 ± 0.38) and sulphur (c (S) = 1.01 ± 0.21) repeated in pellets. Pellets’ ultimate analysis from 2010 to 2021 shows significant deviations in organic carbon content (c (TOC) = 35.1 ± 3.7% C m/m
DM). The year 2010 was extreme in rainfall, so TOC is the lowest. After 2014, there is a slight downward trend (
Table 2). Changes in the anaerobic stabilisation of excess sludge and biogas production contribute to the lower value for TOC in 2021.
The pellets’ content and the composition of the main mineral elements are essential in predicting the properties of the resulting residue and its impact on the optimal operation of the facility (
Table 3). Na, K, and Al could influence the appearance of sintering of the residue and the formation of melt, which is disturbing for the device.
From the point of view of material use and the CE, the residue contains many critical raw materials (phosphorus and other nutrients), as well as elements that contribute to the usefulness of the residue for geotechnical composites and construction products, and this is a great advantage. The content of macroelements (P, Si and Ca) in pellets is regularly monitored (
Table 3). The content of phosphorus as an essential critical raw material for the CE [
57] was reproducible from 2010 to 2021 (till the summer of 2022, the chemical removal of phosphorus at the CWWTPL was not yet underway) due to stable biological processes. There is a decreasing trend for potassium content and TOC as nutrients. The content of Si and Ca in the pellets fluctuates (
Table 3), which means that they are subject to the impact of stormwater discharges into the public sewerage system. The content of Mg, Fe, Al, Ti, and Na is not monitored regularly, but it can be estimated that they have repeatable values.
Table 4 shows an overview of micronutrients and trace elements. Their increasing content in pellets presents their order in 2021 (
Table 4, sample Y2021). The IED [
23] sets the emission limit values for Tl, Cd, Hg, As, Ni, Pb, Cr, Cu, and Zn for wastewater discharges from waste gas treatment.
The pellets’ chlorine content in 2010–2021, which can potentially cause corrosion in the incinerator, is low (c (Cl) = 0.079 ± 0.034% m/m
DM) and results from edible salt in municipal wastewater (
Table 4). Besides chlorine, zinc has the highest content in pellets among the elements listed in
Table 4 (according to the removal efficiency is in 6th place,
Figure 4b). Zink is relevant for emission limit values for discharges of newly generated wastewater at the combustion plant. As a heavy metal, Zn also has the highest concentration in raw wastewater (
SM: Table S4). Co, Mn, and V are elements for which EU Directives determine only the emission limit values into the air [
23]. According to the Slovenian legislation, Sb, As, Co, Cr, Cu, Mo, and Zn are also non-synthetic Special Pollutants of surface water bodies [
44]. As a pollutant, Tl is mentioned only on the list for the emission limit values into the air and newly generated wastewater. The concentration of Tl in SRF is practically zero [
18], which was also confirmed for pellets (
Table 4). Among the elements in
Table 4, a decreasing trend in their content in pellets is observed only for Cd and Hg. Hg is an atmospheric deposit and poses a global threat to the environment and human health. Due to human activity, Hg levels in the atmosphere were 450% above natural values, representing a 20% increase in Hg in the environment between 2010 and 2015 [
58].
The obtained data (
Table 2,
Table 3 and
Table 4) are essential from the point of view of wastewater treatment, protection of natural water sources, and further procedures for the final use of pellets. The purpose of the multi-year data is to assess the pellets’ quality and their end users’ supply dynamics. It should not only look at the basic parameters for pellets classification as a solid alternative fuel. If the goal is the sustainable consumption of pellets, it is also necessary to know the dynamics of macro-, micro-, and trace elements. These data enable careful consideration of the transfer of pollutants to the final stakeholders, with the aim of efficient and safe management of combustion plants, flue gas cleaning, and optimal ash management, which are essential aspects of the sustainability of energy use. In 2010–2021, the prescribed sum of concentrations of analytes Sb, As, Pb, Cr, Co, Mn, Ni, and V [
23] fluctuated between (in mg kg
−1) 841 (2010), 1001 (2012), 1126 (2021), and 1140 (2014).
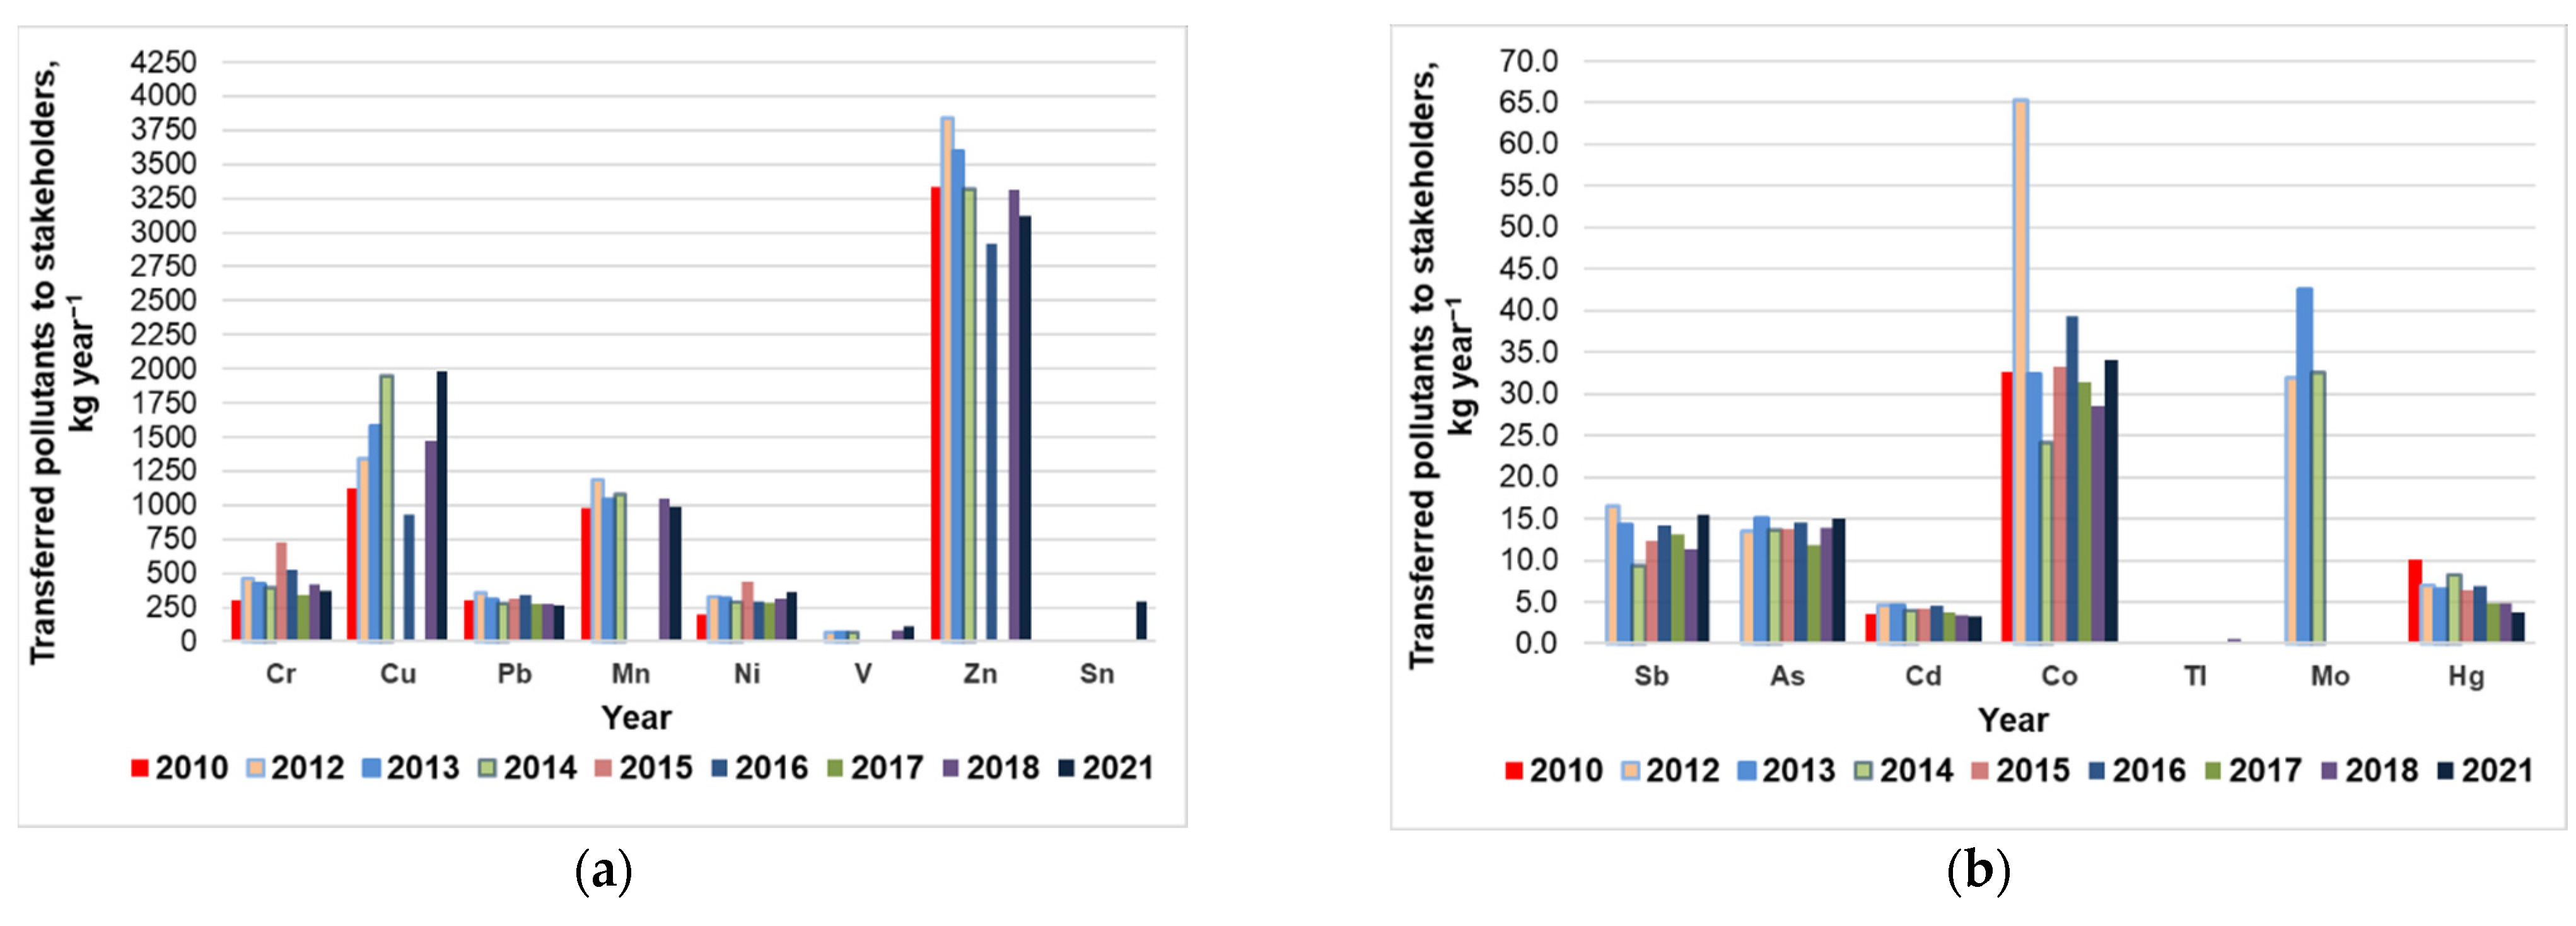
Figure 7a presents the annual amount (except for the years 2015 and 2017, when the basis for the calculation was the average value for monthly representative samples) in the order of magnitude from 65 kg (V in 2012) to 3839 kg (Zn in 2012) of HMs transferred to stakeholders.
Figure 7b presents the transferred amount up to 65 kg. Regarding the amount of heavy metals transferred to stakeholders in 2010–2021 (
Figure 7), the order is as follows (in average mass (kg) ± relative standard deviation (RSD) in %): Zn (3351 ± 9.81) > Cu (1543 ± 25.6) > Mn (1071 ± 6.93) > Cr (460 ± 28.2) > Ni (325 ± 14.6) > Pb (303 ± 11.6) > Sn (290, N
o = 1) > V (78.7 ± 21.6) > Co (35.9 ± 35.1) > Mo (35.6 ± 16.8) > As (18.8 ± 8.45) > Sn (13.4 ± 17.0) > Hg (6.06 ± 24.8) > Cd (4.02 ± 13.5). According to one measurable measurement of thallium in 2016, its annual amount transferred was 550 g. The obtained data show us the difference in the quality of the pellets, which depends on the characteristics of the catchment area (organic load of wastewater expressed as PE, number of inhabitants, industrial activity, mixed or separate sewage system) and the influence of atmospheric deposits, for example, Hg. The latter accumulates in the waste rainwater that flows to the municipal treatment plant. The trend of the annual transferred amounts of Hg shows a significant decrease, while the shares of other pollutants do not offer a marked tendency (
Figure 7).
Knowing micro-elements content is essential when it is necessary to immobilise PTMs in cases where the appropriate leachate quality is a condition for specific product use. Data on the range of micro-elements are also crucial for extraction procedures of phosphorus recovery because they can predict the quality of the extract with the soluble form of phosphorus. Based on the quality of the treated sludge in question, a technologist can prepare an appropriate plan for the most optimal phosphorus recovery process. In addition to phosphorus, when there is a shortage of raw materials, pellets will become interesting for obtaining other elements, for example, copper, nickel, and cobalt.
Data on the content of transferred pollutants are essential for controlling the mass flow of pollutants to prevent their circulation in the environment (
Figure 7).
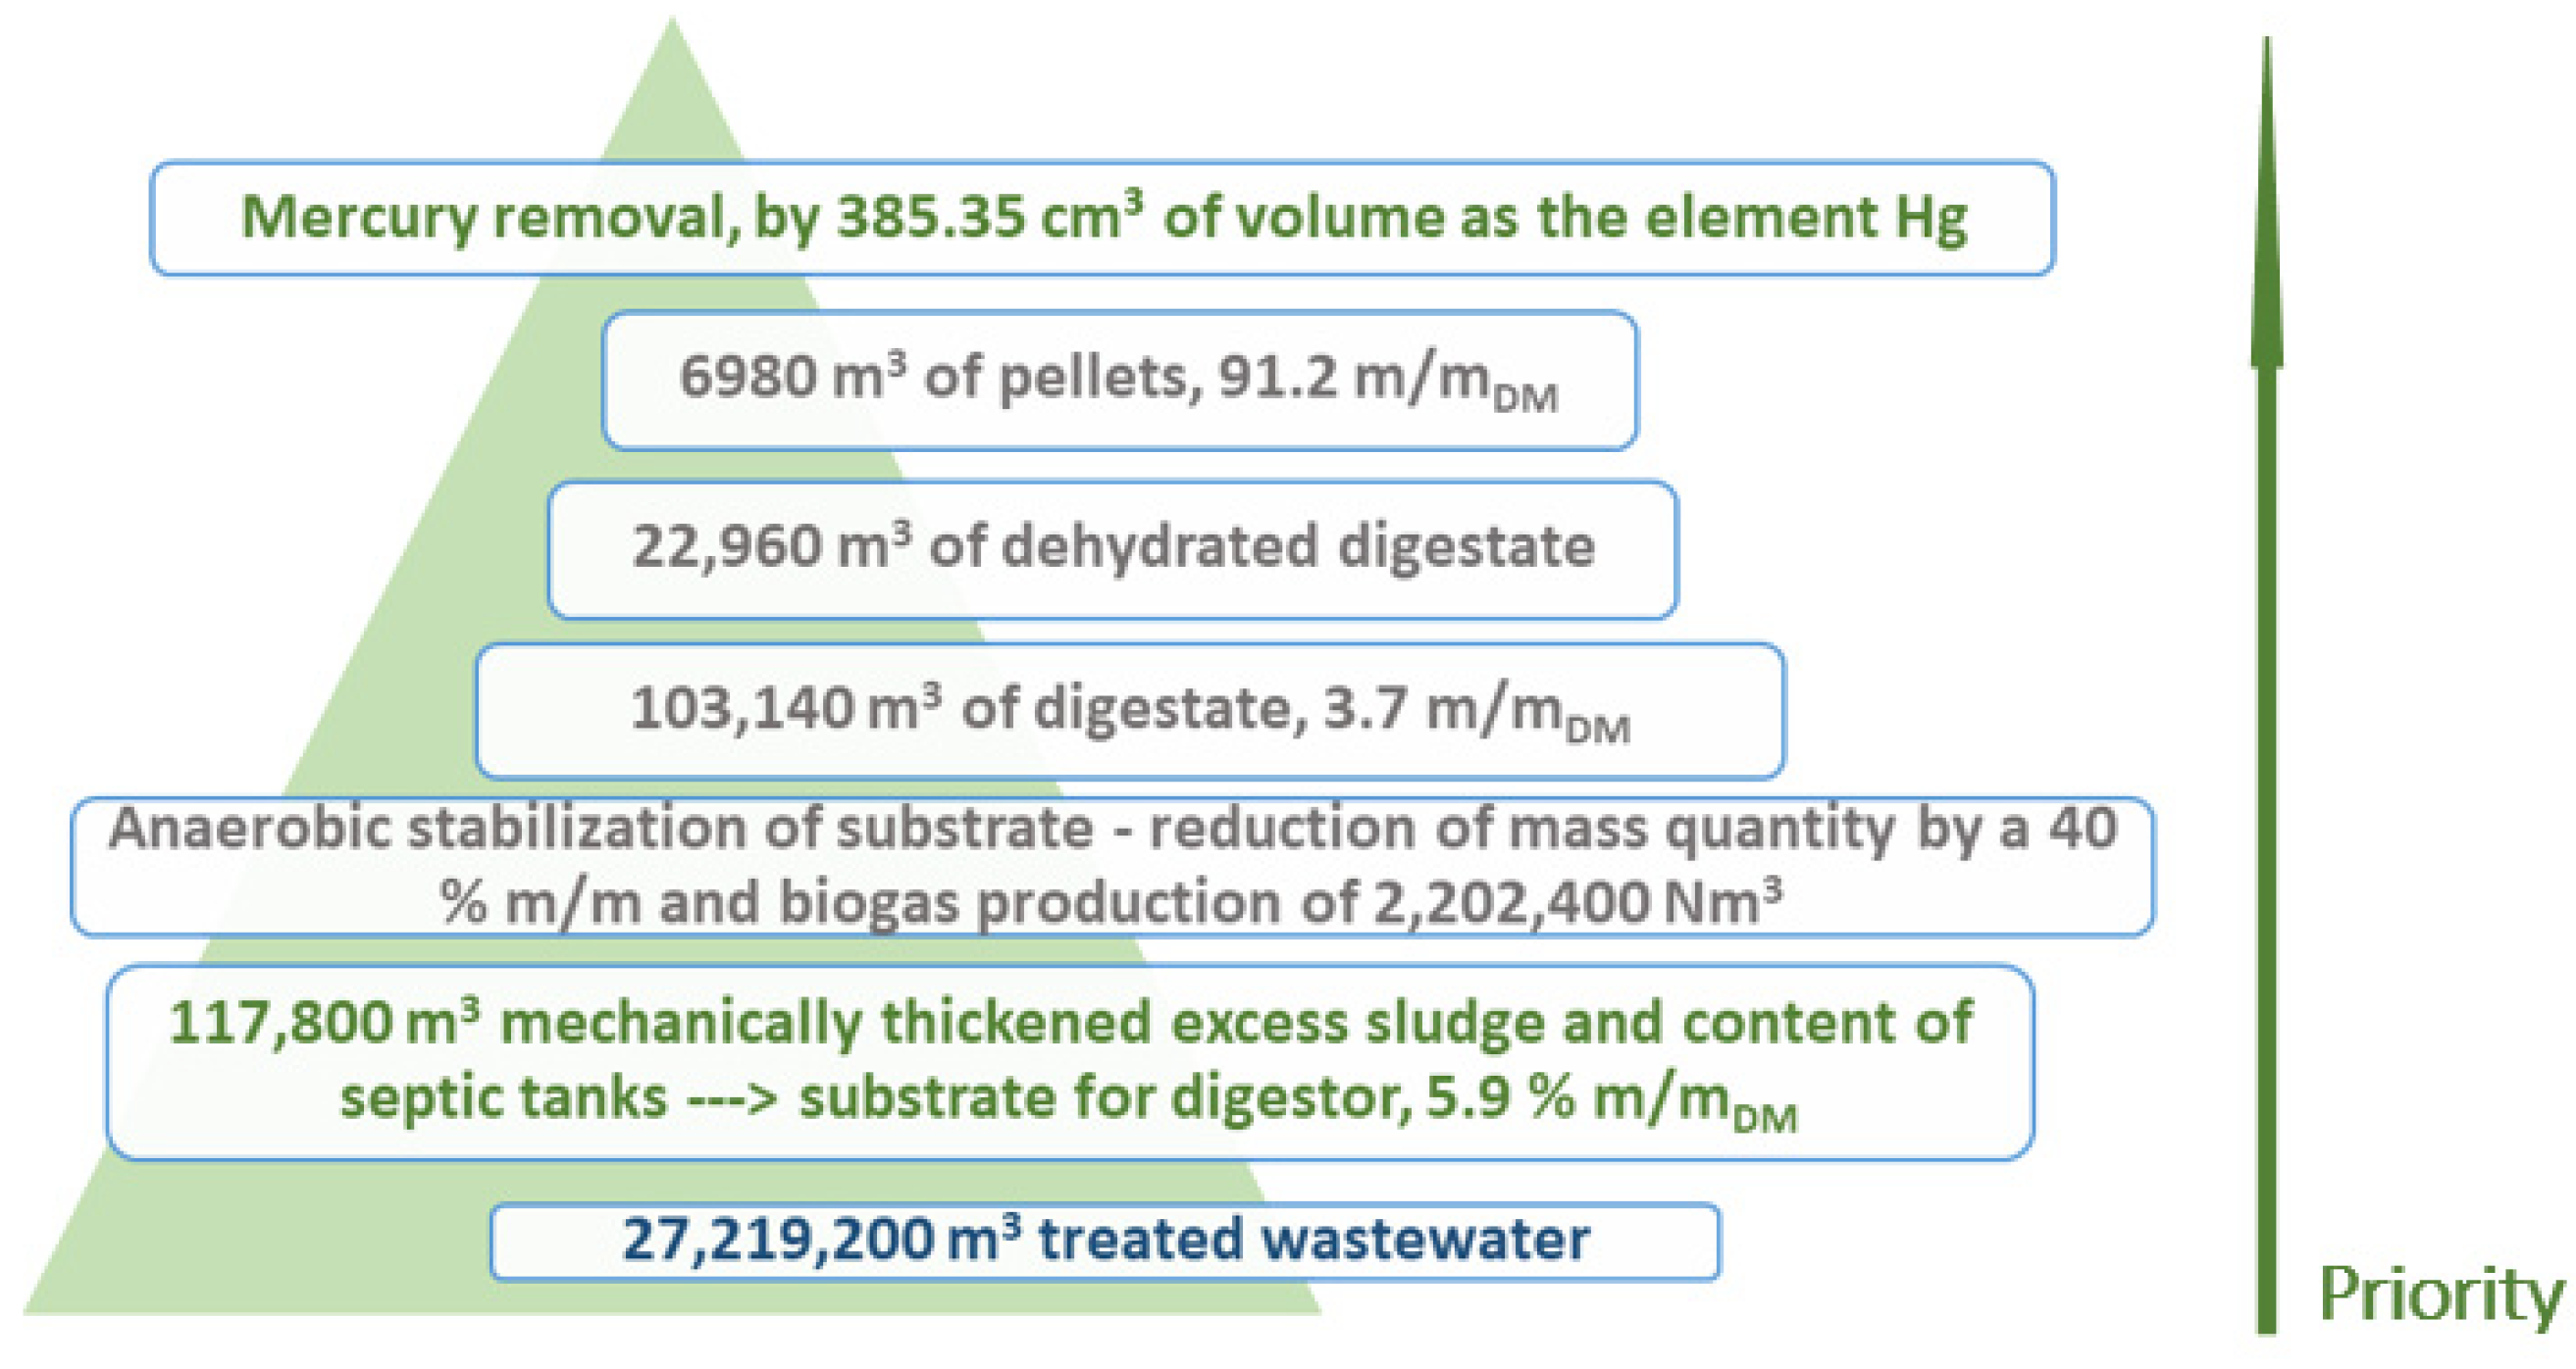
The fundamental mission of CWWTPL operation is to treat municipal wastewater, the contents of septic tanks, and sewage sludge produced at small UWWTPs. The
Figure 8 schematic presents the priority route. The results of wastewater and sewage sludge management at the CWWTPL for 2019 show the basic concept of the UWWTP’s mission. In 2019, 27.2 million m
3 of treated wastewater were released into the Ljubljanica river. The pellets’ production was 6980 m
3 in volume. This means that 4443.78 tonnes of pellets were delivered to the stakeholder, and 0.00039 m
3 of mercury was transferred with them (
Figure 8).
3.4. Point of an SRF Delivery
The point of pellets’ delivery is the turning point at the CWWTPL when pellets become a renewable fuel source [
19]. The point of delivery is an important point where pellets change ownership and category—they become a combustible material. The stakeholder assumes environmental responsibility for their economic use. As the accompanying documentation is comprehensive and indicates all characteristics, it enables the stakeholder to manage produced ash and minimise the environmental impact. Necessary is knowledge of (i) pellets’ classification, (ii) transport dynamics and average daily delivered quantity, (iii) optimal energy use and mixing with other combustible materials and waste, (iv) potential environmental impact due to pellets combustion, and (v) the process of incineration (combustion behaviour, prevention of corrosion on the device, and ash production).
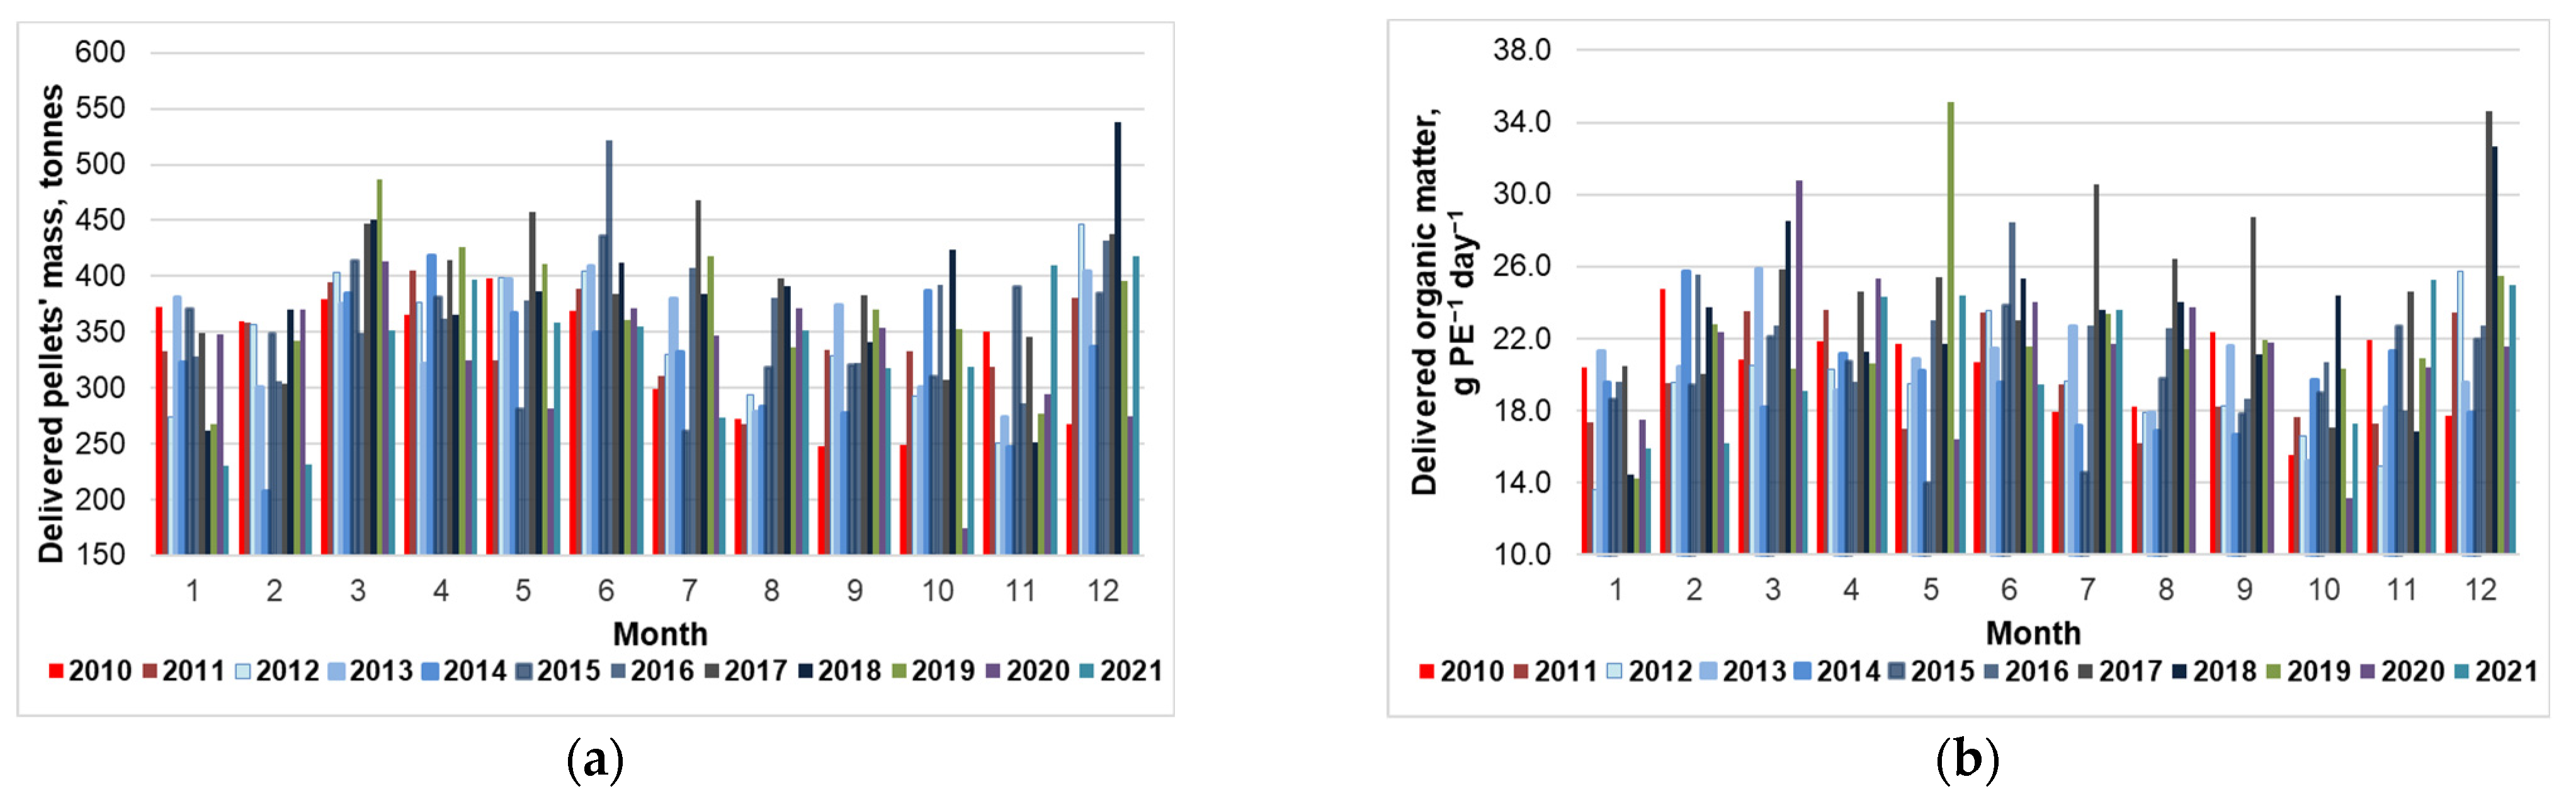
Figure 6 presents the seasonal dynamics in pellets production (on average, 31.4 g
DM ± 5.6 g
DM per 1 PE
COD in one day) and their volatile matter as LOI in % m/m
DM. In contrast,
Figure 9 presents the dynamics in the delivered monthly amount of pellets in tonnes and their monthly average organic content expressed in g PE
−1 day
−1. The dynamics in
Figure 4a (COD removal),
Figure 6a and
Figure 9a,b are comparable. On average, in terms of delivered combustible material, the transferred organic matter to stakeholders in 2010–2021 was (i) 21.2 ± 3.9 (in g per 1 PE
COD in one day), (ii) 7.1 ± 0.6 (in tonnes per day), (iii) 217.4 ± 40.8 (in tonnes per month), and (iv) 2609 ± 1 (in tonnes per year).
3.4.1. Pellets Classification as an SRF
Dried treated sewage sludge is a biogen material and a specific non-hazardous waste stream (
SM: Table S9). The studies by [
30,
36,
59] reveal that to achieve adequate traceability of pellets, and their quality and classification for use as an SRF, it is necessary to establish an appropriate quality management system.
Only fuels derived from non-hazardous waste [
17,
18,
31] can be classified as SRF. Five quality classes divide each classification characteristic (
SM: Table S10). Each classification characteristic should be considered equally important. The Class code combines all three key properties and shall be included in the specification. Fuel outside the ranges of the classes shall not be defined as SRF [
18]. The SRF preparation proceeds with pellets’ characterisation and categorisation according to quality class criteria, focusing on the key parameters NCV, Cl, and Hg [
16,
17,
18]. The results of the chemical analysis of representative samples of each SRF production lot obtained over one calendar year must be statistically processed. At first, the authority contractor must determine the production lot size. The statistical distribution pattern of the characteristics parameters (average, median, and 80th percentile) evaluates the quality class of SRF. When the 12-month production is less than 15,000 tonnes, the lot size for classification shall be one-tenth of the amount produced in a 12-month rolling period. From 2010–2021, the annual pellets production at the CWWTPL is approximately 4200 tonnes
ar, and the monthly output varies by season, precipitation, and maintenance work (
Figure 6a). After the statistical distribution pattern of the obligatory characteristics, the pellets’ Quality Class codes for 2021 were NCV 4; Cl 1; Hg 3, as was also determined in previous years [
30].
The specification of the SRF gives the relevant fuel properties. Still, It is also important to the character of the input material and the technology used either in production or end use of the SRF. The classification is not enough for an intending user or other stakeholders [
18], but it is a tool for identifying and pre-selecting SRF. Not all kinds of SRFs are suited for all energy recovery installations [
16]. From the stakeholders across Europe, there is no consistent level for the scope of information regarding the SRF quality. The performance of the combustion facility depends on the design and operating conditions and limit values set by the competent authority in an environmental permit. The plant must comply with national legislation and BAT and report its updates to the relevant authorities. By selecting the appropriate SRFs, the facility operation is optimal, successfully prevents unwanted emissions of substances into the air and water, and prolongs its lifetime.
The national legislation of each EU Member State determines the manner of application of the SRF. Slovenian legislation prohibits SRF produced from contaminated biomass and combustible waste, with Class code 5 for NCV and Class code 2, 3, 4, or 5 for the Hg/NCV ratio [
60,
61]. At the existing combustion facilities in Slovenia, pellets cannot be utilised as a single SRF but only as waste with classification number 19 08 05 at the industrial co-incineration plants. The use of pellets as SRF is only allowed in Slovenia if mixed with other combustible waste, and the proportion of pellets is at least 3% m/m [
61].
3.4.2. Dynamics of Pellets’ Transport
The pellets must be properly stored until they are taken over by the stakeholder. Long-term storage of pellets is not possible at the CWWTPL. They must have appropriate storage conditions. The storage decision relates to the appropriate technical options for preventing NCV deterioration because of the economic value of the pellets, and storage is also a safety category. During the pellets production cycle, it is necessary to daily empty the silo to temporarily pellets storage. Delivery must be carried out regardless of the hour or day of the week. Holidays and non-working days are included. Pellets are shipped between 70%
v/
v and 73%
v/
v filling of the collection silo at the latest (
SM: Figures S1 and S2). The hourly production of pellets is approximately 700 kg, or 2%
v/
v of the silo. The filling of the collection silo with more than 75%
v/
v does not provide the prescribed explosion protection and is not allowed during continuous pelleting. Pellets transport is carried out with standard trucks or tank trucks. Between 2017 and 2021, an average of 170 pellet shipments per year were sent to stakeholders. On average, on the operating days, the mass of one shipment is 25.4 tonnes (as received) or a volume of 38.9 m
3 with an average bulk density of 653 kg m
−3.
The dryness of pellets results not only in lower transportation costs but in drastically decreasing disposal costs. To mitigate climate change, the energy recovery facilities should be as close as possible to the place of origin of combustible waste. In the study [
62], possible alternative scenarios for pellets’ final utilisation and the impact on Carbon Footprint (CFP) were determined. It was founded that, regarding CFP of various approaches, (i) pellets’ thermal and material utilisation in a cement plant (distance from the place of origin 120 km), (ii) pellets’ thermal utilisation in a thermal power plant (distance from the place of origin 7 km), and (iii) mono-incineration in own plant, are more or less similar but smaller than conventional sewage sludge treatment.
3.4.3. Energy Use and Mixing with Other Combustible Waste
The NCV sources from the organic matter (
Table 2, LOI), the content of TOC and H (
Table 3), and presents the economic value of the SRF in question. According to the Technical Standard [
18], the NCV values must be expressed as an arithmetic mean on a dry (DM) and received basis (ar).
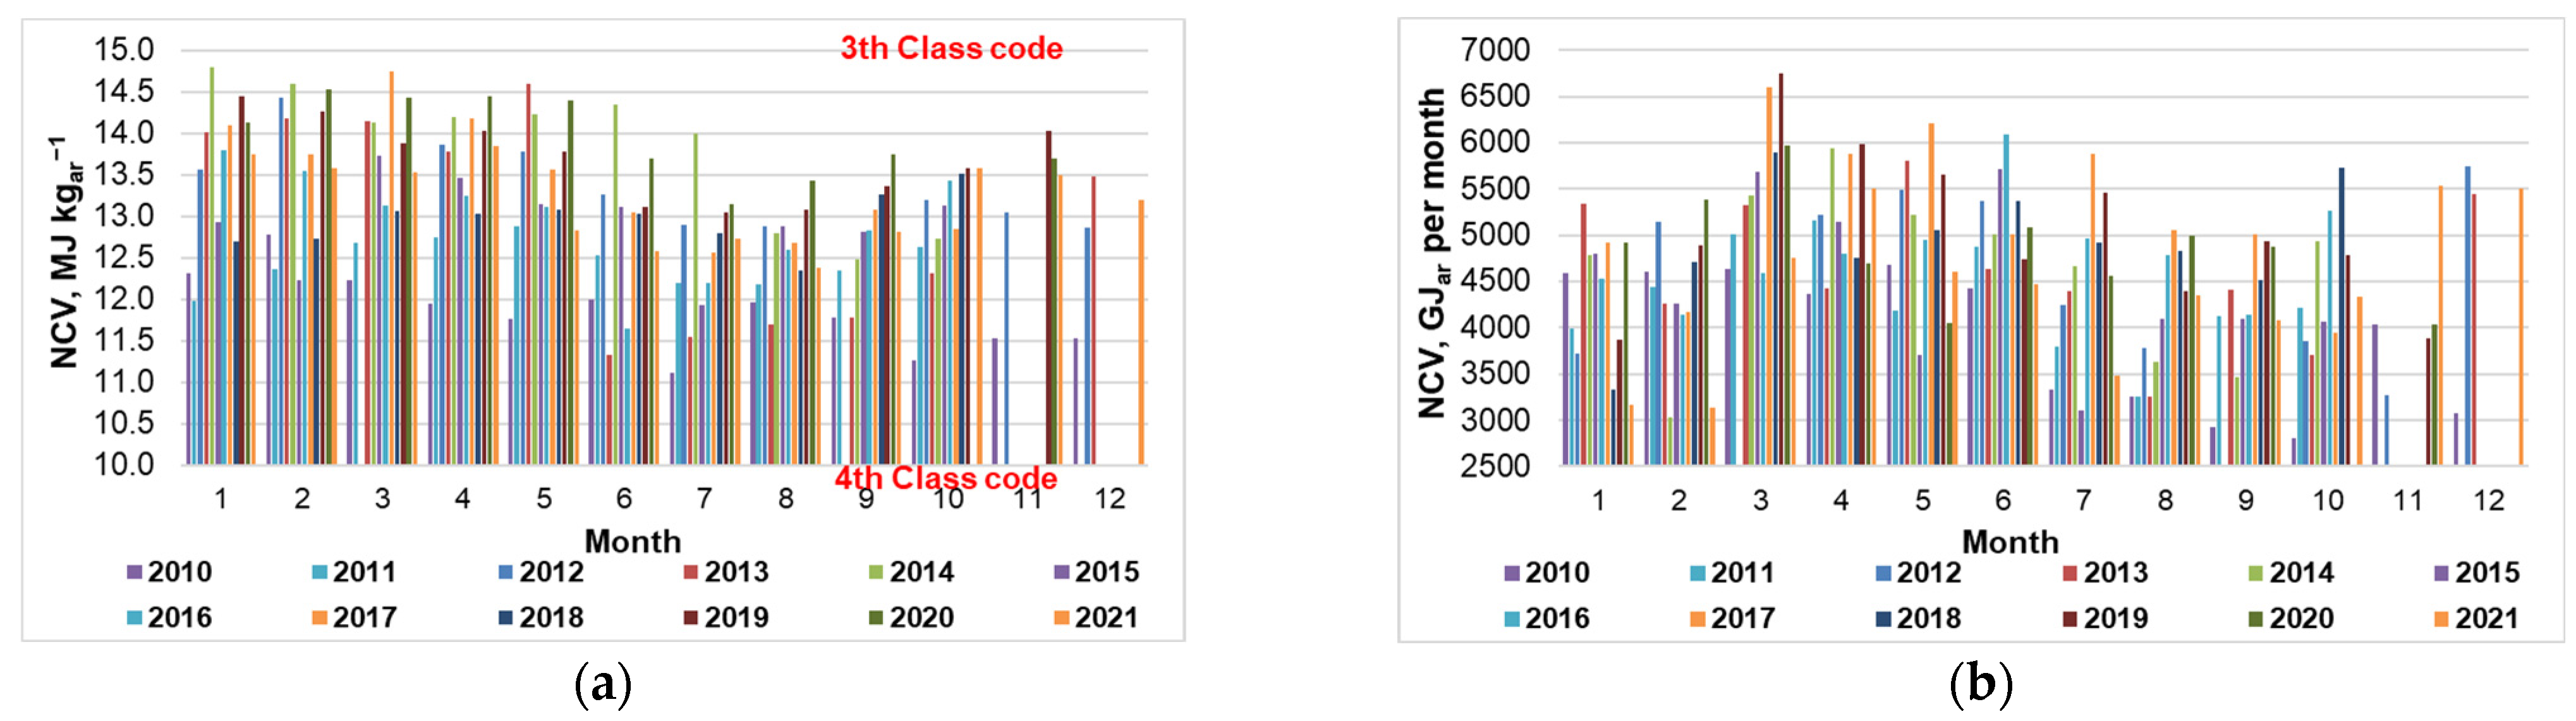
Figure 10a presents an overview of the values for NCV
ar for representative monthly samples from 2010–2021. Seasonal fluctuation characterises NCV. It is similar to seasonal changes in LOI at 550 °C (
Figure 6b). Pellets have a Class code of 4 for NCV. On average, the value for NCV in the spring is approaching that of Class code 3 (one level better a Quality Class), but this value did not reach throughout the investigation period. In summer, the NCV is mostly below 13 MJ kg
−1ar. The trend for the amount of renewable energy in GJ that pellets provide (
Figure 10b) in one month of production is even more markedly similar to the dynamism of pellets production in g PE
COD−1 in one day (
Figure 6a). Those parameters represent the fingerprint of the CWWTPL’s efficiency. From 2010–2021, the amount of renewable energy delivered to stakeholders ranged from 2800 GJ in October 2010 to 6750 GJ in March 2019 (
Figure 10b). On average, the annual supply of potential energy to the stakeholders in 2010–2021 is 55,488 GJ
ar ± 7.6% (46,575 GJ
ar in 2010; 55,610 GJ
ar in 2012; 54,545 GJ
ar in 2014, and 52,488 GJ
ar in 2021).
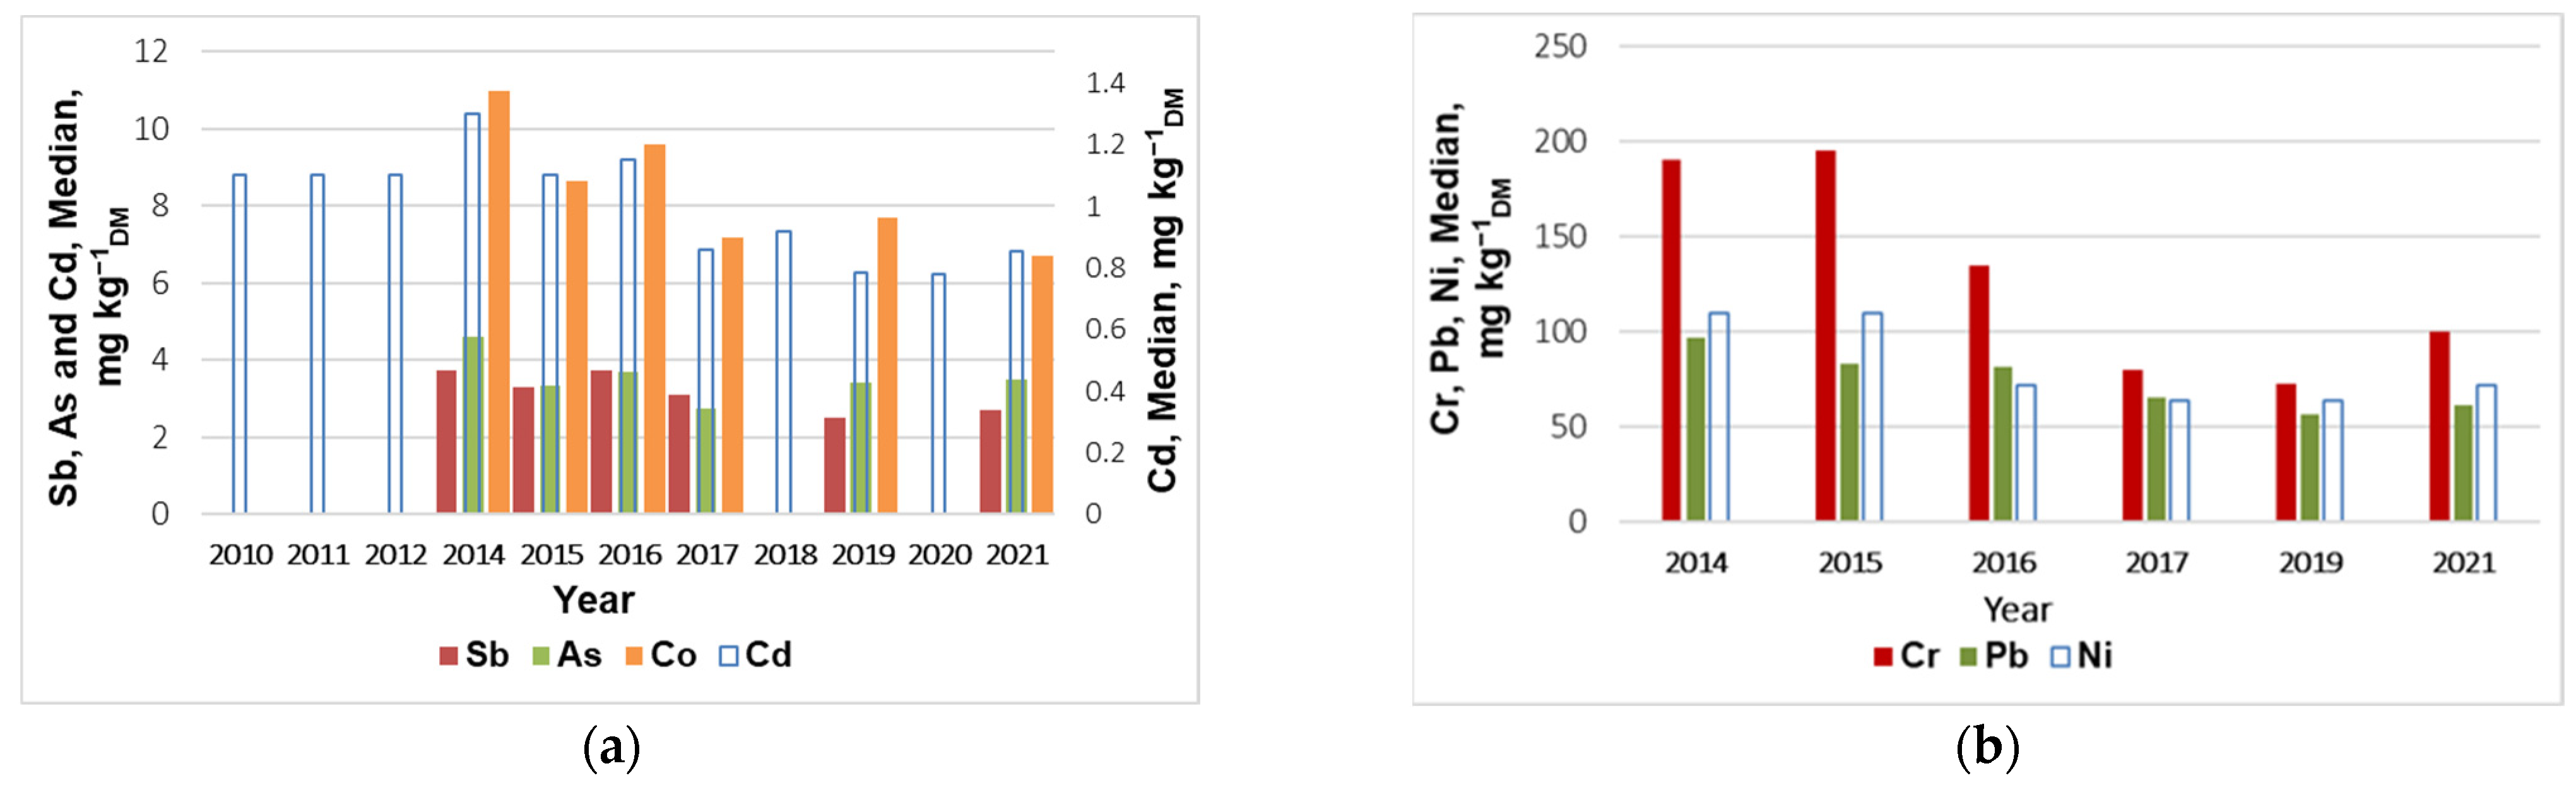
3.4.4. HMs’ Emissions Potential Assessment: Ensuring SRF’s Non-Harmful Utilisation
The content of HMs Sb, As, Cd, Cr, Co, Cu, Pb, Mn, Hg, Ni, Tl, Sn, and V presents the chemical properties of SRF, which are the obligatory properties to specify the SRF [
18] in Appendix A. The content of Cd in pellets’ monthly representative samples has been monitored regularly since 2010 due to the requirements of Slovenian legislation [
60,
61]. Since 2014, the content of Sb, As, Co, Cr, Pb, and Ni has been determined only occasionally (
Figure 11) due to Austrian legislation [
63] and pellets’ exportation to Austria. In 2022, Cu, Mn, Tl, and Sn have also been monitored according to the new Technical Standard [
18].
Figure 11a presents the pellets’ heavy metal concentration, each <12 mg kg
−1 DM, and
Figure 11b presents the heavy metal concentration, each <200 mg kg
−1 DM and >50 mg kg
−1 DM. As, Cd, Sb, and Co are characterised by a very low content in raw wastewater, at the level of µg L
−1 or <LOQ (
SM: Tables S2 and S3), while the concentration in pellets is c (median, As) < 4.6 mg kg
−1DM, c (median, Cd) < 1.25 mg kg
−1DM, c (median, Sb) < 3.75 mg kg
−1DM, and c (median, Co) < 11 mg kg
−1DM. The content of Cr, Pb, and Ni in raw wastewater is at the level of about a few tens of µg L
−1 (
SM: Tables S4 and S7), while the concentration in pellets is c (median, Cr) < 195 mg kg
−1DM, c (median, Pb) < 96.5 mg kg
−1DM, c (median, Ni) < 110 mg kg
−1DM.
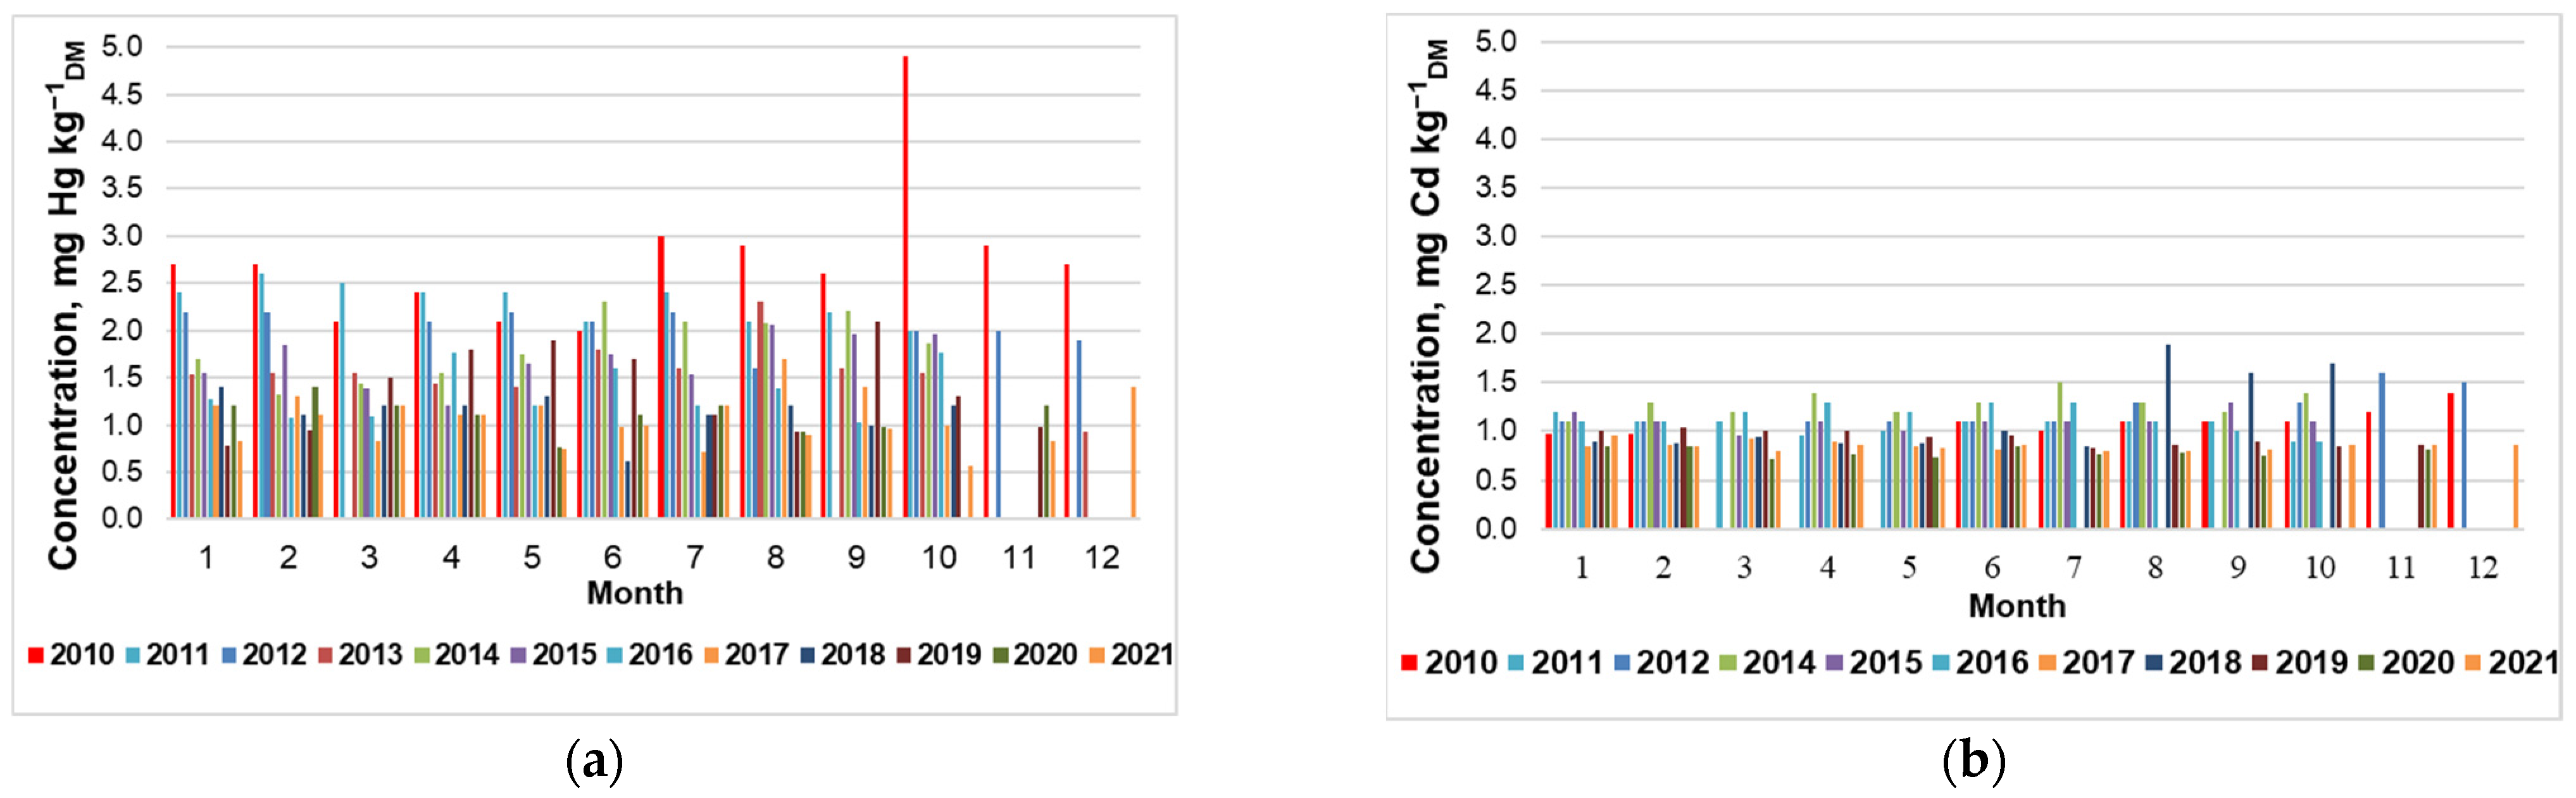
Globally, Hg poses a severe threat to the environment and human health. Replacing mercury lights with light-emitting diodes (LEDs) reduces electricity demand, the need for mercury, and the end-of-life management impacts of mercury-containing lamps. Yet. on the other hand, LEDs potentially contain other heavy metals, including Ni, Pb and As, and should also be adequately managed at the end of life [
58]. That Hg is a pronounced atmospheric deposit in wastewater was shown in 2010, when the CWWTPL was marked by heavy rains and floods (
Figure 3).
Figure 12a indicates that the Hg content in pellets was the highest in 2010 when the largest amount of wastewater was collected.
Figure 12a helps us understand the seasonal declining trend of Hg content in pellets from 2010 to 2021. The most pronounced decrease in the Hg content in the pellets is visible in the first three months of each year (
Figure 12a). On the contrary, the Cd content in pellets (
Figure 12b) has a concentration of around one mg kg
−1 DM, regardless of larger volumes of wastewater. Only the value for August 2018 differs significantly, and the reason is not known.
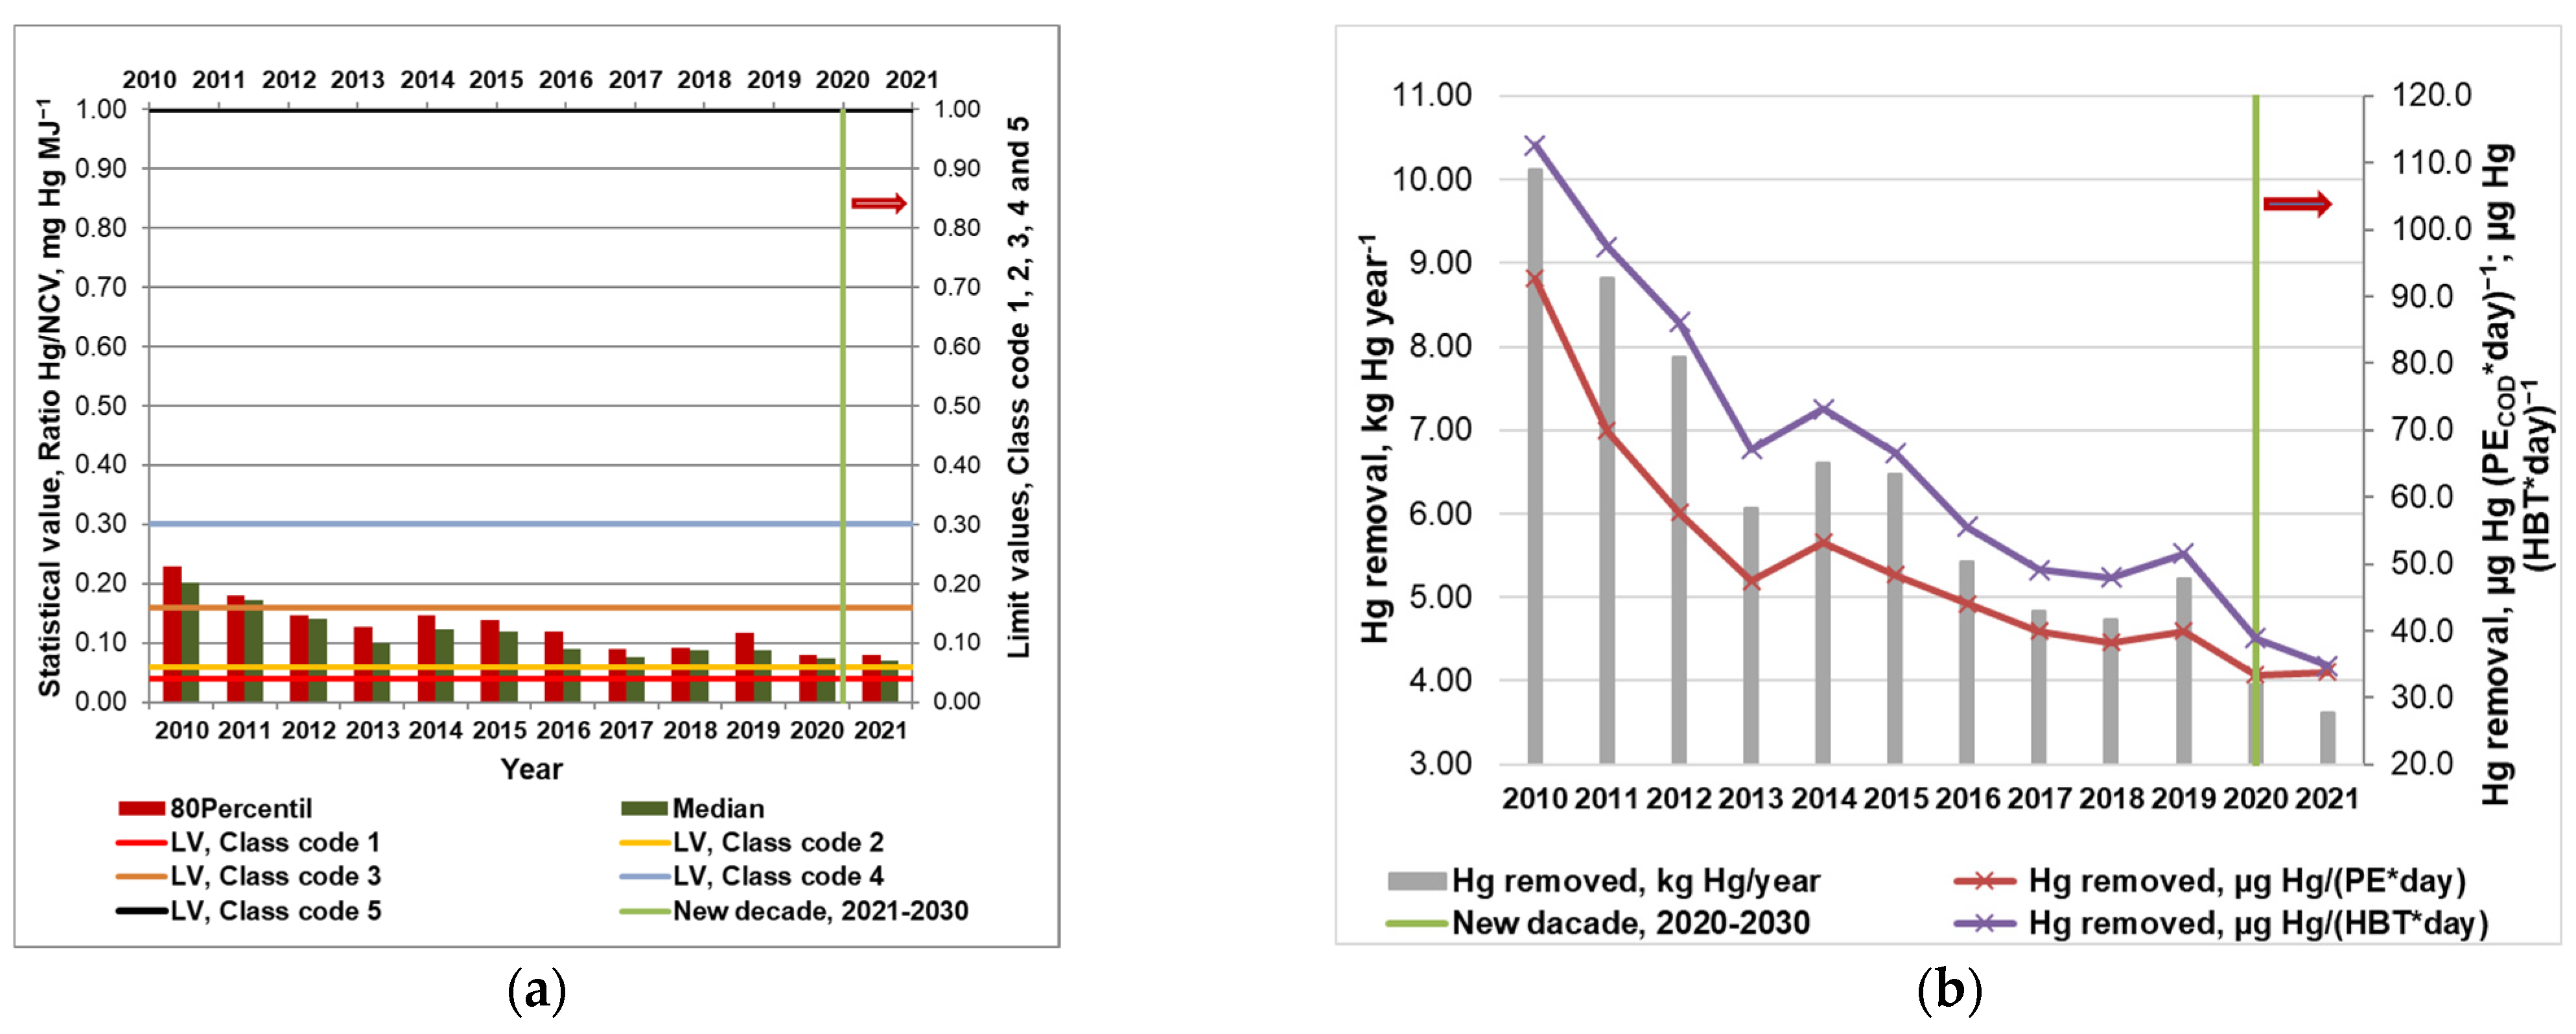
The ratio Hg/NCV is the key environment characteristic of the SRF classification code [
17,
18]. The two statistical values (median and 80th percentile) in a Hg dataset determine one of the five Class codes (
SM: Table S10;
Figure 13a). For Hg, the higher of the two statistical values in a Hg dataset determines the class. From 2010–2021, the value for the ratio Hg/NCV decreased from 0.230 mg MJ
−1ar (80th percentile) and 0.202 mg MJ
−1ar (median) to 0.079 mg MJ
−1ar (80th percentile) and 0.071 mg MJ
−1ar (median). The improvement in the quality of pellets as SRF (
Figure 13) is due to the reduced Hg content on the global level. The year 2021 marks the beginning of a new decade, which should also bring a better climate on the global level by 2030 [
58].
The Hg fingerprint for the Slovenian capital Ljubljana shows a tremendous decrease from 2010 to 2021 (
Figure 13b). On average, from 2010 to 2016, the removal efficiency for Hg was 70.4% m/m ± 25.1% m/m, and in 2022, 78.3% (
SM: Table S6). Except in 2010, when the efficiency of Hg removal was only 26.9% m/m due to large-scale floods, the effect of Hg removal from 2011–2016 was 79.1% m/m ± 14.9% m/m (
SM: Table S6).
Figure 7b and
Figure 13b present the transferred annual Hg amount to stakeholders. Although the effect of Hg removal was worse in 2010–2011, the amount of removed Hg was the highest, 10.12 kg Hg in 2010 and 8.82 kg Hg in 2011. From 2010–2021, the annual transferred amount decreased to 3.62 kg Hg (
Figure 13b) from 92.7 µg Hg per PE
COD in one day to 33.8 µg Hg, and from 112.7 µg Hg per habitant in one day to 34.8 µg Hg (
Figure 13b).
3.5. The Combustion Plant Operation—Corrosion Potential and Ash Production
Combustion plant operators must have a comprehensive quality control system to effectively manage the incineration process to prevent the circulation of pollutants into nature and obtain useful residues. Its crucial part must be: (i) monitoring the mass balance of pollutants in flue gases and newly generated wastewater, and (ii) economic management of residues (bottom ash and fly ash). An essential part of such a holistic quality control system is the control of input raw materials, especially the input control of sewage sludge, which is recognised as a specific waste stream.
According to the Technical Standard [
64], the determination of the total sulphur, chlorine, fluorine and bromine content of SRF is necessary for environmental and technical reasons, both in the production and combustion process. During the combustion process, they are usually converted to sulphates and halides. These reaction products could contribute to corrosion and environmentally harmful emissions. Via the CWWTPL, sulphates and chlorides in raw municipal wastewater are only transferred to the receiving surface water body. The effect of removal is negligible. The content of F and Br in wastewater is low and is checked periodically (
Table 4). Chlorine is the key technical characteristic to evaluate the possibility of corrosion damage on parts of the combustion plant hardware.
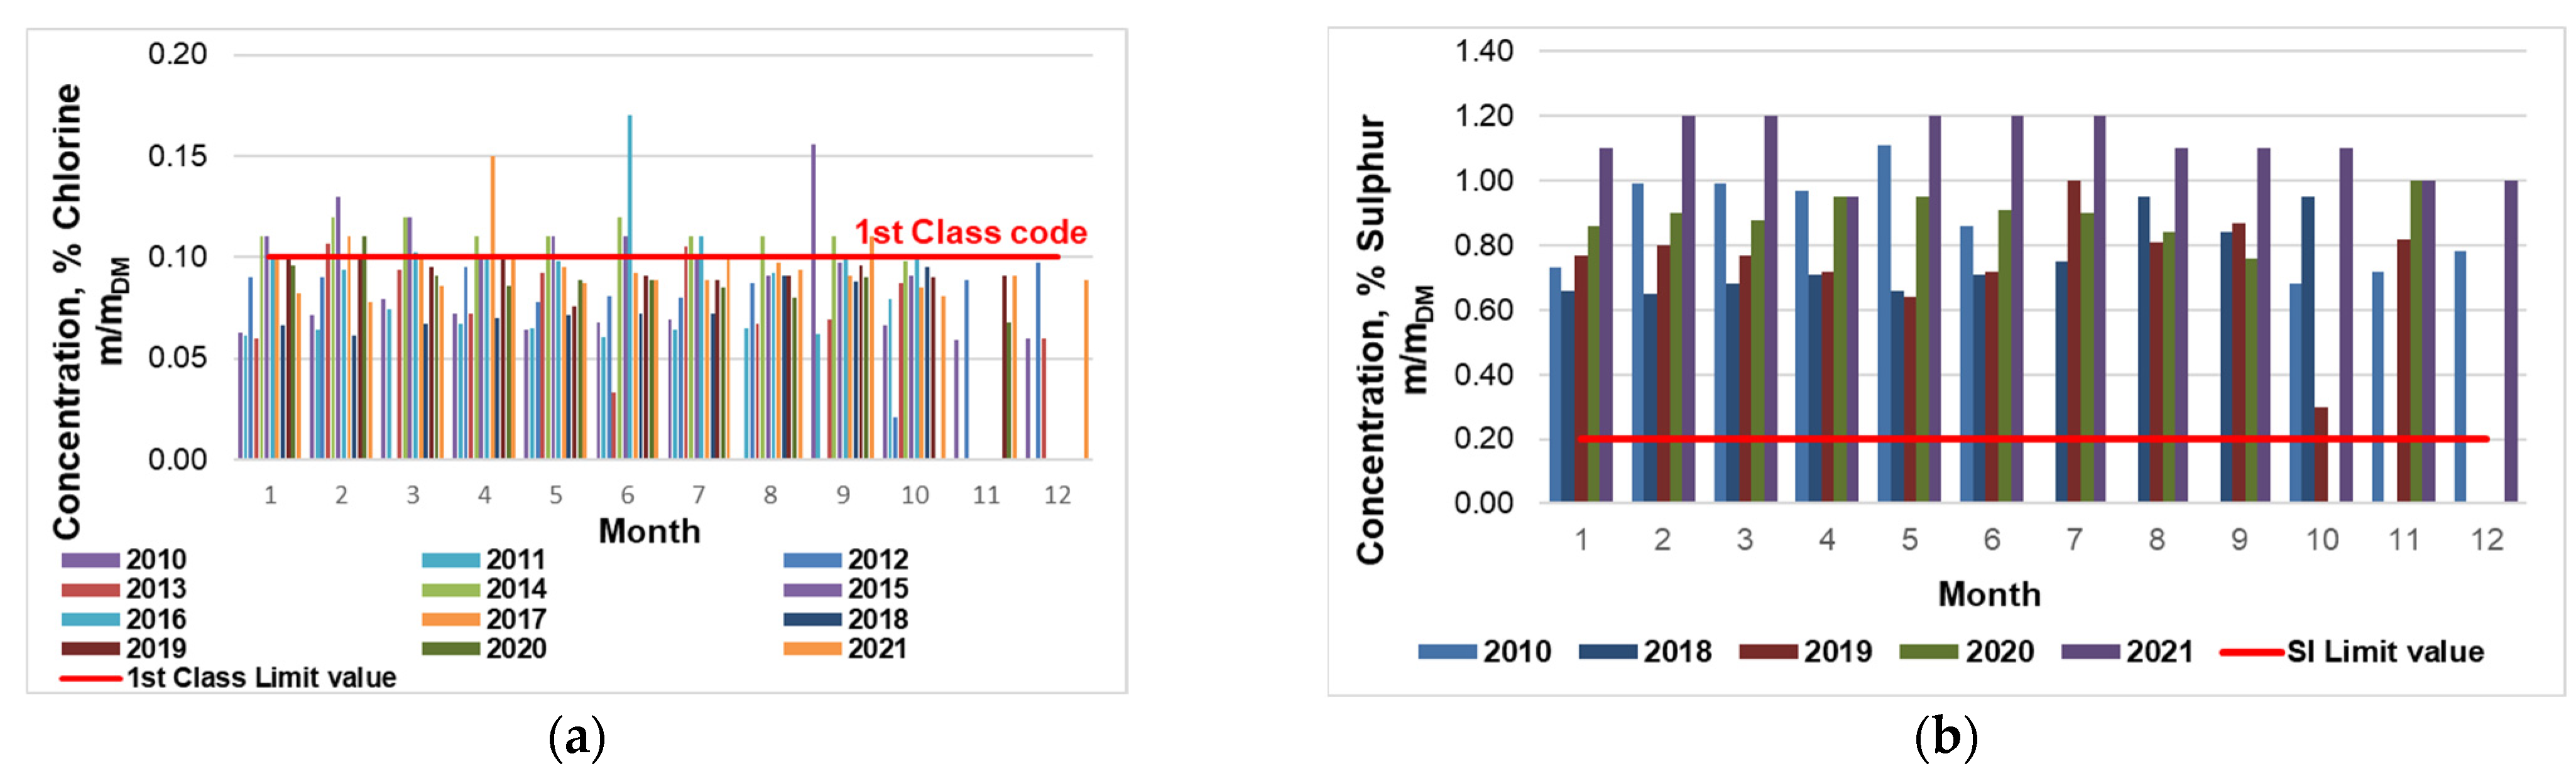
On average, the pellets’ chlorine content is 0.06% m/m
DM to 0.10% m/m
DM, and presents the 1st Quality Class code (
Figure 14a). Chlorine has a great influence on the process of corrosion, slagging, and fouling of boilers. The class boundaries are chosen to consider the SRF properties on the one hand and the requirements of the stakeholders on the other hand.
Sulphur is the constituent of cysteine, methionine, glutathione, and several coenzymes. Therefore, sulphur is present in denatured proteins, the fundamental pellets’ constituents. The presence of sulphur in pellets means “natural background”; thus, the component considered must be an integral part of a comprehensive plan for optimal combustion facility management. On average, the pellets’ sulphur content is 0.7% m/m
DM to 1.2% m/m
DM (
Figure 14b). According to Slovenian legislation, the limit value for the sulphur content in SRF is 0.2% m/m
DM (
Figure 14b) [
61], which means that pellets as a single SRF may not be used in Slovenia unless they are processed in an energy recovery facility placed at the site of origin.
Combustion residues are an integral part of the incineration process. The non-volatile and non-combustible content significantly impacts the quality of SRF. The Technical Report [
16] presents an overview of the SRF quality with low and high ash content. The sludge-derived SRF contributes to substituting raw materials while decreasing the NCV value. That directly affects the Hg values using the unit mg Hg MJ
−1 and the Cd content (
SM: Table S10). During incineration, the concentration of non-volatile macroelements can increase up to 3 times. Calculated on the obtained laboratory data (
Table 1, ash content at 550 °C), for the period 2010–2021, the annual amount of ash reaches 1264 tonnes
DM ± 36 tonnes
DM. For the resulting ash, IED [
23] prescribes that it is necessary to establish ash management and plan sustainable use. Regarding the macro-elements composition (
Table 3), a dynamic circular economy is a condition for the successful material use of ash.
3.6. The Sludge-Derived SRF’s Quality Future Maintenance Due to External Circumstances
Certainly, UWWTP treatment technology is essential for achieving some SDGs. By wastewater treatment is ensured the preservation of natural water resources and the generation of renewable material that can be used for energy production. Regarding municipal wastewater treatment, a UWWTP must comply with the municipal wastewater directive [
11]. Still, the entire municipal infrastructure in the contributing area is vital to improving its pollutant removal efficiency—the careful use of drinking and underground water, the effective separation of precipitation wastewater from municipal wastewater, and the effective pre-treatment of industrial wastewater. In everyday household water use in metropolitan areas, the quality of municipal wastewater is likely to be similar. However, pre-treated industrial wastewater can affect the quality of the final pre-treated sewage sludge. Improving the control and quality of the pre-treated industrial wastewater will significantly enhance the quality of the treated sludge [
14]. A regulatory framework is needed to support sustainable and resilient sewage sludge management, incorporating a broader scope for risk assessment and strict sludge quality control [
65].
4. Conclusions
With the help of activated sludge, enormous amounts of municipal wastewater are purified, and the final product of the pre-treatment of excess sludge could have a sufficient calorific value.
In the case of the CWWTPL, which is a large municipal wastewater treatment plant, the possibility is presented of a holistic approach to the management of sewage sludge, which enables the integrated implementation of wastewater treatment, SRF production, and the bridge to WtE in terms of the adopted waste hierarchy and reducing the pollution of the environment. With the operation recovery R 1, by proper flue gas cleaning and treatment of solid residues, we interrupt the circulation of pollutants in the environment, reduce the need for fossil fuels, and prevent harmful climate change, and achieve the goals of the circular economy.
The present case study shows that pellets have been generated due to environmental protection and human health, and the utilisation of their renewable energy must proceed in the same manner. Pellets do not automatically fit into existing definitions of waste. Its larger quantities mean a higher amount of treated municipal wastewater, cleaner receiving surface water, better-protected groundwater, and larger quantities of renewable bioresources for sustainable CE.
Specifying and classifying pellets as a non-hazardous alternative solid recovered fuel creates a bridge between “treated sewage sludge as the tool to remove pollutants and nutrients from wastewater” and “preparation of the valuable material as an SRF that meets customer-specific requirements”.
With a comprehensive review and assessment of pellets’ critical properties, essential to the functioning of energy production plants, they are evaluated as a sustainable and smart material. All the crucial and characteristic data between 2010 and 2021 are listed. The pellets can achieve the relevant energy efficiency factor. The organic matter content allows a sufficiently high net calorific value (NCV = 13.8 MJ kg−1 as received) so that the pellets classify in the 4th Quality Class code, which still allows the desired energy utilisation. The Hg fingerprint for the Slovenian capital Ljubljana shows a tremendous decrease from 2010 to 2021 when the pellets’ mercury content decreased its annual amount at SRF delivery by 64.3%. In 2021, the 80th percentile Hg/NCV ratio was 0.079 mg Hg MJ−1, which means the 3rd Quality Class code of SRF. The halogen contents of the pellets do not threaten corrosion to the facility, as the chlorine content defines the pellets in the 1st (the best) Quality Class code. Because pellets are a biogen material containing sulphur-containing proteins, SO2 emissions are expected. In 2010–2021, the sulphur content in the representative monthly samples was 0.7% m/mDM to 1.2% m/mDM.
Achieving the SDG on “Affordable and clean energy” based on treated sewage sludge is possible. It is necessary to take a holistic approach to formulate the frame legislation and a global strategy in the treated sewage sludge management regarding the WtE. By regularly monitoring the content of heavy metals in the treated sludge, the use of efficient flue gas cleaning techniques, and monitoring the material flows of pollutants at the recipient’s location, the energy utilisation of the sludge-derived SRFs can be environmentally non-harmful.
In addition to being sustainable material for SRF production, carefully controlled WtE procedures could prevent the circulation of pollutants in the environment. The pelletised sewage sludge represents the fingerprint of UWWTP in question, and secondly, it is an appropriate tool to reach the SDGs in the energy production and consumption field.


