1. Introduction
In the field of building performance simulations, the moisture content within building materials and its related risks, such as the decay caused by the mold germination and the higher heat losses, due to the increase in the thermal conductivity is often neglected. Nowadays, transient simulation tools are widely available [
1] to investigate these aspects at the scale of the building component by accounting for the coupled heat and moisture transport (HAMT) phenomena. These tools can already provide support to the design of many building envelope solutions, especially the innovative ones that are composed of materials prone to moisture damages.
This is the case, for example, of the innovative and sustainable retrofit solutions proposed by the ongoing H2020 “e-SAFE” project, aiming to improve seismic safety and energy efficiency of the existing non-historical building stock in the European Union. More specifically, the e-SAFE solution, called e-CLT, consists in adding cross laminated timber (CLT) panels to the outer walls of existing buildings, to improve seismic resistance, in combination with an insulating material, to increase the thermal resistance. Depending on the seismic performance required, the e-CLT can be coupled to a non-structural solution, called an e-PANEL: this is composed of a timber frame structure, combined with the same insulation as in the e-CLT, but does not include a CLT layer. As such, the e-PANEL improves only the energy efficiency in those portions of the envelope where the e-CLT cannot be applied, for instance, close to the windows. More detailed descriptions of these solutions can be found in recent papers, for instance in Evola et al. [
2].
Some studies showed that both the e-CLT and the e-PANEL ensure a good thermal performance, with an expected reduction by about 66% and 25% in the energy demand, respectively, for space heating and cooling in a pilot building [
2]. However, these results do not consider the increased heat losses, due to the moisture content accumulated by the building materials. A recent paper by the same authors [
3], revealed that moisture content may cause an increase by about 10% in the heat losses through the e-CLT solution, if compared to the dry case. In addition, wood-based materials are particularly prone to moisture storage because of their cellular structure, and they are highly sensitive to decay caused by the mold growth, since wood is an organic material. In this sense, the use of advanced hygrothermal simulation models could be useful to predict and prevent undesirable long-term moisture damage.
The need of further research in this field is testified by recent studies that made use of hygrothermal simulation tools to support the design stage of wood-based building components [
4,
5,
6,
7,
8]. For instance, Brambilla et Gasparri [
4] claimed the importance of permeability for a timber envelope, especially in cool and cold climates where moisture transfer typically occurs outwards. In this case, a highly permeable wall assembly allows moisture to dry out effectively in the summer. By contrast, other studies demonstrated the necessity of using insulating materials with a low permeability and to protect them with high vapor resistant membranes, to reduce the mold growth risk in hot and humid climates [
5], where moisture transfer typically occurs inwards instead.
Furthermore, although sustainability reasons would suggest adopting wood fiber as insulating materials, Chang et al. [
6] and Yoo et al. [
8] revealed that a scarcely permeable outer insulation (e.g.,: extruded polystyrene (XPS) and foam glass (FG)) typically ensures a better hygrothermal performance than the highly permeable insulation (e.g.,: wool-type materials).
However, despite the undisputed usefulness of the hygrothermal simulation tools, some methodological gaps should still be solved, for instance, the proper hygrothermal characterization of the materials. In fact, the built-in databases available in the most common HAMT simulation tools contain several materials, but these do not cover all possible variants occurring in practical applications. As a consequence, the provided hygrothermal properties of the materials might not be reliable. For example, if looking at the CLT properties, the literature reveals a certain dispersion of values in the available experimental data, especially in relation to the vapor resistance factor μ and the water uptake coefficient A. In particular, the μ-value can vary from 50 to 456 (−), while the A-value can vary from 1.6 to 14 g·m
−2·s
−1/2 [
3]. The uncertainty in these CLT properties could impact the reliability of the simulations, aimed at exploring the hygrothermal performance and the moisture related risks in the e-CLT solution.
In this framework, this paper investigates the hygrothermal performance of two wood-based solutions applied to the walls of a pilot building located in Catania (Southern Italy), a city characterized by warm and humid summer and moderately cold and wet winter seasons. The study relies on transient HAMT simulations performed with Delphin 6.1.2 software, and focuses on the mold growth risk in timber-based materials and on the increased heat losses, due to the vapor stored within the building materials.
More specifically, this paper aims to achieve the following objectives:
provide useful recommendations for the design of the e-CLT and e-PANEL in a warm climate, as regards the insulation type and the application of a waterproof membrane and of a vapor barrier;
evaluate the impact of the CLT properties on the hygrothermal performance of the investigated wall configuration through a sensitivity analysis of the parameters with a higher uncertainty (i.e.,: the vapor resistance factor and the water uptake coefficient).
2. Materials and Methods
In this study, the e-CLT and e-PANEL solutions, already introduced in [
2], are applied to a pilot building cited in Catania (Italy). In order to assess the moisture-related risks, more specifically the mold growth and the increased heat losses, due to the humidity in the building materials, the solutions are simulated by means of the software tool Delphin 6.1.2, developed by the Technical University of Dresden [
9]. The tool uses the Finite Control Volume (FCV) method to numerically solve the balance equations which describe the combined heat and moisture transfer and storage for all materials in the wall assembly.
To this aim, Delphin requires—for each building material—all the hygrothermal properties that govern heat storage, heat transfer, moisture storage, vapor transport, and liquid water transport. In particular, the following parameters are needed: bulk density ρ(kg·m−3), specific heat capacity cp (J·kg−1·K−1), dry thermal conductivity λdry (W·m−1·K−1), vapor diffusion resistance factor μ (-), water uptake coefficient A (g·m−2·s−1/2), and moisture content both at relative humidity RH = 80% (θ80, in kg·m−3) and at saturation conditions (θsat, in kg·m−3).
Furthermore, Delphin requires the knowledge of a series of hygrothermal functions, such as the sorption curve (i.e., the moisture content when equilibrium is reached at different relative humidity values) or the retention curve (i.e., the moisture content as a function of the capillary pressure) which can be derived from θ80 and θsat. As many HAMT tools, not hysteresis in the sorption curve of materials, is considered. In addition, the definition of the hourly indoor and outdoor climate boundary conditions is needed, in terms of air temperature (°C), relative humidity (%), rainfall amount on a horizontal plane (mm), wind speed (m·s−1) and direction (°), direct and diffuse solar irradiance (W·m−2), and long wave sky irradiance (W·m−2).
In order to reach a stabilized behavior, simulations are performed over 10 consecutive years and by assuming as initial conditions for all construction materials T = 20 °C and RH = 80%. Prior to running the simulations, the assemblies are discretized in 145 smaller control volumes with a stretch factor of 1.3. The grid thickens towards the extreme sides: in particular, the largest element is 16 mm thick, while the smallest element is 1 mm thick (preliminary simulations confirmed that a finer grid does not affect the results).
2.1. Wall Assemblies and Hygrothermal Properties
The e-CLT and e-PANEL solutions applied to the walls of the pilot building described in [
2] are composed—from the inner to the outer side—by 20 mm of cement plaster, 80 mm of hollow concrete blocks, 100 mm of non-ventilated air cavity, 120 mm of hollow concrete blocks, and 30 mm of cement plaster.
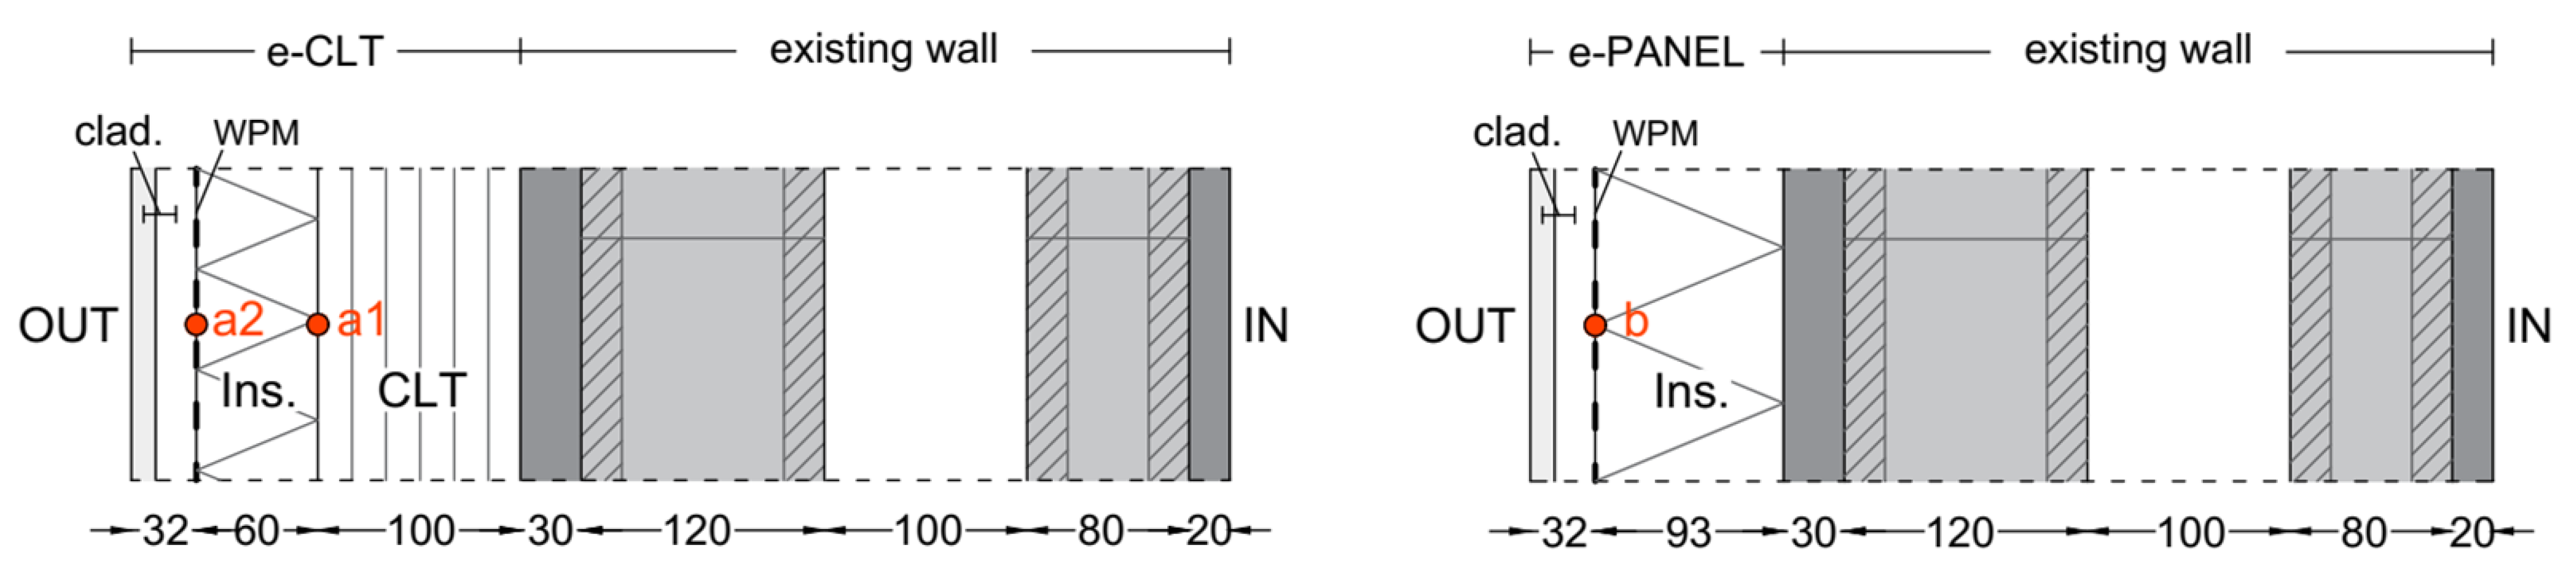
Figure 1 represents the wall assemblies after the application of the retrofit solutions.
The e-CLT solution adds to the existing wall the following layers: the CLT (thickness s = 100 mm), the insulation (wood fiber with λ
dry = 0.04 W∙m
−1∙K
−1 with thickness of 60 mm), and the external cladding, including a scarcely-ventilated air gap (s = 20 mm) and a fiber cement board (s = 12 mm). The e-PANEL solution is instead composed of a single 93-mm thick layer of wood fiber, applied to the existing wall along with the same external cladding as the e-CLT. The thickness of the insulation layer for the e-CLT and the e-PANEL, is calculated by imposing the same thermal transmittance (U = 0.29 W·m
−2·K
−1) to both wall assemblies: this ensures coherence between the thermal resistance of the two solutions. The selected U-value complies with the requirements set by the majority of European national laws [
10] and is widely below the threshold (U = 0.40 W·m
−2·K
−1) imposed by Italian regulations in the climate zone B, where the pilot building is located [
11].
In both cases, a vapor-open waterproof membrane (WPM) with equivalent air thickness sd = 0.04 m is applied to the outer side of the insulation, in order to protect it from wind-driven rain, while also allowing vapor transfer by diffusion.
Then, assuming the above wall assembly as a “base case”, six further scenarios are tested for both the e-CLT and the e-PANEL solutions, and two additional scenarios are tested only for the e-CLT solution, as summarized in
Table 1.
The simulated scenarios are useful to investigate several different design solutions, as regards the insulation type and the position of the membranes.
In particular, in the scenarios called “CORK”, “FG”, and “XPS”, three different insulating materials with different hygrothermal properties are tested, namely cork, foam glass (FG) and extruded polystyrene (XPS). As above, the insulation thickness is determined by imposing that the same thermal resistance as in the base case is achieved.
Moreover, scenario 0/0 differs from the base case because the wall assembly does not include the waterproof membrane (WPM), while in scenarios X/X and 0/X, a vapor barrier (VB) with sd = 40 m is added between the existing wall and the retrofit solutions, respectively, in combination or not with the outer WPM.
Finally, the impact of the CLT properties on the hygrothermal performance of the e-CLT solution, is considered in scenarios “μ50” and “A12”, by means of a parametric analysis regarding the vapor resistance factor μ and the water uptake coefficient A. While the base case is simulated supposing μ = 186 and A = 5 g·m
−2·s
−1/2, according to the suggestions reported in [
4], the scenario μ50 considers the CLT with μ = 50 (-) as suggested by the standard EN ISO 10456 [
12], and scenario A12 considers A = 12 g·m
−2·s
−1/2, which is close to the highest value reported in the literature [
13,
14].
All materials are selected from the built-in Delphin database but, in some cases, they were updated, according to technical data sheets, standards, and the literature. In particular, the CLT and the wood fiber are selected from materials experimentally tested by the Technical University of Dresden. All hygrothermal properties used in the simulations are reported in
Table 2.
Since this paper aims to investigate the moisture-related risks in the CLT and in the insulation layers, the hygrothermal behavior of the investigated materials (i.e., the CLT, the WF, the CORK, the FG, and the XPS) needs to be described in more detail.
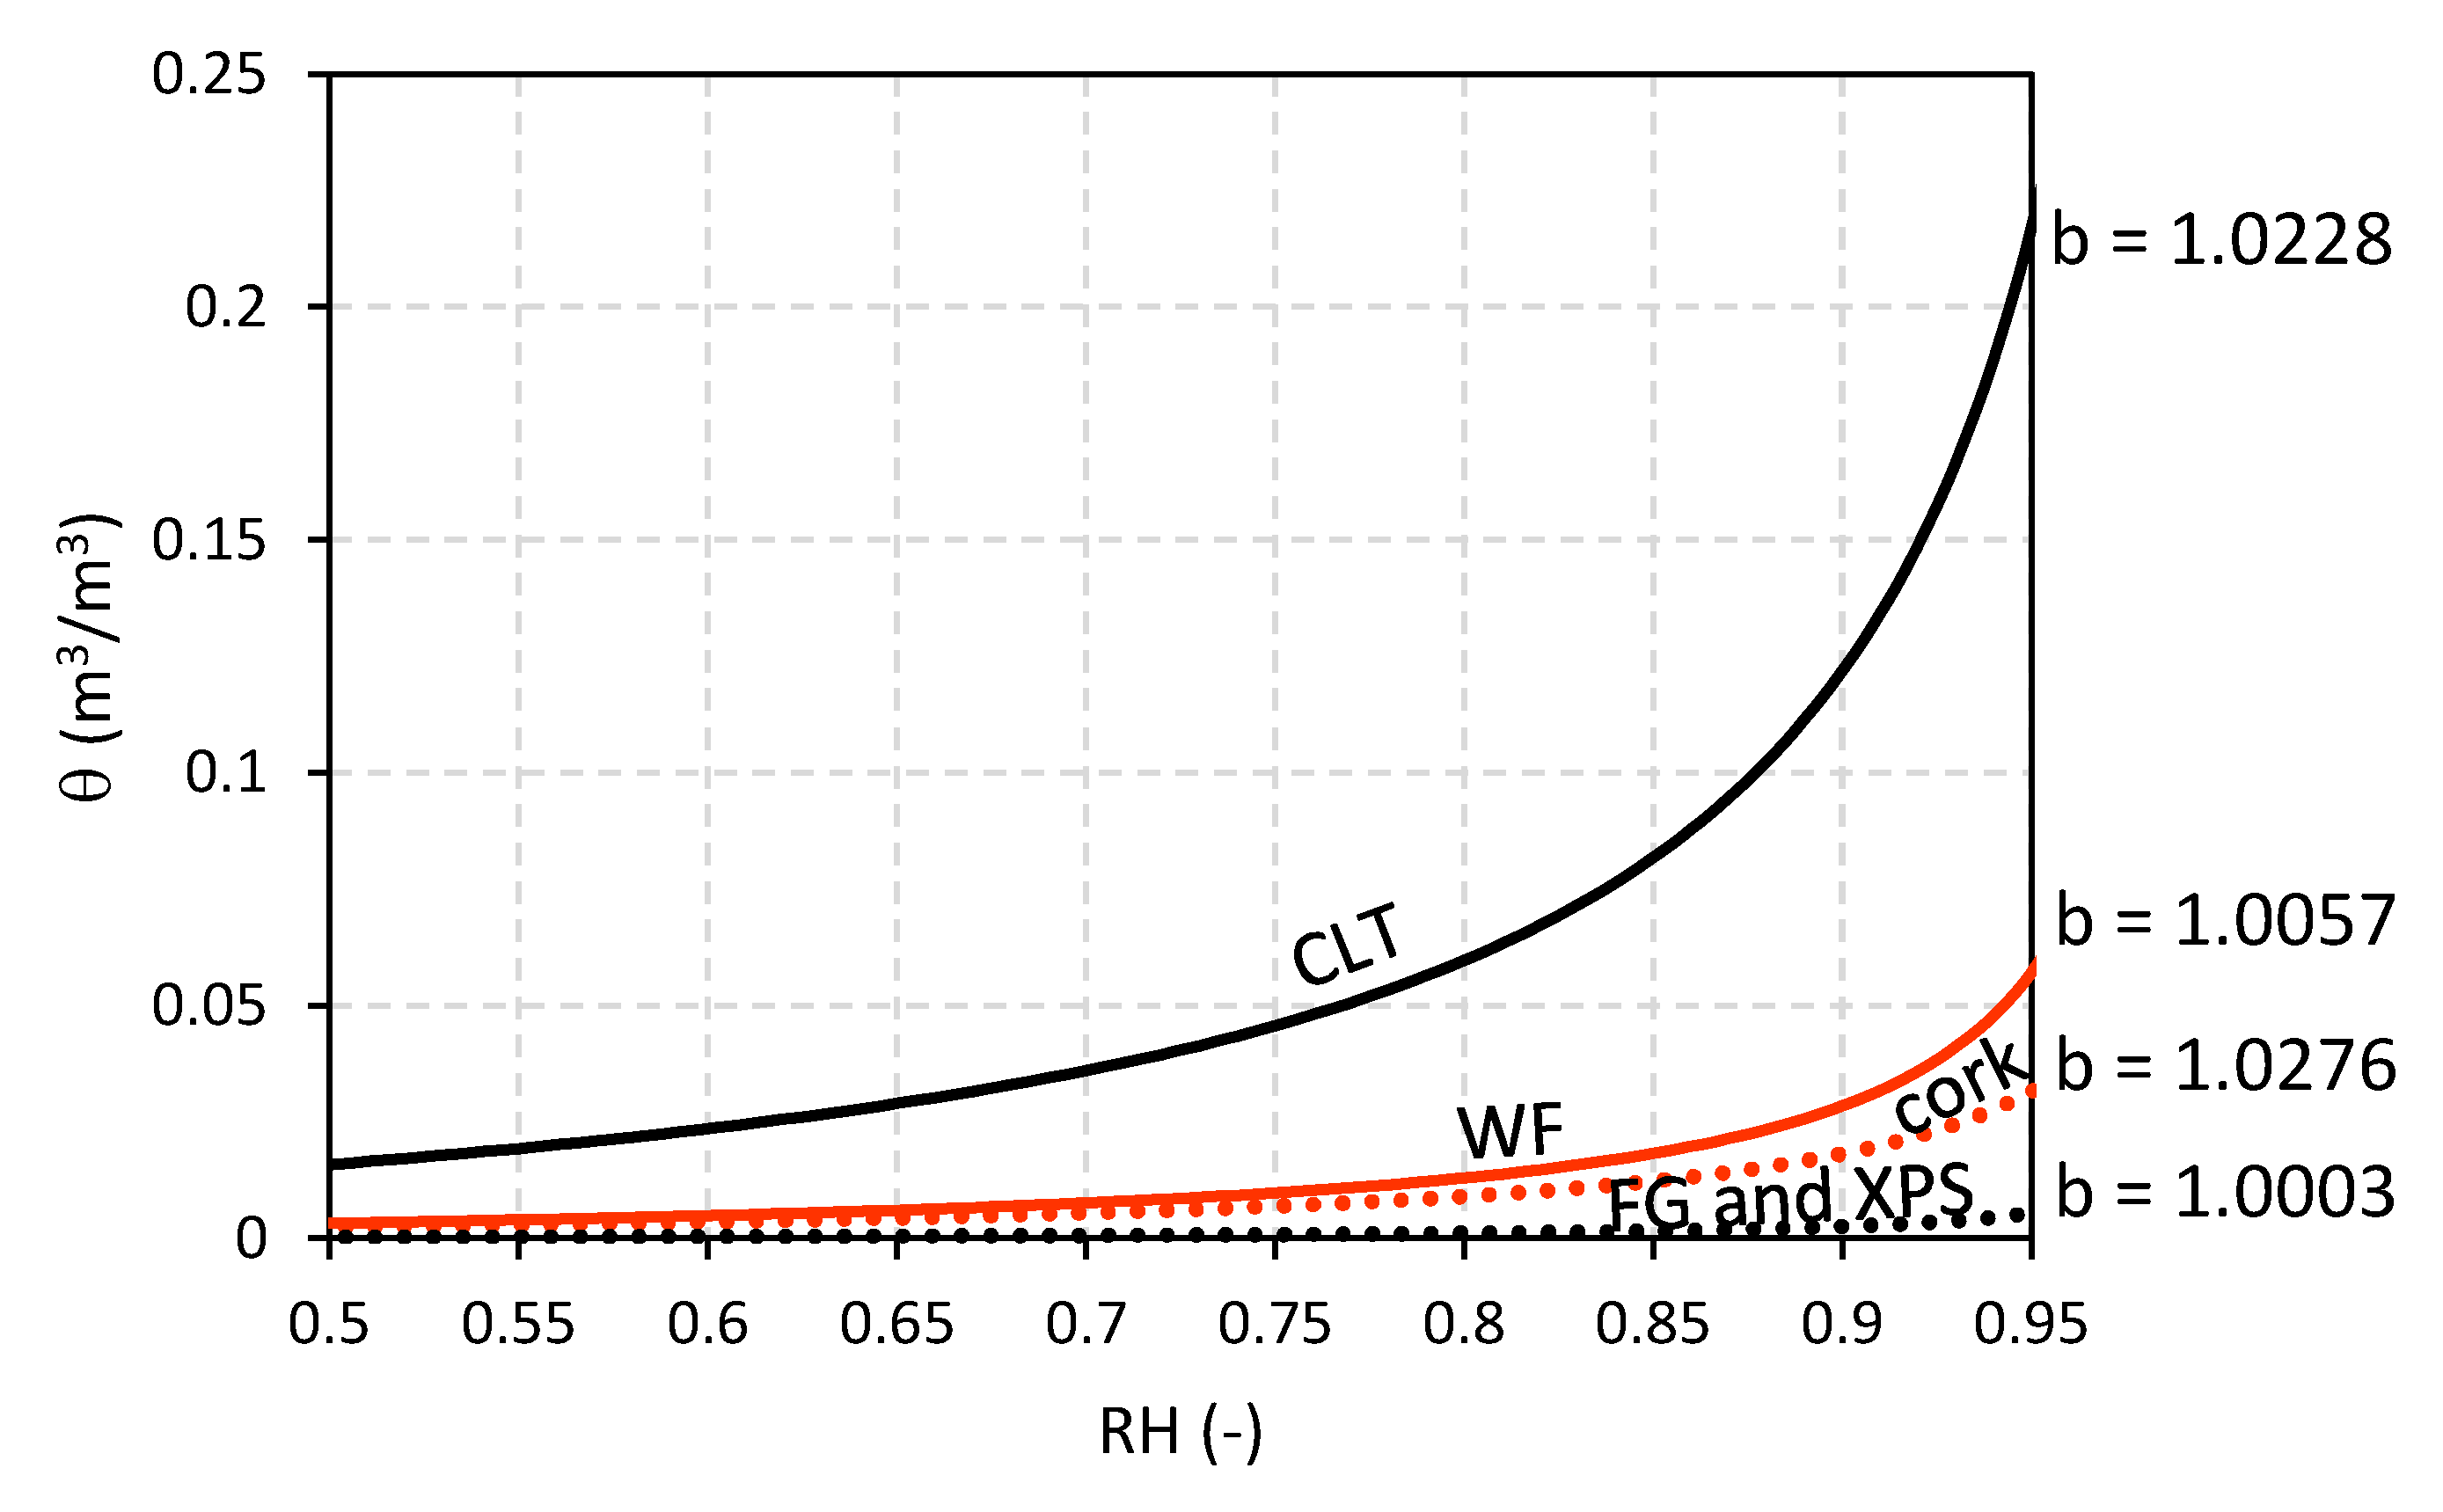
Thus, in order to better understand the relationship between the water content and the relative humidity in these materials,
Figure 2 reports their sorption curve. This curve represents the moisture content θ (m
3/m
3) when equilibrium is reached with the environment at different relative humidity values RH (-). In the absence of a full experimental characterization, the sorption curve can be plotted by knowing θ
80 and θ
sat, according to the various models available in the literature. For instance, Equation (1) refers to the Künzel model [
15], where the parameter “b” is found through best-fit techniques.
Figure 2 suggests that the CLT has a higher moisture capacity than the insulating materials. This means that it tends to store a larger amount of moisture: for instance, at RH = 80% the CLT stores about four–five times more moisture than wood fiber, and six times more than cork. Furthermore, the data reported in
Table 2 also suggest that the CLT has a higher vapor resistance than cork and WF (equivalent air thickness sd = 18.6 m), thus contributing to reduce the vapor diffusion phenomena.
As regards the insulating materials, they differ from each other mainly in terms of vapor resistance: the FG is the most resistant one to vapor diffusion (μ = 700,000), followed by XPS (μ = 150), and cork (μ = 29), while the wood fiber (WF) used in the base case has μ = 1. The liquid water uptake is A = 9 g·m
−2·s
−1/2 for the cork and A = 5 g·m
−2·s
−1/2 for the WF, while no liquid transport occurs in the XPS and FG (A = 0). Looking at the sorption curve in
Figure 2, the FG and the XPS have a flat sorption curve, meaning that they tend to store very little moisture even at high RH values.
2.2. Climate Data and Boundary Conditions
According to the pilot location, the simulations rely on the climate data of Catania (Italy), a city representative of Csa climate conditions in the Mediterranean area, according to Köppen–Geiger’s classification [
16]. The climate dataset used for the simulations is a moisture reference year (MRY) prepared, according to the criteria reported in Annex B of the Standard EN ISO 15026:2007 [
17].
The MRY refers to the weather data recorded from 2005 to 2019 at the weather station of the Sicilian Agrometeorological Information System (SIAS) in the immediate surroundings of the city (latitude: 37.26°, longitude: 15.04°, elevation: 10 m a.s.l.). The procedure used for the integration of the missing data is described in [
18].
Starting from these data, the Standard suggests three different criteria to identify the MRY, based on which condition (i.e., low temperature, high temperature, or rain penetration) is most critical for the specific moisture problem analyzed. Since this is not known a priori, preliminary simulations are performed by using three MRYs, namely a COLD, a HOT, and a RAINY year, built as reported in
Table 3. In doing so, the effect of the exposition is also considered. The results of these preliminary simulations will be reported and shortly discussed in the
Section 3.1.
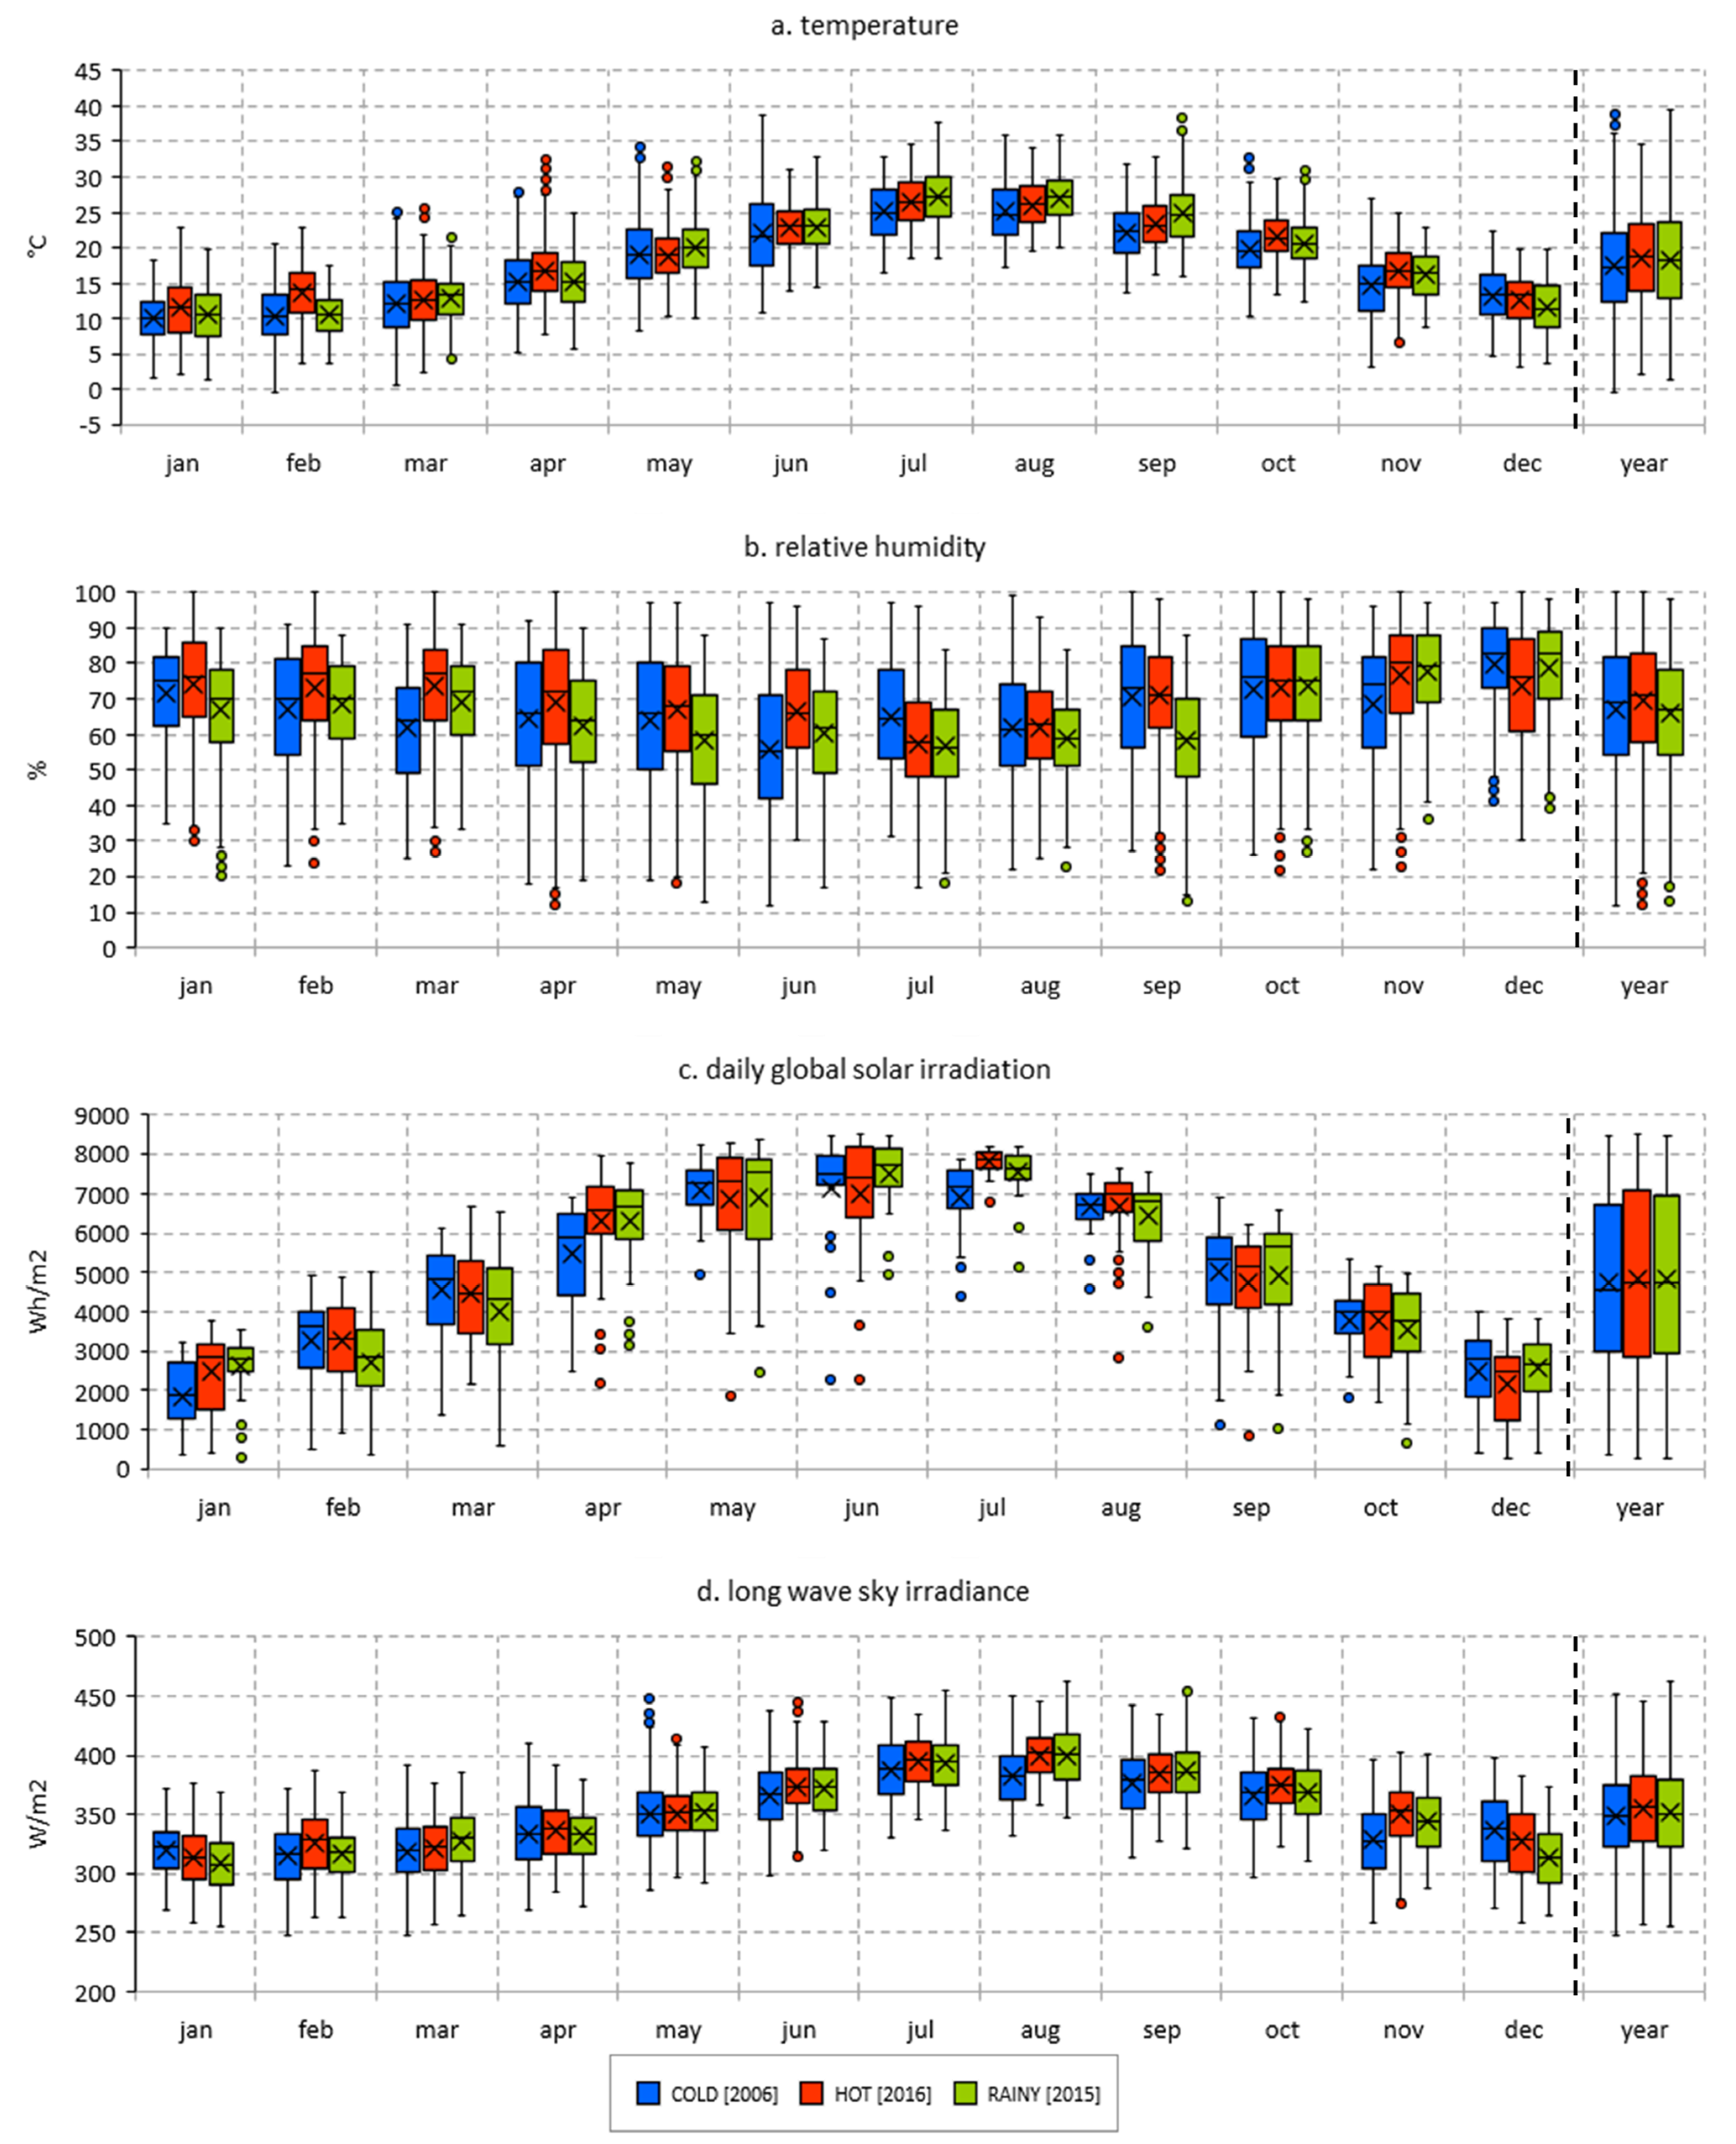
Figure 3 shows the comparison between the climate datasets selected as MRYs (COLD, HOT, and RAINY), considering the monthly and yearly statistical distribution of the dry bulb temperature, the relative humidity, the global solar irradiation, and the long wave sky irradiance. These data are plotted by means of boxplots, where the vertical boxes identify the interquartile range, i.e., they are limited by the first (lower) and the third (upper) quartiles. The horizontal segment and the cross inside each box are respectively the median and mean value. The whiskers (vertical lines) include the entire range of values, except for the outliers, i.e., the values that deviate from the upper/lower interquartile range by more than 1.5 times the interquartile extension (outliers are represented by circles).
The effect of the wind-driven rain (WDR) is also accounted for in the simulations: this is calculated by Delphin, according to the standard EN ISO 15927-3 [
19], using a reduction coefficient of 0.7 to include the rain splashing effect [
20]. In particular, the incident WDR depends on the rainfall, the wind speed, and its direction: for this reason, these data are reported in
Table 4.
Furthermore, a water source is assigned to the outer surface of the insulation protected by the WPM: this is set to 1% of the rain flux incident on the external surface, and is measured in kg·m
−2·h
−1. This approach is followed by several studies [
6,
21] in compliance with the recommendations of the ASHRAE 160 Standard [
22] and allows the simulation of a rain leakage through the cladding. The hourly data sheet for the rain leakage is obtained by preliminary simulations and by requiring as an output the rain flux normal to the external surface.
As regards the outdoor boundary conditions, the outside heat transfer coefficient and the surface vapor diffusion coefficient are set to 25 W·m−2·K−1 and 7.5·10−8 m·s−1, respectively. The solar absorption coefficient is set to 0.6 and the long wave emissivity is set to 0.9 (default values).
The indoor climate conditions are set according to EN ISO 15026 [
17], and consider the variation in indoor air temperature and relative humidity as a function of the outdoor conditions: the indoor air temperature ranges from 20 °C to 26 °C and the relative humidity ranges from 35% to 65%. The inside heat transfer coefficient and surface vapor diffusion coefficient are respectively set to 7.7 W·m
−2·K
−1 and 2.5·10
−8 m·s
−1 [
17].
2.3. Risk Assessment
The hygrothermal performance of the e-CLT and e-PANEL is investigated, in terms of mold growth risk in the critical points identified in
Figure 1 and the increased heat losses, due to the moisture content within the building materials.
The mold growth risk is evaluated, according to the model developed at the Technical Research Center of Finland (VTT) [
23], which defines a mold index (MI), depending on the temperature and relative humidity values of the investigated surfaces. The MI ranges from 0 to 6: MI < 1 means that no mold growth occurs, 1 ≤ MI < 3 means that mold risk is moderate but acceptable, MI ≥ 3 means that mold growth is not acceptable. The model also takes into account the sensitivity of the specific materials to mold growth:
Table 5 shows the sensitivity classes assumed in this study for the investigated materials, according to the classification reported in [
24].
The increase in the heat losses is evaluated in terms of the moisture-dependent U-value. Since Delphin is not able to provide, as an output, the thermal transmittance as a function of the moisture content, this has been calculated in post-processing through the following formula:
Here, h
0,e and h
0,i are respectively the outside and inside heat transfer coefficients previously defined, n is the number of layers and λ
i (W·m
−1·K
−1) is the moisture-dependent thermal conductivity of each layer, which instead is given as an output of the simulations. According to the materials model available in the Delphin database, the moisture-dependent thermal conductivity is given by the following relation [
25]:
where λ
dry is the dry thermal conductivity and 0.56 is the thermal conductivity of water. This means that the moisture-dependent thermal conductivity is a sort of weighted average of the thermal conductivity of the dry material and the water. Actually, this relation implies a slight simplification of the most rigorous and sophisticated models available in the literature [
26], and deviates from them by around 1% for the wood fiber and around 4% for the CLT. Furthermore, Equation (3) is consistent with the experimental results reported in [
27].
3. Results
Following the report of the results of the preliminary simulations aimed to select the most appropriate MRY (
Section 3.1), this section presents the results regarding the mold growth risk evaluated in the critical points of the e-CLT and e-PANEL solutions (
Section 3.2), as well as the increase in the U-value caused by the moisture content for each simulated scenario (
Section 3.3). All results refer to the tenth simulated year, i.e., after a stabilized behavior is reached.
3.1. Selection of the MRY
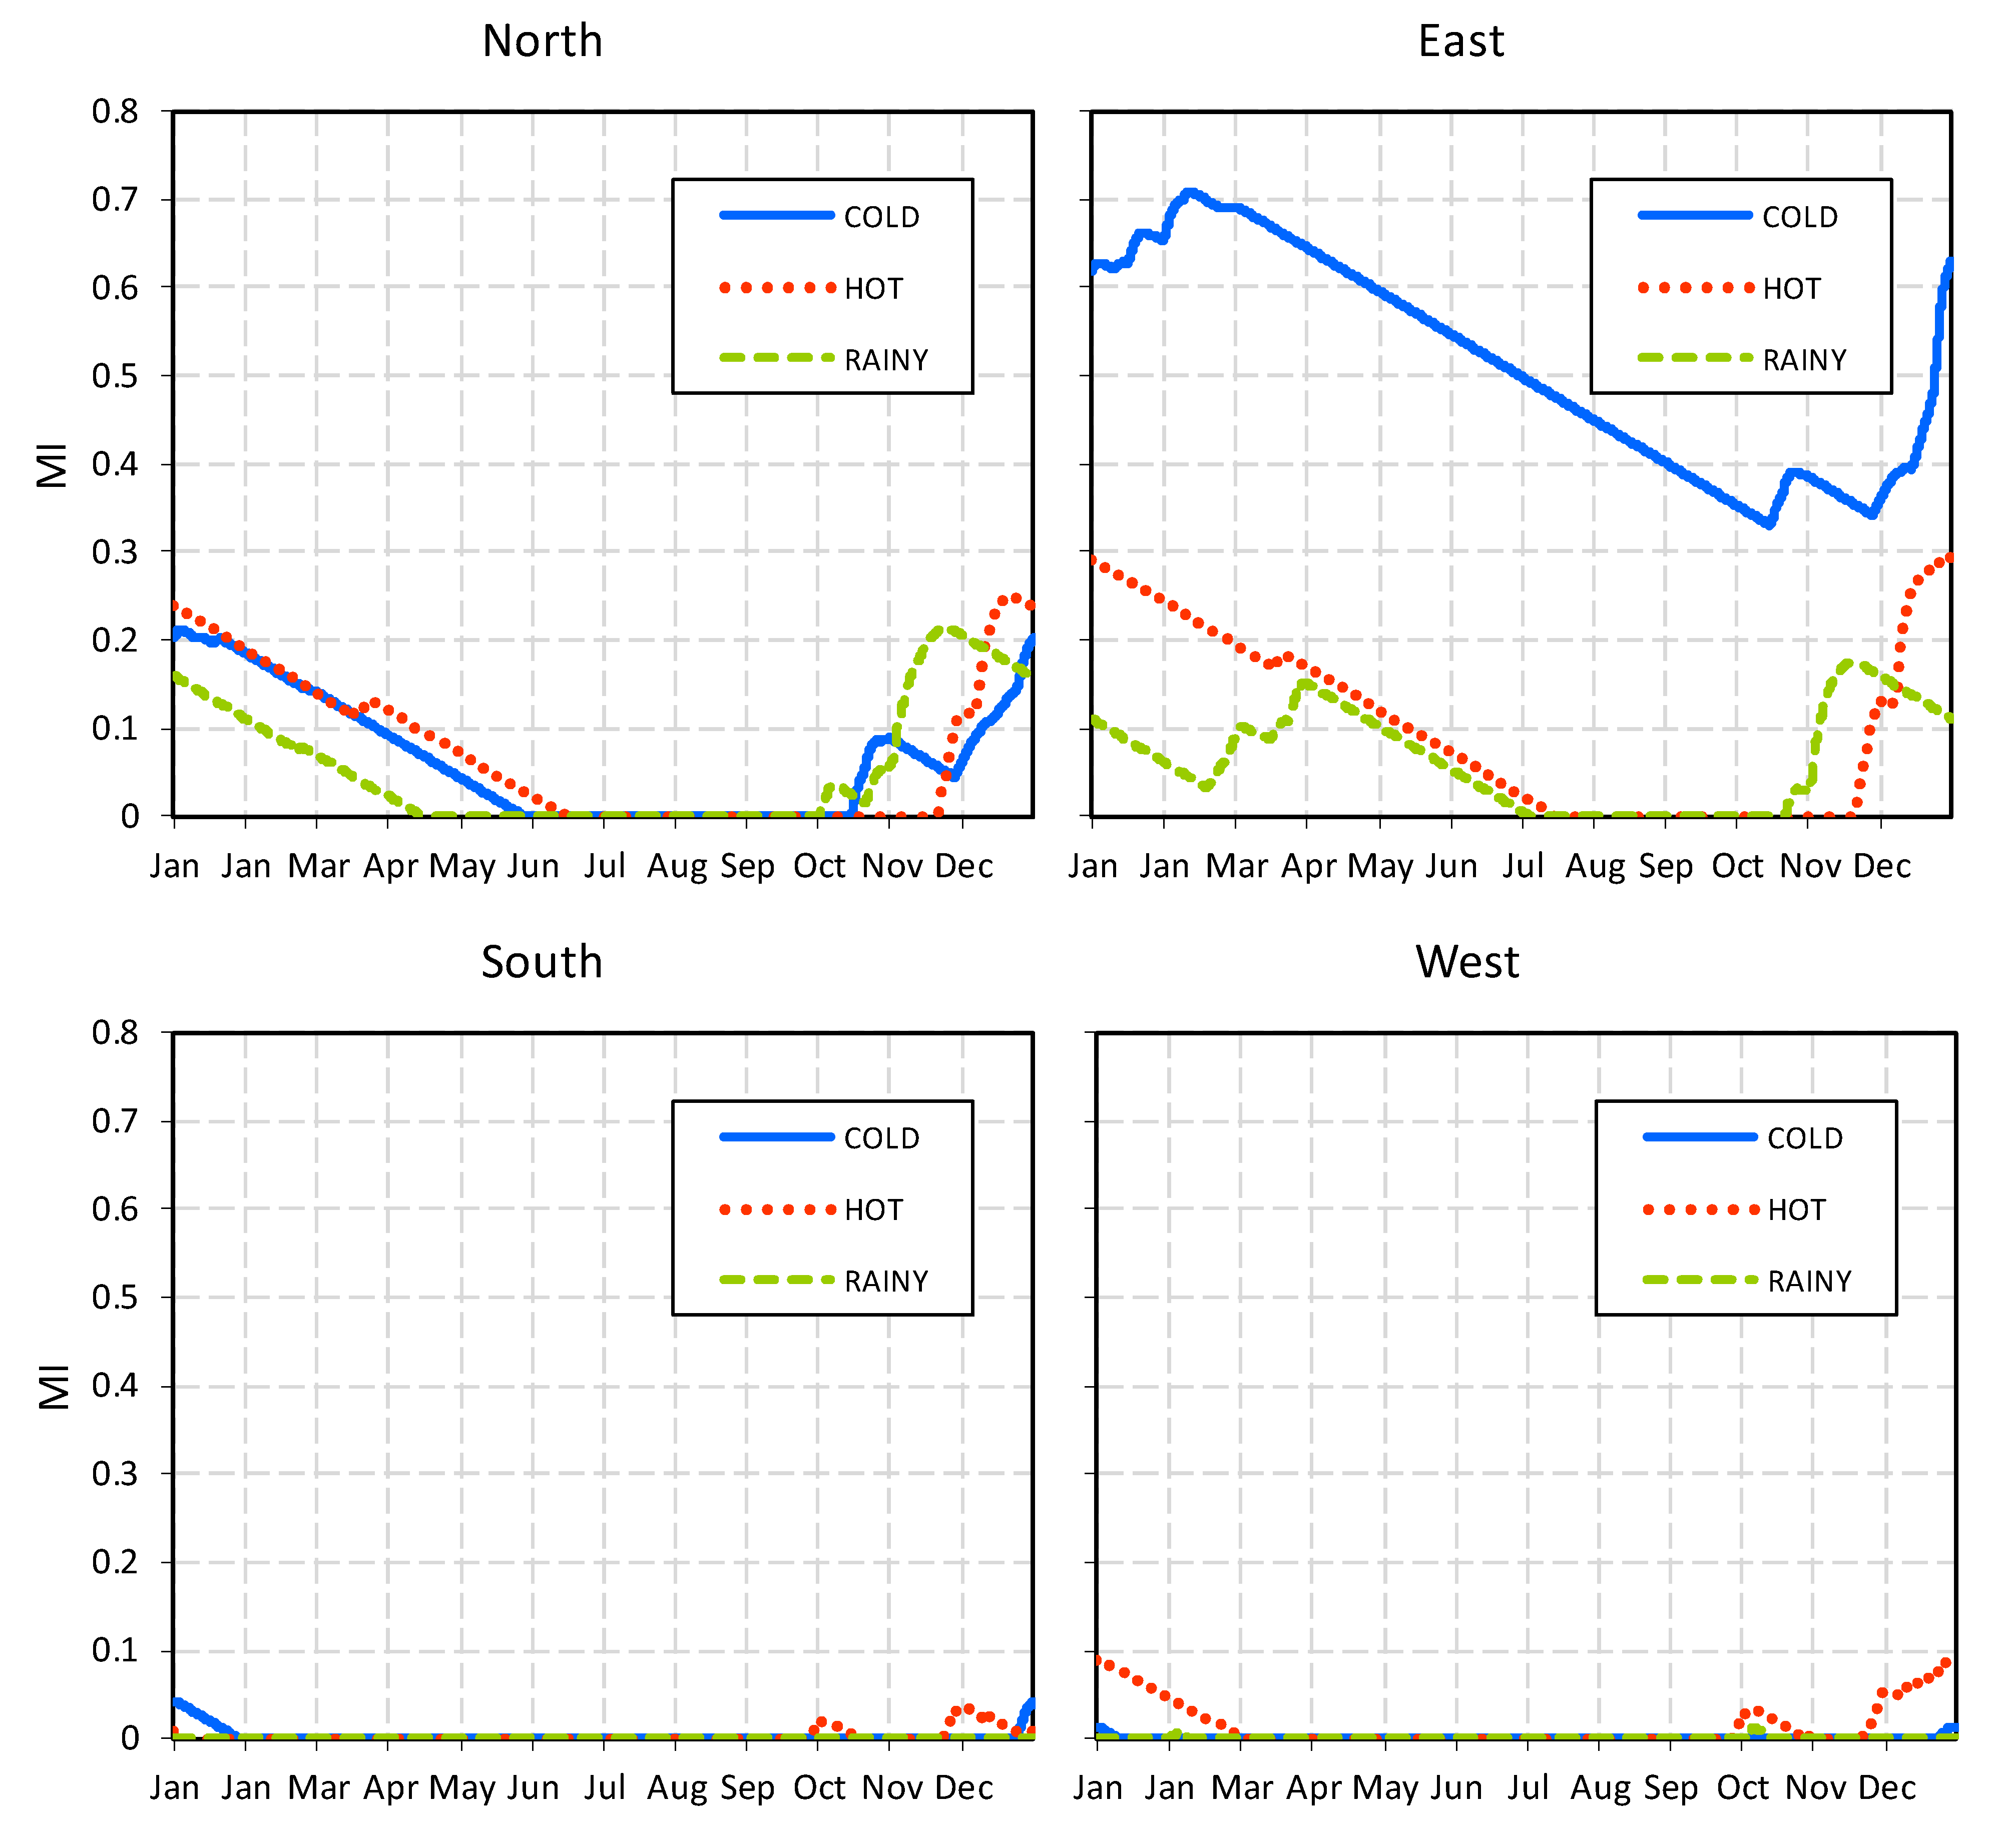
Preliminary simulations are performed in order to select the most appropriate MRY among those suggested by the Standard, depending on the critical conditions that ensure the worst performance, in terms of moisture problems. In doing so, also the effect of the wall orientation is considered: indeed, different orientations imply different rainfall and solar irradiation values. The results are here reported and discussed. They refer only to the base case of the e-CLT solution, because similar conclusions derive from the other scenarios.
As shown in
Figure 4, the COLD year ensures the worst performance, in terms of mold growth (maximum MI = 0.71) in an east-orientated façade. The results suggest also that the effect of the climate dataset and of the wall orientation on the moisture-dependent U-value is negligible. In fact, the increase in the U-value ranges from about 11.10% to 12.10%, compared to the dry case. For these reasons, the COLD year is selected as the MRY and east is selected as the critical orientation for the wall.
3.2. Mold Growth Risk
In order to evaluate the mold-safety of the investigated solutions and to compare the different scenarios, the MI is calculated for the following critical points (
Figure 1):
the outer side of the CLT in the e-CLT solution (point a1);
the outer side of the insulation in the e-CLT solution (point a2);
the outer side of the insulation in the e-PANEL solution (point b).
Apart from the sensitivity class of the materials to mold growth (
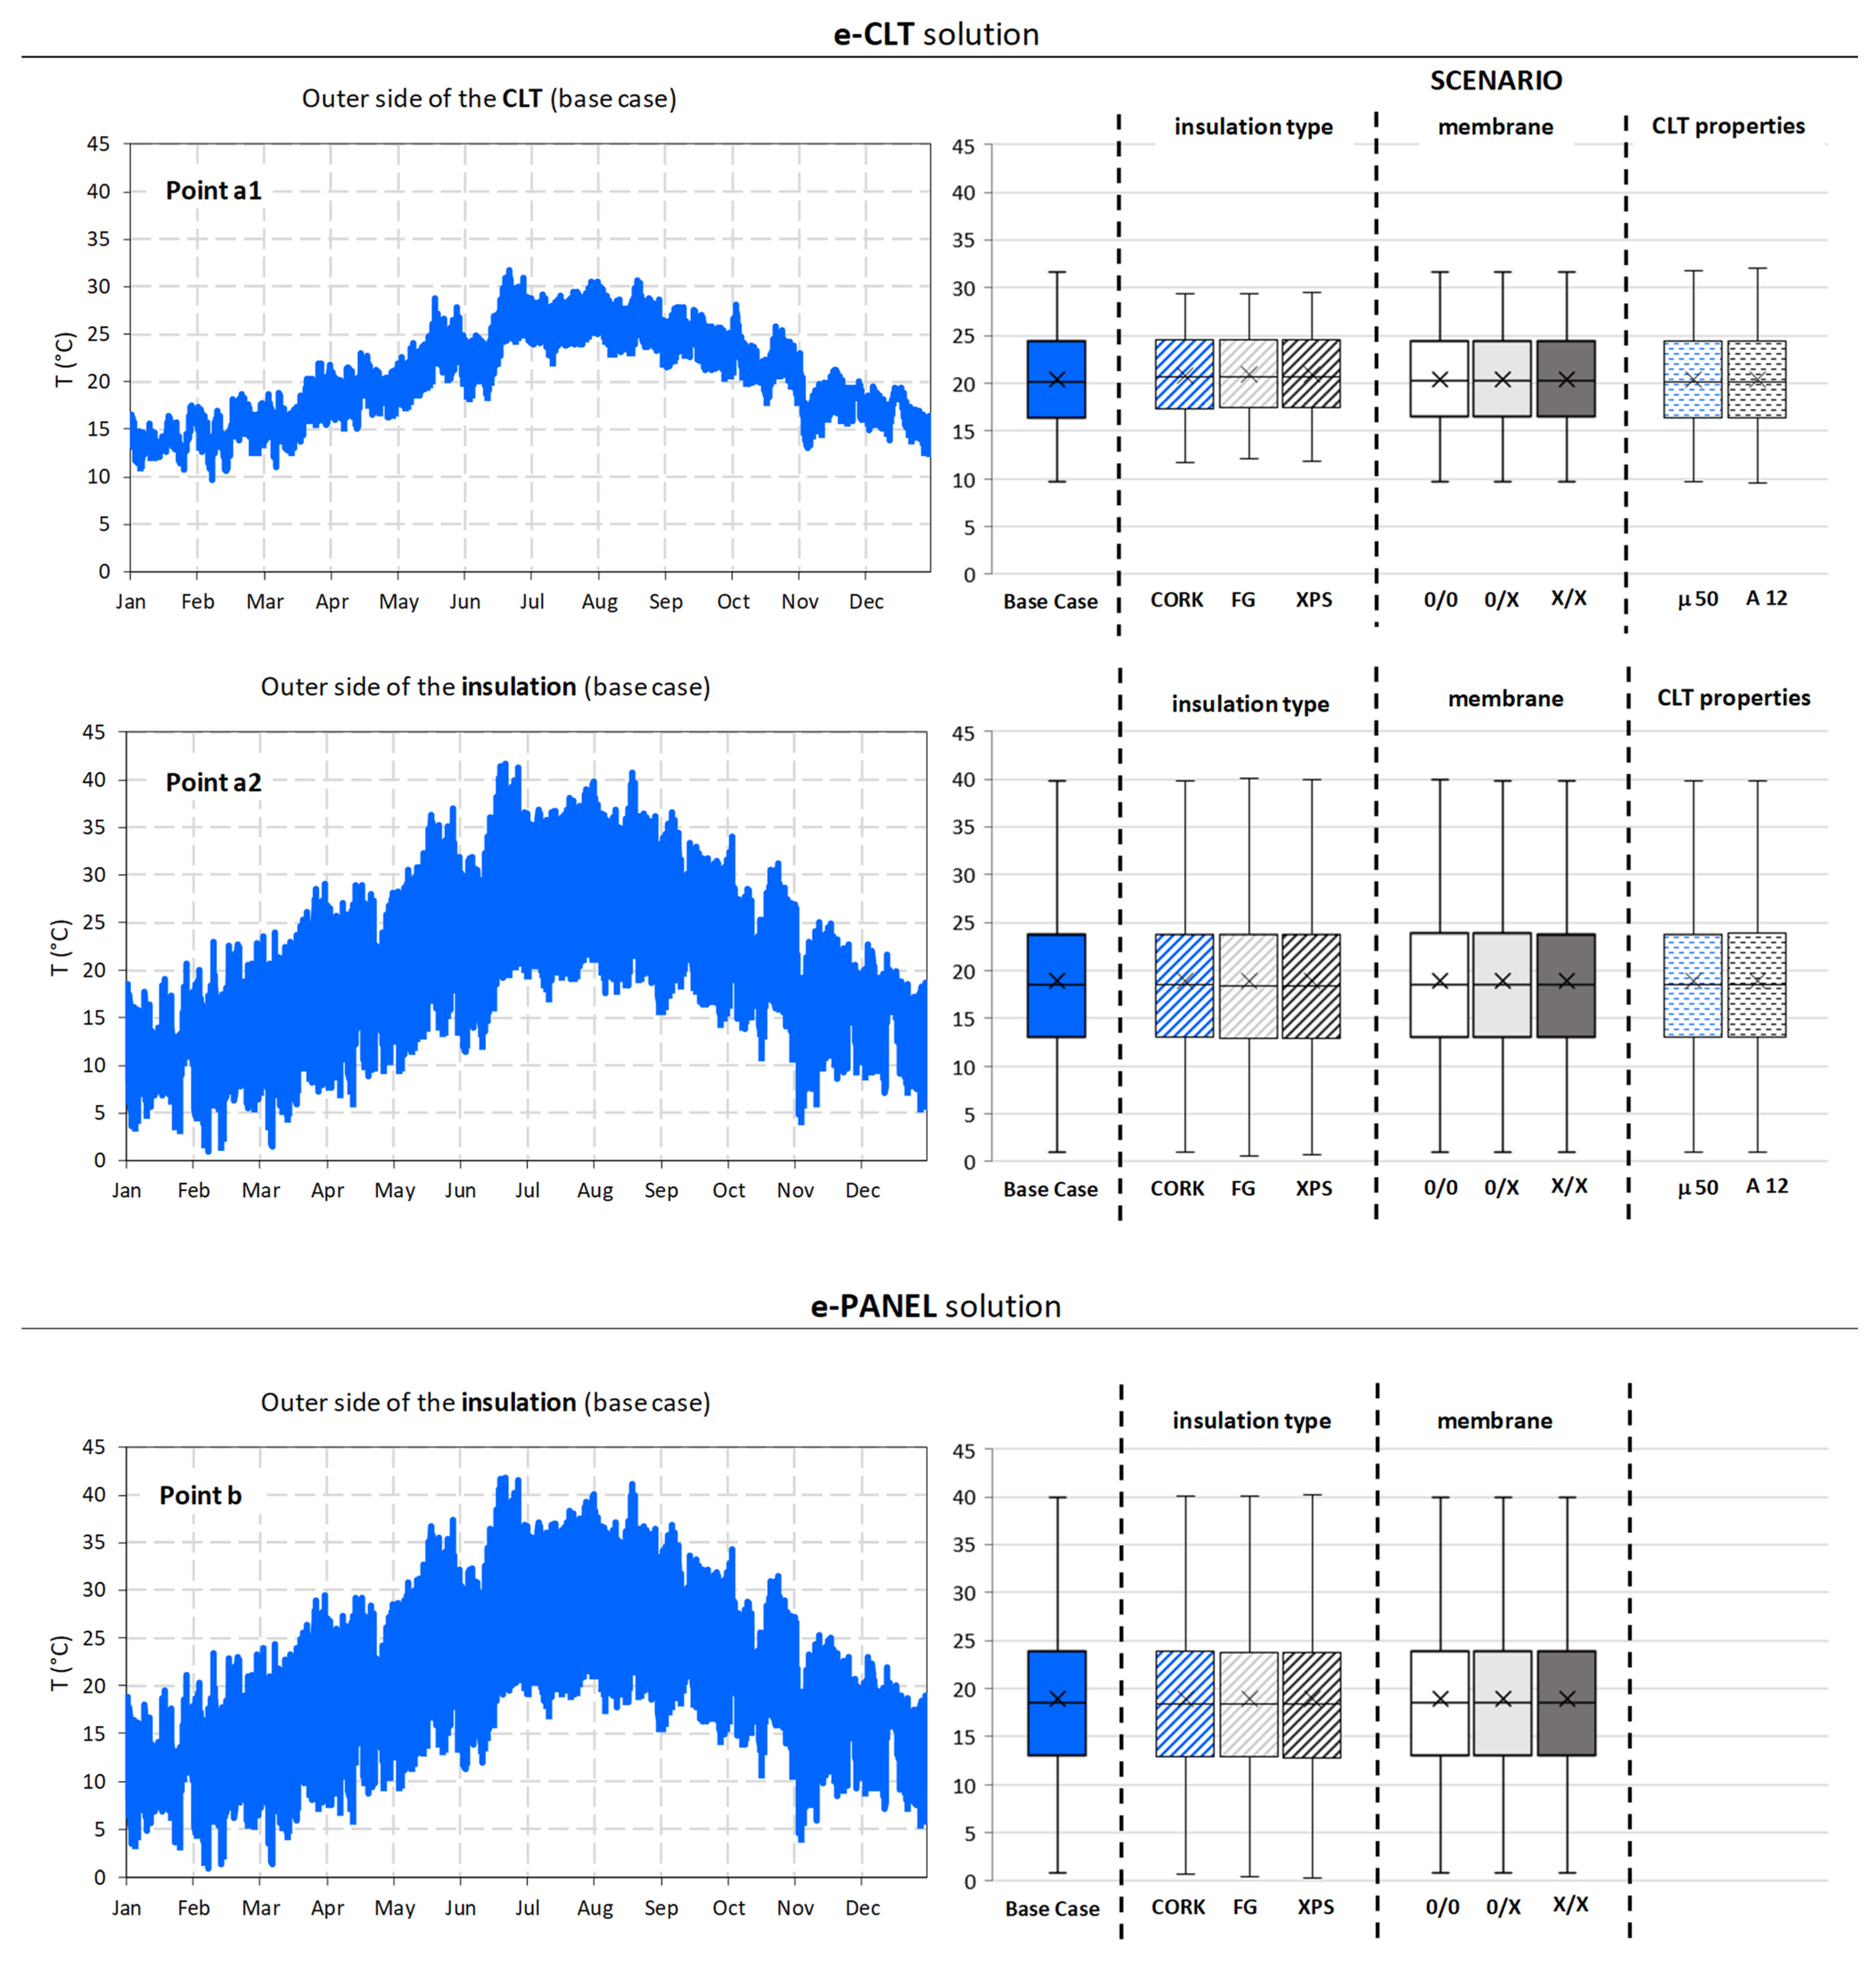
Table 5), the MI depends also on the temperature and relative humidity values in the investigated points. For this reason,
Figure 5 and
Figure 6 report the hourly profiles of these quantities in the base case for both solutions (i.e., with WF protected with the WPM, μ = 186 (-) and A = 5 g·m
−2·s
−1/2 for the CLT), while for all scenarios the boxplots show the corresponding statistical distribution for the sake of comparison.
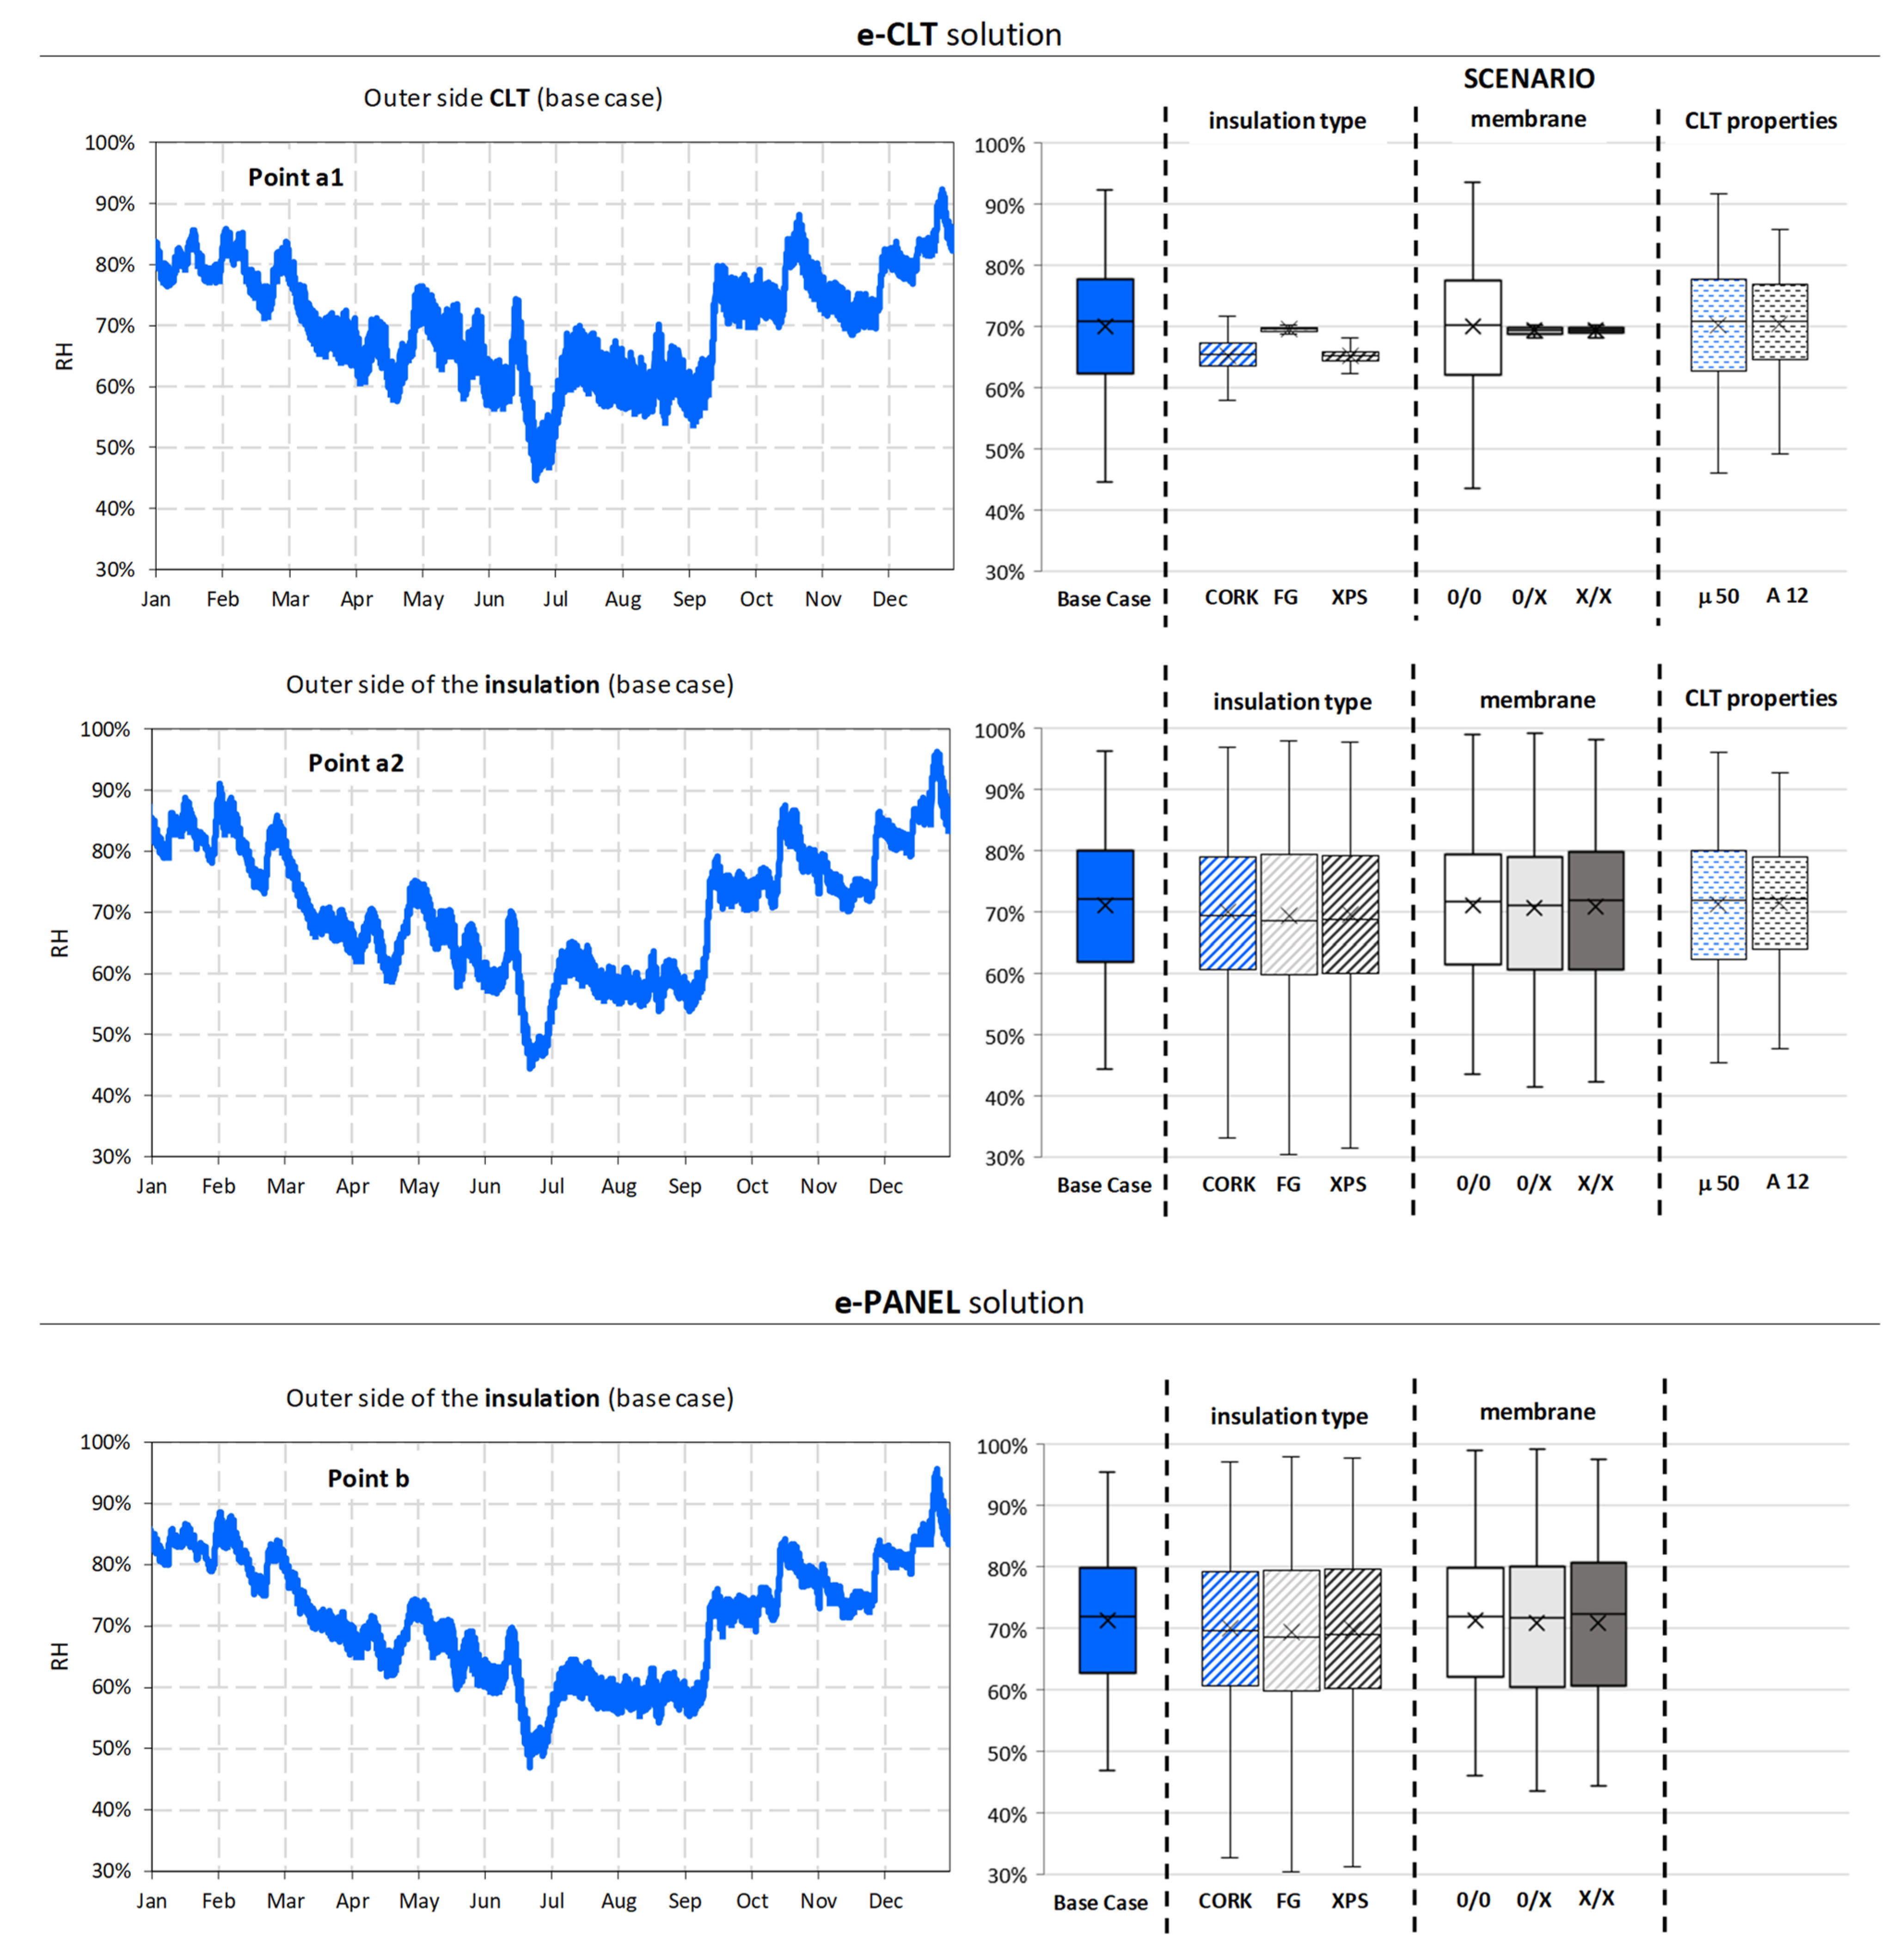
Considering the e-CLT base case, the temperature ranges from about 10 °C to 32 °C in point a1, and from about 1 °C to 42 °C in point a2. Instead, the RH can exceed 80% between October and March in both points, reaching 96% in point a2. In the winter, point a1 keeps at a lower temperature and a slightly lower RH than point a2, thus suggesting that the insulation layer is more exposed to mold-risk than the CLT layer.
In the other scenarios, the temperature distributions are very similar, with just some slight differences in point a1 after changing the insulation type (
Figure 5). In this case, the extreme values deviate by about 2 °C from the base case.
On the contrary, the RH is more sensitive to the different design scenarios (
Figure 6). Indeed, by comparing the RH values in the simulated scenarios for the e-CLT, one can further notice that:
the RH variation in the CLT is very narrow if insulating materials, other than WF, are used;
the absence of the WPM in the scenario 0/0 increases the maximum RH in both points, while the VB in scenarios 0/X and X/X keeps the RH in the outer side of the CLT almost constant, at around 70%;
the increase in the vapor permeability, and above all the increase in the water uptake coefficient of the CLT, determine a shrinkage of the boxplots for both sides.
The behavior of point b is quite similar to point a2. In particular, the RH values in the outer side of the e-PANEL insulation tend to be slightly lower than those in the equivalent point of the e-CLT.
Based on these results, it is possible to state that the proposed variants, in terms of insulating material, position, and type of membrane, as well as the CLT properties, mainly affect the RH distribution within the wall assembly, rather than the temperature distribution.
Once the time trend of the temperature and RH has been determined, the MI is calculated, according to the VTT model.
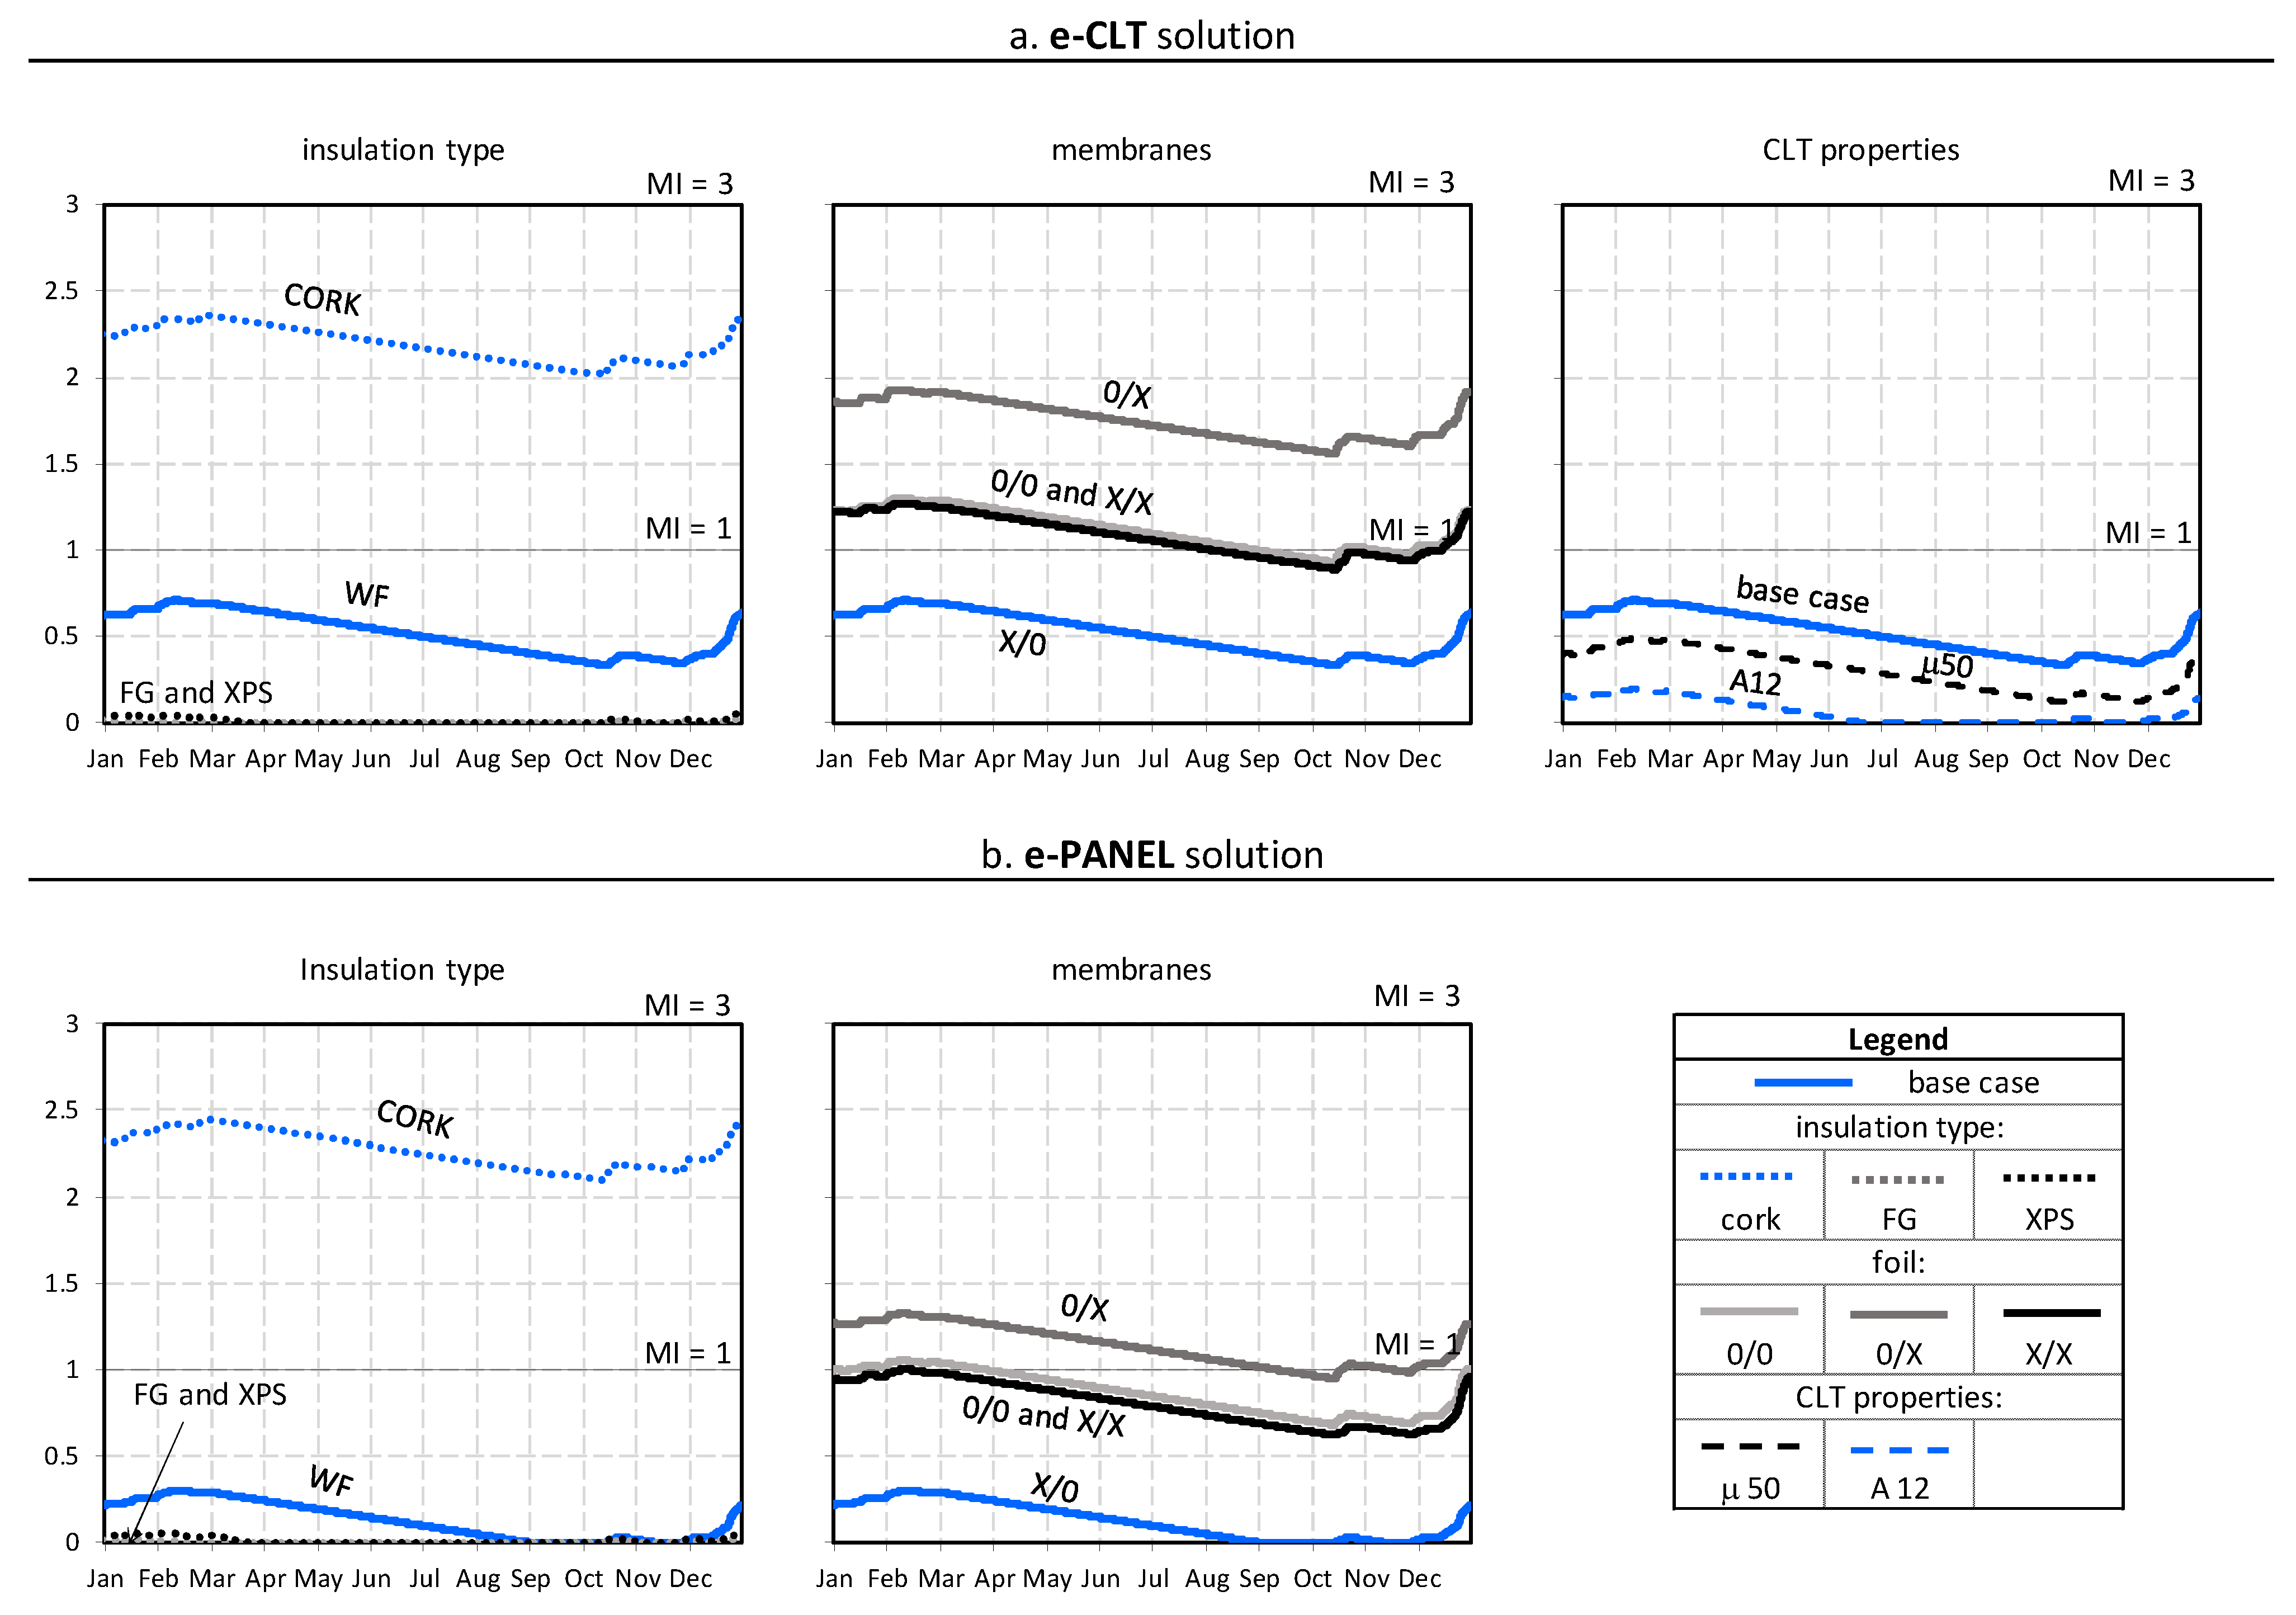
Figure 7 shows the time trend of the MI: this plot compares each scenario to the base case for both solutions (i.e., e-CLT and e-PANEL). The trends refer only to the outer side of the insulation, since the MI in the outer side of the CLT never exceeds 0.3, and has not been reported for the sake of conciseness.
According to the VTT mold growth model [
25], the points are considered mold-free when the MI is below the threshold of 1: therefore, the base case is mold-free in both solutions. Looking at the variants, all of these wall assemblies do not show mold growth issues, even when using CORK for which the MI is higher than one but lower than 3.
As far as the insulation type is concerned, the best scenarios are those using FG and XPS for which the MI is very close to 0. Furthermore, considering the different combinations of the membranes, the base case (where the insulation is protected by the WPM), is the best scenario with a MI < 1, while the worst scenario is the case 0/X, with a vapor barrier placed in the inner side and no water-proof membrane protecting the outer insulation layer. Intermediate results are achieved by scenarios 0/0 and X/X. Regardless, in these three cases the mold growth is still acceptable (MI < 3).
As far as the CLT properties are concerned, the mold risk is more sensitive to the variation of the water uptake coefficient A than to the vapor resistance factor of the CLT. However, the different value of these parameters does not yield considerable variations in the results.
In general, the results for the e-CLT and e-PANEL follow the same trend. Considering the scenarios where the insulation type is tested, the difference in the MI between the solutions is negligible, especially for the CORK, the FG, and the XPS. Nevertheless, in the presence of WF, the e-PANEL assembly ensures a very slight better performance than the e-CLT assembly.
3.3. Moisture-Dependent U-Value
This section reports the results regarding the moisture-dependent U-value, calculated as described in
Section 2.3 for the e-CLT and the e-PANEL. In order to verify its possible correlation with the mean moisture content in the insulation and in the CLT layer,
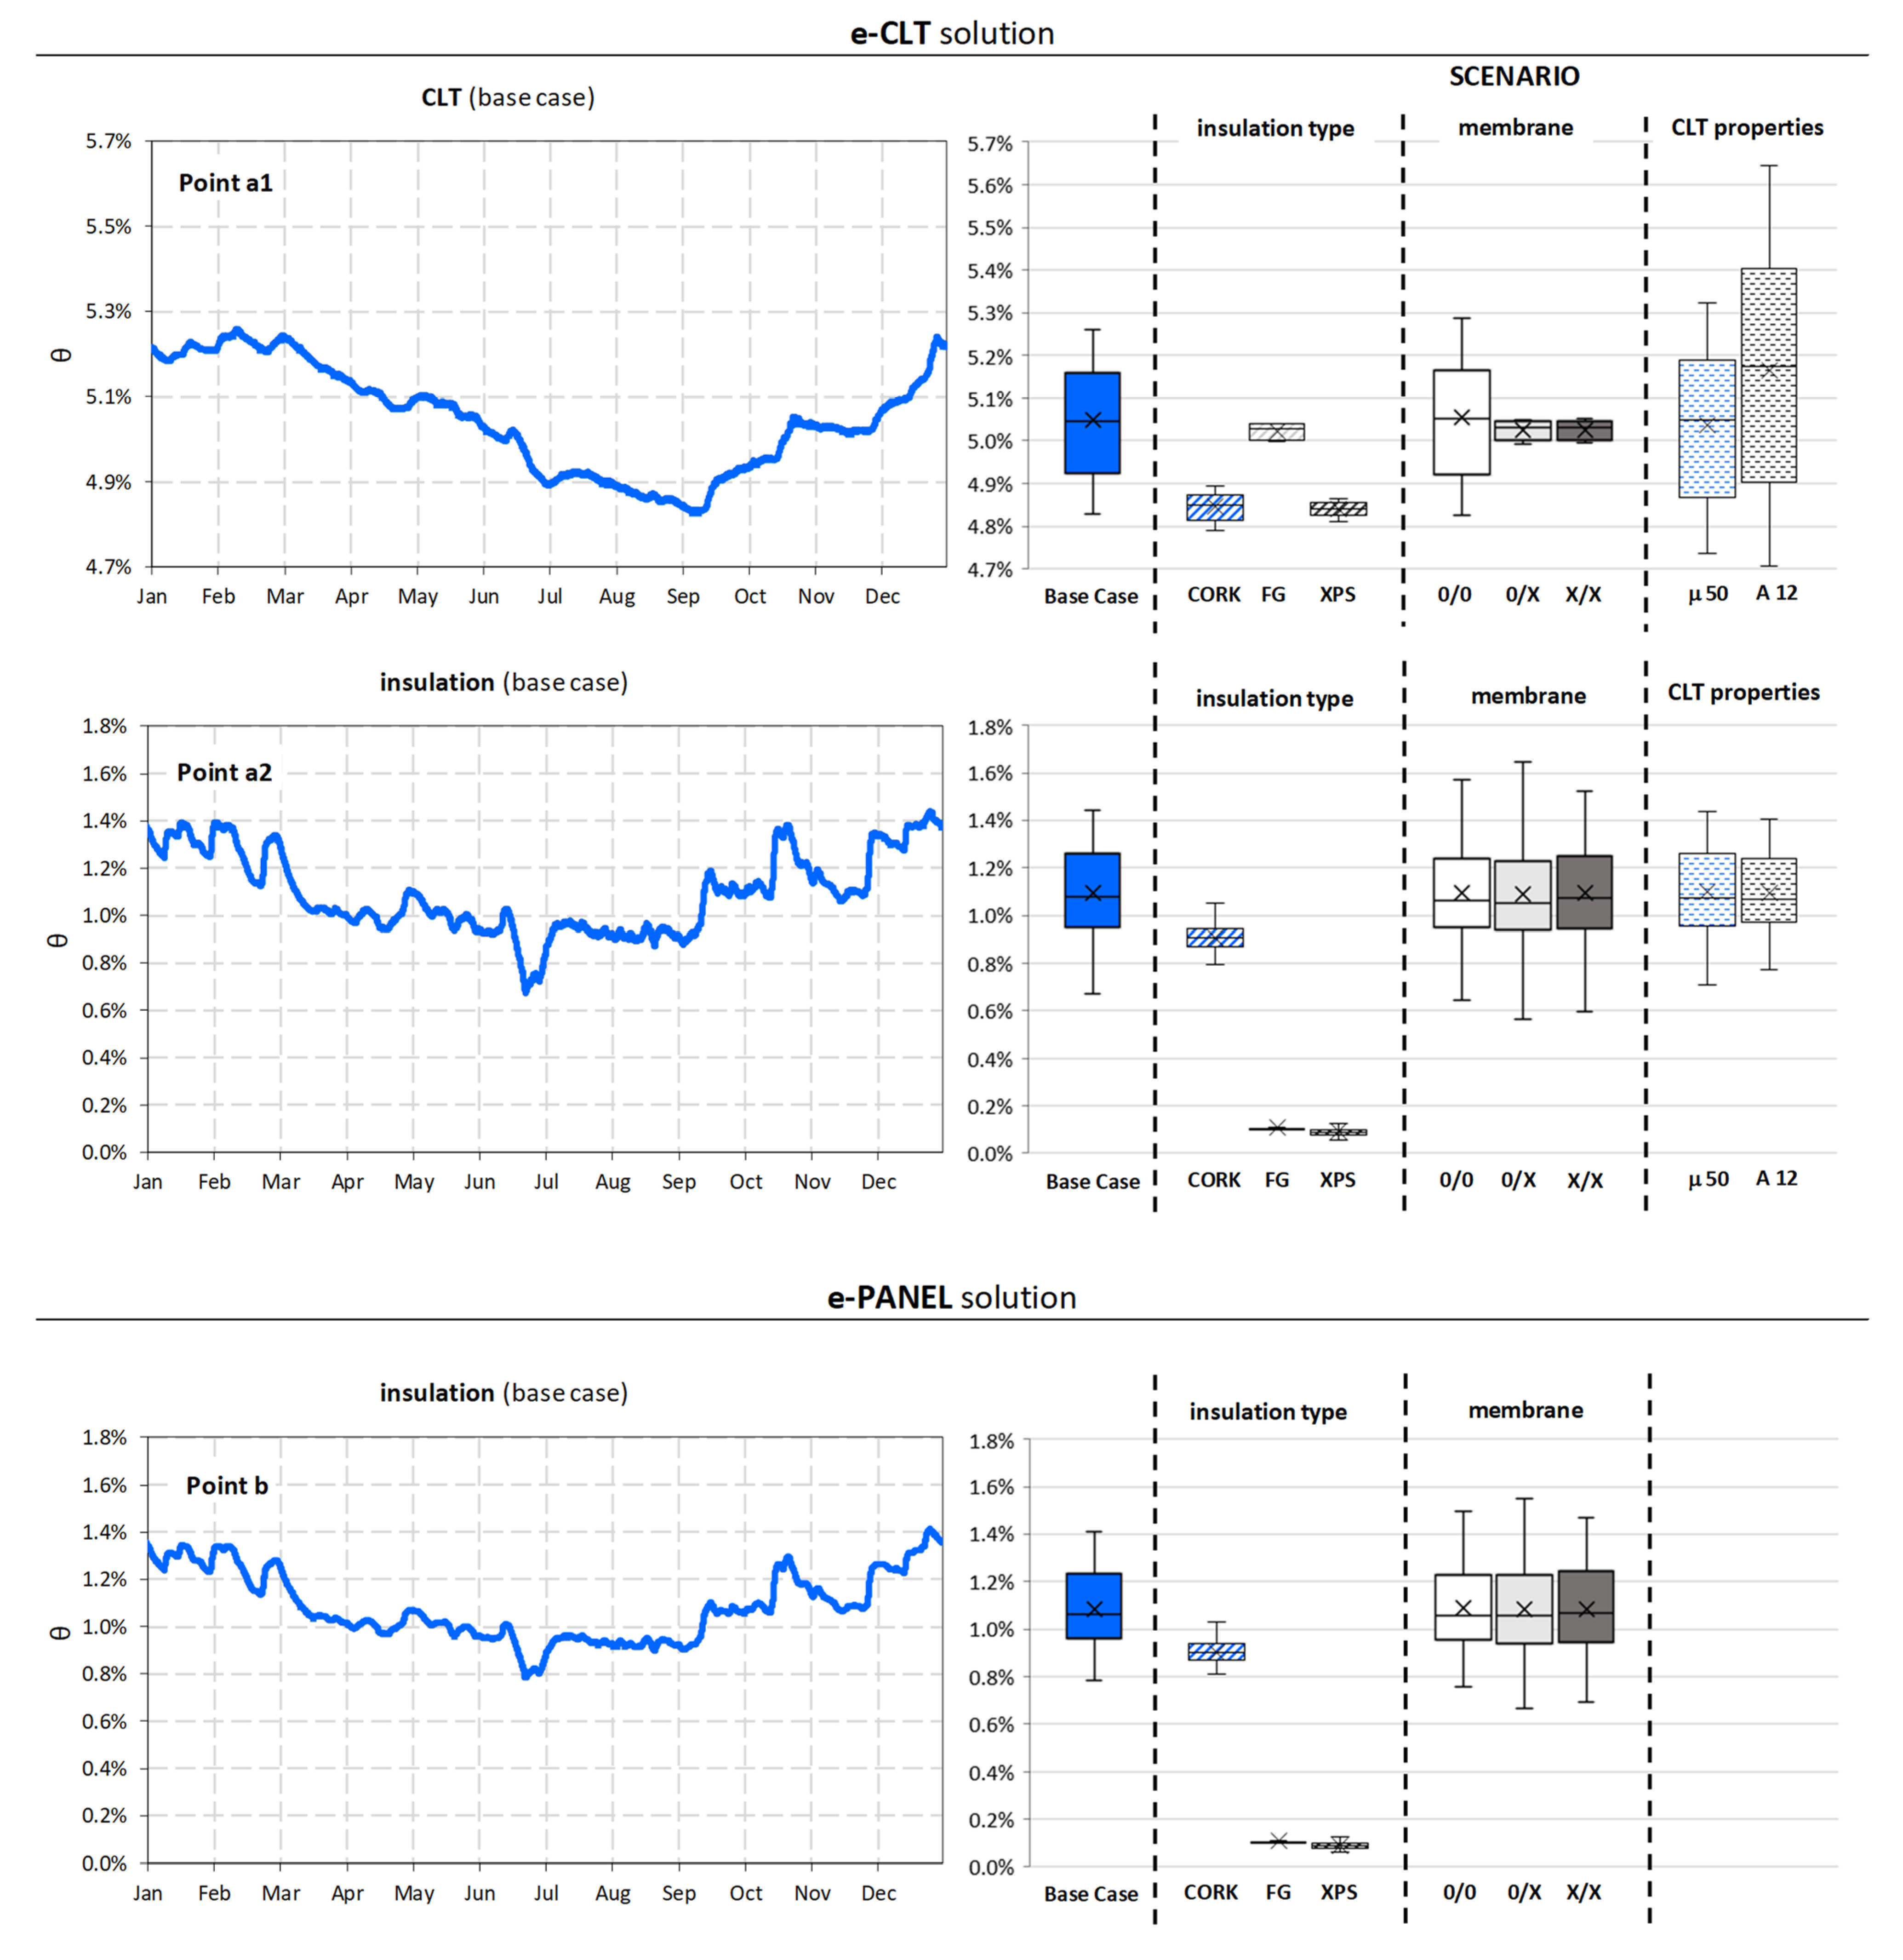
Figure 8 reports the time trend of the moisture content, along with the statistical distribution (box-plots) for each simulated scenario.
In all cases, the CLT keeps a higher moisture content (5.0% on average) than the insulation (1.1% on average). This is due to their different sorption curve: indeed, the CLT absorbs much more moisture than the insulating materials under the same relative humidity conditions.
By comparing the insulation types, one can observe that the mean moisture content inside the insulation layer mainly depends on the sorption curve of the considered insulating material. Thus, the moisture content is higher in the WF (base case), followed by the CORK, the FG, and the XPS scenarios. In particular, the FG and the XPS show a moisture content close to zero, according to their flat sorption curve, independently of the relative humidity. Moreover, the mean moisture content in the CLT layer seems to be mainly affected by the vapor resistance of the insulating material. Indeed, the highest moisture content values pertain to the FG scenario (sd = 476,000 m), followed by the XPS scenario (sd = 68 m), and the CORK scenario (sd = 20 m). Indeed, highly vapor resistant insulation limits the moisture transport by diffusion from the CLT to the outdoors.
Looking now at the results concerning the membranes, the missing WPM in scenario 0/0 does not significantly affect the moisture content distribution, while the vapor barrier in scenarios X/0, which corresponds to the base case, and X/X causes a shrinkage of the box plots in the CLT layer. This means that the presence of the inner vapor barrier makes the CLT less sensitive to the moisture coming from the inner side.
The behavior of the insulation layer in the e-PANEL solution is similar to what has already been described for the insulation layer in the e-CLT.
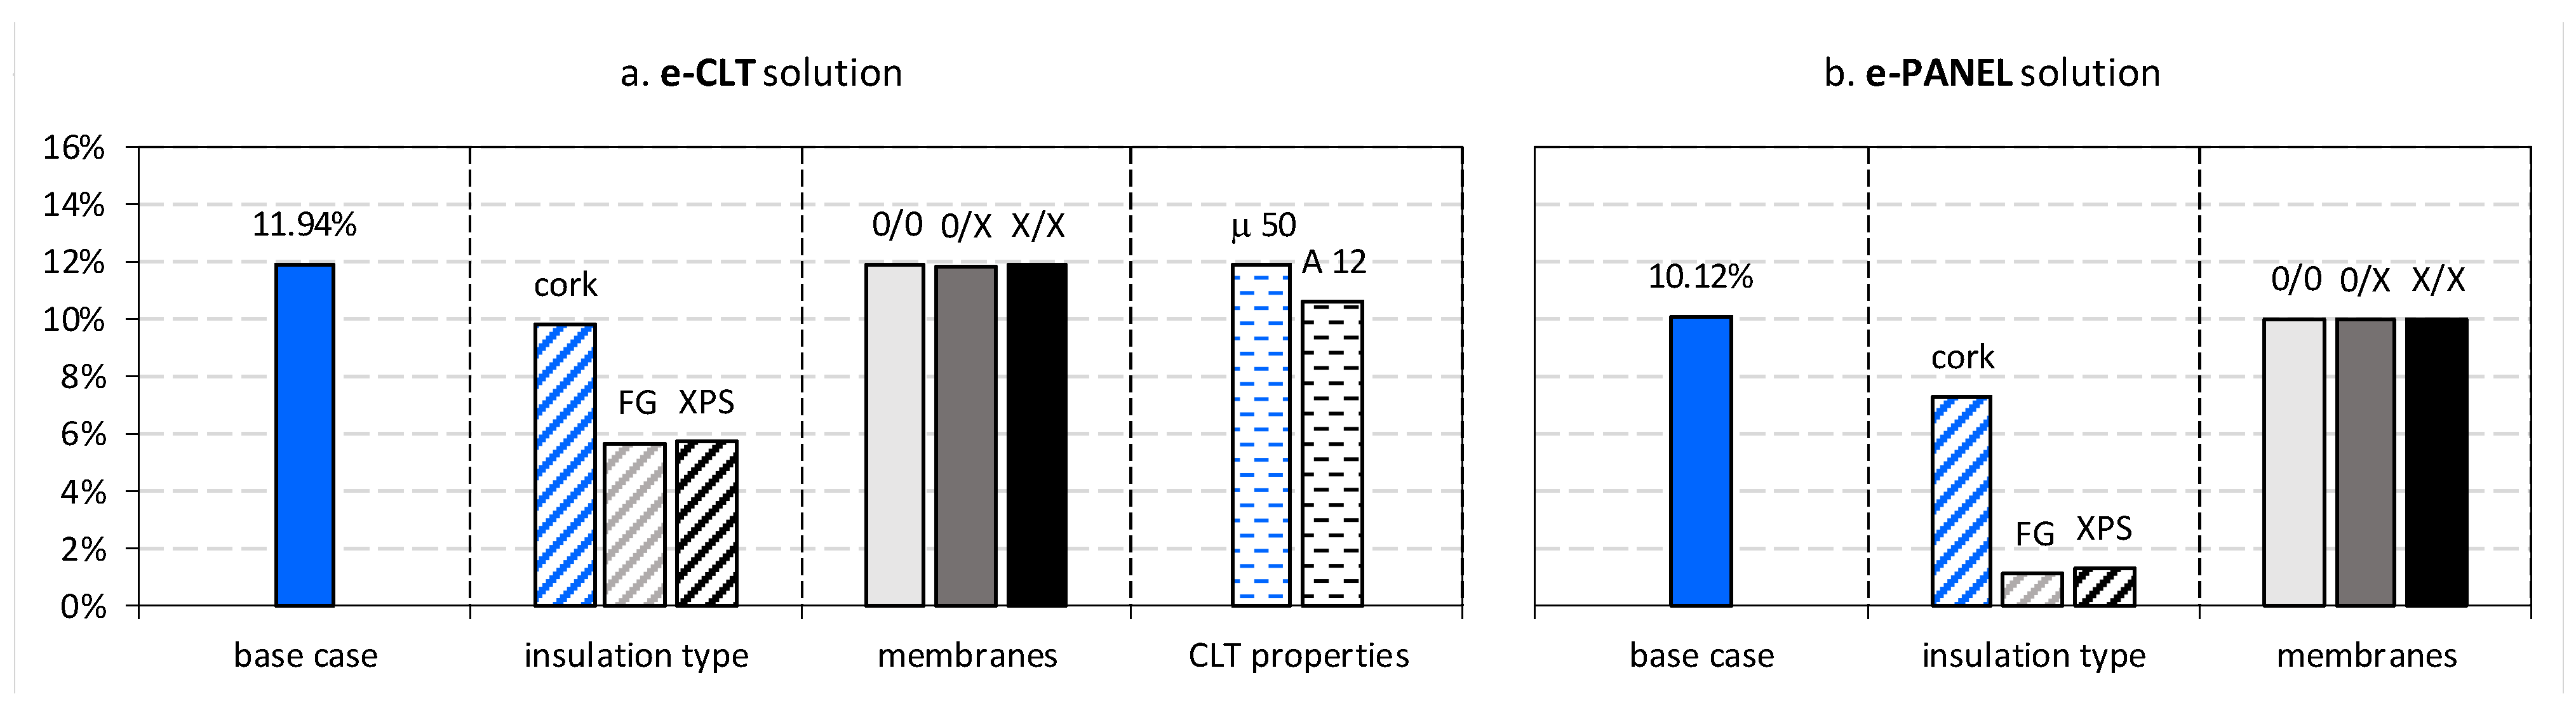
Figure 9 shows the yearly increase in the U-value, compared to the dry case, which is mainly affected by the insulation type. The wall assembly insulated with WF ensures the worst performance: the moisture content determines a yearly mean increase by about 12% (up to 0.325 W·m
−2·K
−1) in the e-CLT, and by about 10% in the e-PANEL (up to 0.320 W·m
−2·K
−1). Moreover, the best results are ensured by the wall assemblies, respectively, insulated with FG and XPS. However, although these materials significantly limit the moisture storage and transfer, it is not possible to keep the U-value increase below 6% in the e-CLT and below the 2% in the e-PANEL. The scenarios with different combinations of the membranes do not cause significant variations, in terms of the moisture-dependent U-value. Likewise, the uncertainty in the CLT properties does not significantly affect the results, although they determine a wide variability on the moisture content in the CLT layer (
Figure 8). Once again, the assembly performance is more sensitive to a variation in the A-value then in the μ-value, and lower A-values ensure slightly more conservative results. The increased U-value is about 11% with A = 12 g·m
−2·s
−1/2, compared to 12% with A = 5 g·m
−2·s
−1/2.
4. Discussion
The results presented in the previous section provide recommendations for the design of the wood-based retrofit solutions called e-CLT and e-PANEL, applied to the specific investigated wall assembly and climate, by demonstrating the consequences of using different insulating materials and membranes. Furthermore, they clarify the effects of two key hygrothermal properties of the CLT, namely the A-value and μ-value.
Under the warm climate conditions that are typical of Southern Italy and most countries facing the Mediterranean Sea, all of the assemblies considered in this study are mold safe. In fact, the MI in a ten-year-long period is below the risk threshold (MI < 3). The increase in the U-value ranges from 6% to 12% in the e-CLT assembly and from 1% to 10% in the e-PANEL assembly.
The base case where the thermal insulation is provided through wood fiber, and an outer waterproof membrane is installed, ensures a good performance, in terms of mold growth (MI < 1), despite the high sensitivity of the materials to mold growth. However, even if the wood fiber determines acceptable MI values, it provides the worst performance, in terms of the moisture-dependent U-value (increase by about 12% and 10% from the dry value for the e-CLT and e-PANEL, respectively). In fact, due to its higher sorption capacity, the WF absorbs more moisture than other insulating materials under the same relative humidity. The result also suggests that those solutions providing higher RH values do not necessarily imply the most evident increase in the U-value, the latter depending on the moisture content.
Moreover, the use of cork must be carefully evaluated because it is prone to a non-negligible mold growth, even if the risk is still acceptable (MI < 3).
The XPS and the FG ensure a better performance, in terms of both mold growth and the moisture-dependent U-value, but they are not recommended for environmental sustainability reasons [
2]. One can also observe that, although the FG and the XPS reach about the same RH-values in the critical point (outer side of the insulation) as the CORK, no mold risk emerges because they are not sensitive to mold growth, according to their low sensitivity class.
Instead, the good performance of the XPS and the FG, in terms of the limited U-value increase, is due to the extremely low moisture content (close to zero) within the insulation layer, according to their flat sorption curve.
The type and position of the membranes do not affect the U-value but rather the MI. Although each combination is mold-safe, the weatherproof membrane in the outer side of the insulation (scenario X/0) is always suggested, since it provides the lowest MI profile for both solutions. By contrast, the presence of an inner vapor barrier always worsens the hygrothermal performance, especially without the WPM (scenario X/X). More specifically, the absence of the WPM allows moisture (in both liquid and vapor forms) to penetrate from the outside through the insulation layer, while the vapor barrier then inhibits this amount of moisture from moving inwards.
As a general conclusion, these results suggest that the investigated moisture-related risks are affected by the hygrothermal properties of the insulation material, mainly the sorption curve and the sensitivity class to mold growth. The results also show that the RH and moisture content conditions in the CLT layer do not significantly affect the investigated moisture-related risks. In fact, point a1 is always mold-free, and it is not possible to find a clear correlation between the moisture content in the CLT and the increased U-value. This suggests that the water content in the insulation has a high impact on the moisture-dependent U-value, although the CLT has higher moisture content values than the insulating materials, due to its higher sorption capacity.
Finally, although the uncertainty in the CLT properties does not imply considerable discrepancies in the results, higher μ-values and lower A-values of the CLT ensure more conservative results.
5. Conclusions
In the framework of the ongoing e-SAFE project, which aims to combine energy savings and seismic safety through structural (e-CLT) and non-structural (e-PANEL) timber-based solutions, this paper provides a hygrothermal investigation of these solutions in terms of moisture related risks, i.e., mold growth and increased heat losses, due the water vapor retained in the materials. The investigated solutions are applied to a pilot building located in Catania (Italy), representative of a warm climate in the Mediterranean area, with the aim of providing recommendations regarding the suitable insulation strategy and the possible adoption of waterproof membranes and vapor barriers.
To this aim, the e-CLT and e-PANEL are simulated by means of the software tool Delphin 6.1.2, which allows the transient combined heat and moisture transport analysis.
The main results are summarized as follows:
The wood fiber insulation is a good compromise to encompass mold-safety and sustainability, but the moisture content that it can accumulate increases by up to 12% the conductive heat losses. The use of cork does not ensure a good performance with respect to other solutions, neither in terms of mold growth, nor in terms of the moisture-dependent U-value. The best moisture-related performance is ensured by the extruded polystyrene and foam glass because they are less sensitive to mold growth, while also absorbing less moisture, due to their flat sorption curve.
The vapor-open waterproof membrane applied to the outer side of the insulation is always suggested, while a vapor barrier in the outer side of the existing wall worsens the mold conditions.
The uncertainties in the definition of some hygrothermal properties of cross laminated timber do not impact significantly the moisture related risks considered. However, considering lower μ and lower A values ensures slightly more conservative results.
In conclusion, in order to go beyond this case study and in compliance also with the ambitions of the e-SAFE project, which aims to apply these solutions in a wider European context, this study will be repeated under different climate conditions and wall assemblies. In addition, further studies will deal with the increase of the heat losses, due to moisture content, looking at the scale of the building, rather than the scale of the component.


