Article

The Role of Architectural Skin Emissivity Influencing Outdoor Microclimatic Comfort: A Case Study in Bologna, Italy

Department of Architecture, University of Bologna, 40136 Bologna, Italy
*
Author to whom correspondence should be addressed.
Sustainability 2022, 14(22), 14669; https://doi.org/10.3390/su142214669
Submission received: 26 September 2022 / Revised: 2 November 2022 / Accepted: 3 November 2022 / Published: 8 November 2022

Abstract

:
This article examines the influence of the emissivity of façade materials on outdoor microclimatic comfort. The developed methodology is based on the collection of input data regarding the site, the geometrical and technological characterization of the building envelope and the definition of the associated emissivity, the development of alternative emissivity-driven scenarios, the scenario simulation to obtain Outdoor Microclimate Maps (OMMs), and their interpretation and discussion. The operative steps of the proposed simplified method are applied to a specific case study in the city of Bologna made of a mix of buildings, including some towers overlooking an inner courtyard. The emissivity of the façade materials is assumed as the main variable. The results show how, by properly addressing the design choices, it is possible to achieve significant improvements in the outdoor microclimate for the space in-between the considered volumes.

1. Introduction, Context and Background

Cities and metropolitan areas are currently accommodating most of the global population, and it is expected that this trend will increase even further in the coming decades [1,2,3,4,5], posing a significant challenge to meeting the Agenda 2030 sustainable targets [6,7]. The increase in the population living in the built environment and the ever-increasing recurrency of extreme phenomena due to the impacts of climate change [8] mean there are calls for a wider reflection on the role of public spaces, green areas, and complementary spaces in ensuring adequate levels of quality and comfort condition [9,10,11,12].
These spaces are vital places of socialization and relation on which most city patterns are based. However, they are often affected by unsuitable conditions such as the street canyon effect [13,14,15,16,17,18] or urban heat island (UHI) [19,20,21,22]—among others—which significantly decrease outdoor comfort and livability. UHI is defined as an urban or metropolitan area that is significantly warmer than its surrounding rural areas mainly due to the modification of land surfaces and human activities [23,24].
In the European Union, a study by Zhou et al. (2013) reported that the UHI intensity is seasonally dependent, and the saturation is maximal in summer at approximately 3 °C and much smaller in winter [25].
These phenomena have been largely investigated in the scientific literature, not only in relation to the perceived level of comfort/discomfort [26,27,28] but also with reference to the potential mitigative actions to be adopted [29,30,31,32].
The increase in the average temperature in cities has huge impacts, and in the near future, it might have an even larger impact on the energy demand for cooling which, in many countries, is equal to or larger than then one for heating. The related energy demand is often concentrated in specific peak times during the hottest days [33,34], causing, in the worst scenarios, a collapse of the energy infrastructure or prolonged black outs. Many different techniques have been explored to mitigate or reduce the effect of UHI, from water bodies to green surfaces and cooling roofs, and among them, the study of the albedo [35] of the surfaces involved in urban fabric configuration is growing in interest and importance.
The albedo depends on three main architectural-related factors [36]: the reflection of direct solar radiation from paving surfaces, the roofs of buildings, and the indirect reflection of buildings’ façades. Many efforts have been made among the scientific community to investigate the possible responses regarding horizontal surfaces, focusing on how vegetation or draining paving can contribute to mitigation [37,38,39,40] and how green or cool roofs [41,42,43] can actively reduce the overheating effects.
However, less attention has been dedicated to the indirect contribution of façade materials. Among the possible solutions explored to reduce the effect of UHI, the application of highly reflective (HR) surface materials [44] (i.e., paints and coatings) [45,46,47,48] in building façades and roofs has been largely experimented with to reflect the incident solar radiation of a building surface. Nonetheless, most of them are diffused HR materials (DHRs) meaning that the solar radiation incident to the building-wall surface is reflected and consequently absorbed by the surrounding surfaces remaining in the urban canyon [14,18,49,50]. For this reason, retro-reflective (RR) materials have been introduced with the purpose to reflect the incident solar radiation to the sky without being absorbed by nearby surfaces [51,52,53,54,55,56]. Among the properties of materials, emissivity is one of the most relevant factors influencing the way solar radiation is reflected [57,58,59,60] and therefore contributing to the increase in the risk of outdoor spaces overheating due to both the direct and the indirect reflection of radiation [61,62] (i.e., reflection from paving largely contributes to the increase in the UHI effect, affecting the urban microclimate).
The scientific literature offers many studies where microclimatic conditions have been explored with reference to inhabitants’ comfort perception [63,64,65,66] as well as to the geometrical configuration [67,68,69] of the spaces in-between buildings which are “still an underestimated field of investigation”. In addition to empirical studies [70,71], thermal comfort has been widely investigated during the last decade using the so-called Predicted Mean Vote (PMV) [72], Physiologically Equivalent Temperature (PET) [73], or the Universal Thermal Climate Index (UCTI).
Developed by Fanger [74] and accepted as a standard by ISO 7730 [75], PMV is an index that aims to predict the mean value of votes in a group of occupants on a seven-point thermal sensation scale with the purpose to “measure” the comfort/discomfort level reflecting one’s subjective thermal sensations in an objective thermal environment. The process has been largely discussed among the scientific community for the complex interaction of many parameters and for the limitations originally assumed by Fanger, but considering that the conditions within the built environment are generally within a small range, PMV has been largely used, and further studies focused on clothing or metabolic rates, defining standards (i.e., ASHRAE Standard 55 Comfort Zone [76]) and indicating thermal conditions that will give a satisfactory predicted mean vote.
Defined as the operative temperature of a reference environment that would cause the same physiological response in the subject as the environment under study, PET (Mayer & Höppe [77]; Höppe [78]; Matzarakis et al. [79]) is mainly used to examine the distribution of physiological stress (PS) thresholds as originally presented by Matzarakis and Mayer [79,80]. PET was further highlighted for its applicability to thermal evaluations within bioclimatic-orientated assessments, as also highlighted by other relevant studies (e.g., Cohen et al. [81]; Abreu-Harbich et al. [82]; Martinelli et al. [83]; Algeciras et al. [84]; Chatzidmitriou & Yannas [85]; Lin et al. [86]; Nouri & Costa [87]; Nouri et al. [88]; Staiger et al. [89]).
PET allows one to describe the thermal sensation in urban spaces in city areas such as parks, squares, and streets [90,91]. The local microclimate and the climate conditions as well as the urban fabric design can be considered the main factors influencing outdoor microclimatic comfort; however, the design choices regarding buildings (orientation, volume configuration, and materials) and particularly façades [92,93,94,95] can also significantly influence the quality and comfort levels. The emissivity of materials used in the building skins are therefore an interesting variable to be investigated with relation to their possible effects on the surroundings.

2. Scope of the Research

The main scope of the study is to investigate the effects façade configuration and material choice have on surrounding outdoor spaces, particularly focusing on the role of the emissivity of materials with relation to the outdoor microclimate [16]. The research analyzes how the variation in emissivity in the choice of façade materials may influence the outdoor comfort levels expressed in Physiologically Equivalent Temperature (PET). Accordingly, the study aims to address the choice, with relation to material properties, to optimize the local response within the overall mitigation strategy, particularly with reference to dense urban contexts with a high height/width (H/W) ratio [11] where the emissivity can become a relevant factor to influence the local microclimate [7]. A detailed study using the simulation software Envi-met [96] was conducted on a test-bed site involving a polygonal plot with an inner courtyard, considering in particular the air temperature and Physiologically Equivalent Temperature (PET) as key variables.
The originality of the study lies in focusing on the role of emissivity in building façades with relation to effects on outdoor comfort conditions, which is generally investigated by paying more attention to horizontal surfaces, namely roofs [97,98] and paved spaces [99]. The main focus of the scientific literature is usually on the specific albedo of materials [100], on the analysis of UHI patterns and intensities with relation to urban typologies [101], and on mitigation techniques and technologies [102], while the role of vertical surfaces is basically addressed to explore cool façade optimization [103]. U. Dietrich particularly focused on the impacts of the materials adopted for building façades in urban street canyons where the Urban Thermal Comfort Index (UTCI) is investigated [104].
The novelty of the present paper is presented in two aspects. The first is the aim to investigate the effects of the emissivity of façade materials with relation to a surrounding outdoor space. Despite the fact that this topic has already been researched by in Fabbri K. et al. [105], this follow up is devoted to providing a simplified way to identify the most appropriate material to clad a façade at a very early design stage with the purpose to consider outdoor comfort as a priority which cannot be achieved without including a consistent reflection of the contribution of vertical surfaces. The second is the use of Outdoor Microclimate Maps (OMMs) and PET as evaluation tools to compare the different performances and effects of materials within the same façade configuration or among alternative scenarios. The role of emissivity is often underestimated during the design process because many other parameters, such as energy and thermal performance, durability, natural ventilation, life cycle analysis, cost-effectiveness, etc., represent more urgent priorities to be fulfilled in finally choosing the façade configuration, layers, and materials. Nonetheless, emissivity can influence outdoor comfort, and the use of OMMs for each possible design configuration or scenario can be of great help in addressing proper choices while reducing the time needed for more detailed simulations. Being costly and time consuming, these simulations—based on advanced software for dynamic modeling—are rarely performed within the design activity of ordinary practice and even less so at an early stage. For this reason, the use of OMMs represents a viable alternative which is a step forward in taking into account additional parameters, and particularly the emissivity of materials, influencing outdoor comfort.

3. Methodology and Materials
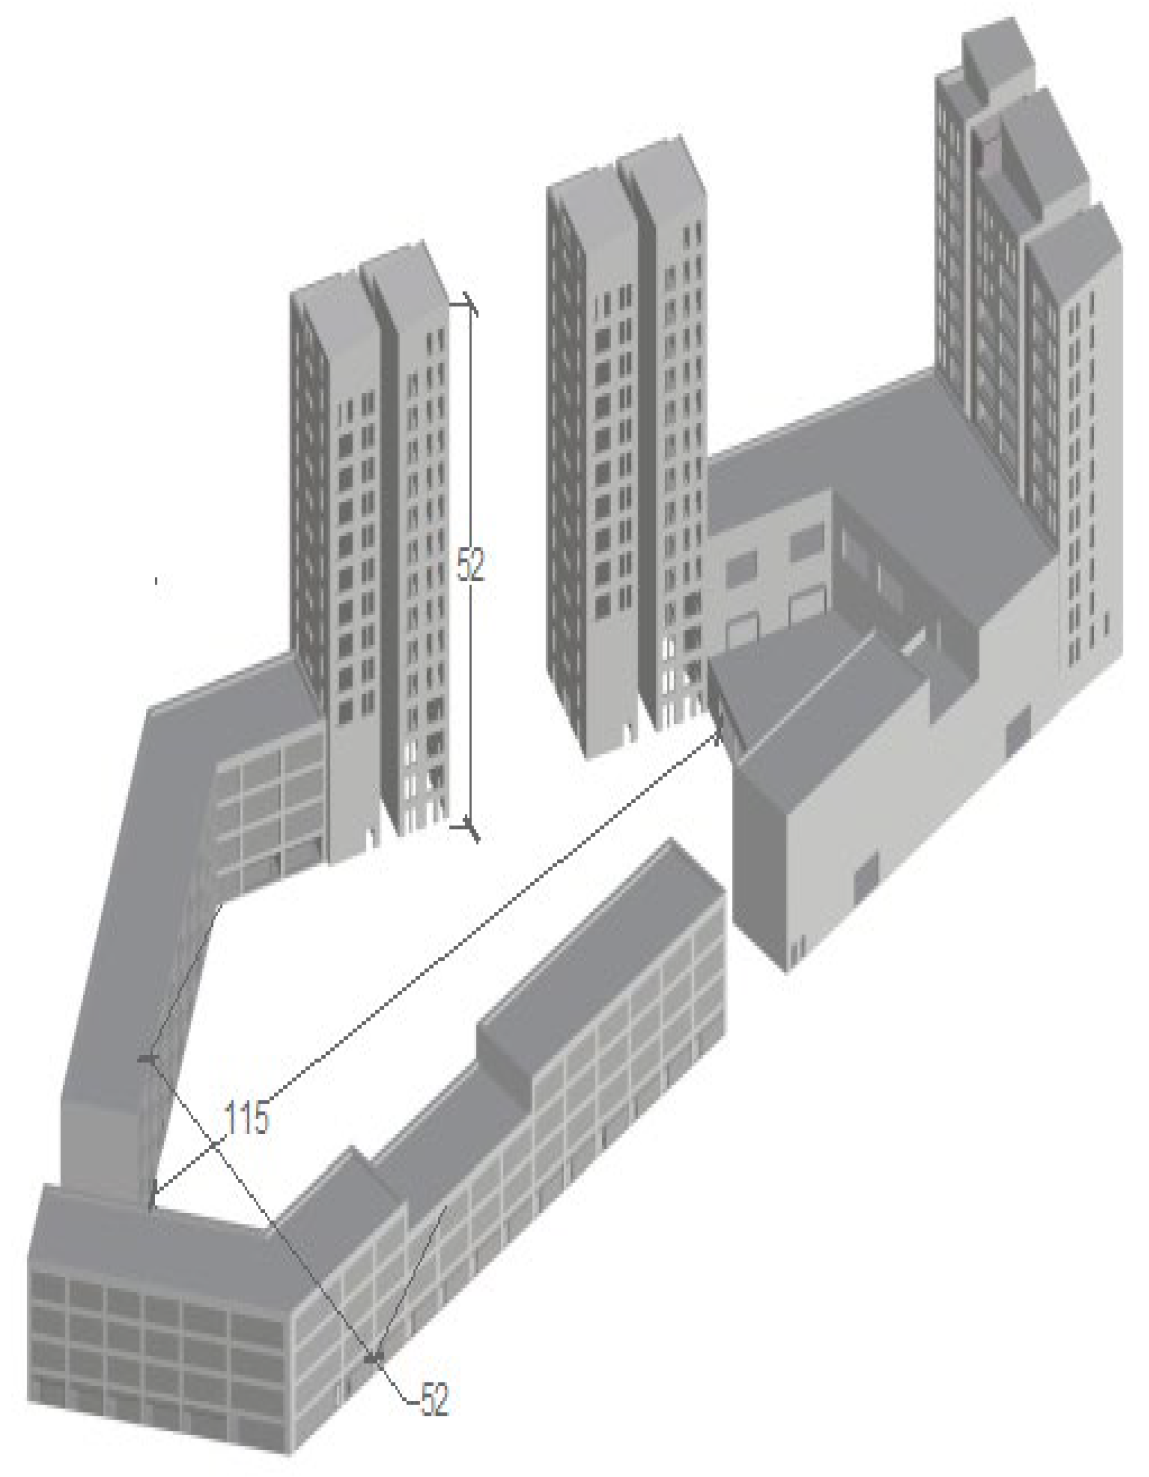
The study adopted a comparative methodology to estimate how the different properties of materials, and reflectance in particular, may influence the performance of a building envelope with reference to outdoor microclimatic comfort. The methodology was developed by choosing a specific site to carry out the study in Bologna, which was chosen as a case study. Every possible location has its own unique features and specific complex interactions of multiple factors depending on the site and the surroundings that may impact on outdoor microclimate. Among these conditions, the density of the urban fabric, the distance between buildings, the volume configuration, the building envelope materials, the properties of vertical and horizontal surfaces, as well as some climatic conditions are discussed in the following text. The authors are aware of this complexity and used a demo-site to create a sequence of steps aimed at fixing some parameters (which may be variable or constant) and focused on the emissivity of the envelope materials for optimization purposes. Following the Stefan–Boltzmann Law, emissivity is defined as the ratio of the radiation emitted by the surface to the radiation emitted by a blackbody at the same temperature. The radiation may be reflected, absorbed, and transmitted by surfaces in relation to surface phenomenon, e.g., color surface [106].
The case study is firstly introduced, and then the operative steps of the methodology are described.

3.1. Case Study

In cooperation with the city of Bologna, the Department of Architecture carried out many studies regarding the regeneration and renovation potential of some strategic assets during the last decade, particularly focusing of energy transition and climate-responsive solutions. The city of Bologna (see Figure 1) is located in the north of Italy, 50 m above sea level, classified E according to the Italian climatic zones (DPR 26/08/1993 n.412) with 2502 day degree. The city is characterized by a humid temperate climate, classified as Marine Climate subtype Cfb according to the Koppen scale [107,108] with a hot, humid summer and a cold, rigid winter. As explained in the following section, temperature and climatic datasets for simulation purposes can be downloaded from the Dexter portal gathered by the Environmental Agency of Emilia Romagna Region [109].
The chosen site is located in the Bolognina neighborhood, north of the railway station, which has been largely redeveloped during the last 15 years. According to the masterplan, several residential buildings and some commercial volumes replaced the former general market within a large polygonal area, divided into many plots which approximately recreate the pattern size of the original district. For the purpose of the study, a plot located on the northern side, and assigned to a mixed-use, was selected, having adequate distances from surroundings and representing a well-balanced mediation between the consolidated urban fabric of five-story buildings with the taller volumes of the new development in its size and density (Figure 2).
The selected case study is a multistory, multifunctional building articulated in several bodies of different heights around an inner courtyard, creating optimal conditions to test the typical microclimatic conditions of recurrent plots in the district.
The plot includes many long, four-story buildings, with some spotted setbacks and three residential towers, 52 m tall (see Figure 3). The volume layout was carefully defined during the early design stage so as not to compromise the possible solar gains during winter with the shadow of the towers which are therefore located to optimize their own solar exposure while preserving the inner courtyard’s quality and avoiding any canyon effect (which would influence the outdoor temperature, air speed, and air quality).
The inner courtyard is irregularly shaped with a maximum width of 52 m and a maximum length of 115 m. The h/w ratio at the minimum distance is 1.
The tower façades represent the largest and most relevant surfaces interacting with the courtyard. The main elevation of the tower is 18 m wide and 52 m tall over 14 stories. The building envelope typical opaque section includes multilayered wood fiber insulation which fills the main timber-based structural framework, wrapping it on the outer side to prevent any thermal bridge, furtherly completed by lightweight Glassfiber-Reinforced Concrete (GRC) panels. A pattern of glazed elements is regularly repeated on each floor.
A ventilated second skin is envisaged with the purpose to reduce the heat loads and, at the same time, to act as an active adaptive shading system for the glazed surfaces.
The choice of the most appropriate material—considering the emissivity and the local conditions—represents the key design challenge and the driver for the application of the proposed methodology.

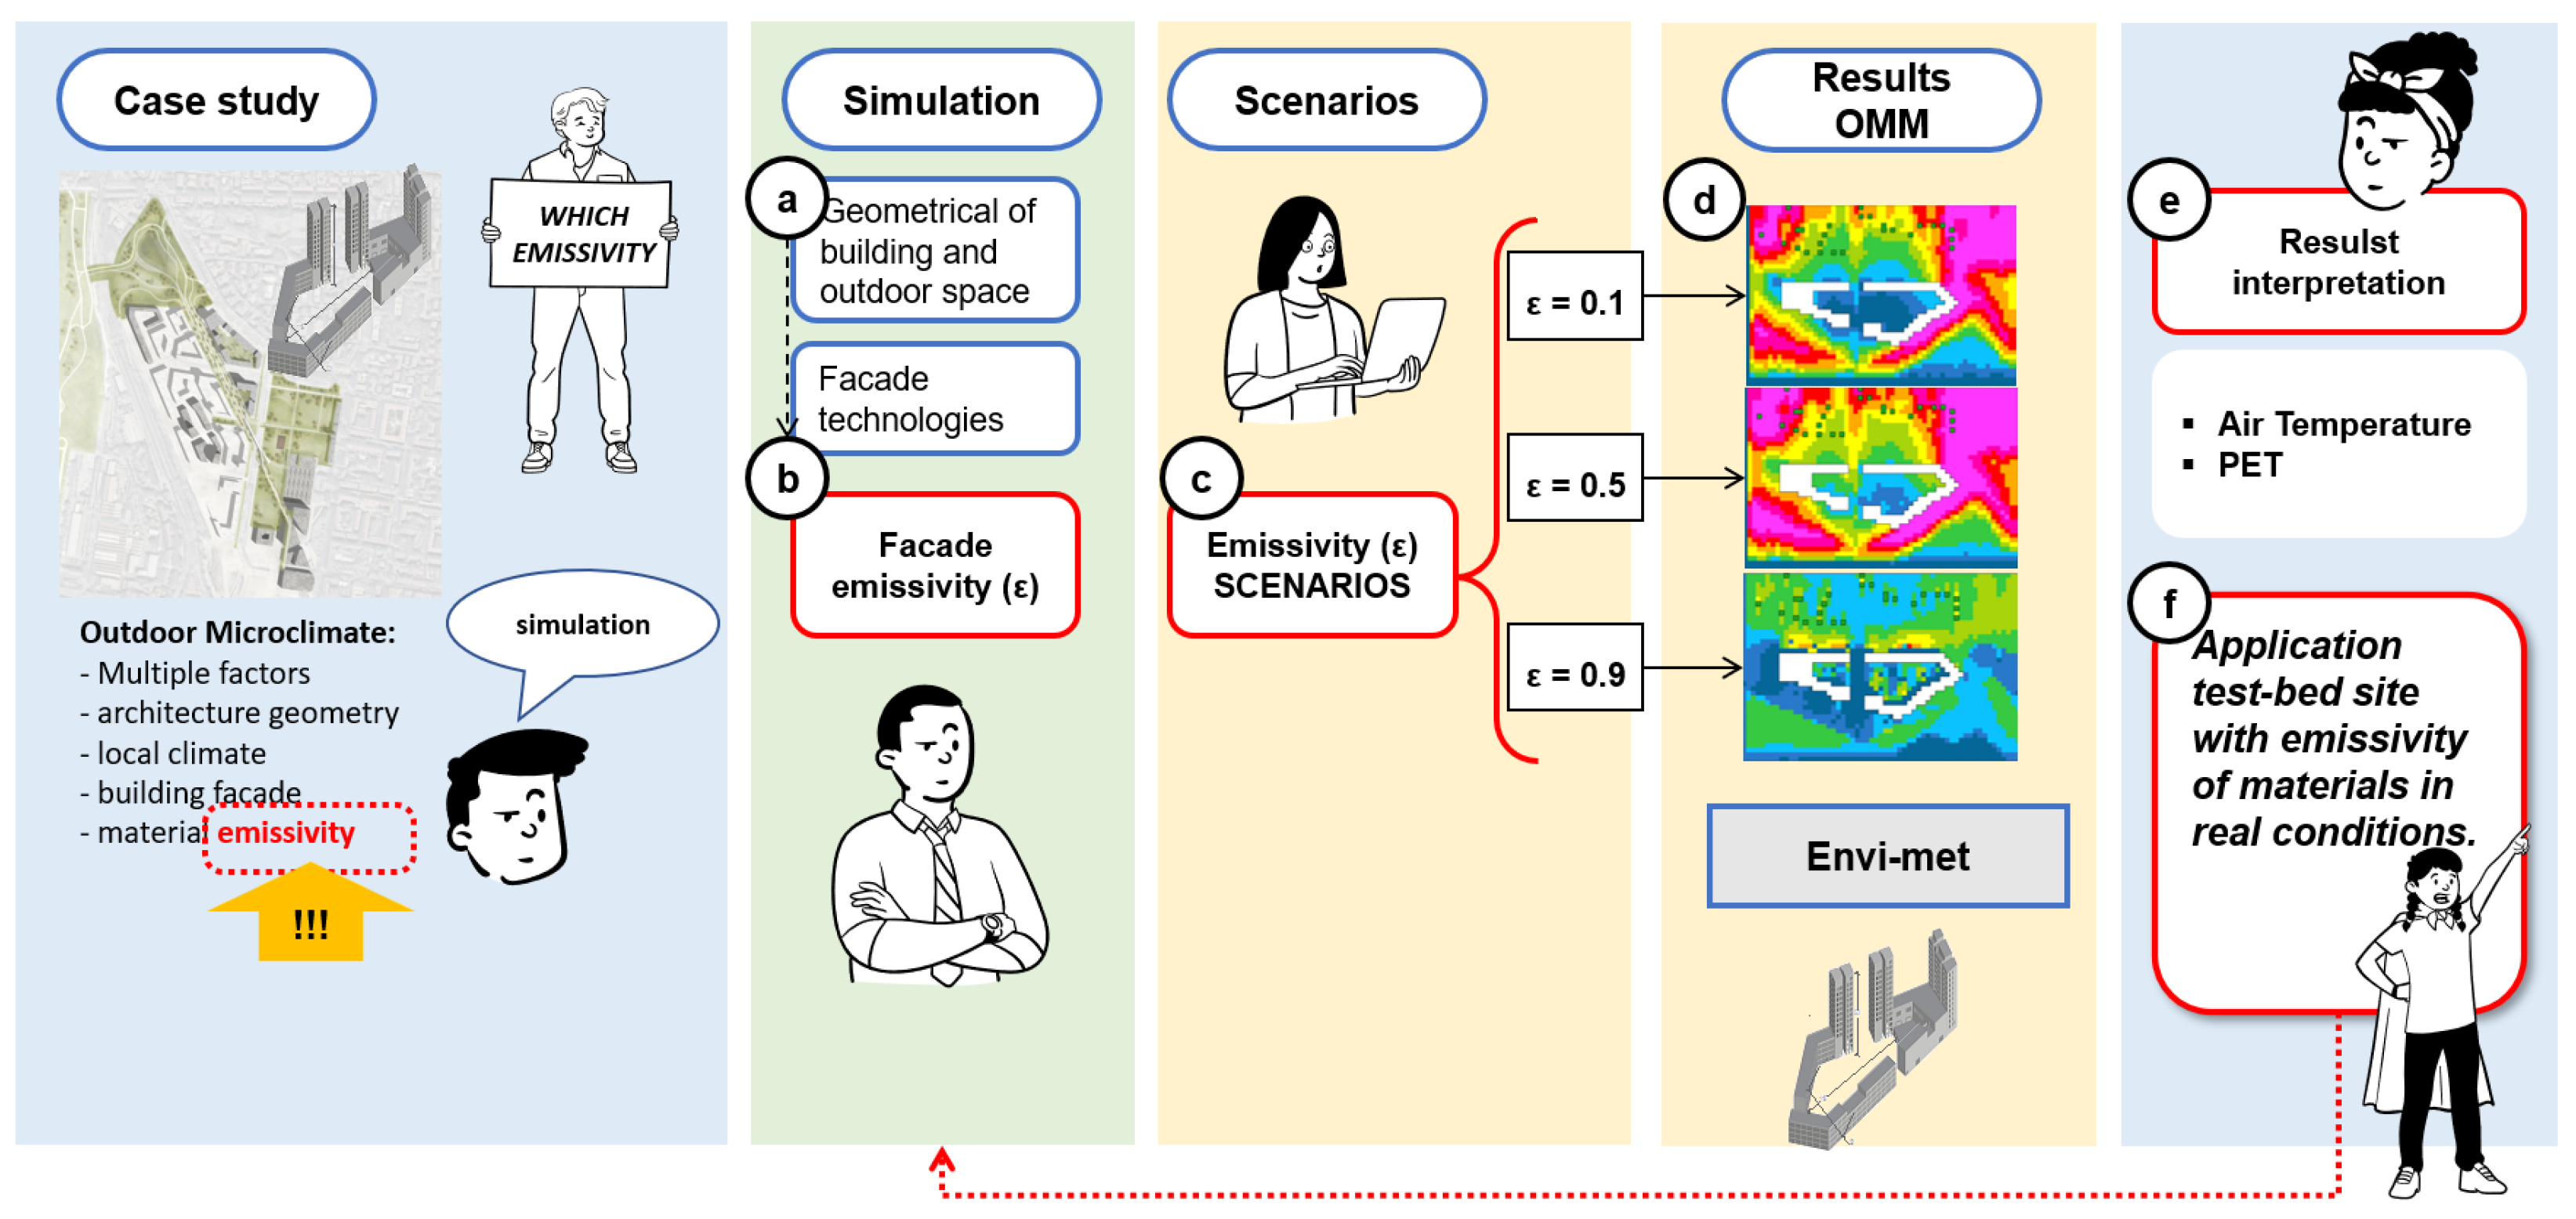
3.2. Operative Methodological Steps

Once the site was chosen, the proposed methodology proceeded according to the following steps, which are also graphically represented in Figure 1:
(a)
The collection of the geometrical characteristics of the urban fabric and of outdoor space;
(b)
The definition of the geometrical and technological characteristics of the façades and related emissivity;
(c)
The definition of alternative scenarios with different emissivity values according to pre-set theoretical levels;
(d)
The Envi-Met simulation of the different scenarios to obtain Outdoor Microclimate Maps (OMMs);
(e)
The interpretation and discussion of OMMs [71] and related outcomes;
(f)
The application of theoretically derived ranges to a test-bed site with the emissivity of materials in real conditions.
The study relied on some simulations adopting the software Envi-met, and the authors already addressed the request for laboratory or field measurements for calibration and validation purposes, which have been already discussed and provided in previous research stages and previously published in scientific journals, as well as being presented at international conferences [110,111,112,113]. As a consequence, the present study was based on the same assumptions and methods, which basically involve the calibration of the Envi-met model on a starting condition configuration (scenario 0) which is validated by comparing the setting with thermographic images gained with the use of drones [114] as well as data provided by the Regional Environmental Agency (ARPAER [115]) for the same site and location.
The paper evolves the outcomes and the lesson learned in the previous studies regarding the model validation and focuses on the elaboration and the visualization of the results to possibly deliver a speedy methodology that can be adopted by scientists and professionals without investing a huge amount of time and resources while improving their capacity to gain a critical reflection about design choices.
The overall workflow of the methodological steps listed above is graphically represented in Figure 4.
(a)
Collection of the geometrical characteristics of the urban fabric and of outdoor space
The proposed methodology required some basic information and data about the location to properly set the modeling and in particular the form, the geometrical layout, and the density of the urban fabric to appropriately define the outdoor spaces in-between the buildings. The height and configuration of the volumes were also relevant when correctly considering the influence of the façades’ surfaces as well as the size, the exposure, and the way they face one another. Local climate data input (temperature, relative humidity, and wind speed and direction) were collected from a weather station located in Bologna, 500 m away from the case study site, by ARPAER, the local climate agency, and made available for the purpose of this study following Envi-met data input instructions. Environmental data were gathered from the ARPAER [115] dataset and compared with the results of the Envi-met model, referring to the central point of the polygonal courtyard. Data processing and validation followed the statistical indexes of Guideline 14-2002 [116]. For the scope of the article, a specific location was chosen, but the process could be replicated with any other case study.
(b)
Definition of the geometrical and technological characteristics of the façades and related emissivity
The volumetric architectural configuration of the building, including its structural and technological key elements, was defined to properly consider the nature and the characteristics of the building envelope materials. In addition to conventional information regarding conductivity, density, specific heat, etc., the emissivity value was of particular interest for the definition of the external layer of the façade, as it influences the way the solar radiation is directly “reflected” back into the surroundings.
(c)
Definition of alternative scenarios with different emissivity values according to pre-set theoretical levels
In order to investigate the influence of the adoption of different materials on the outdoor spaces, a range of different options were explored, analyzed, and compared. After considering several materials (belonging to different families from metal sheets to ceramic forms, from GRC panels to glass, and from meshes to membranes) and the related emissivity values, the different options were grouped into three main sets—associated with three different emissivity values as summarized in Table 1—to perform the Envi-met simulations [117,118]. Three simulation scenarios related to 0.1, 0.5, and 0.9 emissivity values were performed to obtain the related OMM output. The goal was to compare how different materials and their respective emissivity values contribute to achieving the highest comfort level with reference to the local microclimate.
(d)
Envi-Met simulation of the different scenarios to obtain Outdoor Microclimate Maps (OMMs)
Simulations were performed using the software Envi-met, which is widely adopted within the scientific community to analyze the microclimate and the comfort conditions of different spaces, from buildings to squares or green areas [70,73,105,119,120]. The main investigated variables were temperature, humidity, air speed, and physiological equivalent temperature (PET) in a range between 4° and 41° C, as summarized in Table 2.
In order to properly compare the simulation outcomes, and particularly the effects of a specific design choice, a specific day of the year—namely the hottest day to consider the maximum thermal stress—was taken to set the simulation and evaluate the response according to the variations in the main investigated variable. With the support of the Leonardo module, the software provided some Outdoor Microclimate Maps (OMMs) as the main output, and particularly those related to the temperature and PET variations which are used to analyze the physiological stress of the human body depending on the microclimatic conditions. The OMMs were then compared to investigate (and easily display) the effects of using alternative materials in the same façade and context.
(e)
Interpretation and discussion of OMMs [71] and related outcomes
Comparing the OMMs [73], it was possible to clearly and easily display the different effects of alternative design options and to consequently address the overall strategy considering the related pros and cons. The maps offered clear images of the isolines defining the temperature or PET variations dependent on the selected scenario, thus directly and immediately showing the role of the chosen material emissivity through the related effect on the local microclimate.
(f)
Application of theoretically derived ranges to a test-bed site with emissivity of materials in real conditions.
Once this step was completed, a range of emissivity reference values was defined, and then, the material that best fit the optimal reference threshold according to the OMM outcomes was chosen.

4. Results

The simulations demonstrate that the adoption of materials with low emissivity (<0.1) leads to a reduction in the surrounding areas with temperatures above the maximum threshold of 41° compared to other alternative options where emissivity is over 0.1 with a consequent very unpleasant sensation of discomfort, as Table 2 highlights. Figure 5 and Figure 6, respectively, refer to air temperature and PET and represent the OMM output of scenario 1, where emissivity is equal to 0.1. The wide blue/cyan areas indicate temperatures lower than 28 °C in the courtyard, meaning an acceptable slightly warm microclimate, which might not be the most suitable condition—as it is at the border of the beginning of the stress scale—but certainly represents a more convenient condition compared to the surroundings or to the alternative scenarios. It must be noted that it is largely conditions below the 41° C temperature limit of heat stress which usually lead to high discomfort levels or to possible related pathologies.
Figure 7 and Figure 8, which refer to air temperature and PET, respectively, show how the adoption of an emissivity value equal to 0.5 in scenario 2 leads to an increase in temperature and PET in the courtyard, which the reduction in the blue area intensity in the OMMs makes clearly visible. The temperature is between 28 and 29 °C, which is still acceptable, though slightly discomfortable, with a moderate heat stress risk. However, the PET map shows that this small difference leads to some localized discomfort zones in the courtyard, which clearly make scenario 1 preferable.
Figure 9 and Figure 10 highlight how scenario 3 with an emissivity value equal to 0.9 leads to a significant increase in air temperature with a remarkable reduction in the blue area in the courtyard and the increase in wide green and light green zones at the edges, meaning a temperature above 29 °C, which can be considered the threshold of heat stress. Looking at the PET map, this becomes even more evident with spotted pink and red zones where the discomfort sensation becomes particularly relevant.
Considering the index of stress level associated with the thermal sensation reported in Table 2, it can be easily noted that scenario 3 presents very critical situations in some zones compared to the alternative scenarios, demonstrating the relevance of considering the role of emissivity and its importance during the design process and the building envelope conceptualization.
These effects must be considered during the daytime variations, and Figure 10 and Figure 11 show the air temperature and PET variations for each of the three scenarios which referred to a specific test day, namely 27 July 2019, the hottest day in 2019 (according to historic dataset), at 12 o’clock.
Figure 11 and Figure 12, respectively, report the temperature and PET values, expressed in °C, on the x-axis and the frequency of distribution incidence in the OMM on the y-axis.
Figure 11 refers to air temperature considering the three emissivity values 0.1, 0.5, and 0.9, showing that in the case of 0.1 (blue line), the frequency of temperatures under 28 °C is increased compared to the other two options (green and red lines), as evidenced by the green area of the graph. On the other hand, in the simulation with emissivity equal to 0.1, a higher frequency of temperature values higher than 29 °C is shown. In the case of emissivity equal to 0.5 or 0.9, the percentage of the surface of the OMM with temperatures between 29 °C and 30 °C is lower than 4%, while in the case of emissivity equal to 0.1, these surfaces represent more than 4% of the OMM (blue area and red arrow). Furthermore, the entire area with emissivity of 0.1 has a higher frequency than values between 30 °C and 31 °C (blue area).
Accordingly, Figure 12 reports the analysis of the frequency regarding PET distribution values, expressed in °C, within the investigated area. In this case, the PET values are between 40 °C and 45 °C. It can be noted that with an emissivity of 0.1, the frequency distribution shows some areas below 40 °C (blue area), while in the other two simulations, the distribution is more concentrated between 40 °C and 45 °C. On the other hand, the simulation with an emissivity of 0.9 shows that 16% of the areas have a PET value of 45 °C.
Comparing the frequency of distribution in the OMM allows one to make more conscious decisions about emissivity values that clearly influence the air temperature and the PET distribution in different ways: air temperature is higher with emissivity of 0.1, while PET is higher with emissivity of 0.9. It can be noted that the outdoor microclimate is much more influenced by the mean radiant temperature and by the energy exchange rather than by the air temperature. In other words, direct or indirect solar radiation negatively influences the outdoor microclimatic comfort.
The performed simulation demonstrated the relation between the emissivity of materials and outdoor microclimate. OMMs and graphs show that the emissivity due to the choice of façade materials may influence temperature distribution, and the case study demonstrated that the adoption of a low-emissivity material in the building skin facing the inner courtyard can improve the outdoor microclimatic comfort.

5. Discussion

The study reported in this paper is a follow up of a more articulated research activity regarding the evaluation of design choices in climate-responsive building shells (adaptive façades) developed by K. Fabbri and J. Gaspari. The research aimed to bridge the gap between the knowledge gained in specialized scientific studies and the application of their outcomes at the design level in the real market. The authors believe that a simplified approach can be adopted at the early stage to better address design choices while saving time and resources, which are key and determinant factors in ordinary professional activities. Other studies have shown that returning to simplified methods improves the chance that more refined and advanced concepts of sustainable design are embedded from the very beginning in the design practice.
This indicated the need to explore alternative methods for dynamic simulations, which still represent the most reliable way to gain a detailed response regarding the performance of each design solution but are also far from being adopted during the preliminary design phase—where several alternative configurations can be explored—due to their cost in terms of time, resources, and competencies. Thus, the ambition of this study was not to replace a consolidated and detailed approach with another less costly one, but to provide a simplified method to anticipate the time for a critical reflection, enabling one to compare alternative options and related effects at an earlier stage. This can speed up the process, focusing on the most promising alternatives, which can be then investigated according to traditional detailed methods and can point flowchart scientists and designers toward more conscious design decisions by considering outdoor microclimate a priority.
The spatial representation of the microclimatic conditions is a useful tool to understand and address the effects of technological solutions to be evaluated and adopted at the design stage. The proposed methodology can be replicated at an early design phase in any other context to investigate a wide range of possible building envelope materials, especially if the H/V ratio is similar to the proposed case study (which reflects quite recurrent conditions in contemporary cities) to obtain a quite reliable overview of the impacts and effects of design decisions on the overall site.
However, some limitations must be taken into account:
(a)
The process considers a single case study, and the results are influenced by its geometrical configuration. A further step could be to keep a fixed emissivity level for the building skin (a low-emissivity one) and then explore how geometrical variations in the configuration in the H/V ratio may influence the outdoor microclimate by comparing the related OMMs.
(b)
The study defines three reference emissivity values to collect a wide range of materials into three main families, and more detailed results could be obtained in the future by investigating the behavior of different materials using their own real emissivity value.
Additionally, other variables could be considered in the future (i.e., density, conductivity, etc.) to also investigate the effects on indoor quality at the same time. The more we work on trying to reduce energy demand to ensure optimal living standards, the more we will need to consider the interrelated effects of design choices.

6. Conclusions

This study represents a fragment of a broader debate on the roles and impacts that buildings and cities may have within climate-change-related phenomena, such as air temperature increase, urban heat island, energy increase to cooling buildings, precipitation increase, etc., which are strictly related to the characteristics the building envelope must own and to key decisions about materials and technologies to be adopted from the very early design stage. The proposed methodology allows one to point designers in the direction of more appropriate façade material choices, focusing on a thermophysical characteristic: the emissivity value, which is supposed to influence the outdoor microclimate. Once the emissivity value—which is typically related to the intrinsic features of materials—is investigated and finally chosen, it is then possible to focus on the other requirements such as thermal insulation, technologies, aesthetic value, etc., usually considered during the design process.
Further related topics to this study for future development deal with:
-
The relationship between the geometry of outdoor spaces, the emissivity of materials, and outdoor comfort;
-
The effects of the emissivity values on the indoor comfort of buildings and on the deriving energy demand for heating or cooling;
-
The characteristics of building materials with relation to the emissivity value and other parameters to reduce the effects of solar radiation.
The outcomes of this study are relevant not only during the design stage of new buildings but also when addressing the renovation options for existing ones. Additionally, considering the complexity of building initiatives, the number of involved stakeholders, the financial dynamics, the specific characteristics of the site, the architectural ambitions, the construction and engineering requirements, it might be very helpful to have benchmark values or “sentinel thresholds” to monitor, without time- and resource-consuming actions, the directions the design choices are taking with reference to their potential effects on the local microclimate.

Author Contributions

Conceptualization, K.F. and J.G.; methodology, K.F. and J.G.; software, K.F., A.C., S.P.; formal analysis, K.F., A.C., S.P.; investigation, J.G., A.C., S.P.; writing—original draft preparation, A.C., S.P.; writing—review and editing, K.F. and J.G.; project administration, J.G. All authors have read and agreed to the published version of the manuscript.

Funding

This research received no external funding.

Institutional Review Board Statement

Not applicable.

Informed Consent Statement

Not applicable.

Data Availability Statement

Not applicable.

Conflicts of Interest

The authors declare no conflict of interest.

References

  1. Wellmann, T.; Schug, F.; Haase, D.; Pflugmacher, D.; van der Linden, S. Green Growth? On the Relation between Population Density, Land Use and Vegetation Cover Fractions in a City Using a 30-Years Landsat Time Series. Landsc. Urban Plan. 2020, 202, 103857. [Google Scholar] [CrossRef]
  2. Wu, J.; Li, R.; Ding, R.; Li, T.; Sun, H. City Expansion Model Based on Population Diffusion and Road Growth. Appl. Math. Model. 2017, 43, 1–14. [Google Scholar] [CrossRef]
  3. Hájková, V.; Hájek, P. Efficiency of Knowledge Bases in Urban Population and Economic Growth—Evidence from European Cities. Cities 2014, 40, 11–22. [Google Scholar] [CrossRef]
  4. Klein, T.; Anderegg, W.R.L. A Vast Increase in Heat Exposure in the 21st Century Is Driven by Global Warming and Urban Population Growth. Sustain. Cities Soc. 2021, 73, 103098. [Google Scholar] [CrossRef]
  5. Ward, K.; Lauf, S.; Kleinschmit, B.; Endlicher, W. Heat Waves and Urban Heat Islands in Europe: A Review of Relevant Drivers. Sci. Total Environ. 2016, 569–570, 527–539. [Google Scholar] [CrossRef]
  6. European Commission. Green Paper. A 2030 Framework for Climate and Energy Policies; European Commission: Brussels, Belgium, 2013. [Google Scholar]
  7. European Commission. A Policy Framwork for Climate and Energy in the Periodo from 2020 to 2030; European Commission: Brussels, Belgium, 2014. [Google Scholar]
  8. Rogelj, J.; Shindell, D.; Jiang, K.; Fifita, S.; Forster, P.; Ginzburg, V.; Handa, C.; Kheshgi, H.; Kobayashi, S.; Kriegler, E.; et al. Mitigation Pathways Compatible with 1.5 °C in the Context of Sustainable Development. In Global Warming of 1.5 °C. An IPCC Special Report on the Impacts of Global Warming of 1.5 °C above Pre-Industrial Levels and Related Global Greenhouse Gas Emission Pathw; IPCC special report Global Warming of 1.5 °C; Intergovernmental Panel on Climate Change: Geneva, Switzerland, 2018; p. 82. [Google Scholar]
  9. Abusaada, H.; Elshater, A. Effect of People on Placemaking and Affective Atmospheres in City Streets. Ain Shams Eng. J. 2021, 12, 3389–3403. [Google Scholar] [CrossRef]
  10. Lau, K.K.-L.; Choi, C.Y. The Influence of Perceived Aesthetic and Acoustic Quality on Outdoor Thermal Comfort in Urban Environment. Build. Environ. 2021, 206, 108333. [Google Scholar] [CrossRef]
  11. El-Darwish, I.I. Enhancing Outdoor Campus Design by Utilizing Space Syntax Theory for Social Interaction Locations. Ain Shams Eng. J. 2022, 13, 101524. [Google Scholar] [CrossRef]
  12. Xie, Y.; Wang, X.; Wen, J.; Geng, Y.; Yan, L.; Liu, S.; Zhang, D.; Lin, B. Experimental Study and Theoretical Discussion of Dynamic Outdoor Thermal Comfort in Walking Spaces: Effect of Short-Term Thermal History. Build. Environ. 2022, 216, 109039. [Google Scholar] [CrossRef]
  13. Miao, C.; Yu, S.; Zhang, Y.; Hu, Y.; He, X.; Chen, W. Assessing Outdoor Air Quality Vertically in an Urban Street Canyon and Its Response to Microclimatic Factors. J. Environ. Sci. 2023, 124, 923–932. [Google Scholar] [CrossRef]
  14. Zheng, X.; Montazeri, H.; Blocken, B. Impact of Building Façade Geometrical Details on Pollutant Dispersion in Street Canyons. Build. Environ. 2022, 212, 108746. [Google Scholar] [CrossRef]
  15. McMullan, W.A.; Angelino, M. The Effect of Tree Planting on Traffic Pollutant Dispersion in an Urban Street Canyon Using Large Eddy Simulation with a Recycling and Rescaling Inflow Generation Method. J. Wind. Eng. Ind. Aerodyn. 2022, 221, 104877. [Google Scholar] [CrossRef]
  16. Li, Z.; Zhang, H.; Juan, Y.-H.; Wen, C.-Y.; Yang, A.-S. Effects of Building Setback on Thermal Comfort and Air Quality in the Street Canyon. Build. Environ. 2022, 208, 108627. [Google Scholar] [CrossRef]
  17. Fan, X.; Zhang, X.; Weerasuriya, A.U.; Hang, J.; Zeng, L.; Luo, Q.; Li, C.Y.; Chen, Z. Numerical Investigation of the Effects of Environmental Conditions, Droplet Size, and Social Distancing on Droplet Transmission in a Street Canyon. Build. Environ. 2022, 221, 109261. [Google Scholar] [CrossRef]
  18. Nosek, Š.; Kluková, Z.; Jakubcová, M.; Jaňour, Z. The Effect of Courtyard Buildings on the Ventilation of Street Canyons: A Wind-Tunnel Study. J. Wind. Eng. Ind. Aerodyn. 2022, 220, 104885. [Google Scholar] [CrossRef]
  19. Kim, S.W.; Brown, R.D. Urban Heat Island (UHI) Intensity and Magnitude Estimations: A Systematic Literature Review. Sci. Total Environ. 2021, 779, 146389. [Google Scholar] [CrossRef]
  20. Equere, V.; Mirzaei, P.A.; Riffat, S. Definition of a New Morphological Parameter to Improve Prediction of Urban Heat Island. Sustain. Cities Soc. 2020, 56, 102021. [Google Scholar] [CrossRef]
  21. Stuhlmacher, M.; Georgescu, M.; Turner, B.L.; Hu, Y.; Goldblatt, R.; Gupta, S.; Frazier, A.E.; Kim, Y.; Balling, R.C.; Clinton, N. Are Global Cities Homogenizing? An Assessment of Urban Form and Heat Island Implications. Cities 2022, 126, 103705. [Google Scholar] [CrossRef]
  22. Wang, Z.-H. Reconceptualizing Urban Heat Island: Beyond the Urban-Rural Dichotomy. Sustain. Cities Soc. 2022, 77, 103581. [Google Scholar] [CrossRef]
  23. United States Environmental Protection Agency. Reducing Urban Heat Islands: Compendium of Strategies (Report); U.S. Environmental Protection Agency: Washington, DC, USA, 2008; Volumes 7–12.
  24. Santamouris, M. (Ed.) Energy and Climate in the Urban Built Environment; Routledge: London, UK, 2013; ISBN 9781134257904. [Google Scholar]
  25. Zhou, B.; Rybski, D.; Kropp, J.P. On the Statistics of Urban Heat Island Intensity. Geophys. Res. Lett. 2013, 40, 5486–5491. [Google Scholar] [CrossRef]
  26. Faragallah, R.N.; Ragheb, R.A. Evaluation of Thermal Comfort and Urban Heat Island through Cool Paving Materials Using ENVI-Met. Ain Shams Eng. J. 2022, 13, 101609. [Google Scholar] [CrossRef]
  27. Marcel, C.; Villot, J. Urban Heat Island Index Based on a Simplified Micro Scale Model. Urban Clim. 2021, 39, 100922. [Google Scholar] [CrossRef]
  28. Manavvi, S.; Rajasekar, E. Evaluating Outdoor Thermal Comfort in Urban Open Spaces in a Humid Subtropical Climate: Chandigarh, India. Build. Environ. 2022, 209, 108659. [Google Scholar] [CrossRef]
  29. Mentaschi, L.; Duveiller, G.; Zulian, G.; Corbane, C.; Pesaresi, M.; Maes, J.; Stocchino, A.; Feyen, L. Global Long-Term Mapping of Surface Temperature Shows Intensified Intra-City Urban Heat Island Extremes. Glob. Environ. Chang. 2022, 72, 102441. [Google Scholar] [CrossRef]
  30. Wang, C.; Ren, Z.; Dong, Y.; Zhang, P.; Guo, Y.; Wang, W.; Bao, G. Efficient Cooling of Cities at Global Scale Using Urban Green Space to Mitigate Urban Heat Island Effects in Different Climatic Regions. Urban For. Urban Green. 2022, 74, 127635. [Google Scholar] [CrossRef]
  31. Abbassi, Y.; Ahmadikia, H.; Baniasadi, E. Impact of Wind Speed on Urban Heat and Pollution Islands. Urban Clim. 2022, 44, 101200. [Google Scholar] [CrossRef]
  32. Epting, J.; Huggenberger, P. Unraveling the Heat Island Effect Observed in Urban Groundwater Bodies—Definition of a Potential Natural State. J. Hydrol. 2013, 501, 193–204. [Google Scholar] [CrossRef]
  33. Salata, F.; Falasca, S.; Ciancio, V.; Curci, G.; Grignaffini, S.; de Wilde, P. Estimating Building Cooling Energy Demand through the Cooling Degree Hours in a Changing Climate: A Modeling Study. Sustain. Cities Soc. 2022, 76, 103518. [Google Scholar] [CrossRef]
  34. Huang, K.-T.; Li, Y.-J. Impact of Street Canyon Typology on Building’s Peak Cooling Energy Demand: A Parametric Analysis Using Orthogonal Experiment. Energy Build. 2017, 154, 448–464. [Google Scholar] [CrossRef]
  35. Santamouris, M. Cooling the Cities—A Review of Reflective and Green Roof Mitigation Technologies to Fight Heat Island and Improve Comfort in Urban Environments. Sol. Energy 2014, 103, 682–703. [Google Scholar] [CrossRef]
  36. Lontorfos, V.; Efthymiou, C.; Santamouris, M. On the Time Varying Mitigation Performance of Reflective Geoengineering Technologies in Cities. Renew. Energy 2018, 115, 926–930. [Google Scholar] [CrossRef]
  37. Marando, F.; Heris, M.P.; Zulian, G.; Udías, A.; Mentaschi, L.; Chrysoulakis, N.; Parastatidis, D.; Maes, J. Urban Heat Island Mitigation by Green Infrastructure in European Functional Urban Areas. Sustain. Cities Soc. 2022, 77, 103564. [Google Scholar] [CrossRef]
  38. Yumino, S.; Uchida, T.; Sasaki, K.; Kobayashi, H.; Mochida, A. Total Assessment for Various Environmentally Conscious Techniques from Three Perspectives: Mitigation of Global Warming, Mitigation of UHIs, and Adaptation to Urban Warming. Sustain. Cities Soc. 2015, 19, 236–249. [Google Scholar] [CrossRef]
  39. Xu, C.; Chen, G.; Huang, Q.; Su, M.; Rong, Q.; Yue, W.; Haase, D. Can Improving the Spatial Equity of Urban Green Space Mitigate the Effect of Urban Heat Islands? An Empirical Study. Sci. Total Environ. 2022, 841, 156687. [Google Scholar] [CrossRef]
  40. Hou, H.; Su, H.; Liu, K.; Li, X.; Chen, S.; Wang, W.; Lin, J. Driving Forces of UHI Changes in China’s Major Cities from the Perspective of Land Surface Energy Balance. Sci. Total Environ. 2022, 829, 154710. [Google Scholar] [CrossRef]
  41. Costanzo, V.; Evola, G.; Marletta, L. Energy Savings in Buildings or UHI Mitigation? Comparison between Green Roofs and Cool Roofs. Energy Build. 2016, 114, 247–255. [Google Scholar] [CrossRef]
  42. Wang, X.; Li, H.; Sodoudi, S. The Effectiveness of Cool and Green Roofs in Mitigating Urban Heat Island and Improving Human Thermal Comfort. Build. Environ. 2022, 217, 109082. [Google Scholar] [CrossRef]
  43. He, B.-J. Towards the next Generation of Green Building for Urban Heat Island Mitigation: Zero UHI Impact Building. Sustain. Cities Soc. 2019, 50, 101647. [Google Scholar] [CrossRef]
  44. Yuan, J.; Masuko, S.; Shimazaki, Y.; Yamanaka, T.; Kobayashi, T. Evaluation of Outdoor Thermal Comfort under Different Building External-Wall-Surface with Different Reflective Directional Properties Using CFD Analysis and Model Experiment. Build. Environ. 2022, 207, 108478. [Google Scholar] [CrossRef]
  45. Akbari, H.; Touchaei, A.G. Modeling and Labeling Heterogeneous Directional Reflective Roofing Materials. Sol. Energy Mater. Sol. Cell. 2014, 124, 192–210. [Google Scholar] [CrossRef]
  46. Doulos, L.; Santamouris, M.; Livada, I. Passive Cooling of Outdoor Urban Spaces. The Role of Materials. Sol. Energy 2004, 77, 231–249. [Google Scholar] [CrossRef]
  47. Cozza, E.S.; Alloisio, M.; Comite, A.; di Tanna, G.; Vicini, S. NIR-Reflecting Properties of New Paints for Energy-Efficient Buildings. Sol. Energy 2015, 116, 108–116. [Google Scholar] [CrossRef]
  48. Bretz, S.E.; Akbari, H. Long-Term Performance of High-Albedo Roof Coatings. Energy Build. 1997, 25, 159–167. [Google Scholar] [CrossRef] [Green Version]
  49. Morini, E.; Castellani, B.; de Ciantis, S.; Anderini, E.; Rossi, F. Planning for Cooler Urban Canyons: Comparative Analysis of the Influence of Façades Reflective Properties on Urban Canyon Thermal Behavior. Sol. Energy 2018, 162, 14–27. [Google Scholar] [CrossRef]
  50. Castaldo, V.L.; Rosso, F.; Golasi, I.; Piselli, C.; Salata, F.; Pisello, A.L.; Ferrero, M.; Cotana, F.; de Lieto Vollaro, A. Thermal Comfort in the Historical Urban Canyon: The Effect of Innovative Materials. Energy Procedia 2017, 134, 151–160. [Google Scholar] [CrossRef]
  51. Naboni, E.; Milella, A.; Vadalà, R.; Fiorito, F. On the Localised Climate Change Mitigation Potential of Building Facades. Energy Build. 2020, 224, 110284. [Google Scholar] [CrossRef]
  52. Qin, Y.; Liang, J.; Tan, K.; Li, F. A Side by Side Comparison of the Cooling Effect of Building Blocks with Retro-Reflective and Diffuse-Reflective Walls. Sol. Energy 2016, 133, 172–179. [Google Scholar] [CrossRef]
  53. Rossi, F.; Castellani, B.; Presciutti, A.; Morini, E.; Filipponi, M.; Nicolini, A.; Santamouris, M. Retroreflective Façades for Urban Heat Island Mitigation: Experimental Investigation and Energy Evaluations. Appl. Energy 2015, 145, 8–20. [Google Scholar] [CrossRef]
  54. Yuan, J.; Emura, K.; Sakai, H.; Farnham, C.; Lu, S. Optical Analysis of Glass Bead Retro-Reflective Materials for Urban Heat Island Mitigation. Sol. Energy 2016, 132, 203–213. [Google Scholar] [CrossRef]
  55. Levinson, R.; Chen, S.; Slack, J.; Goudey, H.; Harima, T.; Berdahl, P. Design, Characterization, and Fabrication of Solar-Retroreflective Cool-Wall Materials. Sol. Energy Mater. Sol. Cell. 2020, 206, 110117. [Google Scholar] [CrossRef]
  56. Castellani, B.; Morini, E.; Anderini, E.; Filipponi, M.; Rossi, F. Development and Characterization of Retro-Reflective Colored Tiles for Advanced Building Skins. Energy Build. 2017, 154, 513–522. [Google Scholar] [CrossRef]
  57. Zinzi, M. Characterisation and Assessment of near Infrared Reflective Paintings for Building Facade Applications. Energy Build. 2016, 114, 206–213. [Google Scholar] [CrossRef]
  58. Chen, H.Y.; Chen, C. Determining the Emissivity and Temperature of Building Materials by Infrared Thermometer. Constr. Build. Mater. 2016, 126, 130–137. [Google Scholar] [CrossRef]
  59. Marino, C.; Minichiello, F.; Bahnfleth, W. The Influence of Surface Finishes on the Energy Demand of HVAC Systems for Existing Buildings. Energy Build. 2015, 95, 70–79. [Google Scholar] [CrossRef]
  60. Malz, S.; Steininger, P.; Dawoud, B.; Krenkel, W.; Steffens, O. On the Development of a Building Insulation Using Air Layers with Highly Reflective Interfaces. Energy Build. 2021, 236, 110779. [Google Scholar] [CrossRef]
  61. Quevedo, T.C.; Melo, A.P.; Lamberts, R. Assessing Cooling Loads from Roofs with Attics: Modeling versus Field Experiments. Energy Build. 2022, 262, 112003. [Google Scholar] [CrossRef]
  62. Qin, Y.; He, Y.; Wu, B.; Ma, S.; Zhang, X. Regulating Top Albedo and Bottom Emissivity of Concrete Roof Tiles for Reducing Building Heat Gains. Energy Build. 2017, 156, 218–224. [Google Scholar] [CrossRef]
  63. Yang, X.; Zhao, L.; Bruse, M.; Meng, Q. Evaluation of a Microclimate Model for Predicting the Thermal Behavior of Different Ground Surfaces. Build. Environ. 2013, 60, 93–104. [Google Scholar] [CrossRef]
  64. Ketterer, C.; Matzarakis, A. Human-Biometeorological Assessment of the Urban Heat Island in a City with Complex Topography—The Case of Stuttgart, Germany. Urban Clim. 2014, 10, 573–584. [Google Scholar] [CrossRef]
  65. Givoni, B.; Noguchi, M.; Saaroni, H.; Pochter, O.; Yaacov, Y.; Feller, N.; Becker, S. Outdoor Comfort Research Issues. Energy Build. 2003, 35, 77–86. [Google Scholar] [CrossRef]
  66. Stavrakakis, G.M.; Tzanaki, E.; Genetzaki, V.I.; Anagnostakis, G.; Galetakis, G.; Grigorakis, E. A Computational Methodology for Effective Bioclimatic-Design Applications in the Urban Environment. Sustain. Cities Soc. 2012, 4, 41–57. [Google Scholar] [CrossRef] [Green Version]
  67. Rodríguez-Algeciras, J.; Tablada, A.; Chaos-Yeras, M.; de la Paz, G.; Matzarakis, A. Influence of Aspect Ratio and Orientation on Large Courtyard Thermal Conditions in the Historical Centre of Camagüey-Cuba. Renew. Energy 2018, 125, 840–856. [Google Scholar] [CrossRef]
  68. Andreou, E. The Effect of Urban Layout, Street Geometry and Orientation on Shading Conditions in Urban Canyons in the Mediterranean. Renew. Energy 2014, 63, 587–596. [Google Scholar] [CrossRef]
  69. Jamei, E.; Rajagopalan, P.; Seyedmahmoudian, M.; Jamei, Y. Review on the Impact of Urban Geometry and Pedestrian Level Greening on Outdoor Thermal Comfort. Renew. Sustain. Energy Rev. 2016, 54, 1002–1017. [Google Scholar] [CrossRef]
  70. Fabbri, K.; di Nunzio, A.; Antonini, E.; Boeri, A. Outdoor Comfort: The ENVI-BUG Tool to Evaluate PMV Values Point by Point. In Building Simulation Aplicationts BSA 2015, Proceedings of the 2nd IBPSA-Italy conference, Bolzano, Italy, 4–6 February 2015; Baratieri, M., Corrado, V., Gasparella, A., Patuzzi, F., Eds.; Bolzano University Prees: Bolzano, Italy, 2015; pp. 17–21. [Google Scholar]
  71. Gaspari, J.; Fabbri, K. A Study on the Use of Outdoor Microclimate Map to Address Design Solutions for Urban Regeneration. In Energy Procedia, Proceedings of the 8th International Conference on Sustainability in Energy and Buildings, SEB-16, Turin, Italy, 11–13 September 2016; Elsevier: Amsterdam, The Netherlands, 2017; Volume 111. [Google Scholar]
  72. Fang, Z.; Feng, X.; Lin, Z. Investigation of PMV Model for Evaluation of the Outdoor Thermal Comfort. In Procedia Engineering, Proceedings of the 10th International Symposium on Heating, Ventilation and Air Conditioning, ISHVAC 2017, Jinan, China, 19–22 October 2017; Elsevier, Ltd.: Amsterdam, The Netherlands, 2017; Volume 205, pp. 2457–2462. [Google Scholar]
  73. Gaspari, J.; Fabbri, K.; Lucchi, M. The Use of Outdoor Microclimate Analysis to Support Decision Making Process: Case Study of Bufalini Square in Cesena. Sustain. Cities Soc. 2018, 42, 206–215. [Google Scholar] [CrossRef]
  74. Fanger, P.O. Thermal Comfort. Analysis and Applications in Environmental Engineering; Danish Technical Press: Copenhagen, Denmark, 1970; ISBN 9780070199156. [Google Scholar]
  75. ISO 7730; Ergonomics of the Thermal Environment—Analytical Determination and Interpretation of Thermal Comfort Using Calculation of the PMV and PPD Indices and Local Thermal Comfort Criteria. ISO: Geneva, Switzerland, 2005.
  76. ASHRAE 55; Thermal Environmental Conditions for Human Occupancy. ASHRAE: Atlanta, GA, USA, 2010.
  77. Mayer, H.; Höppe, P. Thermal Comfort of Man in Different Urban Environments. Theor. Appl. Climatol. 1987, 38, 43–49. [Google Scholar] [CrossRef]
  78. Höppe, P. The Physiological Equivalent Temperature—A Universal Index for the Biometeorological Assessment of the Thermal Environment. Int. J. Biometeorol. 1999, 43, 71–75. [Google Scholar] [CrossRef]
  79. Matzarakis, A.; Mayer, H.; Iziomon, M.G. Applications of a Universal Thermal Index: Physiological Equivalent Temperature. Int. J. Biometeorol. 1999, 43, 76–84. [Google Scholar] [CrossRef]
  80. Matzarakis, A.; Mayer, H. Heat Stress in Greece. Int. J. Biometeorol. 1997, 41, 34–39. [Google Scholar] [CrossRef]
  81. Cohen, P.; Potchter, O.; Matzarakis, A. Daily and Seasonal Climatic Conditions of Green Urban Open Spaces in the Mediterranean Climate and Their Impact on Human Comfort. Build. Environ. 2012, 51, 285–295. [Google Scholar] [CrossRef]
  82. de Abreu-Harbich, L.V.; Labaki, L.C.; Matzarakis, A. Effect of Tree Planting Design and Tree Species on Human Thermal Comfort in the Tropics. Landsc. Urban Plan. 2015, 138, 90–109. [Google Scholar] [CrossRef]
  83. Martinelli, L.; Lin, T.P.; Matzarakis, A. Assessment of the Influence of Daily Shadings Pattern on Human Thermal Comfort and Attendance in Rome during Summer Period. Build. Environ. 2015, 92, 30–38. [Google Scholar] [CrossRef]
  84. Algeciras, J.A.R.; Consuegra, L.G.; Matzarakis, A. Spatial-Temporal Study on the Effects of Urban Street Configurations on Human Thermal Comfort in the World Heritage City of Camagüey-Cuba. Build. Environ. 2016, 101, 85–101. [Google Scholar] [CrossRef]
  85. Chatzidimitriou, A.; Yannas, S. Street Canyon Design and Improvement Potential for Urban Open Spaces; the Influence of Canyon Aspect Ratio and Orientation on Microclimate and Outdoor Comfort. Sustain. Cities Soc. 2017, 33, 85–101. [Google Scholar] [CrossRef]
  86. Lin, T.P.; Chen, Y.C.; Matzarakis, A. Urban Thermal Stress Climatic Mapping: Combination of Long-Term Climate Data and Thermal Stress Risk Evaluation. Sustain. Cities Soc. 2017, 34, 12–21. [Google Scholar] [CrossRef]
  87. Nouri, A.S.; Costa, J.P. Addressing Thermophysiological Thresholds and Psychological Aspects during Hot and Dry Mediterranean Summers through Public Space Design: The Case of Rossio. Build. Environ. 2017, 118, 67–90. [Google Scholar] [CrossRef]
  88. Nouri, A.S.; Costa, J.P.; Santamouris, M.; Matzarakis, A. Approaches to Outdoor Thermal Comfort Thresholds through Public Space Design: A Review. Atmosphere 2018, 9, 108. [Google Scholar] [CrossRef] [Green Version]
  89. Staiger, H.; Laschewski, G.; Matzarakis, A. Selection of Appropriate Thermal Indices for Applications in Human Biometeorological Studies. Atmosphere 2019, 10, 18. [Google Scholar] [CrossRef] [Green Version]
  90. Shashua-Bar, L.; Pearlmutter, D.; Erell, E. The Influence of Trees and Grass on Outdoor Thermal Comfort in a Hot-Arid Environment. Int. J. Climatol. 2011, 31, 1498–1506. [Google Scholar] [CrossRef]
  91. Wang, Z.-H.; Zhao, X.; Yang, J.; Song, J. Cooling and Energy Saving Potentials of Shade Trees and Urban Lawns in a Desert City. Appl. Energy 2016, 161, 437–444. [Google Scholar] [CrossRef]
  92. Hendel, M.; Gutierrez, P.; Colombert, M.; Diab, Y.; Royon, L. Measuring the Effects of Urban Heat Island Mitigation Techniques in the Field: Application to the Case of Pavement-Watering in Paris. Urban Clim. 2016, 16, 43–58. [Google Scholar] [CrossRef]
  93. Johansson, E.; Thorsson, S.; Emmanuel, R.; Krüger, E. Instruments and Methods in Outdoor Thermal Comfort Studies—The Need for Standardization. Urban Clim. 2014, 10, 346–366. [Google Scholar] [CrossRef] [Green Version]
  94. Taleghani, M.; Kleerekoper, L.; Tenpierik, M.; van den Dobbelsteen, A. Outdoor Thermal Comfort within Five Different Urban Forms in the Netherlands. Build. Environ. 2015, 83, 65–78. [Google Scholar] [CrossRef]
  95. Forouzandeh, A. Numerical Modeling Validation for the Microclimate Thermal Condition of Semi-Closed Courtyard Spaces between Buildings. Sustain. Cities Soc. 2018, 36, 327–345. [Google Scholar] [CrossRef]
  96. Envi-Met. Available online: www.Envi-Met.com (accessed on 2 November 2022).
  97. Sinsel, T.; Simon, H.; Broadbent, A.M.; Bruse, M.; Heusinger, J. Modeling the Outdoor Cooling Impact of Highly Radiative “Super Cool” Materials Applied on Roofs. Urban Clim. 2021, 38, 100898. [Google Scholar] [CrossRef]
  98. Sinsel, T.; Simon, H.; Broadbent, A.M.; Bruse, M.; Heusinger, J. Modeling Impacts of Super Cool Roofs on Air Temperature at Pedestrian Level in Mesoscale and Microscale Climate Models. Urban Clim. 2021, 40, 101001. [Google Scholar] [CrossRef]
  99. Moretti, L.; Cantisani, G.; Carpiceci, M.; D’andrea, A.; del Serrone, G.; di Mascio, P.; Loprencipe, G. Effect of Sampietrini Pavers on Urban Heat Islands. Int. J. Environ. Res. Public Health 2021, 18, 13108. [Google Scholar] [CrossRef]
  100. Enríquez, E.; Fuertes, V.; Cabrera, M.J.; Seores, J.; Muñoz, D.; Fernández, J.F. New Strategy to Mitigate Urban Heat Island Effect: Energy Saving by Combining High Albedo and Low Thermal Diffusivity in Glass Ceramic Materials. Sol. Energy 2017, 149, 114–124. [Google Scholar] [CrossRef]
  101. Mirzabeigi, S.; Razkenari, M. Design Optimization of Urban Typologies: A Framework for Evaluating Building Energy Performance and Outdoor Thermal Comfort. Sustain. Cities Soc. 2022, 76, 103515. [Google Scholar] [CrossRef]
  102. Andoni, H.; Wonorahardjo, S. A Review on Mitigation Technologies for Controlling Urban Heat Island Effect in Housing and Settlement Areas. In IOP Conference Series: Earth and Environmental Science, Proceedings of the 3rd HABITechno International Conference, Bandung, Indonesia, 11 November 2017; IOP Publishing, Ltd.: Bristol, UK, 2018; Volume 152. [Google Scholar]
  103. Grifoni, R.C.; Tascini, S.; Cesario, E.; Marchesani, G.E. Cool Façade Optimization: A New Parametric Methodology for the Urban Heat Island Phenomenon (UHI). In Proceedings of the 17th IEEE International Conference on Environment and Electrical Engineering and 2017 1st IEEE Industrial and Commercial Power Systems Europe EEEIC/I and CPS Europe, Milan, Italy, 6–9 June 2017. [Google Scholar]
  104. Dietrich, U. Urban Street Canyons—Impact of Different Materials and Colours of Facades and Ground and Different Positions of Persons on Outdoor Thermal Comfort. Int. J. Sustain. Dev. Plan. 2018, 13, 582–593. [Google Scholar] [CrossRef]
  105. Fabbri, K.; Gaspari, J.; Bartoletti, S.; Antonini, E. Effect of Facade Reflectance on Outdoor Microclimate: An Italian Case Study. Sustain. Cities Soc. 2020, 54, 101984. [Google Scholar] [CrossRef]
  106. Bergman, T.L. Principles of Heat and Mass Transfe, 7th ed.; Wiley: New York, NY, USA, 2018. [Google Scholar]
  107. Kottek, M.; Grieser, J.; Beck, C.; Rudolf, B.; Rubel, F. World Map of the Koppen-Geiger Climate Classification Updated. Meteorol. Z. 2006, 15, 259–263. [Google Scholar] [CrossRef]
  108. Köppen, W.; Geiger, R. Das Geographische System Der Klimate. In Handbuch der Klimatologie; Gebrüder Borntraeger: Berlin, Germany, 1936; pp. 7–30. [Google Scholar]
  109. ARPAER. Wheater Data Emilia-Romagna Region. Available online: www.arpae.it (accessed on 2 November 2022).
  110. Ponzio, C.; Ricci, A.; Naboni, E.; Fabbri, K.; Gaspari, J. Development of an Adaptive Passive Façade: A Replicable Approach for Managing Multiple Design Solutions. In PLEA 2018—Smart and Healthy within the Two-Degree Limit, Proceedings of the 34th International Conference on Passive and Low Energy Architecture, Hong Kong, China, 10–12 December 2018; PLEA: Troy, MI, USA, 2018; Volume 1. [Google Scholar]
  111. Gaspari, J.; Naboni, E.; Ponzio, C.; Ricci, A. A Study on the Impact of Climate Adaptive Building Shells on Indoor Comfort. J. Facade Des. Eng. 2019, 7, 27–40. [Google Scholar] [CrossRef]
  112. Ricci, A.; Ponzio, C.; Fabbri, K.; Gaspari, J.; Naboni, E. Development of a Self-Sufficient Dynamic Façade within the Context of Climate Change. Archit. Sci. Rev. 2020, 64, 87–97. [Google Scholar] [CrossRef]
  113. Fabbri, K. A Replicable Methodology to Evaluate Passive Façade Performance with SMA during the Architectural Design Process: A Case Study Application. Energies 2021, 14, 6231. [Google Scholar] [CrossRef]
  114. Fabbri, K.; Costanzo, V. Drone-Assisted Infrared Thermography for Calibration of Outdoor Microclimate Simulation Models. Sustain. Cities Soc. 2020, 52, 101855. [Google Scholar] [CrossRef]
  115. ARPAE Emilia Romagna. Available online: https://simc.arpae.it/dext3r/ (accessed on 2 November 2022).
  116. ANSI/ASHRAE ASHRAE Guideline 14-2002 Measurement of Energy and Demand Savings. Ashrae 2002, 8400, 170.
  117. Gusson, C.S.; Duarte, D.H.S. Effects of Built Density and Urban Morphology on Urban Microclimate—Calibration of the Model ENVI-Met V4 for the Subtropical Sao Paulo, Brazil. In Procedia Engineering, Proceedings of the 4th International Conference on Countermeasures to Urban Heat Island, Singapore, Singapore, 30 May–1 June 2016; Elsevier, Ltd.: Amsterdam, The Netherlands, 2016; Volume 169, pp. 2–10. [Google Scholar]
  118. Elwy, I.; Ibrahim, Y.; Fahmy, M.; Mahdy, M. Outdoor Microclimatic Validation for Hybrid Simulation Workflow in Hot Arid Climates against ENVI-Met and Field Measurements. In Energy Procedia, Proceedings of the 5th International Conference on Energy and Environment Research, ICEER 2018, Prague, Czech Republic, 23–27 July 2018; Elsevier, Ltd.: Amsterdam, The Netherlands, 2018; Volume 153, pp. 29–34. [Google Scholar]
  119. Yahia, M.W.; Johansson, E.; Thorsson, S.; Lindberg, F.; Rasmussen, M.I. Effect of Urban Design on Microclimate and Thermal Comfort Outdoors in Warm-Humid Dar Es Salaam, Tanzania. Int. J. Biometeorol. 2018, 62, 373–385. [Google Scholar] [CrossRef] [Green Version]
  120. Andreou, E. Thermal Comfort in Outdoor Spaces and Urban Canyon Microclimate. Renew. Energy 2013, 55, 182–188. [Google Scholar] [CrossRef]
Figure 1. Italy and Bologna location.
Sustainability 14 14669 g001
Figure 2. Plan of the redevelopment area with the selected plot highlighted.
Sustainability 14 14669 g002
Figure 3. Axonometric view of the case study volumes.
Sustainability 14 14669 g003
Figure 4. Workflow flow chart.
Sustainability 14 14669 g004
Figure 5. Envi-met simulation, Potential Air Temperature with emissivity equal to 0.1.
Sustainability 14 14669 g005
Figure 6. Envi-met simulation, PET with emissivity equal to 0.1.
Sustainability 14 14669 g006
Figure 7. Envi-met simulation, Potential Air Temperature with emissivity equal to 0.5.
Sustainability 14 14669 g007
Figure 8. Envi-met simulation, PET with emissivity equal to 0.5.
Sustainability 14 14669 g008
Figure 9. Envi-met simulation, Potential Air Temperature with emissivity equal to 0.9.
Sustainability 14 14669 g009
Figure 10. Envi-met simulation, PET with emissivity equal to 0.9.
Sustainability 14 14669 g010
Figure 11. Variation in the percentage of temperature as the emissivity value varies. Red arrow highlight frequency increase of temperature in case of emissivity equal to 0.1.
Sustainability 14 14669 g011
Figure 12. Variation in the percentage of PET as the emissivity varies. Red arrow highlight frequency increase of temperature in case of emissivity equal to 0.9.
Sustainability 14 14669 g012
Table 1. Emissivity value associated with the three scenarios.
ScenarioEmissivity
1ε = 0.1
2ε = 0.5
3ε = 0.9
Table 2. Grade of physiological stress.
PET (°C)Thermal PerceptionGrade of Physiological Stress
<4Very coldExtreme cold stress
8ColdStrong cold stress
13CoolModerate cold stress
18Slightly coolSlight cold stress
23ComfortableNo thermal stress
29Slightly warmSlight heat stress
35WarmModerate heat stress
41HotStrong heat stress
>41Very hotExtreme heat stress
Publisher’s Note: MDPI stays neutral with regard to jurisdictional claims in published maps and institutional affiliations.

