Article

Detecting Discontinuities in Steel Wire Ropes of Personal Lifts Based on the Analysis of Their Residual Magnetic Field

1
Department of Machinery Engineering and Transport, Faculty of Mechanical Engineering and Robotics, AGH University of Science and Technology, 30-059 Krakow, Poland
2
Department of Engineering Science and Mechanics, Sichuan University, Chengdu 610065, China
3
Faculty of Civil Engineering, Wrocław University of Science and Technology, Wybrzeże Wyspiańskiego 27, 50-370 Wrocław, Poland
*
Author to whom correspondence should be addressed.
Sustainability 2022, 14(21), 14641; https://doi.org/10.3390/su142114641
Submission received: 28 September 2022 / Revised: 26 October 2022 / Accepted: 4 November 2022 / Published: 7 November 2022

Abstract

:
Steel wire rope is essential to many rope transport devices. As steel ropes are used, they become damaged, the identification of which is often very difficult or time-consuming. The criteria for retiring steel wire ropes are rigorous—sometimes, ropes that remain fit for further operation are replaced. This article aims to define a novel method of identifying the condition of steel ropes based on their residual magnetic field measurements and their potential use in other industries in the event of damage. This article presents a methodology for detecting discontinuities in steel ropes, which allows for determination of their suitability for further operation. The work uses a rope as a load-bearing element of a personal lift. The initial signal was recorded with a SpinMeter-3D magnetometer. The obtained results were subjected to the extraction of features, the analysis of which allowed identifying the damage. The obtained results enable us to conclude that this procedure is crucial in the context of sustainable development.

1. Introduction, Aim, and Scope

1.1. Use of Steel Wire Ropes

Wilhelm Albert produced the first steel wire rope in 1834. Today, it is widely used in lifting, traction systems, and transportation. Different types of steel wire ropes are used as a tensile load for various applications in industry and civil engineering. The major equipment includes ropeways, lifts, oil rigs, mine hoists, personal lifts, and cable-stayed bridges. The ropes are made of several steel strands twisted on the central core to improve the axial strength, stiffness, and bending flexibility, thus increasing the mechanical properties. They are usually made of many structures. So, in the context of mechanical strength, steel wire ropes are typically analyzed for strain and stress [1]; hence, research on wire ropes is essential. The fatigue strength depends on the crack propagation in the wire rope’s internal and external cross sections and its ability to withstand abrasion and plasticity after extended use [2].

1.2. Magnetic Methods to Diagnose Steel Wire Rope Damage

Some authors [3] have conducted nondestructive testing and discussed the discard criteria, emphasizing the importance of internal damage. The study of the broken wires, most often used in lifts and hoist ropes, used electromagnetic nondestructive methods. To determine the failure criteria of wire rope, there are recommendations to conduct a yearly magnetic test. Other researchers [4] who have inspected the wire ropes commonly used in the gas, oil, and mining industries concluded that electromagnetic nondestructive methods have potential and could be helpful to develop the failure and discard criteria [5]. In [6], the authors presented an innovative diagnostic procedure for ropes using passive magnetic methods. The changes in the magnetic induction near the rope, determined by the analysis of the electromagnetic properties, may be caused by changes in the metallic cross section (cracks, corrosion, and/or abrasions) and wear (fatigue). However, the presented method required knowledge of the tested object’s initial and defect state. The authors of [7] noted the change in the strength of the tested object depending on the degree of damage. The division of the research into three stages made it possible to conclude that in the event of damage to more than half of the cross section, the rope’s strength dropped drastically. The authors of [8] applied eight wire rope defect signal analysis methods. In their conclusions, they suggested that it was necessary to use a comprehensive approach, looking for various analytical techniques to identify the damage. In [9], the Ye–Duyi damage model was used to predict the damage to the wire rope core, while the Weibull distribution was used to estimate its reliability. The results were promising but still required a lot of work and verification. The fatigue analysis of steel ropes shown in [10] was also critical. It showed that the diameter of the rope decreased with increasing fatigue wear. However, the damage propagation increased dramatically after exceeding 60,000 cycles of fatigue work. Ref. [11] showed that the interwire pressures influenced the fatigue demand in both new and existing wire ropes. Pitting corrosion led to higher local stress amplification with regard to uniform corrosion. Many authors have also tried to create a continuous signal analysis algorithm for online identification. In [12], an acquisition signal based on Labview was developed that enabled continuous measurement. This algorithm required some finetuning.

1.3. Other Methods of Diagnosing Steel Wire Rope Damage

Apart from magnetic methods, there have also been attempts to analyze the signal using induction thermography [13]. In Ref. [14] presented a different approach to detecting local wire rope defects. The proposed method characterized wire rope surface images with a smaller number of feature dimensions and provided a good distinction between different types of rope surface defects. The images were collected and then broken into pieces that were small enough and contained enough reflection information. The segmented images were then binarized. The binarized images were also denoised and morphologically smoothed. Finally, a special algorithm was proposed as a classification method to detect local faults. Techniques using longitudinal guided waves have also been developed. Defect detection, in this case, was accomplished by analyzing the wave velocity and time. The experiment confirmed that as the stress increased, its natural frequencies increased. However, this method is very complicated and time-consuming [15].

1.4. Problems with the Diagnosis of Steel Wire Rope Damage

Another problem encountered in the diagnosis of wire rope damage is the determination of the location of the defect on the cross section. The authors of [16] proposed placing a dozen sensors around the perimeter of the rope’s cross section. The largest problem arose from guiding the rope. Therefore, it is necessary to conduct further analyses in this area. A significant challenge is to assess the technical condition of ropes in polyurethane matrix or steel belts. This topic was taken up in [17]. The proposed method of active analysis was more expensive and less environmentally friendly. Diagnosing steel ropes is an important part of sustainable development, due to the disposal of used steel ropes. Only in [18] did the authors propose a way to reuse the used steel ropes from personal lifts. The work examined the properties, and it was concluded that the steel ropes could be used as reinforcement of concrete instead of steel bars.

1.5. Aim of the Work

The criteria for retiring wire ropes vary from country to country [19], which may result in replacing ropes that are fit for further use in a different country or application. In the event of damage, it is imperative to manage the used rope properly. This article aims to develop an algorithm for wire rope damage detection based on the features extracted from the magnetic induction components measured near the rope. The traditional magnetic method of wire rope testing is based on formatting the magnetic field from an external source and analyzing the magnetic flux leakage caused by discontinuities [20,21,22,23,24]. The method we propose uses residual magnetic fields (self-magnetic flux leakage), which result from the action of the magnetomechanical effects changing the electromagnetic properties of the material. In addition, self-magnetic flux leakage is caused by the mechanical and structural inhomogeneities of the material [25,26,27]. A detailed analysis of the standard features of the diagnostic signal, gradient, and TKEO [28] is carried out, and a new fault identification method is introduced.

2. Experimental Details

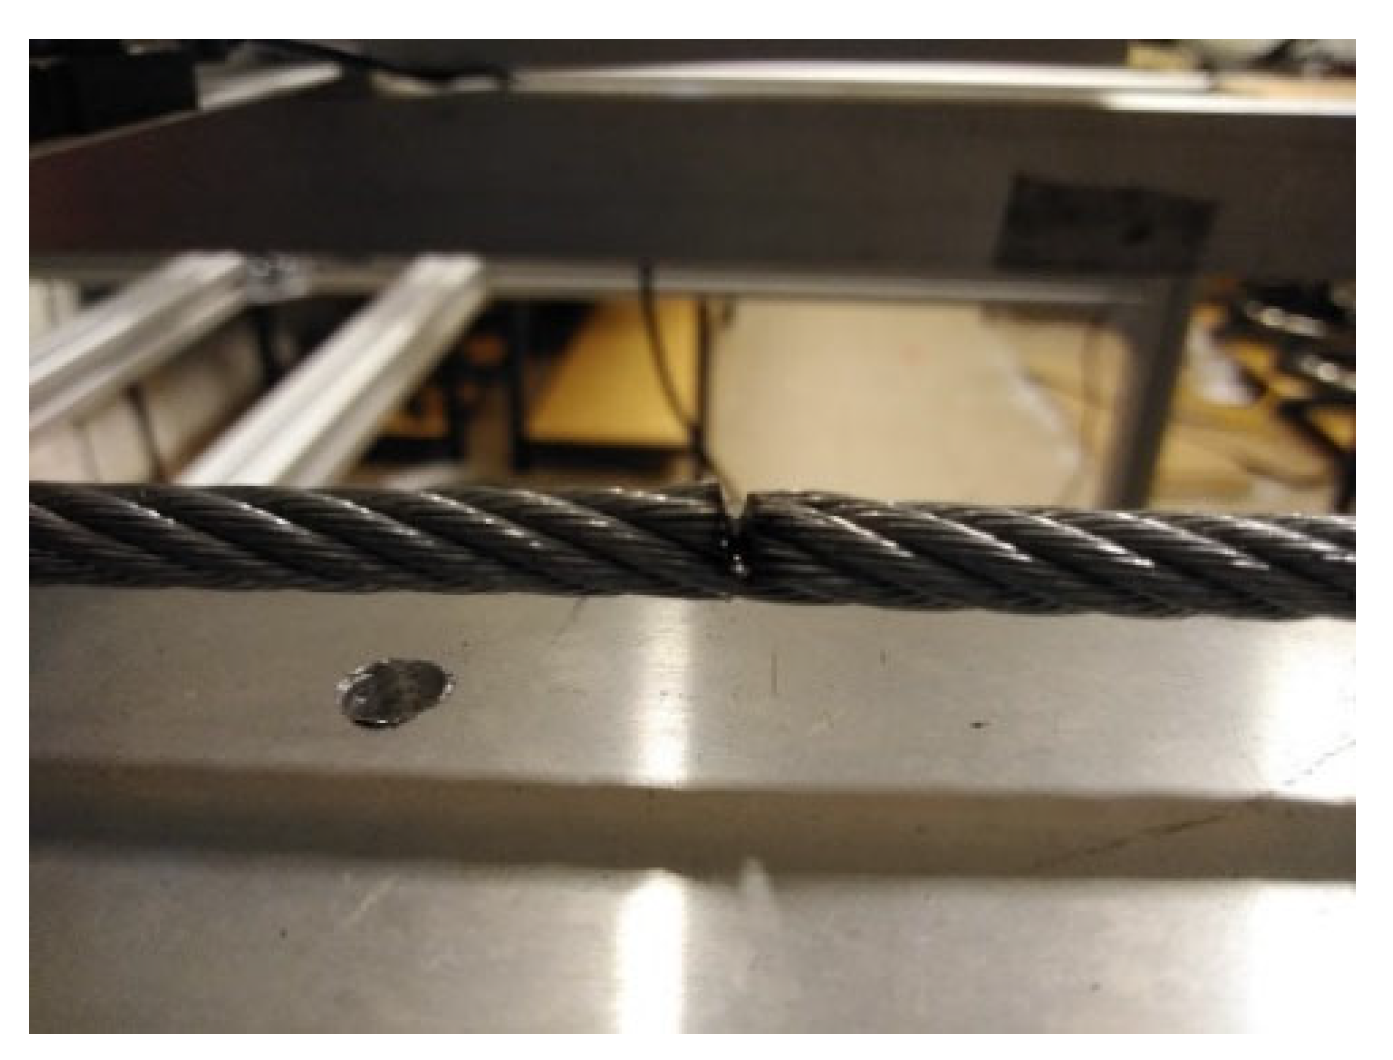
2.1. Examined Object: Steel Wire Ropes

The examination was conducted using three different diameters and constructions of steel wire ropes (Table 1).
Rope no. 1 was a steel wire rope without a polyamide casing. The remaining two ropes were covered with polyurethane material. This solution is used in industry to increase the adhesion of the ropes to the friction wheel, thus increasing the friction. Each rope had a different structure and number of strands—research on this will be the subject of other studies. We selected this combination of ropes due to the different diameters of the metallic cross section of the individual ropes: no. 1: 6 mm, no. 2: 5 mm, no. 3: 4 mm (Figure 1).

2.2. Measurement Details

For the measurement of the magnetic field, the SpinMeter-3D was used [29]. The SpinMeter-3D uses the phenomenon of tunnelling magnetoresistance (TMR) [30,31,32]. Figure 2 shows the sensor with the system of measuring axes. The magnetic sensor was placed on a test strand. Each rope was cut into pieces 700 mm long, and loops were formed at the ends so they could be attached to the test stand (Figure 1). The measuring range of each rope was 300 mm. Each rope realized a reciprocating movement with a speed of approx. 3 mm/s. The measuring range of the steel wire rope is marked with yellow. The room where the measurement was performed did not contain other ferromagnetic elements that could affect the measurement result. The measurement consisted of two stages. In the first part of the measurement, each steel wire rope in the delivery state was installed on the stand. The SpinMeter-3D was positioned 10 mm (in the z-direction) and 0 mm (in the x- and y-directions) from the magnetic sensor (Figure 2).
The three components of induction were recorded ten times for this state. The mean of all values was used for the final analysis. Then, centrally in the middle of the rope, a discontinuity was introduced (we cut the rope) to a depth of approx. 2 mm (Figure 3). All recorded signals for the rope with discontinuity are marked as _D.
For this state, the magnetic sensor recorded a signal at a distance of 10 mm (in the z-direction) and 0 mm (in the x and y directions).

3. Results

The results of the obtained measurements are shown in Figure 4, Figure 5, Figure 6, Figure 7, Figure 8, Figure 9, Figure 10, Figure 11, Figure 12, Figure 13 and Figure 14. Figure 4 shows the recorded signals for the initial state, and Figure 5 shows the signals for ropes with introduced discontinuity. Figure 6 shows the difference Δ B i in the values between the signal for damaged ropes B i _ D   and their initial state B i ( Δ B i = B i _ D B i ). Figure 7, Figure 8 and Figure 9 show the distribution of gradients for the induction components: B x x, B y y, and B z z. Similarly, Figure 10, Figure 11 and Figure 12 show the TKEO analysis for the induction components: B x , B y , and B z . Figure 13 illustrates the signal modules calculated as   B = B x · B x + B y · B y + B z · B z . On the other hand, in Figure 14, one can observe a new variable not encountered before in diagnostics, determined by the product of the signals from all three induction components B M = B x · B y · B z .

4. Discussion

4.1. Interpretation of Charts

Figure 4 and Figure 5 show the distribution of the induction components along with the measuring range. Figure 4 relates to the initial state. Figure 5 shows the rope’s condition with damage. The difference in the induction components’ distribution for almost every axis is apparent. This confirmed the results presented in [6]. Figure 6 shows the difference in the level of the magnetic induction for the initial state of the rope and the state with the introduced damage. We found the most significant changes in the distribution of the induction components near the tested rope for the Bx and Bz components. The values of the maximum differences Δ B x and Δ B z for all the tested ropes are shown in Figure 15.
Figure 7, Figure 8, Figure 9, Figure 10, Figure 11, Figure 12, Figure 13 and Figure 14 show a comparative analysis of the signal with and without failure. Figure 7, Figure 8 and Figure 9 show the distribution of the gradient of the induction components. There is a clear influence of the defect on the distribution of the gradient values, which increased in the immediate vicinity of the introduced defect. The most significant differences appeared for the grad Bx_D and grad Bz_D; grad By_D showed no significant changes. The maximum values of the gradients for all the tested ropes are shown in Figure 16.
Figure 10, Figure 11 and Figure 12 show the distribution of the TKEO values obtained for the induction components. The TKEO analysis yielded a clear peak for the Bx_D signal that can be used for detection discontinuity. This is an essential supplement to the diagnostic signals presented before.
Figure 13 and Figure 14 show the product of the three signals and the value of the resultant vector.
Figure 14 shows two extremes in the course of the product of the induction components measured on the surface of a defective rope and other extremes in the study of a rope without a defect. For all the ropes, there was a clear picture of discontinuity.

4.2. Analysis of the Results

Regardless of the initial state of the wire rope magnetism, the damage caused a change in the measured signal. For ropes no. 1 and no. 2, the diagnostic signal was evident; for rope no. 3 there was a lot of noise. This was most likely due to the minor diameter of the metallic cross section. Further research will allow us to determine whether the rope structure could have caused this result. The signal’s shape resembled a peak for the x component (tangent along the measurement direction). The y component (the tangent perpendicular to the measurement direction) was also a peak but with a value several times smaller. On the other hand, the z-component signal (normal) resembled a sine waveshape.
The gradients of the individual signals took the same shapes, with the difference, however, that the waveforms oscillated around the 0 value axis. The gradient distribution allowed the measured signal to be independent of the initial state.
The TKEO energy analysis, mainly based on the x and z signals, allowed us to identify the area with the most noticeable changes. However, this signal was not unambiguous, although it helped to analyze it.
Determining the modulus of signals based on all three components was very promising. For all the measurements carried out, this analysis indicated damage.
The most promising diagnostic signal seemed to be the product of all three components, which has not been used before. This signal was unambiguous and did not raise any doubts. The signal of the y-component turned out to be very important in this case. As discussed earlier, its changes were negligible. However, these slight changes appeared just in the area of damage, and in the rest of the measurement, it assumed values close to 0. This was a crucial component because it allowed resetting the signal with no changes and emphasizing the signal with the damage.

5. Conclusions

  • The use of the phenomenon of tunneling magnetoresistance in diagnosing the technical condition of wire ropes is promising. Passive magnetic diagnostics is much more energy-efficient than active techniques. It does not require generating an external magnetic field and consuming energy. Reduced energy consumption leads to environmental sustainability.
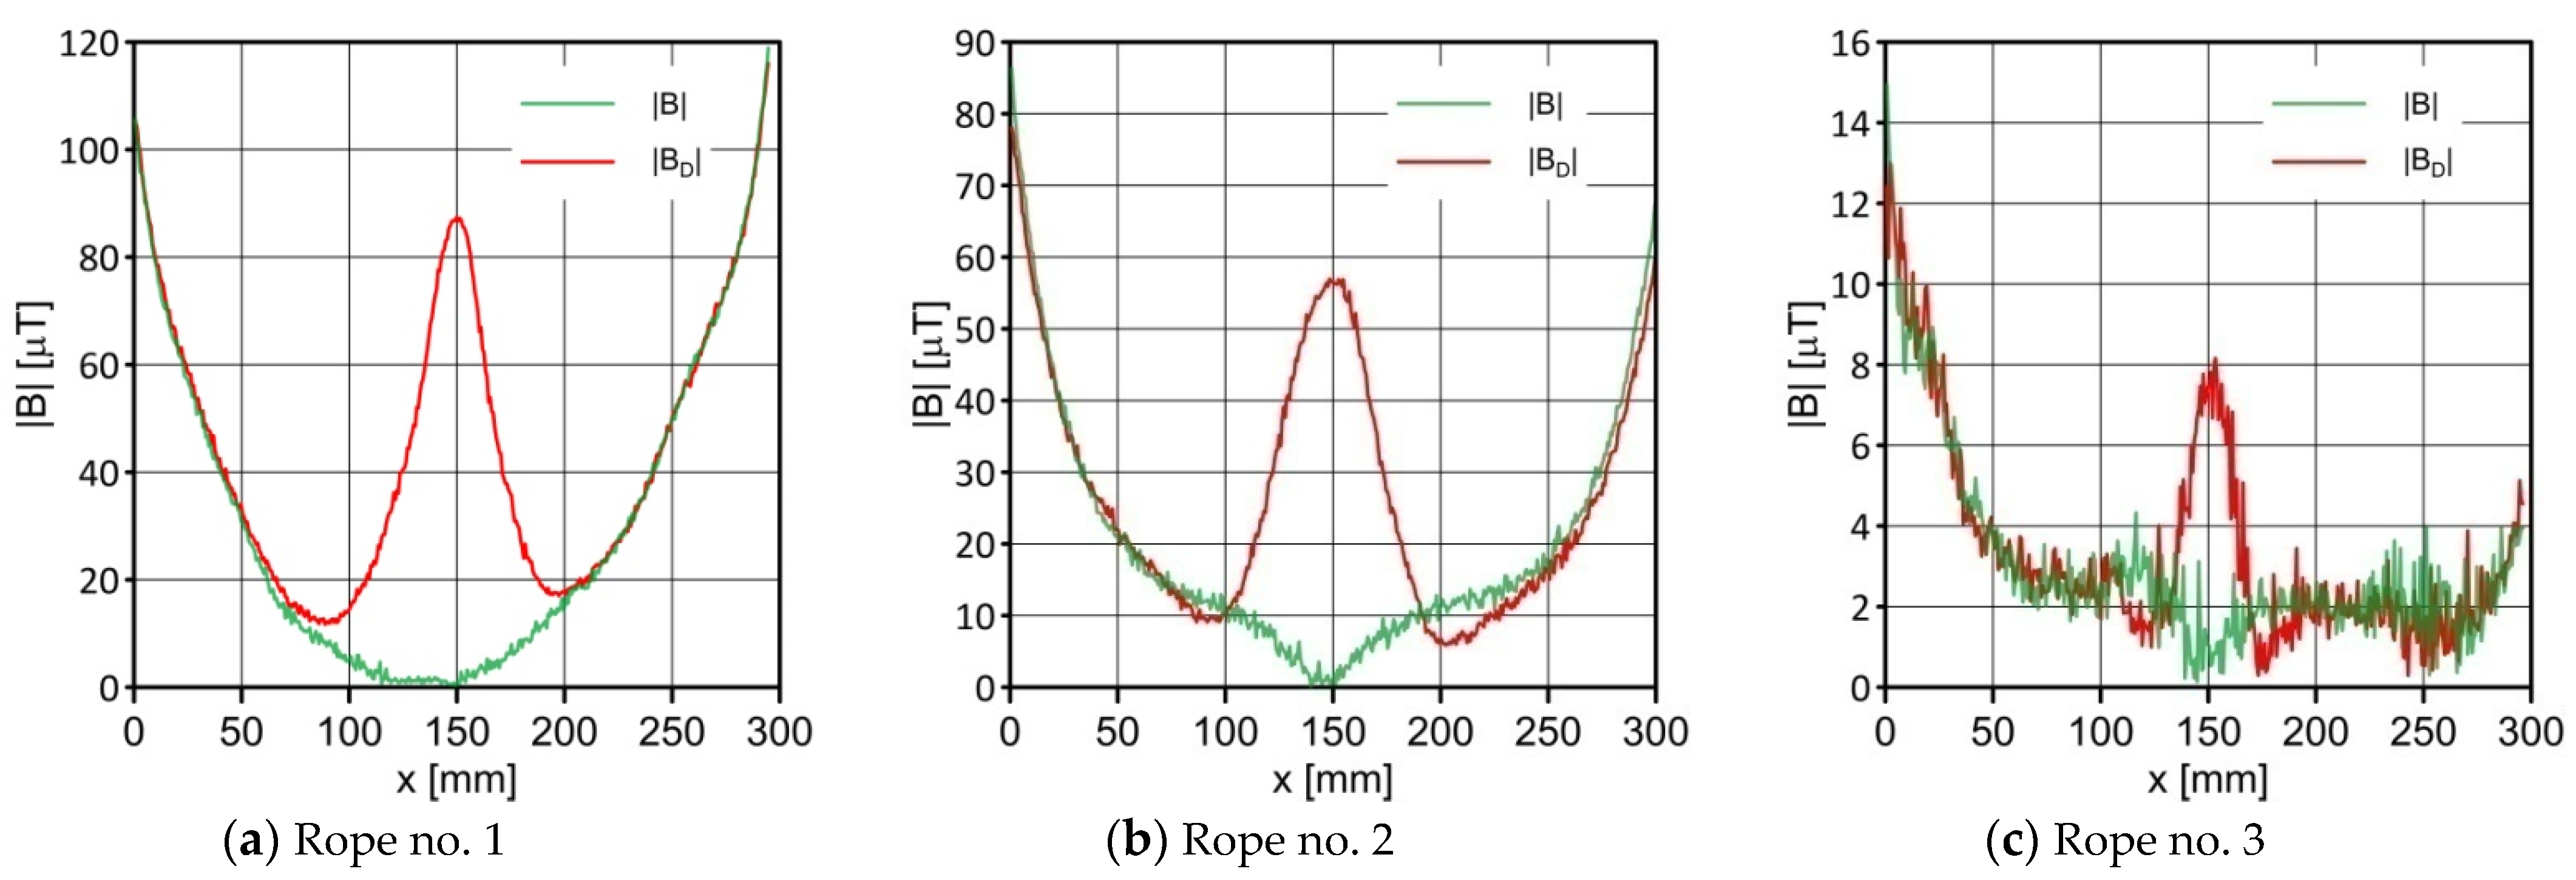
  • The induction component distributions along the rope length were measured with and without a defect. Comparing the obtained results showed that the difference in the values near the defect for almost every component was apparent. This confirmed the results presented in [6]. Even without knowing the initial state, the magnetic anomaly caused by the discontinuity of the material gave a sufficiently strong diagnostic signal to enable its detection.
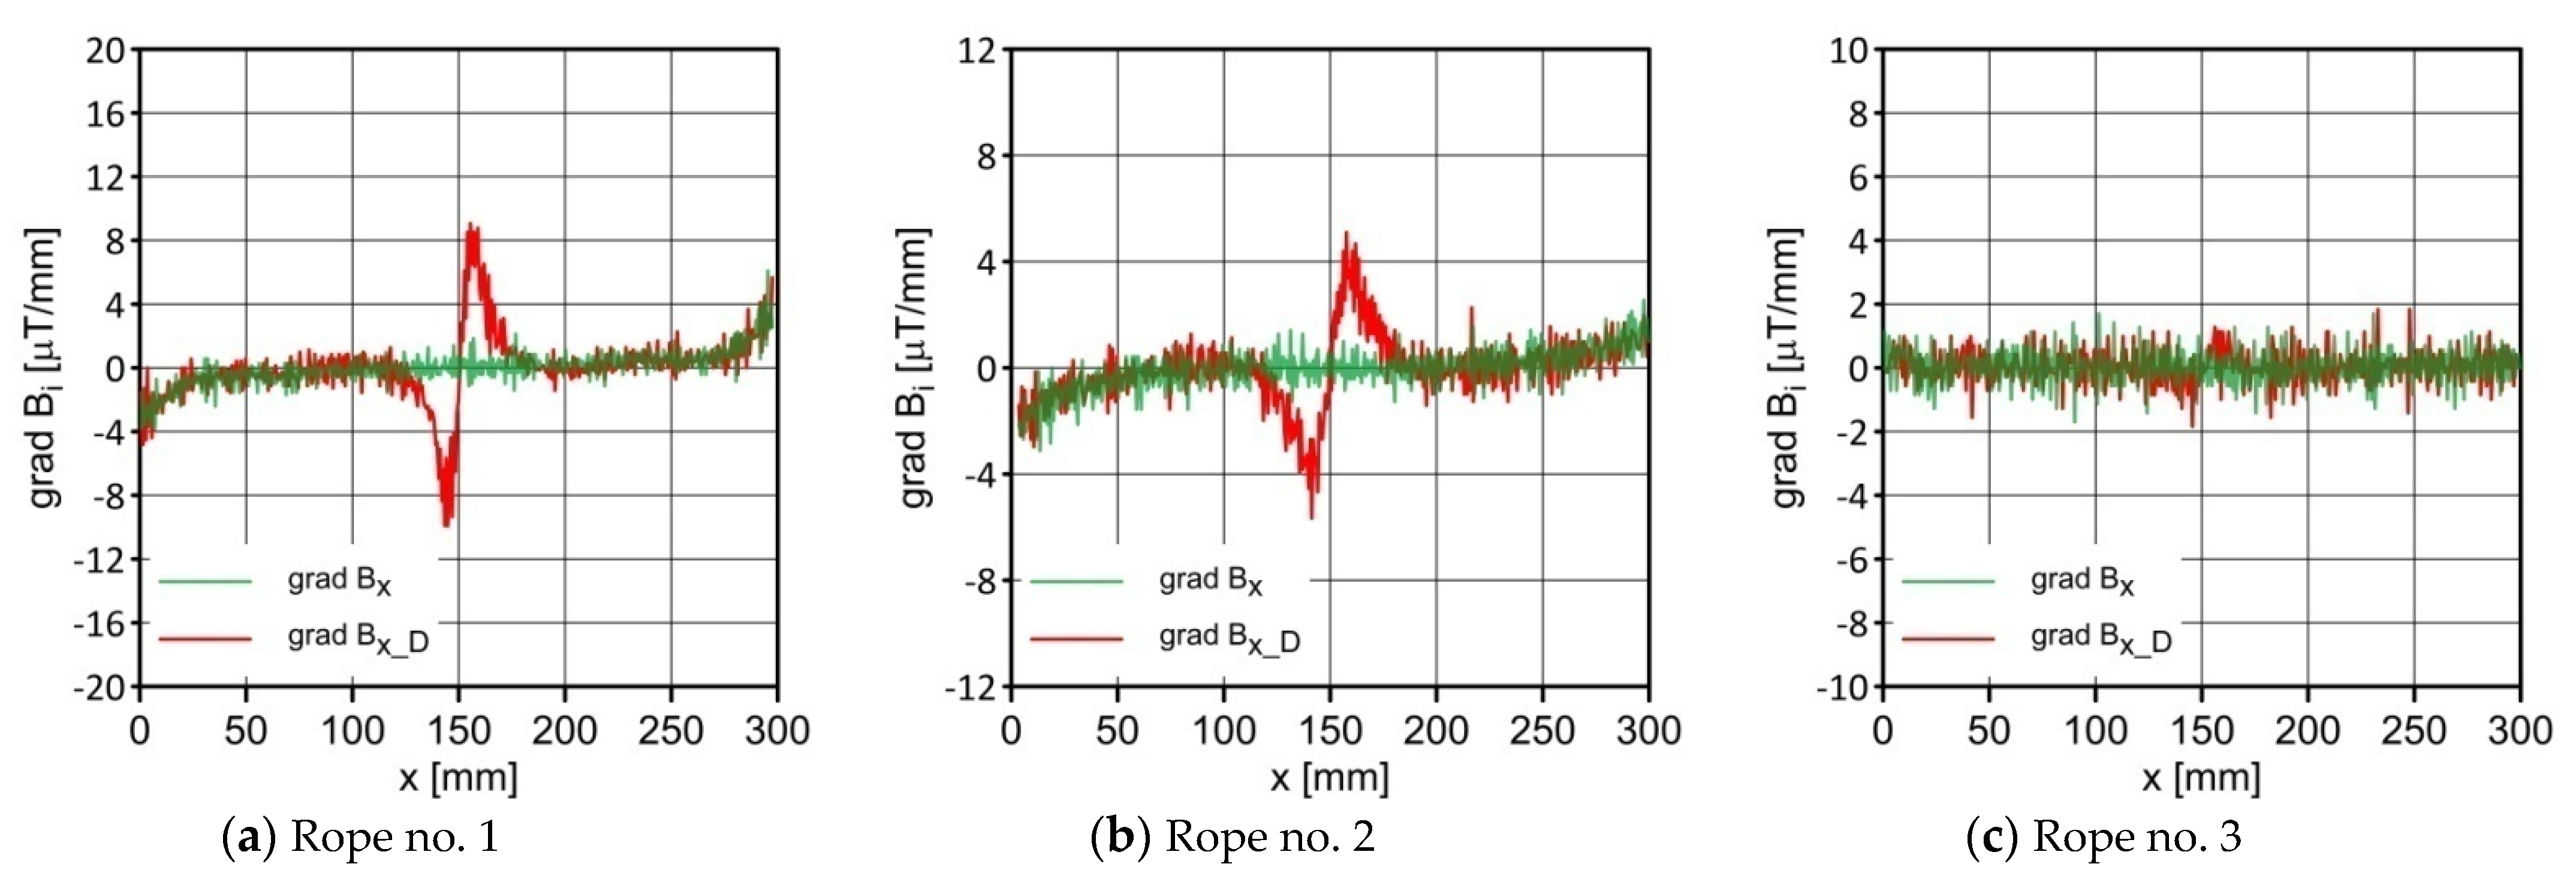
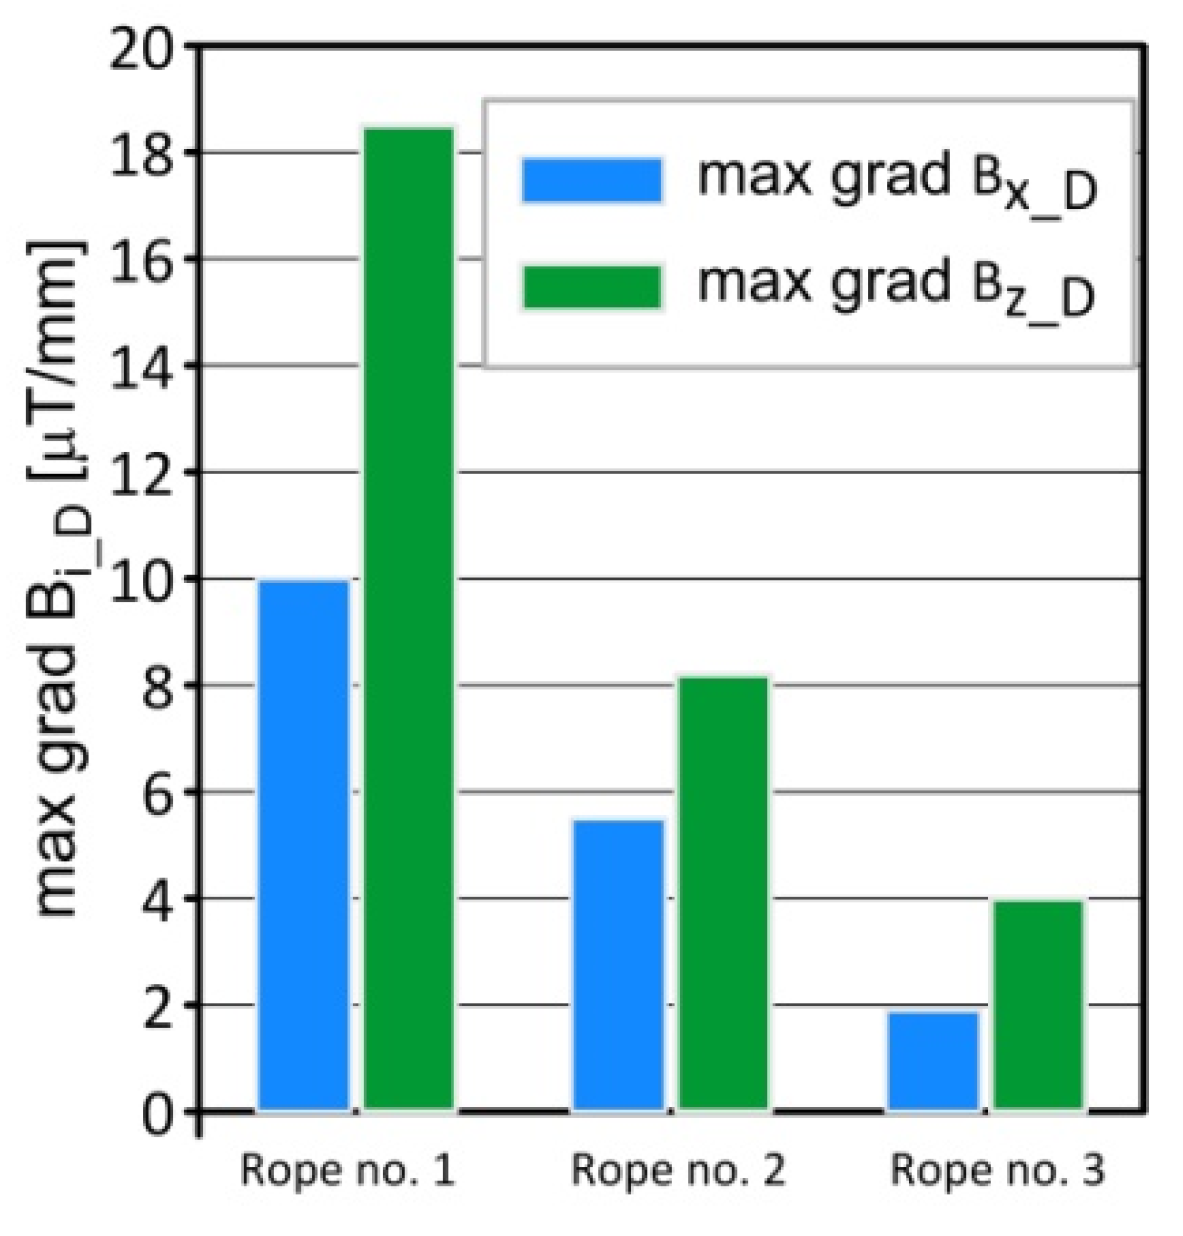
  • We found that the values of the induction components were an important diagnostic parameter. Visible changes were observed in the induction gradient for the x and z components. Additionally, there was a clear peak in the TKEO analysis for the Bx_D signal.
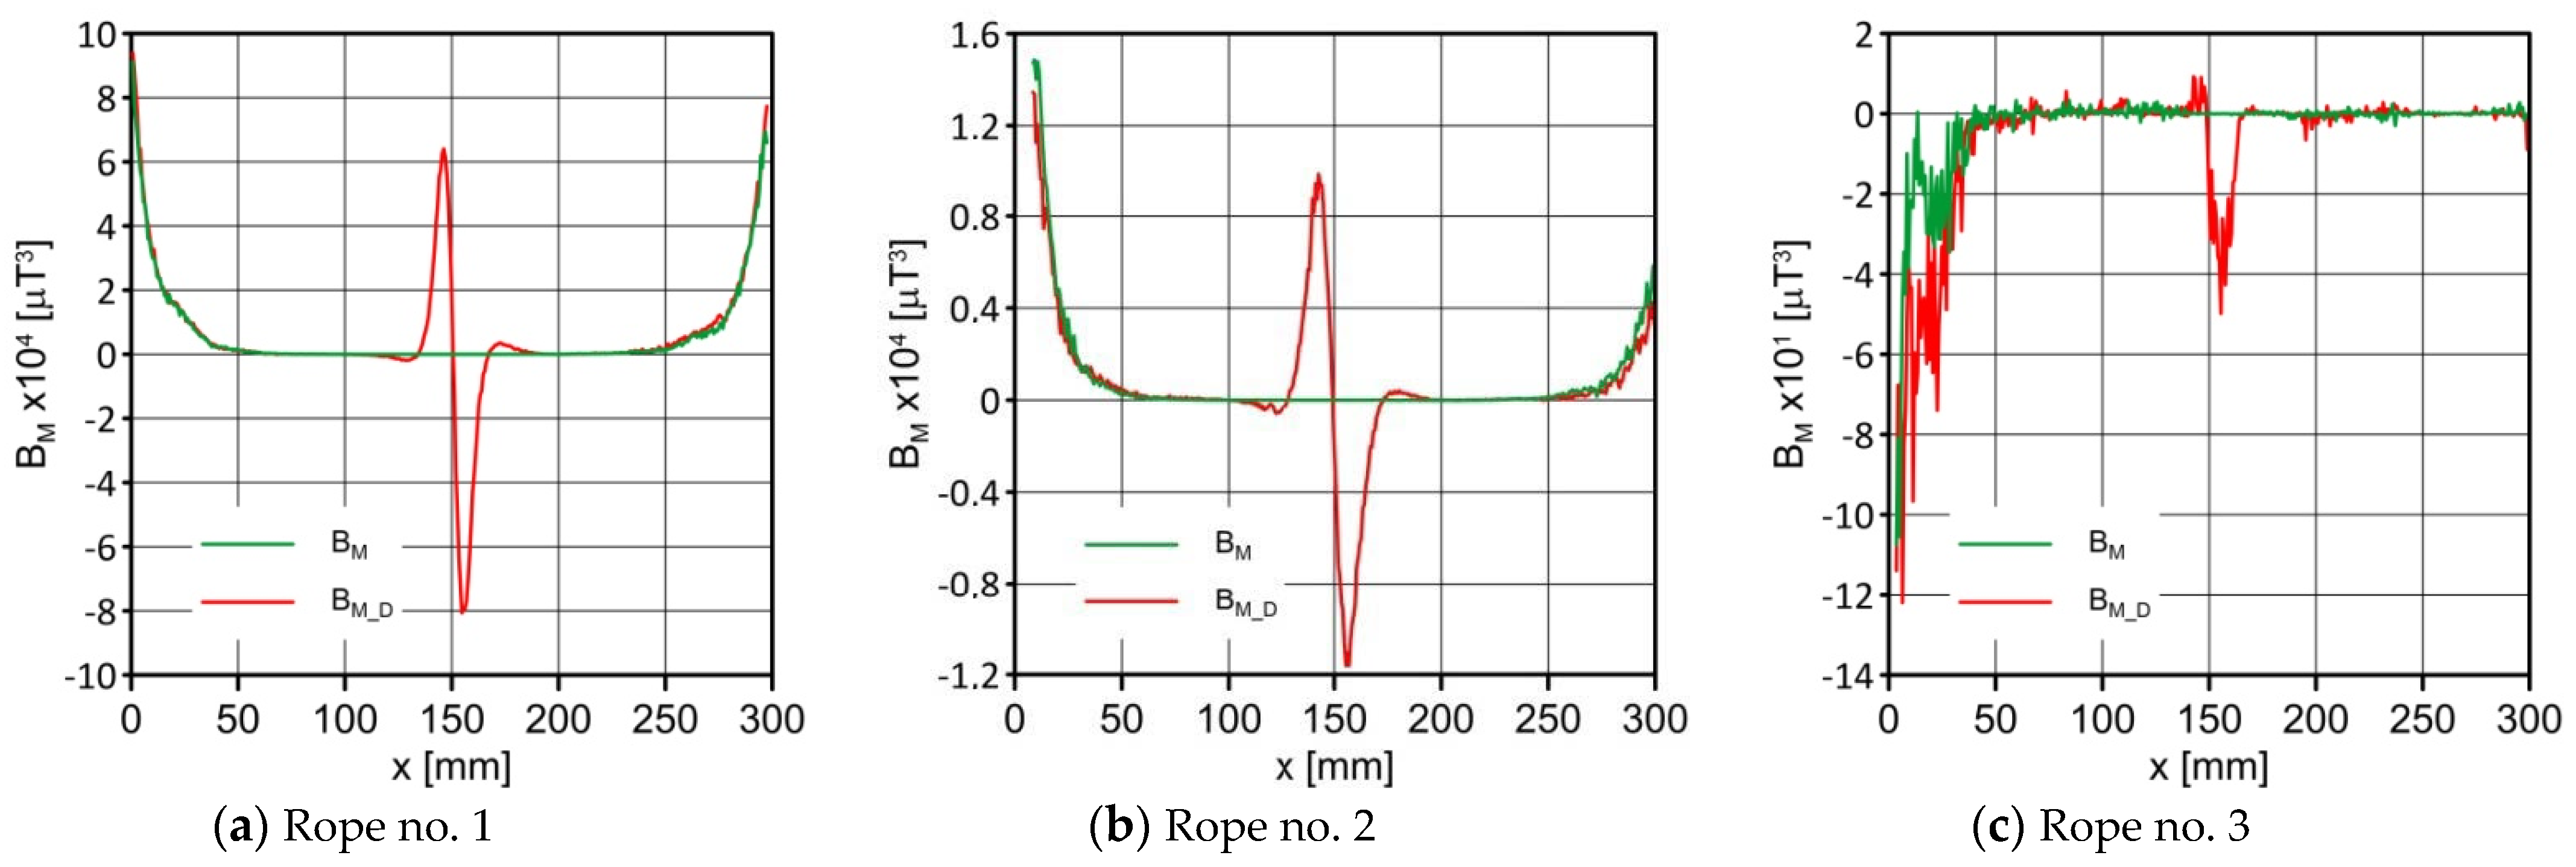
  • We introduced the product of the magnetic field induction components measured on the rope surface B M = B x · B y · B z , which was an excellent diagnostic signal, giving a clear image of the discontinuity in the signal distribution.
  • A comprehensive approach using many features of the diagnostic signal is the basis for developing a new passive magnetic method for evaluating the defectoscopic condition of steel ropes.
To summarize, the skillful diagnosis of wire ropes can impact sustainable development in two ways: firstly, ropes that reach their service life, and are suitable for further use, may have a longer service life. This affects the sustainable development of the environment and allows for economic savings. Secondly, it is essential to find possible uses for the used wire ropes in other industries. Instead of discarding them, we could use them for further work. As for personal lifts—the ropes of higher shafts, in the event of damage at extreme distances, could be used for other—lower shafts. The approach mentioned in [18] is also innovative, where steel ropes could be effectively used as an element in concrete reinforcement.
The presented results were qualitative in nature. Future work will focus on the analysis of the possibility of developing quantitative relationships between the defect size and shape and its magnetic signature.

Author Contributions

Conceptualization, P.M. and M.R.; methodology, P.M.; software, J.K. and J.W.; validation, P.M., M.R. and J.K.; formal analysis, P.M.; investigation, P.M.; resources, P.M.; data duration, P.M. and K.S.; writing—original draft preparation, P.M.; writing—review and editing, M.R. and J.K.; visualization, P.M.; supervision, M.R., J.W. and K.S. All authors have read and agreed to the published version of the manuscript.

Funding

This research received no external funding.

Institutional Review Board Statement

Not applicable.

Informed Consent Statement

Not applicable.

Data Availability Statement

Not applicable.

Conflicts of Interest

The authors declare no conflict of interest.

References

  1. Giglio, M.; Manes, A. Life prediction of a wire rope subjected to axial and bending loads. Eng. Fail. Anal. 2005, 12, 549–568. [Google Scholar] [CrossRef]
  2. Chaplin, C. Interactive Fatigue in Wire Rope Applications. In Proceedings of the Symposium on mechanics of slender structures (MoSS 2008), Baltimore, MD, USA, 23–25 July 2008. [Google Scholar]
  3. El Barkany, A.; Benali, A.; El Ghorba, M.; Chergui, M.H.; Choukir, A. Nondestructive evaluation methods of broken wire ropes of lifting. Int. J. Constr. Educ. Res. 2012, 2, 154–162. [Google Scholar]
  4. Sukhorukov, V.; Slesarev, D.; Vorontsov, A. Electromagnetic Inspection and Diagnostics of Steel Ropes: Technology, Effectiveness and Problems, ET’. Undefined. 2014. Available online: https://www.semanticscholar.org/paper/Electromagnetic-Inspection-and-Diagnostics-of-Steel-Sukhorukov-Slesarev/fdc1c06b5bca1285f93c83dc5f611174629f911f (accessed on 27 June 2022).
  5. Seelam, A.B.; Jawed, M.S.; Krishanmurthy, S.H. Design and analysis of elevator wire ropes. Int. J. Simul. Multidiscip. Des. Optim. 2021, 12, 20. [Google Scholar] [CrossRef]
  6. Mazurek, P.; Roskosz, M.; Kwasniewski, J. Novel diagnostic of steel wire rope with passive magnetic methods. IEEE Magn. Lett. 2021, 13, 1–5. [Google Scholar] [CrossRef]
  7. Houda, M.; Abdellah, E.B.; Ahmed, E.B. Steel wire ropes failure analysis: Experimental study. Eng. Fail. Anal. 2018, 91, 234–242. [Google Scholar]
  8. Liu, S.; Sun, Y.; Jiang, X.; Kang, Y. Comparison and analysis of multiple signal processing methods in steel wire rope defect detection by hall sensor. Measurement 2021, 171, 108768. [Google Scholar] [CrossRef]
  9. Mouhib, N.; Wahid, A.; Sabah, F.; Chakir, H.; ELghorba, M. Experimental characterization and damage reliability analysis of central core strand extracted from steel wire rope. Eng. Fail. Anal. 2021, 120, 105103. [Google Scholar] [CrossRef]
  10. Hu, Z.; Wang, E.; Jia, F. Study on bending fatigue failure behaviors of end-fixed wire ropes. Eng. Fail. Anal. 2022, 135, 106172. [Google Scholar] [CrossRef]
  11. Milone, A.; Landolfo, R.; Berto, F. Methodologies for the fatigue assessment of corroded wire ropes: A state-of-the-art review. Structures 2022, 37, 787–794. [Google Scholar] [CrossRef]
  12. Dai, L.; Zhao, M.; Tang, B.; Yang, N.; Xiao, Y.; Wu, T. Signal acquisition system for broken wire of elevator wire rope based on TMR sensor. J. Phys. Conf. Ser. 2021, 2010, 012113. [Google Scholar] [CrossRef]
  13. Xia, H.; Yan, R.; Wu, J.; He, S.; Zhang, M.; Qiu, Q.; Zhu, J.; Wang, J. Visualization and Quantification of Broken Wires in Steel Wire Ropes Based on Induction Thermography. IEEE Sens. J. 2021, 21, 18497–18503. [Google Scholar] [CrossRef]
  14. Pan, F.; Ren, L.; Zhou, J.; Liu, Z. Fault classification based on computer vision for steel wire ropes. J. Phys. Conf. Ser. 2022, 2184, 012035. [Google Scholar] [CrossRef]
  15. Gao, W.; Zhang, D.; Zhu, X. Tension Monitoring and Defect Detection by Magnetostrictive Longitudinal Guided Wave for Fine Wire Rope. IEEE Trans. Instrum. Meas. 2021, 70, 6003707. [Google Scholar] [CrossRef]
  16. Zhou, J.; Ren, L.; Liu, Z. Instantaneous lift-off distance estimation in magnetic flux leakage testing of steel wire ropes. J. Phys. Conf. Ser. 2022, 2184, 012051. [Google Scholar] [CrossRef]
  17. Ruta, H.; Krakowski, T.; Lonkwic, P. Optimisation of the Magnetic Circuit of a Measuring Head for Diagnostics of Steel-Polyurethane Load-Carrying Belts Using Numerical Methods. Sustainability 2022, 14, 2711. [Google Scholar] [CrossRef]
  18. Yaghmaei Poudeh, A.; Dehghanbanadaki, A.; Golpazir, I. Reuse of elevator wire rope waste to improve the tensile strength of plain concrete. Innov. Infrastruct. Solut. 2021, 7, 70. [Google Scholar] [CrossRef]
  19. Xue, Z.; Chang, X.; Feng, S.; Fang, L.; Liu, Y. Research on test method of elevator wire rope under special environment. J. Phys. Conf. Ser. 2021, 1748, 052039. [Google Scholar] [CrossRef]
  20. Sheinker, A.; Frumkis, L.; Ginzburg, B.; Salomonski, N.; Kaplan, B.-Z. Magnetic Anomaly Detection Using a Three-Axis Magnetometer. IEEE Trans. Magn. 2009, 45, 160–167. [Google Scholar] [CrossRef]
  21. Zhang, J.; Tan, X.; Zheng, P. Non-Destructive Detection of Wire Rope Discontinuities from Residual Magnetic Field Images Using the Hilbert-Huang Transform and Compressed Sensing. Sensors 2017, 17, 608. [Google Scholar] [CrossRef] [Green Version]
  22. Mazurek, P.; Kwaśniewski, J.; Roskosz, M.; Siwoń-Olszewski, R. The use of a magnetic flux leakage in the assessment of the technical state of a steel wire rope subjected to bending. J. Konbin 2018, 48, 493–513. [Google Scholar] [CrossRef] [Green Version]
  23. Zhang, D.; Zhang, E.; Pan, S.; Yan, X.; Gao, W. Fast Quantitative Method to Detect the Cross-Sectional Loss of Wire Rope Defects. IEEE Trans. Instrum. Meas. 2021, 70, 6004411. [Google Scholar] [CrossRef]
  24. Zhang, J.; Zheng, P.; Tan, X. Recognition of Broken Wire Rope Based on Remanence using EEMD and Wavelet Methods. Sensors 2018, 18, 1110. [Google Scholar] [CrossRef] [PubMed]
  25. Mazurek, P.; Roskosz, M. Influence of the Earth’s magnetic field on the diagnosis of steel wire rope by passive magnetic methods. J. Magn. Magn. Mater. 2021, 547, 168802. [Google Scholar] [CrossRef]
  26. Mouradi, H.; El Barkany, A.; Biyaali, A. Investigation on the main degradation mechanisms of steel wire ropes: A literature review. J. Eng. Appl. Sci. 2016, 11, 1206–1217. [Google Scholar] [CrossRef]
  27. Liu, Z.; Liu, S.; Xie, C.; Bai, G. Non-Invasive Force Measurement Based on Magneto-Elastic Effect for Steel Wire Ropes. IEEE Sens. J. 2021, 21, 8979–8987. [Google Scholar] [CrossRef]
  28. Pineda-Sanchez, M.; Puche-Panadero, R.; Riera-Guasp, M.; Perez-Cruz, J.; Roger-Folch, J.; Pons-Llinares, J.; Climente-Alarcon, V.; Antonino-Daviu, J.A. Application of the Teager–Kaiser Energy Operator to the Fault Diagnosis of Induction Motors. IEEE Trans. Energy Convers. 2013, 28, 1036–1044. [Google Scholar] [CrossRef]
  29. SpinMeter-3D USB 3 Axis Magnetometer—Software Installation and User Guide. Available online: http://www.micromagnetics.com/product_page_spinmeter3.html (accessed on 20 August 2022).
  30. Gao, J.; Wang, J.; Zhang, L.; Yu, Q.; Huang, Y.; Shen, Y. Magnetic Signature Analysis for Smart Security System Based on TMR Magnetic Sensor Array. IEEE Sens. J. 2019, 19, 3149–3155. [Google Scholar] [CrossRef]
  31. Khan, M.A.; Sun, J.; Li, B.; Przybysz, A.; Kosel, J. Magnetic sensors-A review and recent technologies. Eng. Res. Express 2021, 3, 022005. [Google Scholar] [CrossRef]
  32. Yan, S.; Zhou, Z.; Yang, Y.; Leng, Q.; Zhao, W. Developments and applications of tunneling magnetoresistance sensors. Tsinghua Sci. Technol. 2022, 27, 443–454. [Google Scholar] [CrossRef]
Figure 1. Examined steel wire ropes: rope no. 1 in the middle, rope no. 2 at the top, and rope no. 3 at the bottom.
Sustainability 14 14641 g001
Figure 2. Measurement system: initial (delivery) state and state with damage.
Sustainability 14 14641 g002
Figure 3. Introduced damage to the rope.
Sustainability 14 14641 g003
Figure 4. Distribution of the magnetic induction B components along the ropes—initial state.
Sustainability 14 14641 g004
Figure 5. Distribution of the magnetic induction B components along the ropes—state with damage.
Sustainability 14 14641 g005
Figure 6. Difference ΔB between the magnetic inductions recorded in the state with discontinuity and the initial state.
Sustainability 14 14641 g006
Figure 7. Distribution of grad Bx and grad Bx_D along the ropes.
Sustainability 14 14641 g007
Figure 8. Distribution of grad By and grad By_D along the ropes.
Sustainability 14 14641 g008
Figure 9. Distribution of grad Bz and grad Bz_D along the ropes.
Sustainability 14 14641 g009
Figure 10. Distribution of the TKEO of Bx and Bx_D along the ropes.
Sustainability 14 14641 g010
Figure 11. Distribution of the TKEO of By and By_D along the ropes.
Sustainability 14 14641 g011
Figure 12. Distribution of the TKEO of Bz and Bz_D along the ropes.
Sustainability 14 14641 g012
Figure 13. Distribution of |B| and |B_D| along the ropes.
Sustainability 14 14641 g013
Figure 14. Distribution of B M = B x · B y · B z and B M _ D = B x _ D · B y _ D · B z _ D    along the ropes.
Sustainability 14 14641 g014
Figure 15. The maximum differences Δ B x and Δ B z .
Sustainability 14 14641 g015
Figure 16. The maximum of grad Bx_D and grad Bz_D.
Sustainability 14 14641 g016
Table 1. Details of the ropes.
No. of the Rope123
Cross sectionSustainability 14 14641 i001Sustainability 14 14641 i002Sustainability 14 14641 i003
Diameterø6.0 mmø6.5 mm
ø5.0 mm (metalic part)
ø5.1 mm
ø4.0 mm (metalic part)
Construction6 × 19S + IWRC(7 × 7)7 × 19W + IWRC(7 × 7)
coated
6 × 19S + IWRC(7 × 7)
coated
Publisher’s Note: MDPI stays neutral with regard to jurisdictional claims in published maps and institutional affiliations.

