Abstract
When deciding on and creating their own settlement environment, humans’ relationships with water resources have evolved. From the earliest times when they observed water and learned about its characteristics and laws to create artificial rivers, to the gradual development and use of water resources to create water plants and pumping stations, to the management of water resources to set up customs and dams to prevent and manage water hazards.To lay the groundwork for more sustainable development of the relationship between humans and water in the city, it is important to understand and summarize this state of change. Wuhan, known as the “City of a Thousand Lakes”, is a typical case of studying the traditional relationship between Chinese people and water, and can better provide modern cities with the value of historical experience in sustainable development. Therefore, this study takes the Hankou town of Wuhan from 1635 to 1949 as the research object, uses historical maps and written materials as data sources, and creates a database of historical information based on the water system of Hankou and the sites of artificial settlements such as buildings and streets. It takes quantitative analysis and map visualization techniques of the GIS platform from the perspective of quantitative historical research. Firstly, it creates a database of historical information based on the water system of Hankou and the sites of artificial settlements such as buildings and streets. Secondly, it gives the quantitation about the human–water relationship in Hankou by applying the spatial analysis methods of buffer analysis. The study’s findings demonstrate that from 1635 to 1864 there were an increasing number of artificial settlement sites that were distributed along the water system, keeping a reasonable distance from the water; from 1684 to 1905, people constructed dikes to prevent flooding, which resulted in an increase in urban space; and from 1905 to 1949, the development of Hankou shifted toward the Hanjiang River and the Yangtze River. The procedure shows a change in the relationship between avoiding water and subsequently managing water and using water. The results of the study indicate the following: (1) Water is essential for the environment of human settlements. (2) Human activities have an impact on the structure of water systems. (3) There is a high degree of coupling between the Hankou urban water system and the sites of artificial settlements. It proves that the relationship between humans and water is very close in the process of modern urbanization in Hankou. In building a traditional habitat environment to regulate water, it is consistent with the ancient Chinese concepts of “harmony between man and nature” and “the best place to live is close to water conservancy but also avoid flood.” This paper is helpful for re-examining and establishing the harmonious relationship between humans and water to encourage sustainable urban growth and reshape the urban spatial environment with Chinese characteristics. It also provides a method based on quantitative analysis for studying the evolution history of urban settlement environments.
1. Introduction
Some Chinese cities experienced issues during the country’s previous rapid urbanization process, including overuse of rivers and water pollution, which hampered the towns’ ability to grow sustainably. Despite the fact that urban waterfront space has been extensively addressed by nations throughout the world over the past several decades [1,2], the understanding of the interaction between humans and water and the development of water culture in various places provide a variety of conditions. We examine the environmental changes of ancient Chinese settlements and the ideas of human-habitat environments, attempt to sort out the evolution of human-habitat environments through regional case studies, empirically prove the ecological and environmental ideas of the ancients, and reconceptualize the traditional water culture and soil space resources in order to better promote the current Chinese urban construction model and the conservation and development of soil space resources. A more sustainable approach to solving environmental and resource problems in urban development can be facilitated by re-examining and reconstructing the historical experience and the wisdom of habitat formation.
The settlement environment is a significant carrier of human activity, and this carrier offers the prerequisites for both the start and growth of human activity as well as an environmental foundation. The natural ecological space, man-made physical space, and spiritual and cultural spaces all make up the settlement environment [3,4]. Due to the limitations of scientific and technical advancement, the majority of the main study objects for the early studies of settlement settings were based on historical map data and documentary records that were still in existence [5,6,7,8,9,10,11,12]. This group of studies derived the settlement environment of human activities from historical maps and pertinent documentary evidence [5], further examined the distribution maps of the settlement environment and population settlement densities [6], and outlined the constraints between human settlements and the environment [7]. Therefore, most of the early studies on the settlement environment were limited to the study of a single element. Currently, however, researches on settlement environments tend to explore the interrelationship between two or more elements, part of which examines the relationship between historical traces of the natural environment and human activities, such as studying the stratigraphic record of environmental resource bays [8], land use patterns [9], and the redness and tree pollen proxies [11]. Another part studies the preferences of settlement environments [10], spatial and cultural connotations [12], and elaborates the ecological concept of habitat based on historical maps and related literature surveys. Most of the current studies on settlements focus on population density [5,6,10,11], topography [7,8,9], and village space [10,12]. The analysis of natural water resources, however, is not given significant attention in this family of studies on the environmental elements of settlements, and the research techniques lack data support. Numerous studies have utilized interdisciplinary methods as a result of advancements in science and technology to examine patterns of urban settlement through the quantitative analysis of big data and GIS [1,2,13,14,15,16,17,18,19,20,21,22]. Some of these studies use GIS data management functions to establish relevant databases [13,18] to explore the relationship between settlement morphology and evolution; mapping functions are used to recover the different states of the study objects in historical periods [14,15,16,17,22]. In addition, there are interdisciplinary studies using the quantitative analysis function of GIS [15,18,19,20]. In contrast, domestic and international studies on big data tend to concentrate on historical changes at the urban scale or the single object, with little work being conducted on meso-town scales or the relationship between humans and water in city areas.
In the literature related to human–water relationship, most previous studies on human–water relationship have been conducted with information from hydrological data over a large time span [23,24], and there is a lack of cases of human–water relationship objects studied over a short period of several hundred years. The study of human–water relationship with one major river through several regions [25,26] lacks accurate research analysis for one region. In addition to quantitative techniques such as data analysis, some studies have demonstrated the close connection between humans and water through qualitative texts [27,28,29,30]. These studies include one that examines the relationship by establishing framework indicators [24], another that illustrates the foundation of the idea of coexistence with water [27], and two more that investigate the evidence from historical experiences captured in historical data [28,29]. There is a dearth of counterevidence studies on the environmental development process and human–water relationship at the urban level through reverse thinking, and the current research on human–water relationshiip is more focused on the examination of existing data in a forward-thinking method.
Taking the formation and development of Hankou in Wuhan as an example, the history of traditional habitat development in ancient China and the traditional human–water relationship is the main topic of this study. According to the Chinese history, 1949 is regarded as the founding of the People’s Republic of China, which was the beginning of the modern period in China and meant the end of ancient China. The Hanjiang River was diverted, and a port was built on the shore of Hankow, allowing people to trade and congregate there to form a town, giving birth to the town of Hankow in Wuhan. Additionally, since flooding occurred on the north side of Hankow every year during the rainy season, the then-manager of Hankow proposed to build the Yuan Gong Dike in 1635 to prevent floods (the first man-made dike in the recorded history of Hankow). Therefore, the period 1635–1949 was selected as the time boundary to study the relationship between humans and water in the historical period of Hankow, China.
The main innovations of this paper are:
- The GIS platform is used to create a database of historical information for Hankou, Wuhan, to perform spatial analyses on historical geographic information elements, such as buffer analysis and density analysis. The buffer area analysis is used to quantify the distribution of artificial settlement sites within the buffer area of the Hankow water system; the kernel density estimation method is used to study the spatial density distribution of point elements and reveal the distribution characteristics of artificial settlement sites in different periods. The density distribution of line elements is used to reveal the distribution characteristics of street evolution in different periods.
- This paper analyzes and summarizes the coupling relationship between the water system and the sites of artificial settlements at the level of the town, whereas previous studies on the relationship between humans and water have mainly focused on the modern period and the historical changes of a single research object. The results of this research demonstrate how closely related the Hankow people and water are, and have verified the ancient Chinese traditional habitat creation and water management ideas of “harmony between man and nature” and “ the best place to live is close to water conservancy but also avoid flood.”
2. Materials and Methods
2.1. Study Area
Wuhan, often known as the “City of Thousands of Lakes”, is a major city in central China. It is located where the Yangtze and Hanjiang rivers converge. The Hanjiang River’s diversion, which is a typical case for researching the historical human–water relationship, was fundamental to the development of Wuhan’s modern Hankou town; Figure 1. One of Wuhan’s three towns is Hankou (Figure 1), and the Hanjiang River’s diversion gave Hankou town an excellent geological foundation. With a history of only five hundred years since its birth, traces of the city’s historical evolution can be seen in the existing environment. Hankou’s artificial physical space and the natural water system have long battled each other, resulting in a stable environment for habitation. In order to recover the environmental evolution of the human–water relationship in Hankou through map visualization, this paper uses the water system and the sites of artificial settlements in Hankou as its research object. This paper’s primary goal is to examine the characteristics of the human–water relationship in Hankou, and more specifically, to examine and describe the coupling between the water system and the sites of artificial settlements there between 1635 and 1949, a time when the Hanjiang River was diverted and helped to create the town; As 1949 is widely regarded as the end of ancient China. In order to fulfill the goals of this study, the period 1635–1949 was chosen as the temporal boundary.
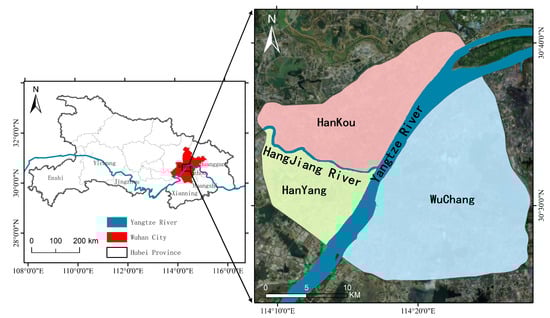
Figure 1.
Hubei Province of China. Image source: Standard map service website production. https://www.resdc.cn.
2.2. Data Collection
This study examines the spatial and temporal distribution of the artificial settlement sites (the locations of numerous sites left by ancient ancestors to explore their surroundings), including historical buildings, bridges, gates, and streets within the study area, which are derived from relevant historical documents, in which maps record the pertinent locations of artificial settlement sites. This study’s findings provide insight into human activities in the historical period of Hankou. In this study, such raster image data are manipulated for vectorization. Considering the long period of the study, typical historical maps are selected and imported onto the GIS platform to vectorize the information elements.
The main historical map data Table 1 and Figure 2 are shown. In this study, we digitally extracted the raster data, produced related thematic maps through the digital operation of GIS, and performed kernel density, line density, and buffer area analysis on the extracted elements by using the spatial analysis function of GIS.

Table 1.
Contents of the attribute table format of the historical information database.
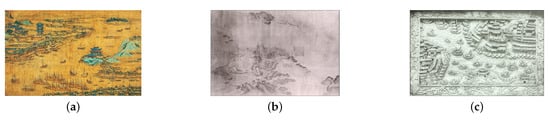
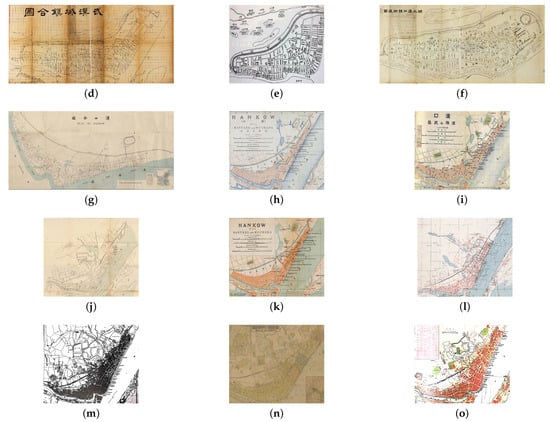
Figure 2.
Detailed historical map (Hankou area). (a) The View of Jianghan. (b) The Map of Wuchang Riverbank. (c) Relief Map of the Three Towns of Wuhan. (d) Wuhan City Map (Hankou). (e) Hankou Street Map of the Continuing Hanyang County. (f) Hankou Town Street Map of Hubei. (g) Plan of Hankow. (h) Hankow with Hanyang and wuchang. (i) Hankow Hanyang and Wuchang. (j) Map of Three Towns in Wuhan. (k) Hankow with Hanyang and Wuchang. (l) Hankow. (m) Wuhan City Street Map. (n) The latest detailed street map of Wuhan city. (o) Detailed street map of New Wuhan City.
Since there were no historical records specifically about Hankow prior to the early Qing dynasties (around the middle of the 17th century), information about Hankow before 1877 often appears in the historical records of the Hanjiang river, the three towns of Wuhan, the Hanyang County Records, and the Wuchang County Records. Hankow has some very old historical records, however, most of them are a bit disjointed and irregular. The old maps documenting Hankou are as follows: the relevant old maps before 1877 are traditional Chinese geomantic omen maps, the geomantic omen (also called Chinese Fengshui) map is a kind of ancient map that depicts the relationship between geographical conditions and planning layout of tombs, residences, and city sites. Meanwhile, the maps in 1864, 1868, and 1877 contain a large number of relative location relationships and names of historical site points. It may be due to the different logical rules of Chinese map making and foreign map making. As a result, this study processes old maps using overlay analysis by locating information points that are identical across different maps and overlaying them to obtain the relative location analysis maps of Hankow water system and artificial settlement sites respectively.
2.3. Methodological Model
In this study, the technique of data spatial analysis and visualization of GIS is used to describe and evaluate the human–water relationship in Hankou. The framework of the method is proposed in Figure 3. The method is divided into three parts: collection and digitization operation of historical maps, map visualization, related thematic maps, and spatial analysis Figure 3.
Figure 3.
Methodological model.
- Digitization: the specific content refers to the compilation and collection of historical textual information and historical maps related to the natural ecological space and artificial physical space in the Hankow settlement environment, and the import of this paper-based information into the GIS platform.
- Map visualization and related thematic maps: the specific content refers to importing the information of river systems such as lakes and rivers as natural ecological spaces and artificial settlement sites such as historical buildings, bridges, gates, and roads as artificial physical spaces into the GIS platform. The location analysis maps of the water system, the artificial settlement sites, and the location analysis maps between the water system and the artificial settlement sites are created in accordance with the information related to the water system and the artificial settlement sites that are expressed through GIS visualization.
- Spatial analysis: the specific content refers to studying the information on the river system of natural ecological space and the information of historical sites of artificial material space. The spatial relationship such as the density analysis and buffer analysis of pertinent elements in the urban settlements is studied using the GIS platform, as is the coupling association between the Hankou water system and the artificial settlement sites.
2.3.1. Digitization
After matching and calibrating the collected historical maps, the digitization operation is used for statistical combining of the relevant textual information of the construction period and historical events of the artificial settlement sites, which are recorded in the Wuhan Geographical Names, Hankow Series, Xiakou County Records, etc. The contents of the attribute table of the Hankow Historical Information Database are established as in Table 2.
Table 2.
Contents of the attribute table format of the historical information database.
By calibrating the information recorded on the historical map and analyzing it with the historical textual records to corroborate each other, we obtained information on the location, construction time, and events of the water system and the artificial settlement sites Figure 4, Figure 5 and Figure 6. The historical GIS database thus established.
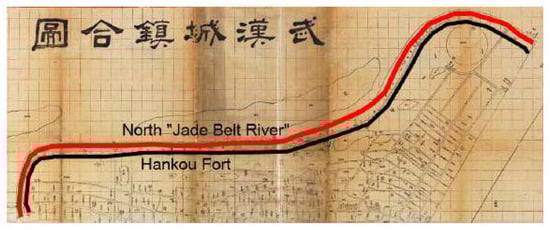
Figure 4.
Diagram of the Yudai River and North Yudai River. Image source: This drawing is based on the 1864 “Wuhan City Map (Hankou)”.
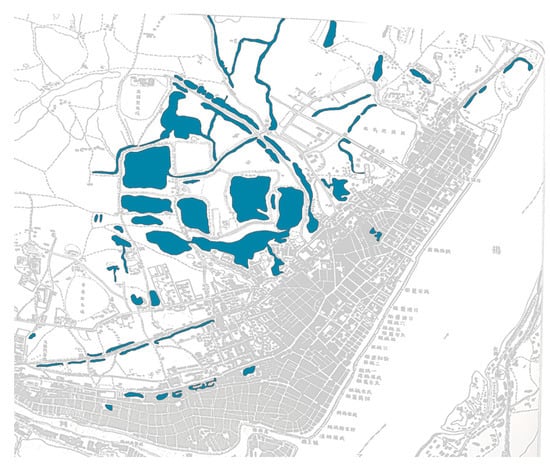
Figure 5.
Schematic diagram of the layout of water systems during 1932 based on GIS. Image source: This drawing is based on the 1932 “Wuhan City Street Map”.
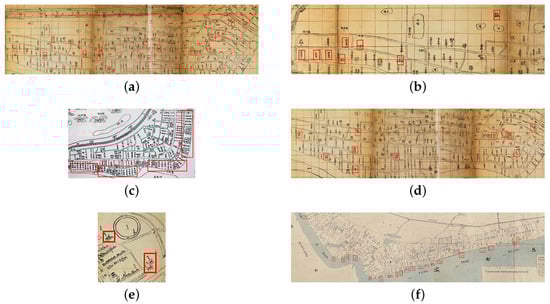
Figure 6.
Point element information in historical maps. (a) Guildhalls in the historical map. Image source: This drawing is based on the 1864 “Wuhan City Map (Hankou). (b) Temple buildings in the historical map. Image source: This drawing is based on the 1864 “Wuhan City Map (Hankou)”. (c) Wharf buildings in the historical map. Image source: This drawing is based on the 1868 “Hankou Street Map of the Continuing Hanyang County”. (d) Official buildings in the historical map. Image source: This drawing is based on the 1864 “Wuhan Town Map (Hankow)”. (e) Official buildings in the historical map. Image source: This drawing is based on the 1877 “ Hankou Town Street Map of Hubei”. (f) Wharf buildings in the historical map. Image source: This drawing is based on the 1909 “Plan of Hankow”.
2.3.2. Spatial Analysis
Buffer Analysis
The buffer area is the basic spatial operation of the Geographic Information System (GIS), and it can be applied to spatial analysis of roads [31], rivers [32,33], resource allocation [34], land planning [35], and many other related fields [36,37].
A buffer area is a polygonal area with specified widths generated by setting specific values of buffer radii around geographic elements, such as points, lines, and polygons. Depending on the different geometric types of spatial objects, buffers are constructed in different ways. From a mathematical point of view, a buffer area is a space that satisfies certain conditions, and the mathematical expression is as follows.
where is the interesting object; R is the radius of the interesting field; d is the smallest Euclidean geometric distance; is the set of all points from with radius R.
This study quantifies the distribution of artificial settlement sites in the buffer area of the Hankou river system with the help of buffer area analysis. The main justification is that the buffer area contains most of the artificial settlement sites close to the buffer object, and the relationship between natural ecology and artificial materials in the urban settlement environment is indicated by setting distance parameters and other relevant parameters.
Density Analysis
Spatial statistics plays an important role in the description and presentation of spatial events [38,39,40]. Kernel Density Estimation (KDE) is the most commonly used method in this class of statistics, which will always give the correct results [41,42,43]. KDE has been used in research [44,45,46] to pinpoint spatial patterns and compute densities in time. They can also be used to weghtedly examine incidents [47,48].
The Kernel Density Estimation (KDE) generates a spatially continuous density surface of point element data by calculating the density of discrete points within a window and using it as the window centroid to demonstrate spatial characteristics and trends. A higher kernel density indicates a denser distribution of point elements. The specific calculation formula is as follows.
where is the estimated value of the kernel density at the point x; is the distance between the building point x and point ; h is the search radius; n is the number of points in the search range; is the kernel function [49].
In this study, we use KDE to study the spatial density distribution of point elements from 1635 to 1905 and reveal the distribution characteristics of historical sites in different periods.
The line density analysis tool is used to calculate the density of line elements in the neighborhood of each output raster pixel, and the density is measured in length units/area units. Line density analysis can be used to understand the density of roads that impact wildlife habitats [50] or the density of utility lines in towns and cities, to estimate the attractiveness of urban spaces for pedestrian traffic [51], and to estimate utilization distribution and home ranges [45].
According to this definition of line density, line density can be expressed as the ratio of the length of network paths within a parcel to the area of the parcel. The specific calculation formula is as follows.
where is the length of the road network; x in a certain area A; A is the whole area with a radius R.
This paper uses line densities and their distribution, to reveal the distribution characteristics of streets in different periods.
3. Results and Discussion
3.1. Map Visualization and Related Thematic Maps
By organizing and analyzing the data collection and using visualization techniques in the GIS platform, the relevant information is obtained and the location analysis maps of the water system Figure 7, Figure 8, Figure 9 and Figure 10 and the artificial settlement sites and the location analysis maps between the water system and the artificial settlement sites Figure 11, Figure 12 and Figure 13 are created.
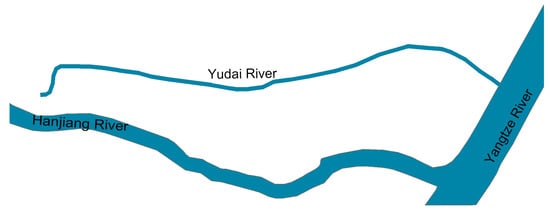
Figure 7.
Location map of the Yudai River in 1635.
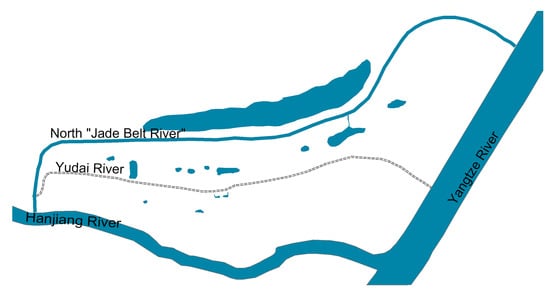
Figure 8.
Location map of the North “Yudai River” (i.e., the moat) and the “Yudai River in 1864.
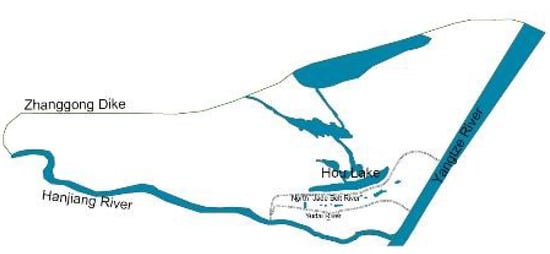
Figure 9.
Location map of Houhu water system in 1905.
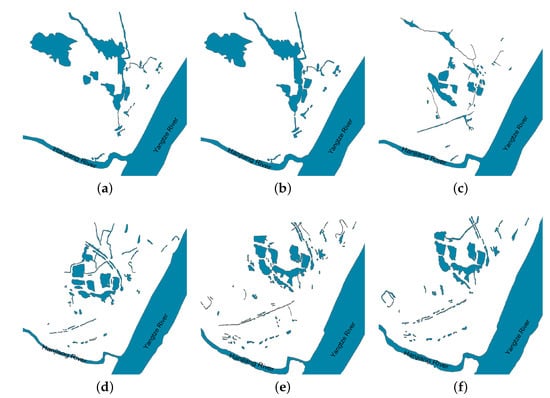
Figure 10.
The spatial-temporal evolution of the Hankou water system from 1905 to 1949. From the top left corner to the bottom right one, the time is 1915, 1924, 1927, 1932, 1938, 1949, respectively. (a) the distribution of the water systems in 1915; (b) the distribution of the water systems in 1924; (c) the distribution of the water systems in 1927; (d) the distribution of the water systems in 1932; (e) the distribution of the water systems in 1938; (f) the distribution of the water systems in 1949.
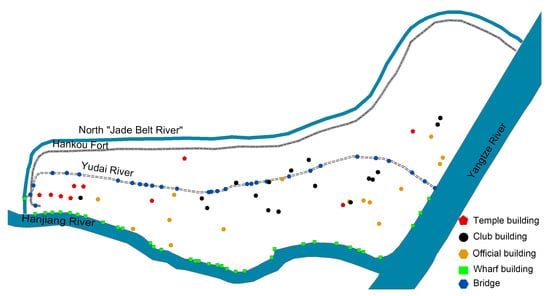
Figure 11.
Distribution map of artificial settlement sites in the period 1635–1864.
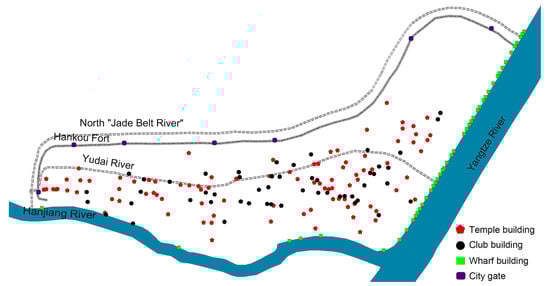
Figure 12.
Distribution map of artificial settlement sites in the period 1864–1905.
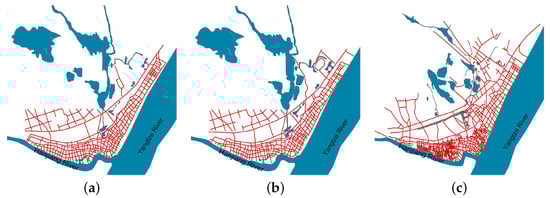
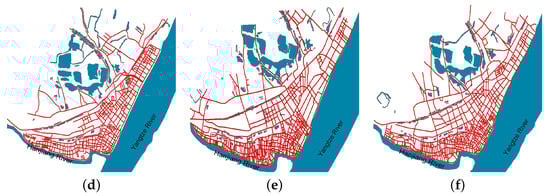
Figure 13.
The historical evolution of the street system in the Hankou area from 1905 to 1949. From the top left corner to the bottom right one, the time is 1915, 1924, 1927, 1930, 1938, 1949: (a) the map of the street system in 1915; (b) the map of the street system in 1924; (c) the map of the system system in 1927; (d) the map of the system system in 1932; (e) the map of the system system in 1938; (f) the map of the system system in 1949.
The water system pattern in Hankou had the following changes between 1635 and 1949, according to the visualization analysis.
From 1635–1864, it changed from two rivers (Hanjiang River and Yangtze River) and their tributary (Yudai River) to two rivers (Hanjiang River and Yangtze River) and their tributary (North Yudai River).
From 1864–1905, it changed from two rivers (Hanjiang River and Yangtze River) and their tributary (North Yudai River) to two rivers (Hanjiang River and Yangtze River) and one lake (Houhu Lake).
From 1905–1949, it changed from two rivers (Hanjiang River and Yangtze River) and one lake (Houhu) to two rivers (Yangtze River and Hanjiang River) and many lakes.
We examine and evaluate the spatial and temporal distribution of the artificial settlement sites in Hankou during these phases based on the three phases of the above-mentioned changes in the water system pattern in Hankou.
In addition, this subsection produces a map of the distribution of the Hankow water system and establishes a database of the historical water system of Hankow, which is a historical sorting and summary of this part of the Hankow water system research object.
The following information can be obtained from the map visualization and related thematic map of the artificial settlement sites in Hankou: from 1635 to 1864, there were an increasing number of artificial settlement sites that were distributed along the water system, keeping a reasonable distance from the water; the distribution center of Hankou wharf buildings shifted from the Hanjiang River to the Yangtze River. As the objects of urban construction concern and the recorded objects in the related historical maps changed, the focus of the artificial settlement sites in this paper in the period of 1905–1949 shifted from historical buildings to streets, and the streets become denser and tended to extend northward and eastward in that period.
3.2. Spatial Analysis
3.2.1. Buffer Area Analysis
The river systems and artificial settlement sites within the same period in Hankou’s history are sorted out and spatially analyzed: in the buffer area formula, Oi is the river line segment of the Yudai River, R is the linear unit radius of 100, d is the minimum Euclidean geometric distance set by the original GIS parameters, and Bi is the set of all artificial settlement sites within the buffer area from the river line segment of the Yudai River. To quantify the river system and artificial settlement sites, the number of sites within the buffer area of the river systems is employed, and the distribution of the relationship between them over the period 1635–1905 is obtained Figure 14a–c and Figure 15.
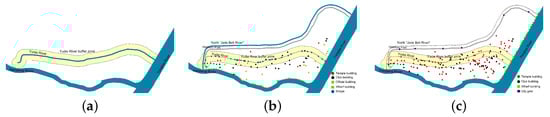
Figure 14.
Distribution of the water system and historical relics in the Hankou area: (a) The buffer zone of “Yudai River” and the historical sites in 1635; (b) The buffer zone of “Yudai River” and historical sites in 1864; (c) The buffer zone of “Yudai River” and historical sites in 1905.
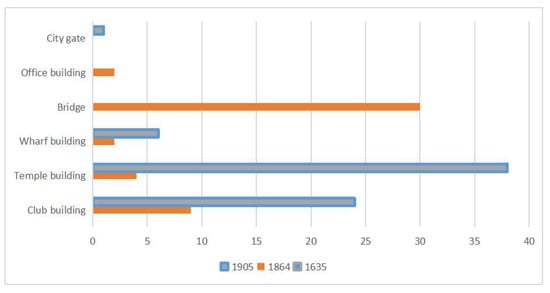
Figure 15.
Bar chart of the Yudai River buffer area in relation to historical sites.
3.2.2. Density Analysis
Kernel Density Analysis
In the kernel density formula, is the estimated kernel density of historical building points of the artificial settlement sites in Hankou; is the range between building point x and point ; h is the search radius set by the original GIS parameters; n is the number of historical building points within the search range; is the kernel function of the kernel density analysis of the sites of the Hankow artificial settlement from 1635–1864 and 1864–1905. Table 3 is obtained with the above parameter settings and output pixel size of 6.13, carried out for different periods; Figure 16.
Table 3.
Table of parameters corresponding to the kernel density analysis formula.
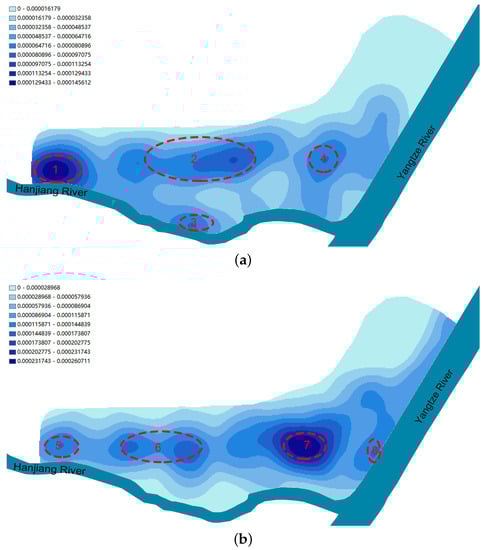
Figure 16.
(a) Kernel density analysis of artificial settlement sites in Hankou during the period 1635–1864. (b) Kernel density analysis of artificial settlement sites in Hankou during the period 1864–1905.
There were four primary areas of higher density within the city of Hankou during the era of 1635–1864, which suggests that Hankou was already taking shape as a town at that time. This was shown by comparing the kernel density analysis maps for both periods (Figure 16). Of the four areas, Region 1 had the highest density and was located around the confluence of the Yudai River and the Hanjiang river, indicating that when Hankou was first established, it was likely constrained by social, environmental, and technological limitations, and because the Hanjiang river is smaller than the Yangtze River, it was more convenient for the people of Hankou to live and work there. Region 2 had a larger population density, indicating that the people’s living space was not just in the vicinity of the confluence of the Yudai and Hanjiang rivers, but also within the Hankou region.
During the years 1864 to 1905, Hankou had four primary areas with higher densities, with Region 7 in the city’s heart, close to the confluence of the Yangtze and Hanjiang rivers, having the highest density. This shows that continuous improvement of science and technology, the city’s rapid social and economic development, the entrance of sophisticated Western doctrines, and the use of huge ships after the opening of Hankou increased the city’s need for production and living, which resulted in the building of a new town center in Region 7. The original Region 7 was Region 4 during the period 1635–1864, indicating that Hankou’s ongoing development led to Region 7’s success rather than it occurring overnight. Region 3 was no longer one of the centers of Hankou, and instead, Hankou’s new center was Region 8. However, the development of Region 8, which is located along the Yangtze River, shows that Hankou’s population was consistently moving east with their activities.
The inner city of Hankou gradually shifted eastward from the meeting point of the Yudai River and the Hanjiang River to the region along the Yangtze River, according to the nuclear density analysis of the aforementioned two historical periods. The reason for this is that, with the development of the city, the progress of science and technology, and the introduction of advanced Western theories and large ships after the opening of Hankou, the hydrological conditions of the Hanjiang River and the width of the river no longer suited the needs of mooring, which had a significant impact on Hankou—the center of Hankou town began at the Hanjiang riverside of the western part of Hankou along the river and kept developing to the east.
Line Density Analysis
The morphological changes of streets as a sort of functional urban space are inextricably linked to social production and social practice processes. After 1905, the construction of streets was the primary focus of urban development in the Hankou region. The coupling relationship between streets and river systems from 1905 to 1949 is the main topic of this study. The amount of people living in an area is directly reflected in the density of the streets.
In the line density formula: R is the default radius value of GIS; is the line density value of the street line segment; is the length of the street in the street network; A is the area of the circle with default parameter radius R. Based on the relevant comparative study requirements and parameter settings, this study is conducted with the search radius R of 35.62 and the output pixel size of 4.27, respectively, for density analysis, to obtain the street–river system relationship map and its corresponding line density map during the period 1905–1949 in Figure 17.
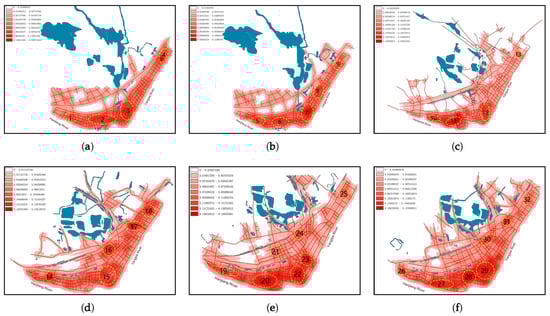
Figure 17.
The Street layout and density analysis of the Hankou area from 1905 to 1949. From the top left corner to the bottom right, the time is 1915, 1924, 1927, 1932, 1938, 1949: (a) the Street layout and density analysis in 1915; (b) the Street layout and density analysis in 1924; (c) the Street layout and density analysis in 1927; (d) the Street layout and density analysis in 1932; (e) the Street layout and density analysis in 1938; (f) the Street layout and density analysis in 1949.
The city streets continued to extend to the north throughout the years 1905–1949, as shown by the street distribution map in Figure 17. This is because the Hanjiang River borders Hankou to the south; as a result of such natural circumstances, the city could only keep growing to the north, and the streets continued to spread into the water system.
Based on the characteristics of the corresponding line density maps during the period 1905–1949 we learn the following (shown in Figure 17):
- The density centers of streets in 1915, shown in Figure 17a, were mainly located in Regions , where Regions 1 and 2 were located along Hanjiang River while Regions 3 and 4 were along the Yangtze River.
- The density centers of streets in 1924, shown in Figure 17b, were mainly located in Regions , where Regions 5 and 6 were located along Hanjiang River while Regions were along the Yangtze River.
- The density centers of the streets in 1927, shown in Figure 17c, were mainly located in Regions , where Region 10 and 11 were located along the Hanjiang River while Region 12 and 13 are along the Yangtze River.
- The density centers of the streets in 1932, shown in Figure 17d, were mainly located in Regions , where Region 14 was located along Hanjiang River, Regions 15 and 18 were along the Yangtze River, while Regions 16 and 17 were closer to the inner city water system of this city.
- The density centers of streets in 1938, shown in Figure 17e, were mainly located in Regions , where Regions 19 and 20 were located along Hanjiang River, Regions 22, 23, and 25 were along the Yangtze River, while Regions 21 and 24 were closer to the internal water system of this city.
- The density centers of the streets in 1949, shown in Figure 17f, were mainly located in Regions , where Regions 26 and 27 were along the Hanjiang River, Regions 29 and 32 were along the Yangtze River, Region 28 at the confluence of the Hanjiang River and the Yangtze River, while Region 30 and 31 were closer to the inner water system.
By checking the road–water system relationship map and its corresponding line density map from 1905 to 1949, we can see that the riverbank area along the Hanjiang River and Yangtze River is in a high-density area, which is due to the fact that the confluence of the Hanjiang River and the Yangtze River has always been the center of gravity for urban road traffic.
This phenomenon indicates that the human–water relationship was very close, and the development of Hankou town and the development of Hankou shifted toward the Hanjiang and Yangtze rivers. Because Hankou is at the confluence of the Hanjiang river and the Yangtze River, its excellent geographical location and water transportation advantages have made its internal streets centered around the Yangtze River and the Hanjiang river. However, starting in 1932, the region around the city’s internal river system also started to be heavily populated with streets. This is because Hankou’s construction and development were no longer restricted to the city’s large river system after the opening of Hankou, and new planning and engineering ideas and technologies were introduced. Instead, Hankou’s residents could more easily further integrate into the natural environment by utilizing large water facilities, which sparked construction and development within the local community.
The results indicate that there is a close connection between the Hankow people and the water, based on the extraction and compilation of data from the Hankow water system and artificial settlement sites to create a database of historical Hankow knowledge.
The process of the human-water relationship over the course of Hankou’s urban history can be divided into three phases as a result of changes in technology and ideas: the period of proximity to the water system from 1635–1864, the period of avoiding flooding from 1864–1905, and the period of using the water system from 1905–1949. The pattern of the human-water connection in Hankou, which changed from hostility to harmonious co-development, is reflected in the shift in the relationship between people and the water system from water avoidance to water management to water usage. According to the study on the historical development of this type of human-water relationship in Hankou, the city’s growth is consistent with the Chinese traditional idea of habitat construction stated in Guanzi, which is that “The best place to live is close to water conservancy but also avoid flood.”
4. Conclusions
Activities near water systems have long been prioritized by humans, and historically, rivers have been both a key region for urban growth and an essential element of city life. Some Chinese cities experienced issues during the country’s previous rapid urbanization process, including overuse of rivers and water pollution, which hampered the towns’ ability to grow sustainably. Therefore, the focus of this paper is on the environmental changes of settlements and the thought of human habitat in ancient China, so as to clarify the evolution of human habitat, sort out the relationship between humans and water, and provide historical experience for the sustainable development of cities. This study analyzes the coupling relationship between humans and water in Hankow using GIS spatial analytic techniques such as buffer analysis and density analysis [51,52,53,54,55,56,57,58,59,60,61,62], in contrast to the intimate interaction between humans and water described through qualitative texts [27,28,29,30]. It also offers a quantitative analysis-based analytical approach for researching the history of environmental evolution in urban settlement environments.
This study, in addition, differs from studies that use GIS and big data for quantitative analysis of geographic distribution characteristics and settlement evolution [13,15,19,20] as well as studies of single items utilizing the GIS’s cartographic function [14,16,17,18,22]. This study investigates the relationship between Hankou’s urban growth and its natural waterways in two dimensions, beginning with the construction of Hankou’s first artificial river (1635) and ending with the fall of ancient China (1949).
Unlike previous qualitative studies of urban settlements and water systems with separate textual descriptions, this study uses historical map translation tools and the data management function of GIS to establish the historical geographic information database of Hankou, Wuhan (a database specifically established for the subject of this study, and multiple information on different elements can be added in the future to improve the historical geographic information database of Hankou) and visualizes the water system and artificial settlement. The distribution of the Hankou water system and artificial settlement sites can be visualized through the mapping function. Additionally, through quantitative spatial analysis of GIS, the buffer zone analysis and density analysis of the Hankou water system and artificial settlement sites were obtained, proving the close connection between humans and water in Hankou in the past and validating the ancient idea that “the best place to live is close to water conservancy but also avoid flood” is a necessity for the development of human living environments and water management.
The main innovations of this paper are:
- Water is very important for the human settlement environment, and the city’s location depends greatly on its water system. The basic geographic conditions for the construction of the city are provided by the water system’s environment, and this environment also draws people to the city [63,64].
- Human activities influence the pattern of the water system. Hankou’s water system changed from having two rivers (the Hanjiang River and the Yangtze River) and their tributary, the Yudai River, in 1635 to having two rivers (the Hanjiang River and the Yangtze River) and their tributary, the North Yudai River, in 1864 to having two rivers (the Hanjiang River and the Yangtze River) and one lake (the Houhu Lake) in 1905 to having two rivers and many lakes in 1949.The evolution of the habitat, which is the urban environment, has been influenced by human management of water.
- The water system has a high degree of coupling with the artificial settlement sites. A coupling relationship between the Hankou water system and the artificial settlement sites is discovered after coupling research was carried out in both the temporal and spatial dimensions.
In our upcoming work, we will use quantitative analysis research methods to further examine various regional cities with an abundance of water resources (such as Wuhan Wuchang, Wuhan Hanyang, Nanjing, etc.); on the other hand, we will investigate the problem of human-water relationships in contemporary Chinese cities after 1949. Additionally, we can further add different element information to improve the historical geographic information base, using single element information of the database or multiple element information to further investigate the coupling relationship between human actions and other elements at a larger scale.
Author Contributions
Conceptualization, H.Z. and W.X.; methodology, H.Z. and C.C.; investigation, H.Z., C.C. and L.S.; data curation, C.C.; formal analysis, H.Z. and C.C.; writing—original draft preparation, C.C. and H.Z.; writing—review and editing, H.Z., C.C. and L.S.; visualization, C.C.; supervision, H.Z. and W.X.; project administration, H.Z. All authors have read and agreed to the published version of the manuscript.
Funding
This research is funded by the Ministry of Education, Humanities and Social Sciences Youth Fund (Grant number: 20YJC760145), Humanities and Social Sciences Fund of Hubei Education Department (Grant number: 20Y044), Hubei University of Technology Green Industry Science and Technology Leading Program (Grant number: XJ2021005501), and Innovation Demonstration Base of Ecological Environment Geotechnical and Ecological Restoration of Rivers and Lakes (2020EJB004).
Institutional Review Board Statement
Not applicable.
Informed Consent Statement
Written informed consentis obtained from all participants.
Data Availability Statement
The data presented in this study are available on request from the corresponding author.
Conflicts of Interest
The authors declare no conflict of interest.
References
- Jia, Y.; Tang, X.; Liu, W. Spatial–Temporal Evolution and Correlation Analysis of Ecosystem Service Value and Landscape Ecological Risk in Wuhu City. Sustainability 2020, 12, 2803. [Google Scholar] [CrossRef]
- Shi, S.; Kondolf, G.M.; Li, D. Urban River Transformation and the Landscape Garden City Movement in China. Sustainability 2018, 10, 4103. [Google Scholar] [CrossRef]
- Ye, Z. Study on the Spatial Structure of Chinese Traditional Settlement Environment. J. Beijing Univ. Civ. Eng. Archit. 2001, 17, 6. (In Chinese) [Google Scholar]
- Ye, Z. Analysis on the spatial structure of traditional settlement environment. Archit. J. 2001, 4. (In Chinese) [Google Scholar] [CrossRef]
- Fellows-Jensen, G. Viking settlement in the Northern and Western Isles—the place name evidence as seen from Denmark and the Danelaw. In The Northern and Western Isles in the Viking World: Survival, Continuity and Change; BIAB (British Archaeological Abstracts (BAA)): St Andrews, UK, 1984; pp. 148–168. [Google Scholar]
- Arge, S.V.; Sveinbjarnardóttir, G.; Edwards, K.J.; Buckland, P.C. Viking and medieval settlement in the Faroes: People, place and environment. Hum. Ecol. 2005, 33, 597–620. [Google Scholar] [CrossRef]
- Knottnerus, O.S. History of human settlement, cultural change and interference with the marine environment. Helgol. Mar. Res. 2005, 59, 2–8. [Google Scholar] [CrossRef]
- Shtienberg, G.; Gadol, O.; Levy, T.E.; Norris, R.D.; Rittenour, T.M.; Yasur-Landau, A.; Lazar, M. Changing environments and human interaction during the Pleistocene–Early Holocene from the shallow coastal area of Dor, Israel. Quat. Res. 2022, 105, 64–81. [Google Scholar] [CrossRef]
- Luo, J.; Zhou, T.; Du, P.; Xu, Z. Spatial-temporal variations of natural suitability of human settlement environment in the Three Gorges Reservoir Area—A case study in Fengjie County, China. Front. Earth Sci. 2019, 13, 1–17. [Google Scholar] [CrossRef]
- Tan, B.; Wang, H.; Wang, X.; Yi, S.; Zhou, J.; Ma, C.; Dai, X. The study of early human settlement preference and settlement prediction in Xinjiang, China. Sci. Rep. 2022, 12, 5072. [Google Scholar] [CrossRef]
- Dong, G.; Yang, Y.; Zhao, Y.; Zhang, X.; Li, X.; Chen, F. Human settlement and human–environment interactions during the historical period in Zhuanglang County, western Loess Plateau, China. Quat. Int. 2012, 281, 78–83. [Google Scholar] [CrossRef]
- Wang, H.; Chiou, S. Study on the sustainable development of human settlement space environment in traditional villages. Sustainability 2019, 11, 4186. [Google Scholar] [CrossRef]
- Zhao, F.; Fu, Y.; Luan, G.; Zhang, S.; Cai, J.; Ding, J.; Qian, J.; Xie, Z. Spatial-Temporal Characteristic Analysis of Ethnic Toponyms Based on Spatial Information Entropy at the Rural Level in Northeast China. Entropy 2020, 22, 393. [Google Scholar] [CrossRef] [PubMed]
- John, H.; Elton, H.; Newhard, J. (Eds.) Archaeology and Urban Settlement in Late Roman and Byzantine Anatolia: Euchaïta-Avkat-Beyözü and Its Environment; Cambridge University Press: Cambridge, UK, 2018. [Google Scholar]
- Breivik, H.M. Dynamic Relations between Humans and Environment in the Earliest Settlement Phase of Norway (9500–8000 cal BC); NTNU: Trondheim, Norway, 2016. [Google Scholar]
- Gaspar, J.A.; Roset, R.; Ramos, N.; Kimaid, M.; Adami, A.; Guerra, F.; Gartner, G. International web journal on sciences and technologies affined to history of cartography and maps. In Symposium on Cartography and Art; Volume 251, p. 256. Available online: http://www.e-perimetron.org/Vol_3_4/Vol3_No4_Cont.pdf (accessed on 17 September 2022).
- Mirabella Roberti, G.; Nannei, V.M.; Azzola, P.; Cardaci, A. Preserving the Venetian Fortress of Bergamo: Quick Photogrammetric Survey for Conservation Planning. International Archives of the Photogrammetry, Remote Sensing & Spatial Information Sciences. 2019. Available online: https://pdfs.semanticscholar.org/7145/0f90ce84a24d45d54ab6d97ad041d7edf1de.pdf (accessed on 17 September 2022).
- Wu, J.; Lu, Y.; Gao, H.; Wang, M. Cultivating historical heritage area vitality using urban morphology approach based on big data and machine learning. Comput. Environ. Urban Syst. 2022, 91, 101716. [Google Scholar] [CrossRef]
- Zhang, Z.; Xiao, R.; Shortridge, A.; Wu, J. Spatial point pattern analysis of human settlements and geographical associations in eastern coastal China—A case study. Int. J. Environ. Res. Public Health 2014, 11, 2818–2833. [Google Scholar] [CrossRef]
- Gorbenkova, E.; Shcherbina, E. Historical-Genetic Features in Rural Settlement System: A Case Study from Mogilev District (Mogilev Oblast, Belarus). Land 2020, 9, 165. [Google Scholar] [CrossRef]
- Zheng, S.; Han, B.; Wang, D.; Ouyang, Z. Ecological wisdom and inspiration underlying the planning and construction of ancient human settlements: Case study of hongcun UNESCO world heritage site in China. Sustainability 2018, 10, 1345. [Google Scholar] [CrossRef]
- Liu, J.; Zou, Q.; Hu, Q.; Zhang, C. A Settlement Landscape Reconstruction Approach Using GIS Analysis with Integrated Terrain Data of Land and Water: A Case Study of the Panlongcheng Site in the Shang Dynasty (Wuhan, China). Remote Sens. 2021, 13, 5087. [Google Scholar] [CrossRef]
- Lu, Z.; Wei, Y.; Xiao, H.; Zou, S.; Xie, J.; Ren, J.; Western, A. Evolution of the human–water relationships in the Heihe River basin in the past 2000 years. Hydrol. Earth Syst. Sci. 2015, 19, 2261–2273. [Google Scholar] [CrossRef]
- Wang, J.; Wei, Y.; Jiang, S.; Zhao, Y.; Zhou, Y.; Xiao, W. Understanding the human-water relationship in China during 722 BC-1911 ADfrom a contradiction and co-evolutionary perspective. Water Resour. Manag. 2017, 31, 929–943. [Google Scholar] [CrossRef]
- Ding, Y.; Tang, D.; Dai, H.; Wei, Y. Human-water harmony index: A new approach to assess the human water relationship. Water Resour. Manag. 2014, 28, 1061–1077. [Google Scholar] [CrossRef]
- Zuo, Q.; Diao, Y.; Hao, L.; Han, C. Comprehensive evaluation of the human-water harmony relationship in countries along the “belt and road”. Water Resour. Manag. 2020, 34, 4019–4035. [Google Scholar] [CrossRef]
- Simmons, B.; Woog, R.; Dimitrov, V. Living on the edge: A Complexity-Informed exploration of the human–water relationship. World Futur. 2007, 63, 275–285. [Google Scholar] [CrossRef]
- Feng, L. A Humble Opinion on Water Culture in Guanzi. J. Tongren Univ. 2008, 1, 4. (In Chinese) [Google Scholar]
- Donghua, X. Harmony of Man and Water: A Study of Ancient Chinese Water Culture Thought. Acad. Forum 2013, 1, 1–5. (In Chinese) [Google Scholar]
- Xiaowei, D. An Analysis of Yongtai Songkoushui Culture in Ming and Qing Dynasties—Taking Cuoluo, Ferry, and Market as the Objects of Investigation. Fujian Shi Zhi 2018, 2, 4. (In Chinese) [Google Scholar]
- Luo, L.; Wang, X.; Liu, C.; Guo, H.; Du, X. Integrated RS, GIS and GPS approaches to archaeological prospecting in the Hexi Corridor, NW China: A case study of the royal road to ancient Dunhuang. J. Archaeol. Sci. 2014, 50, 178–190. [Google Scholar] [CrossRef]
- Lyu, H.-M.; Wang, G.-F.; Shen, J.S.; Lu, L.-H.; Wang, G.-Q. Analysis and GIS Mapping of Flooding Hazards on 10 May 2016, Guangzhou, China. Water 2016, 8, 447. [Google Scholar] [CrossRef]
- Wan, A.; Chen, H.; Xie, X.; Liu, Y. Effects of water systems and roads on Linpan distribution based on buffer analysis. Environ. Dev. Sustain. 2021, 24, 7349–7360. [Google Scholar] [CrossRef]
- Robin, T.A.; Khan, M.A.; Kabir, N.; Rahaman, S.T.; Karim, A.; Mannan, I.I.; Rashid, I. Using spatial analysis and GIS to improve planning and resource allocation in a rural district of Bangladesh. BMJ Glob. Health 2019, 4 (Suppl. 5), e000832. [Google Scholar] [CrossRef]
- Yan, Y.; Zhang, Y.; Sharma, A.; Al-Amri, J.F. Evaluation of Suitability of Urban Land Using GIS Technology. Sustainability 2021, 13, 10521. [Google Scholar] [CrossRef]
- Diamond, J.T.; Wright, J.R. Design of an integrated spatial information system for multiobjective land-use planning. Environ. Plan. B Plan. Des. 1988, 15, 205–214. [Google Scholar] [CrossRef]
- Malczewski, J. GIS-based multicriteria decision analysis: A survey of the literature. Int. J. Geogr. Inf. Sci. 2006, 20, 703–726. [Google Scholar] [CrossRef]
- Yamada, I.; Thill, J.C. Local indicators of network-constrained clusters in spatial patterns represented by a link attribute. Ann. Assoc. Am. Geogr. 2010, 100, 269–285. [Google Scholar] [CrossRef]
- Cai, Q.; Rushton, G.; Bhaduri, B. Validation tests of an improved kernel density estimation method for identifying disease clusters. J. Geogr. Syst. 2012, 14, 243–264. [Google Scholar] [CrossRef]
- Shafabakhsh, G.A.; Famili, A.; Bahadori, M.S. GIS-based spatial analysis of urban traffic accidents: Case study in Mashhad, Iran. J. Traffic Transp. Eng. 2017, 4, 290–299. [Google Scholar] [CrossRef]
- Luter, H.; Silverman, B.W. Density Estimation for Statistics and Data Analysis; Chapman & Hall: London, UK; New York NY, USA, 1986; Volume 175, p. 12. [Google Scholar]
- Clive, E.S.; Kingham, S.; Nicholson, A.; Bartie, P. Road Traffic Accident Simulation Modelling—A Kernel Estimation Approach; Centre University of Otago: Dunedin, New Zealand, 2005. [Google Scholar]
- Chainey, S.; Tompson, L.; Uhlig, S. The utility of hotspot mapping for predicting spatial patterns of crime. Secur. J. 2008, 21, 4–28. [Google Scholar] [CrossRef]
- Steiniger, S.; Hunter, A.J. A scaled line-based kernel density estimator for the retrieval of utilization distributions and home ranges from GPS movement tracks. Ecol. Inf. 2013, 13, 1–8. [Google Scholar] [CrossRef]
- Hart, T.; Zandbergen, P. Kernel density estimation and hotspot mapping: Examining the influence of interpolation method, grid cell size, and bandwidth on crime forecasting. Policing Int. J. Police Strateg. Manag. 2014, 37, 306–323. [Google Scholar] [CrossRef]
- Hashimoto, S.; Yoshiki, S.; Saeki, R.; Mimura, Y.; Ando, R.; Nanba, S. Development and application of traffic accident density estimation models using kernel density estimation. J. Traffic Transp. Eng. 2016, 3, 262–270. [Google Scholar] [CrossRef]
- Guillamón, A.; Navarro, J.; Ruiz, J.M. Kernel density estimation using weighted data. Commun.-Stat.Theory Methods 1998, 27, 2123–2135. [Google Scholar] [CrossRef]
- Kaya, O.; Toroglu, E.; Adiguzel, F. The spatial analysis of the parties voting rate on the district scale at the general election in 2011. J.-Georaphy-Cograf. Derg. 2015, 31, 1–13. [Google Scholar]
- Soars, J. Principles of Geographical Information Systems, 3rd ed.; Oxford University Press: Oxford, UK, 2015. [Google Scholar]
- Katsis, L.; Cunneyworth, P.M.; Turner, K.M.; Presotto, A. Spatial patterns of primate electrocutions in Diani, Kenya. Int. J. Primatol. 2018, 39, 493–510. [Google Scholar] [CrossRef] [PubMed]
- Telega, A.; Telega, I.; Bieda, A. Measuring Walkability with GIS—Methods Overview and New Approach Proposal. Sustainability 2021, 13, 1883. [Google Scholar] [CrossRef]
- Keith, C. Getting Started with GIS. 1999. Available online: http://cumincad.scix.net/cgi-bin/works/Show?3db8 (accessed on 17 September 2022).
- Maguire, J.D. An overview and definition of GIS. Geogr. Inf. Syst. Princ. Appl. 1991, 1, 9–20. [Google Scholar]
- Schuurman, N. GIS: A Short Introduction; Blackwell: Oxford, UK, 2004. [Google Scholar]
- DeMers, M.N. Fundamentals of Geographic Information Systems; John Wiley & Sons: Hoboken, NJ, USA, 2008. [Google Scholar]
- Paul, B. GIS Fundamentals: A First Text on Geographic Information Systems; Eider Press: White Bear Lake, MN, USA, 2016. [Google Scholar]
- Kelly, K.A.; Hillier, A. Placing History: How Maps, Spatial Data, and GIS are Changing Historical Scholarship; ESRI, Inc.: Redlands, CA, USA, 2008. [Google Scholar]
- Stewart, F.; Rogerson, P. (Eds.) Spatial Analysis and GIS; CRC Press: Boca Raton, FL, USA, 2013. [Google Scholar]
- David, W.; Gillings, M. Perception and GIS: Some notes on the development of enriched approaches to the study of archaeological visibility. Beyond Map Archaeol. Spat. Technol. 2000, 321, 1–27. [Google Scholar]
- Gregory, I.N.; Ell, P.S. Historical GIS: Technologies, Methodologies, and Scholarship; Cambridge University Press: Cambridge, UK, 2007; Volume 39. [Google Scholar]
- Ren, Z.; Jiang, B.; Seipel, S. Capturing and Characterizing Human Activities Using Building Locations in America. ISPRS Int. J. Geo-Inf. 2019, 8, 200. [Google Scholar] [CrossRef]
- Ma, D.; Osaragi, T.; Oki, T.; Jiang, B. Exploring the heterogeneity of human urban movements using geo-tagged tweets. Int. J. Geo-Inf. Sci. 2020, 34, 2475–2496. [Google Scholar] [CrossRef]
- Mao, Y.; Hou, L.; Zhang, Z. Spatial-Temporal Evolution and Relationship between Urbanization Level and Ecosystem Service from a Dual-Scale Perspective: A Case Study of the Pearl River Delta Urban Agglomeration. Sustainability 2021, 13, 8537. [Google Scholar] [CrossRef]
- Liu, Z.; Liu, W. Spatial-Temporal Relationship between Water Resources and Economic Development in Rural China from a Poverty Perspective. Int. J. Environ. Res. Public Health 2021, 18, 1540. [Google Scholar] [CrossRef]
Publisher’s Note: MDPI stays neutral with regard to jurisdictional claims in published maps and institutional affiliations. |
© 2022 by the authors. Licensee MDPI, Basel, Switzerland. This article is an open access article distributed under the terms and conditions of the Creative Commons Attribution (CC BY) license (https://creativecommons.org/licenses/by/4.0/).