1. Introduction
The 2030 Agenda for Sustainable Development was adopted by the United Nations in 2015. There are 17 Sustainable Development Goals (SDGs) and 169 targets, which demonstrates the scale and ambition of the global Agenda [
1]. Meanwhile, higher education sectors have begun to incorporate the SDGs and invent sustainable institutions [
2]. Integrating economic, social and environmentally sustainable development, higher education is increasingly recognizing the role of developing a sustainable future. Regarding SDG 4, focusing on “ensuring inclusive and equitable quality education and promoting lifelong learning opportunities for all”, institutional actors could play key roles in its progress [
2]. In global contexts, sustainable development in higher education has become an emerging topic among researchers and practitioners. Among the sustainable strategies in higher education, widening participation is the most popular choice in the global context.
In 2012, there were 54 national systems, the gross enrollment ratio (GER) reached 50%, and there were 14 countries with a GER of 75% or more around the world [
3,
4]. Now, there is a new landscape in global higher education, as more countries have moved their systems to a universal stage. For example, the GER in Japan is 63.58% and it is 59.41% in the UK, whereas it is 103.75% in Turkey and 121.86% in Australia [
5]. Previous studies on higher education expansion typically considered that the issue and its solution are linked to internal factors in a system [
6,
7,
8]. The association between higher education expansion and student mobility flow has been scarcely addressed. However, international student mobility has become an important topic over the past several decades. For example, 6.1 million tertiary mobile students were worldwide in 2019, which grew on average by 5.5% per year between 1998 and 2019 [
9]. Mass student mobility has also caused concerns, as mentioned in the OECD’s report [
10]. In Asia, China and India became original countries that contributed the majority of inbound mobility students to other destination countries. Now that the world has moved into a global mobility era, higher education expansion and sustainable development could be rendered incomplete without addressing student global mobility. Moreover, COVID-19 has caused significant impacts, and international student mobility has experienced a major break [
11,
12].
This study assumed that higher education expansion would reduce outbound students, whereas it might attract and increase inbound students from lower-income countries. Economic factors may play a crucial role in the expanding process. Higher education in Taiwan has transformed from an outbound-oriented to an inbound-oriented system. Taking Taiwan’s higher education system as an example, we collected series data from the databank of the Ministry of Education to explore this phenomenon. In this study, we treated Taiwan as a resilient economy based on the World Trade Organization rather than a political entity. In 2022, the GDP in Taiwan is listed in 22 out of 193 economies [
13]; Based on the 2022 IMD Word Competitiveness Ranking, Taiwan was ranked 7 out of the selected 63 economies [
14]. The GDP per capita was ranked 17 and reached US
$ 30 thousand, which was over Japan and Korea in 2021 [
15,
16]. Previous studies indicated that the declining enrollment in higher education has caused oversupply issues in Taiwan [
17,
18]. Attracting more international students has become a crucial strategy in the declining higher education system. Although Taiwan’s higher education system has been moving towards a universal stage since 1999, the outbound student mobility has shown sustainable growth since 1988; moreover, the inbound mobile students started increasing in approximately 2004 to contribute to the higher education system. This phenomenon has not been addressed with appropriate methods in the previous literature; thus, the future pattern of mobility in the expanded higher education system remains unclear. This study aims to explore the effects of higher education expansion, to determine the relationships between higher education expansion and student mobility and to predict their future trends. Bearing these goals in mind, we addressed the following research questions:
RQ1. What are the relationships between economic factors and student mobility in a higher education expansion process?
RQ2. What are the trends of expansion and student mobility that might emerge in the higher education system?
RQ3. What are the concurrent relationships between higher education expansion and student mobility in the future?
Based on data of enrollment, GER, and the number of inbound and outbound students from the Ministry of Education, this study detected the expansion phenomena and examined the relationships among the expansion and inbound and outbound mobility flows in the economic context. This study may provide helpful approaches to tackle and interpret the expansion and mobility flow issue. The rest of the paper is organized as follows. The second section presents the theoretical assumptions and the literature review; the third section presents the method, data transformation and verification; the fourth section presents the empirical results and explanations; the fifth section presents the discussion; the sixth section presents the implications; and the last section presents the conclusions.
2. Literature Review
According to the United Nations, the SDGs represent the global priorities for the 2030 Agenda, signed by around 190 countries, seeking to mobilize global efforts around a set of common goals and targets [
19,
20]. The 2030 Agenda provide further opportunities for transitioning towards sustainability in higher education, for example, “SDG 4: quality education” and “Target 4.7: education for sustainable development” [
21]. Universities and other higher education institutions (HEIs) can play a crucial role in this endeavor [
22]. In this section, we addressed the notion of system growth as an agent of sustainable higher education, expansion phenomena and global student mobility to develop our research hypotheses.
2.1. System Growth as an Agent of Sustainable Higher Education
The expansion of higher education means increases in the number of educational opportunities; typically, it is associated with sustainable higher education to fulfil the sustainability goals. Higher education expansion may present different meanings in various education systems. We assumed only meaningful expansion can trigger healthy higher education development. As in the previous literature, three hypotheses are tested to explain higher education expansion: “human capital theories” [
23], theory of individual “status competition” [
24] and “signaling theory” [
25]. Schultz’s human capital theory assumed that “education is a form of capital that enhances an individual’s knowledge and skills, thereby leading to higher income and productivity” [
23]. This is the leading concept of economic dimension that impacts higher education. Collins argued that employers that utilize credentials hire more educated workers, not because they are more skilled and productive, but rather because they have more education [
24]. Thus, higher education has led to credentials becoming an “artificial good”, according to Collins’ argument [
26]. Spence’s “signaling theory” argued that employers might utilize credentials as a signal of individual productivity [
25,
27]. Perspectives of credentials are strongly associated with greater ability, skills and knowledge in job markets. In many countries, credentials are also considered necessary for filling a higher-level position in the state bureaucracy [
28]. In this sense, higher education expansion for individual or market purposes would promote social mobility in order to satisfy the increasing demands of labor [
29,
30]. Higher education expansion was driven by internal and external demands. Economic growth could be a crucial driver. How has this driver shaped the student mobility in global settings? More work is needed to explore this phenomenon.
In a global context, economic, social and technological development are expected to be integrated into sustainable higher education systems. For example, addressing the function of “organizational transformation”, Ruiz-Mallén and Hera indicted that higher education may focus on infusing sustainability within the organization [
31]; Ghani et al. indicated and further strengthened the growing recognition that internationalization can also play a role in achieving global sustainable development [
32]. In this movement, we can observe that seeking high-quality education in advanced countries is a strong motivation that could drive a student’s mobility learning, for example, Australia, New Zealand, the United Kingdom and the United States [
9,
33]. Higher education for sustainable development would widen the participation of international students and encourage students’ mobility. Meanwhile, this phenomenon in core countries has extended to other areas. Previous studies did not provide sufficient knowledge in this field.
2.2. Higher Education Expansion Phenomena
Higher education expansion has not grown out of purely endogenous factors but might be influenced by exogenous economic and political forces. For example, Trow argued that those holding “a hard concept of managerialism” have no trust in the academic community’s ability to control higher education [
34]. Moreover, DiMaggio and Powell have identified three mechanisms of isomorphic institutional pressure that might impact higher education: (a) coercive isomorphism that stems from political forces and legitimacy issues, (b) mimetic isomorphism that stems from uncertainty in responses and (c) normative isomorphism that stems from professionalization [
35,
36]. Addressing the concept of isomorphism with the perspective of new institutionalism, Karataş and Güçlü provided an example wherein the expansion of higher education in Turkey is in harmony with the “state” in order to obtain resources and social support [
35,
36]. Although the factors that might drive the system’s expansion could be varied, exogenous forces play crucial roles in the expanding process.
Within the expanding framework, Trow argued the growth of higher education with three distinct manners: first, the rate of growth; second, the growth of the absolute size both of systems and individual institutions; third, the growth of the proportion of the relevant age groups regarding enrollment in higher education [
36,
37]. For instance, around one-third of the world’s college-age population participates in higher education [
37,
38]; the GER in most middle-income countries moved to the mass stage, while many countries reached 75% [
5]. Higher education systems may follow rational processes to extend their student numbers, with varying outcomes around the world. For example, the GER in China is 50%, 59.41% in the UK and 63.58% in Japan, whereas it is 93.78% in Korea [
5]. The expansion phenomena have spread from a core country (USA, UK and France) to middle-income and low-income countries. In addition, a previous study indicated that internationalization is considered a strategic agenda for higher education [
38,
39]. As internationalization might change the landscape of higher education, globalization is changing the world of internationalization [
39,
40]. In such a manner, internationalization in higher education may respond to global trends and challenges. We assumed a concurrent relationship might exist between the growth of higher education and student mobility.
2.3. Student Mobility in a Global Context
As higher education has been expanded, learning in a nationwide or international context has become attainable. Global mobility refers to border-crossing in student learning [
41]; it has been studied in different contexts and through different approaches [
42]. Previous studies on student mobility have ranged from a case study of local universities to addressing regional phenomena. For example, Fonseca, Justino and Amaral addressed the issue from a human capital perspective regarding the recruitment of students from other regions to improve sustainability [
43]; Choudaha focused on American higher education experiences of student mobility [
44]; and studies on the EU’s Erasmus+ program have provided international examples [
45]. Many countries view academic mobility as a critical strategy, not only for sharing knowledge and building intellectual capital, but also for promoting competitiveness in global settings. Although international student participation varies by country, the number has grown significantly over the last few decades. Based on the OECD report, 67% of all international students come from developing countries; they have become the source of the largest flow of international students in the OECD area [
9]. Since mobile students have become an important source of income for host countries, international students often pay higher tuition fees than domestic students. Scholarship programs could be quite beneficial in providing opportunities for young people to continue their cross-border education. SDG 4 emphasizes the “volume of official development assistance flows for scholarships by sector and type of study” (4.b.1) [
46]. Widening the global participation in higher education, they also make a significant contribution to the internationalization of tertiary education and research systems [
47]. These phenomena might be associated with the system expansion and student mobility.
Taiwanese higher education has been challenged by serious demographic and environmental changes, such as the challenge of declining enrolment trends [
48,
49]. The Ministry of Education set an internationalized goal of attracting 130,000–140,000 inbound students to increase the enrollment in higher education by 2020 [
50]. For sustainable higher education, balancing between system expansion and students’ global mobility has become a new challenge. In this study, we intend to discover the trend of student mobility in the future, within the framework of economic development and system expansion.
3. Methods
We considered the quantitative data collection for model testing. This study focused on economic factors in terms of economic growth ratio and GDP per capita, gross enrollment ratio, inbound students, outbound students and total number of students in higher education in the testing model. Index or ratio format data have been transformed. The cross-correlation function and ARIMA model were the key statistical methods.
3.1. Data Collection
In this study, we collected data related to the economic growth ratio and GDP per capita from National Statistics, Taiwan [
51]. The related data are including the gross enrollment ratio, inbound students, outbound students and total number of students in higher education from the Ministry of Education, Taiwan [
52,
53]. Based on the published document, the official data of GER are limited from 1976 to 2021. The numbers of inbound and outbound students, from 1950 to 2021, have been checked with official publications or online websites. We also collected the total number of students in higher education from 1950 to 2021 for the purpose of transforming related indices. The data before 1998 are cited from the Book of Educational Statistics [
52]. The digital data are cited from the website of the Ministry of Education [
53].
3.2. Data Transformation
In this study, we employed indices to interpret the higher education system’s expansion and student mobility flow. Based on the collated data and the formula for transformation, we address indices including the economic growth ratio, GDP per capita, GER, increasing ratio (IR), inbound mobility ratio (IMR), outbound mobility ratio (OMR) and net flow ratio. We considered that the economic growth ratio and GDP per capita belong to the external factors in higher education, while the GER, increasing ratio (IR), inbound mobility ratio (IMR), outbound mobility ratio (OMR) and net flow ratio belong to internal factors.
3.2.1. Influential Economic Indices
Economic growth ratio is based on the government’s data set from 1951 to 2021. During this period, only in 2009 the system experiences negative growth. Since the negative value exists, the series data did not fit the algorithm transformation. The other index is GDP per capita, and the official data set was also supported by the government’s data bank [
51].
3.2.2. Indices for Interpreting Higher Education Expansion
The GER is one of the indices used for evaluating the higher education expansion phenomenon. Based on a UNESCO report, the definition of GER is as follows [
54]:
GER = 100 × [Tertiary enrolment/five-year age cohort following the theoretical age of secondary education completion (19–23)]
The other index is the increasing ratio (IR). The IR refers to the ratio of student enrollment on an annual basis. The IR in t + 1 year is calculated as
This study assumed the year of 1950 as a baseline to estimate the IR in the target higher education system.
3.2.3. Indices for Interpreting Student Mobility
This study focuses on the inbound and outbound mobile students in higher education. Three key ratios related to student mobility have been transformed, which are the IMR, OMR and net flow ratio. The data were transformed into a ratio format following the OECD’s definitions [
55].
Inbound mobility ratio (IMR) = 100 × [Total number of students from abroad studying in a given country (inbound students)]/[Total tertiary enrollment in that country];
Outbound mobility ratio (OMR) = 100 × [Total number of students from a given country studying abroad (outbound students)]/[Total tertiary enrollment in that country];
Net flow ratio = 100 × [[Total number of tertiary students from abroad studying in a given country (inbound students)] − [Number of students at the same level of education from that country studying abroad (outbound students)]]/[Total tertiary enrollment in that country].
3.3. Estimating the Cross-Correlation
Since the correction with two series is different from the traditional one, the cross-correlation function (CCF) was used to verify the concurrent relationships of the series with their cross-correlation coefficients. SPSS was used to transform the CCFs of the series data. The calculation of the CCF was defined as in the following formula [
56,
57]:
where
The rxy term represents their cross-correlation coefficient; and are the sample variances of {Xt} and {Yt} series.
SPSS (the Statistical Package for the Social Sciences) was used to transform the CCF. First, this study assumed that the series are not cross correlated and that one of the series is white noise. Second, we employed natural logarithm transformation and difference, based on the attribution of series data sets. Third, we calculated the linear correlations (rxy) between the series, ranging from −1 to 1. Fourth, we selected the range of lags from −7 to 7 to display the cross-correlations. The significant cross-correlation coefficients were judged according to a significance level of 0.05. Finally, the following rules can be used to judge the relationships of the targeted series xt and yt:
- (a)
When rxy is positive and significant, xt is possibly the independent variable, while yt is the dependent variable in the model. We can confirm that xt impacts yt.
- (b)
When rxy is significant in lag 0 only, the impacts of xt and yt are concurrent.
- (c)
When rxy is significant with positive and negative values in certain lags, we may assume that xt impacts yt, where the impact of yt will feedback to xt. In this case, interpretation should be performed with caution.
In this study, SPSS was also used to provide visualized results for detecting the CCF. This study performed a normalized cross-correlation with time shift to detect whether GER and IR lag or lead the inbound mobility ratio, outbound mobility ratio and net flow ratio, respectively. In the null hypotheses testing, we assumed there is no concurrent relationship between the selected variables.
3.4. Predicting GER, IR and Net Flow Ratio Achieved in 2030
Time series analysis has been applied to address related issues in a wide range of settings—for example, environment, medicine, economic and social-related issues [
58,
59,
60]. Various studies have discussed an innovative approach to transforming time series data [
61,
62]. The time series analysis was used to predict the GER, IR and net flow ratio in the future. Before implementing the predicted model, this study checked whether the target data sets belonged to seasonal or non-seasonal series. In the model selection process, we considered the significance of the parameters and the testing of white noise. If the series contained non-seasonal data, we followed the criteria of ARIMA(p,d,q) to build the fitted model for prediction [
63,
64,
65], where
p is the autoregressive terms (AR);
d is the number of non-seasonal differences;
q is the number of lagged forecast errors (MA).
The test of white noise is based on the Box–Pierce (Ljung–Box) Chi-square statistic and was used to determine whether the model met the assumption that the residuals were independent [
66,
67]. The calculation of white noise is listed as follows [
68]:
where
n is the sample size;
d is the difference used to transform the series data to a stationary one;
refers to the autocorrelation at lag l for the residuals of the model;
K is the number of lags, e.g., 12, 24, 36, etc., for yearly data.
Based on the Box–Pierce suggestion, the Chi-square values should be non-significant in the legs of 12, 24, 36 and 48. In this study, we applied SPSS and Minitab to predict the series data.
4. Results
4.1. Economic Influential Factors on Mobility Flows
The results reveal that there is no concurrent relationship between GDP per capita and inbound or outbound mobility ratio due to the 0 lag being not significant or lower than their cross correlations. The phenomenon also reveals no concurrent relationship between GDP per capita and net flow ratio. The GDP per capita is not a good indicator to reflect the mobility flows in this case (see
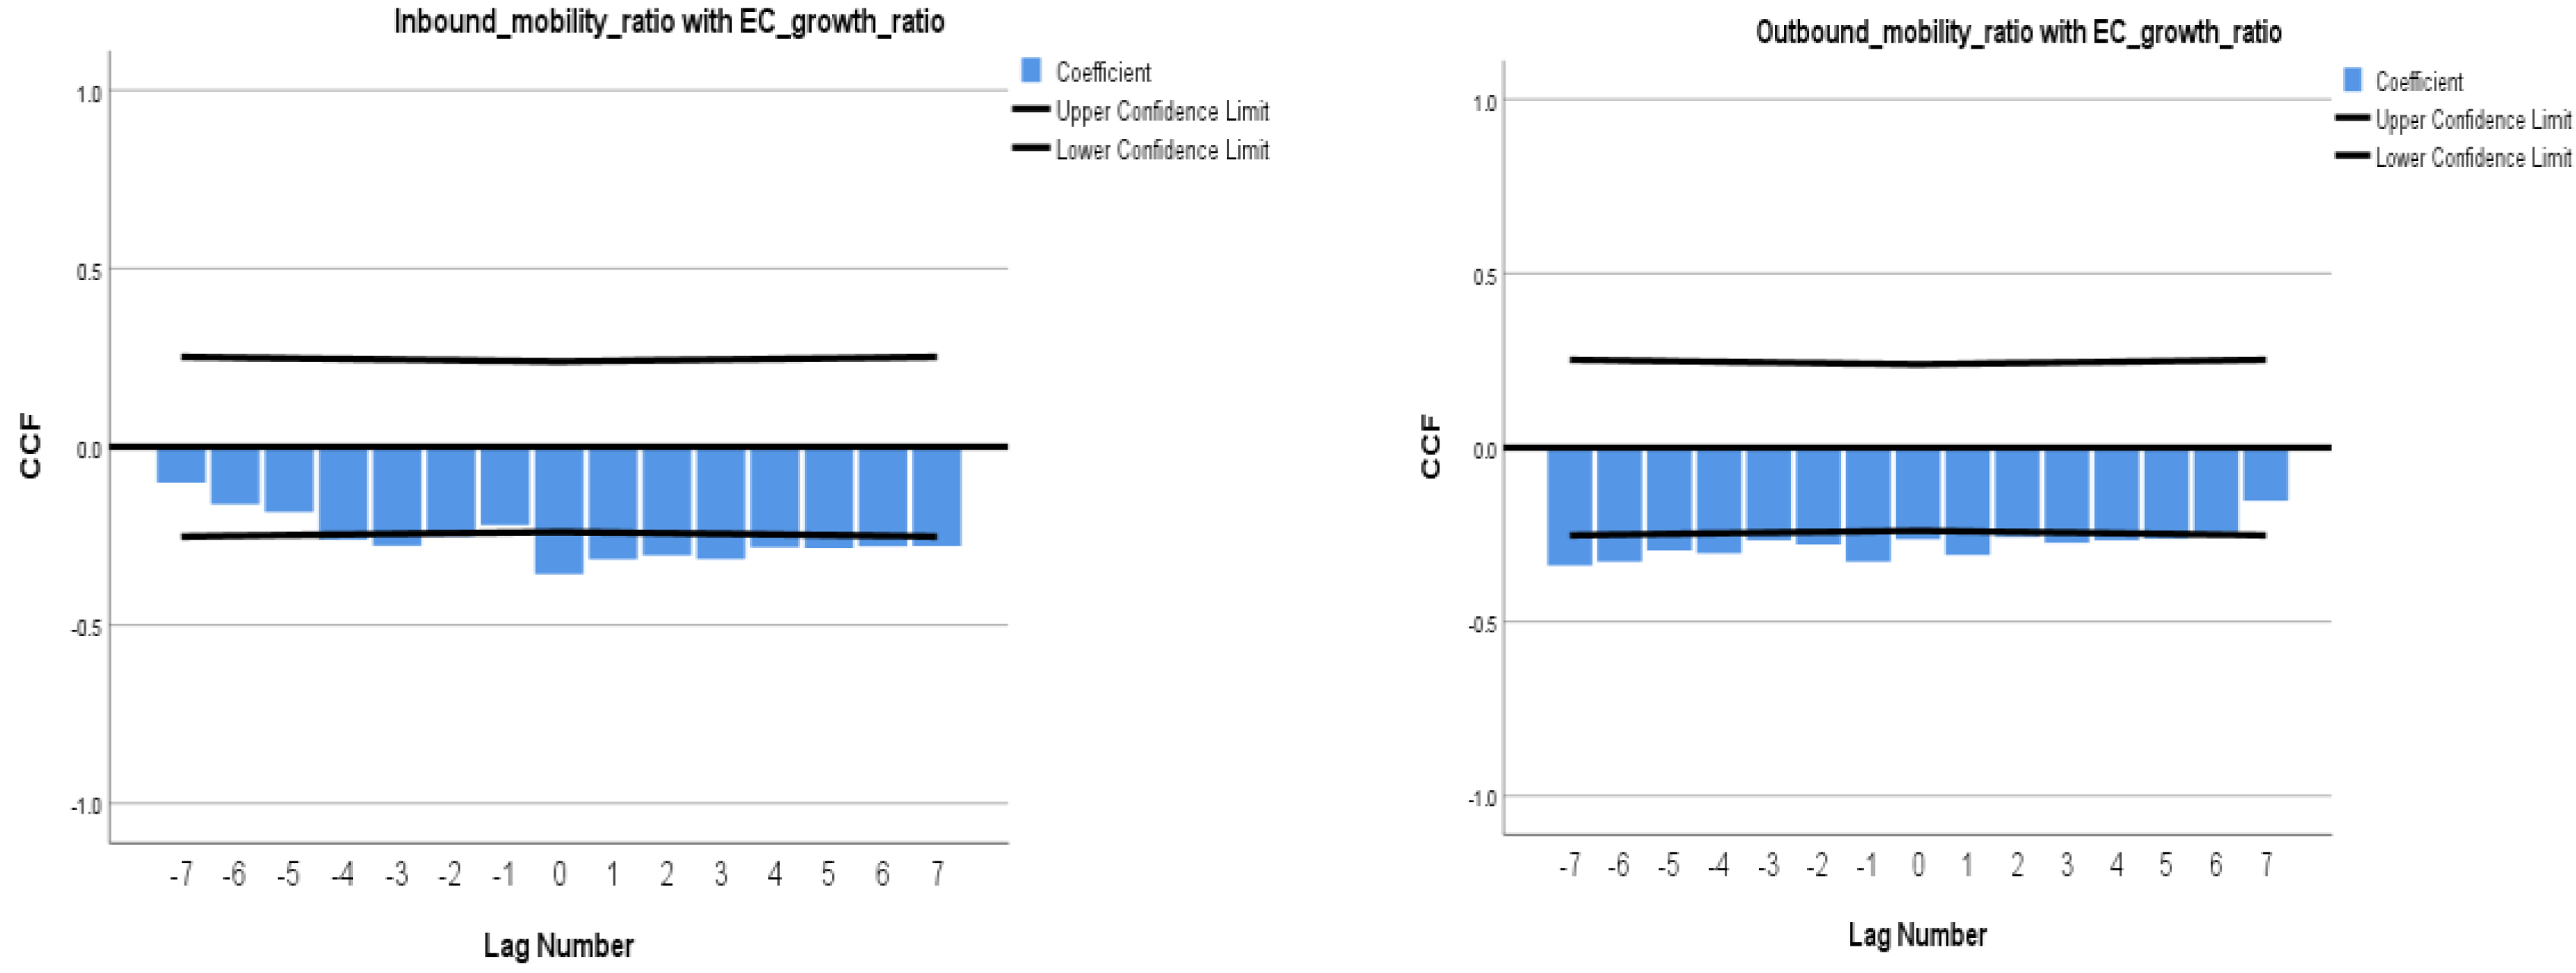
Table 1). Meanwhile, the economic growth ratio has been found to be significantly associated with the inbound and outbound mobility ratio. This study found that the economic growth ratio will lead the inbound and outbound mobility ratio in the expanding higher education system. The details are presented in
Table 1 and
Figure 1.
4.2. Higher Education Expansion
Higher education expansion can be interpreted with GER. Previous studies indicated that the GER in the target higher education system has expanded from a mass stage to a universal stage, as the GER changed from 15.40% (1976) to 50.52% (1999) [
69]. Since the GER increase to 85.15% that happened in 2019, the GER has shown a rapid increase within the higher education system. The target higher education system has moved into a high-participation higher education group within the world. The time series plot for GER is presented in
Figure 2.
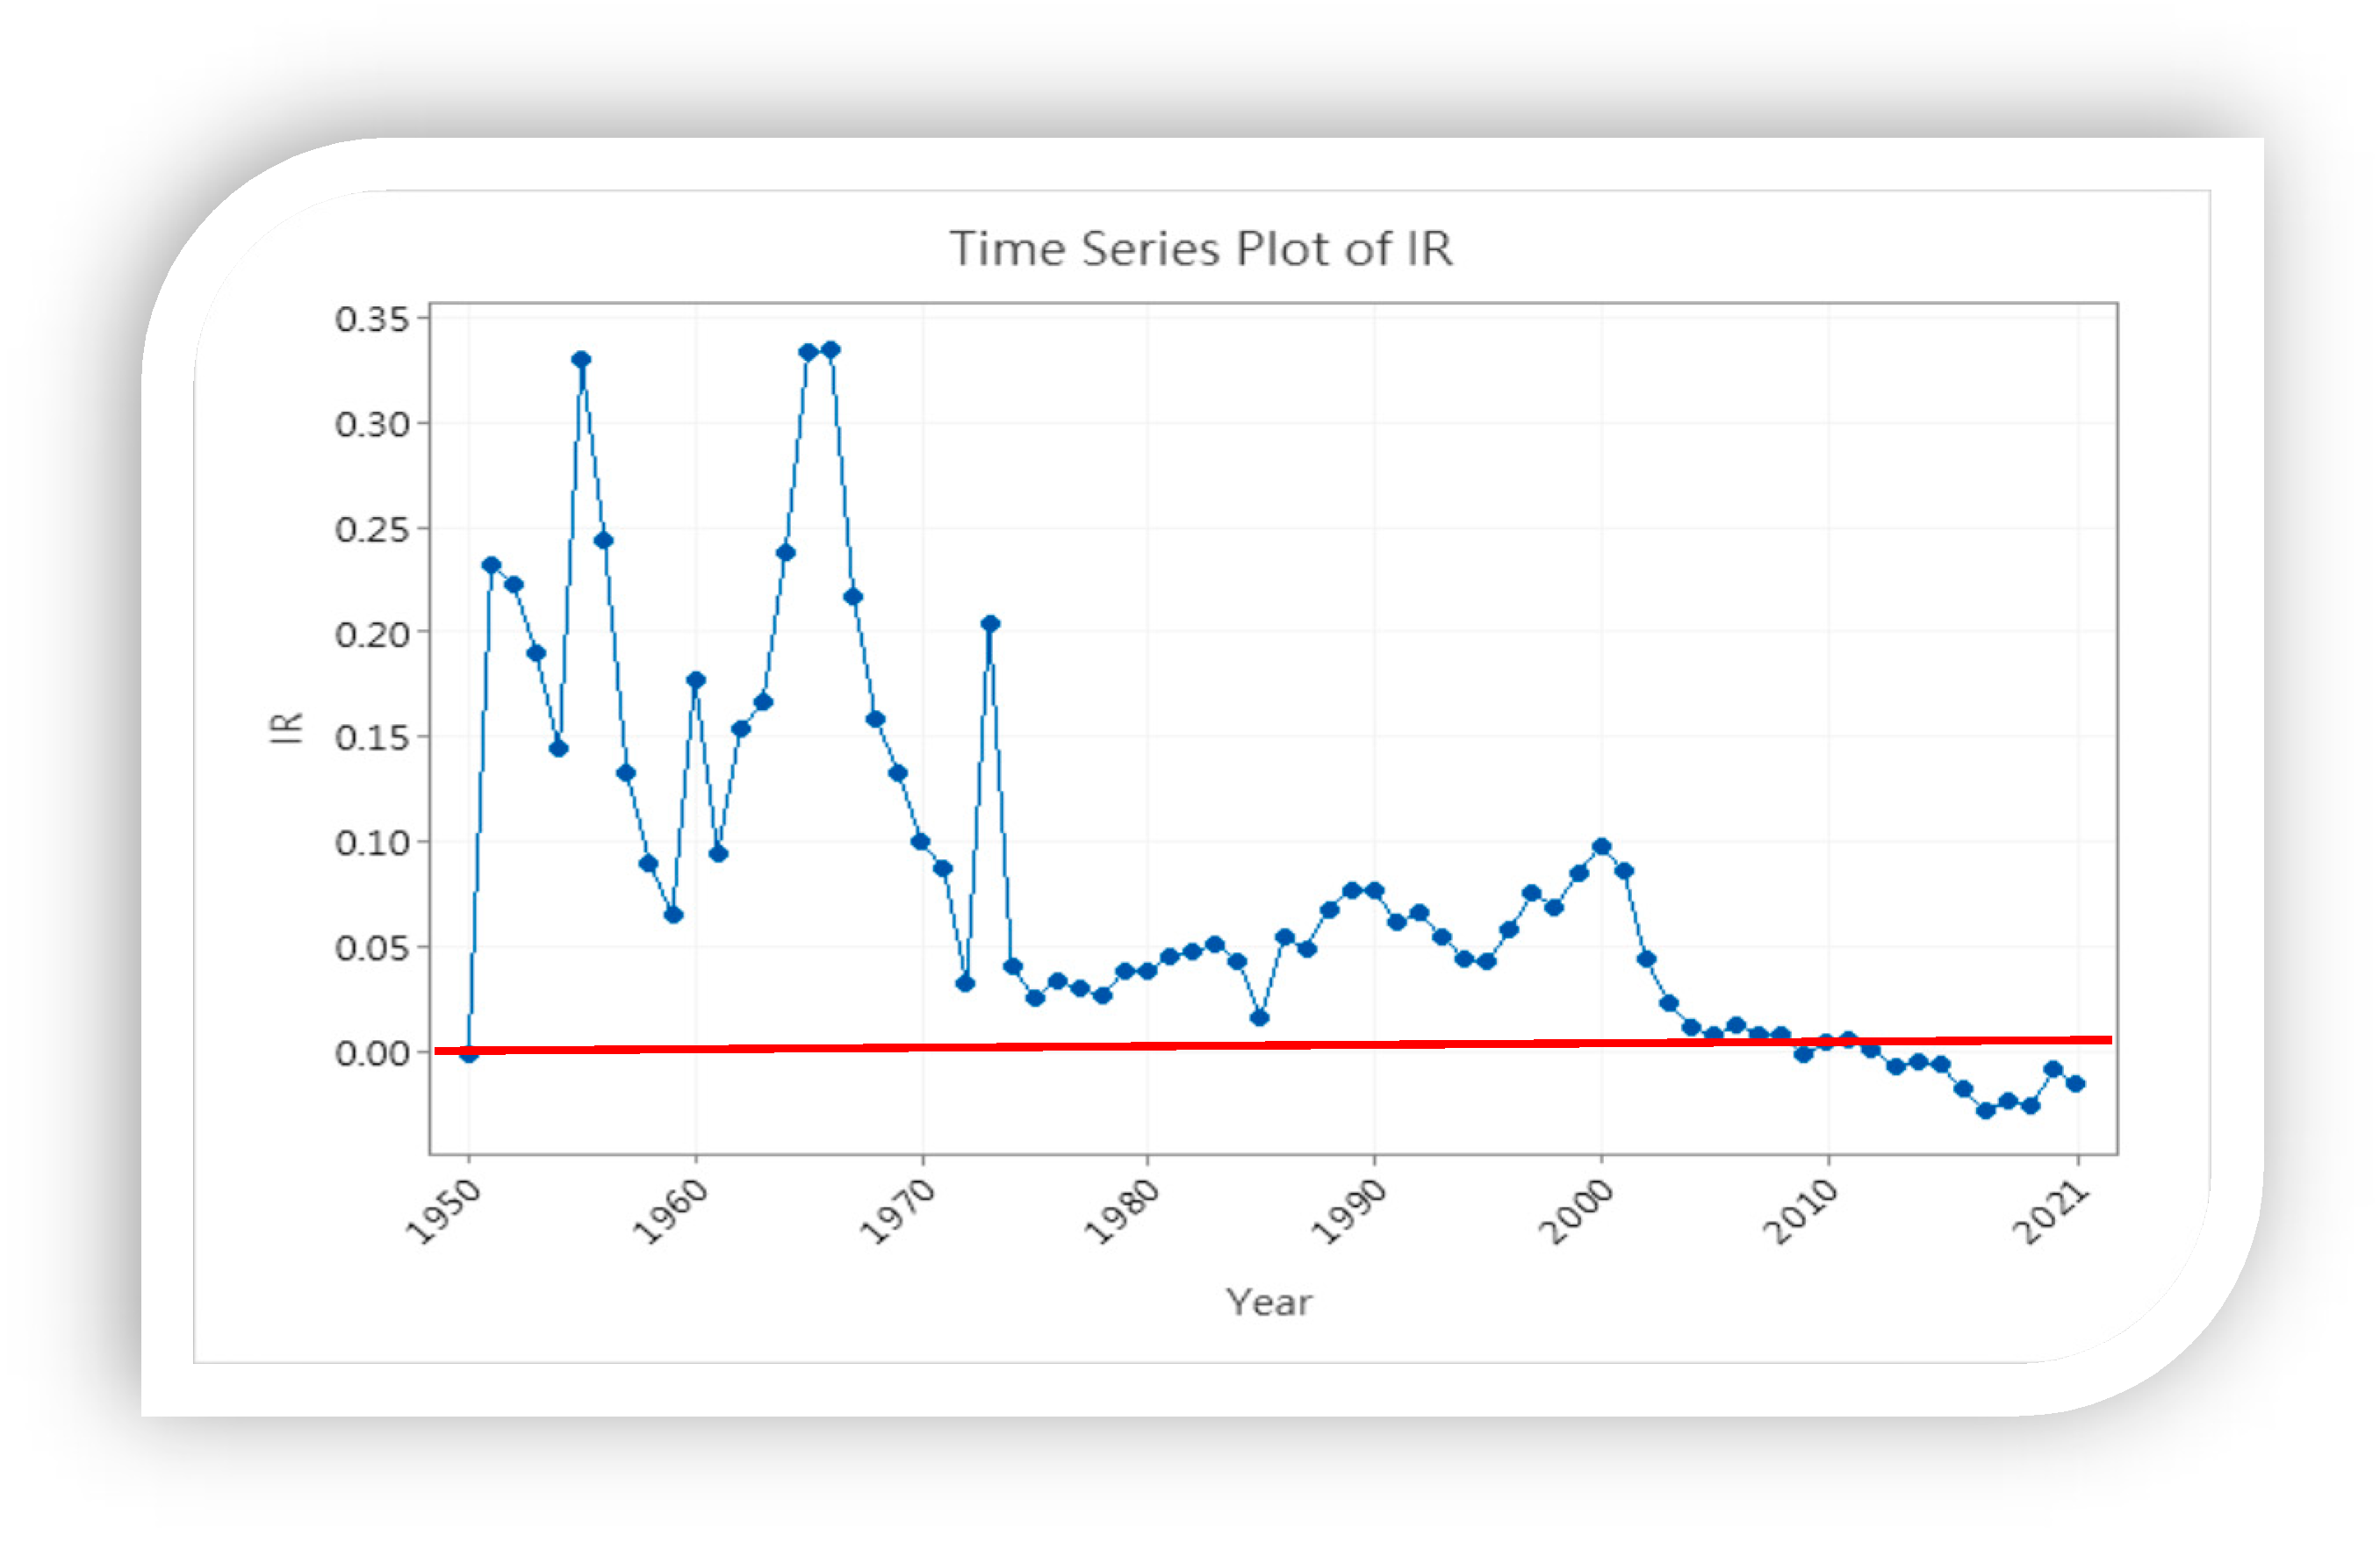
The enrollment increasing is another index to address the system expansion phenomenon.
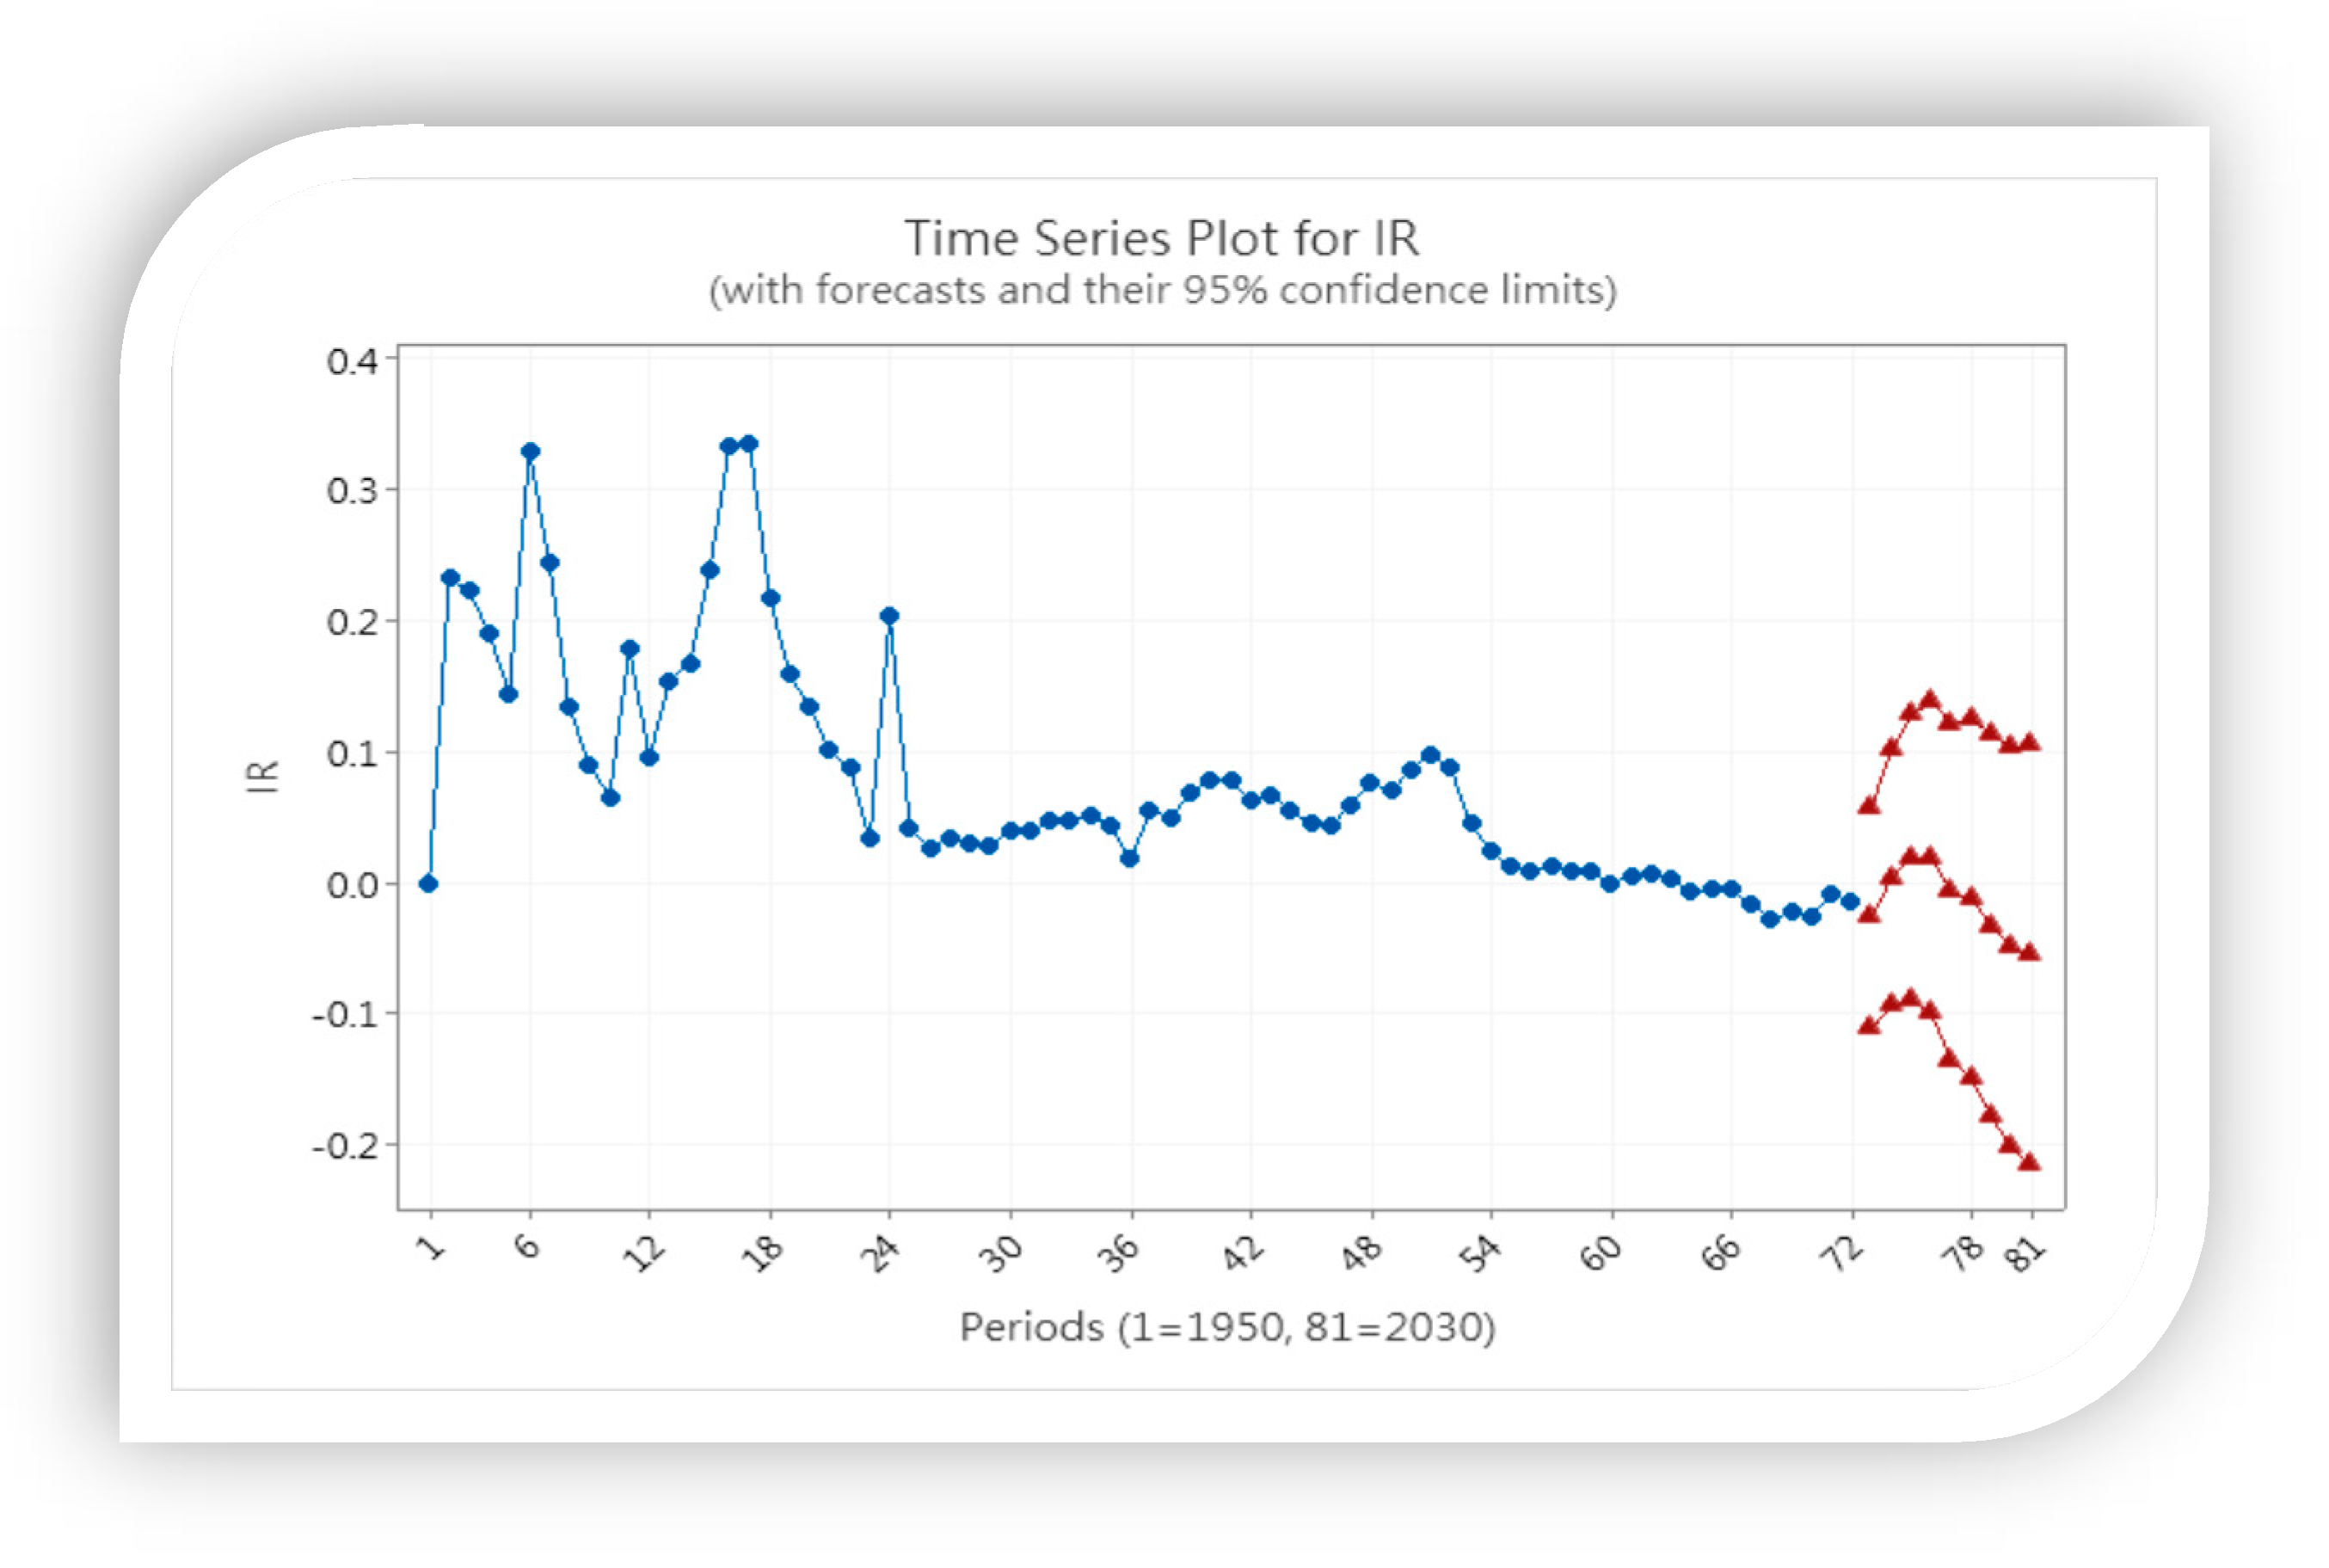
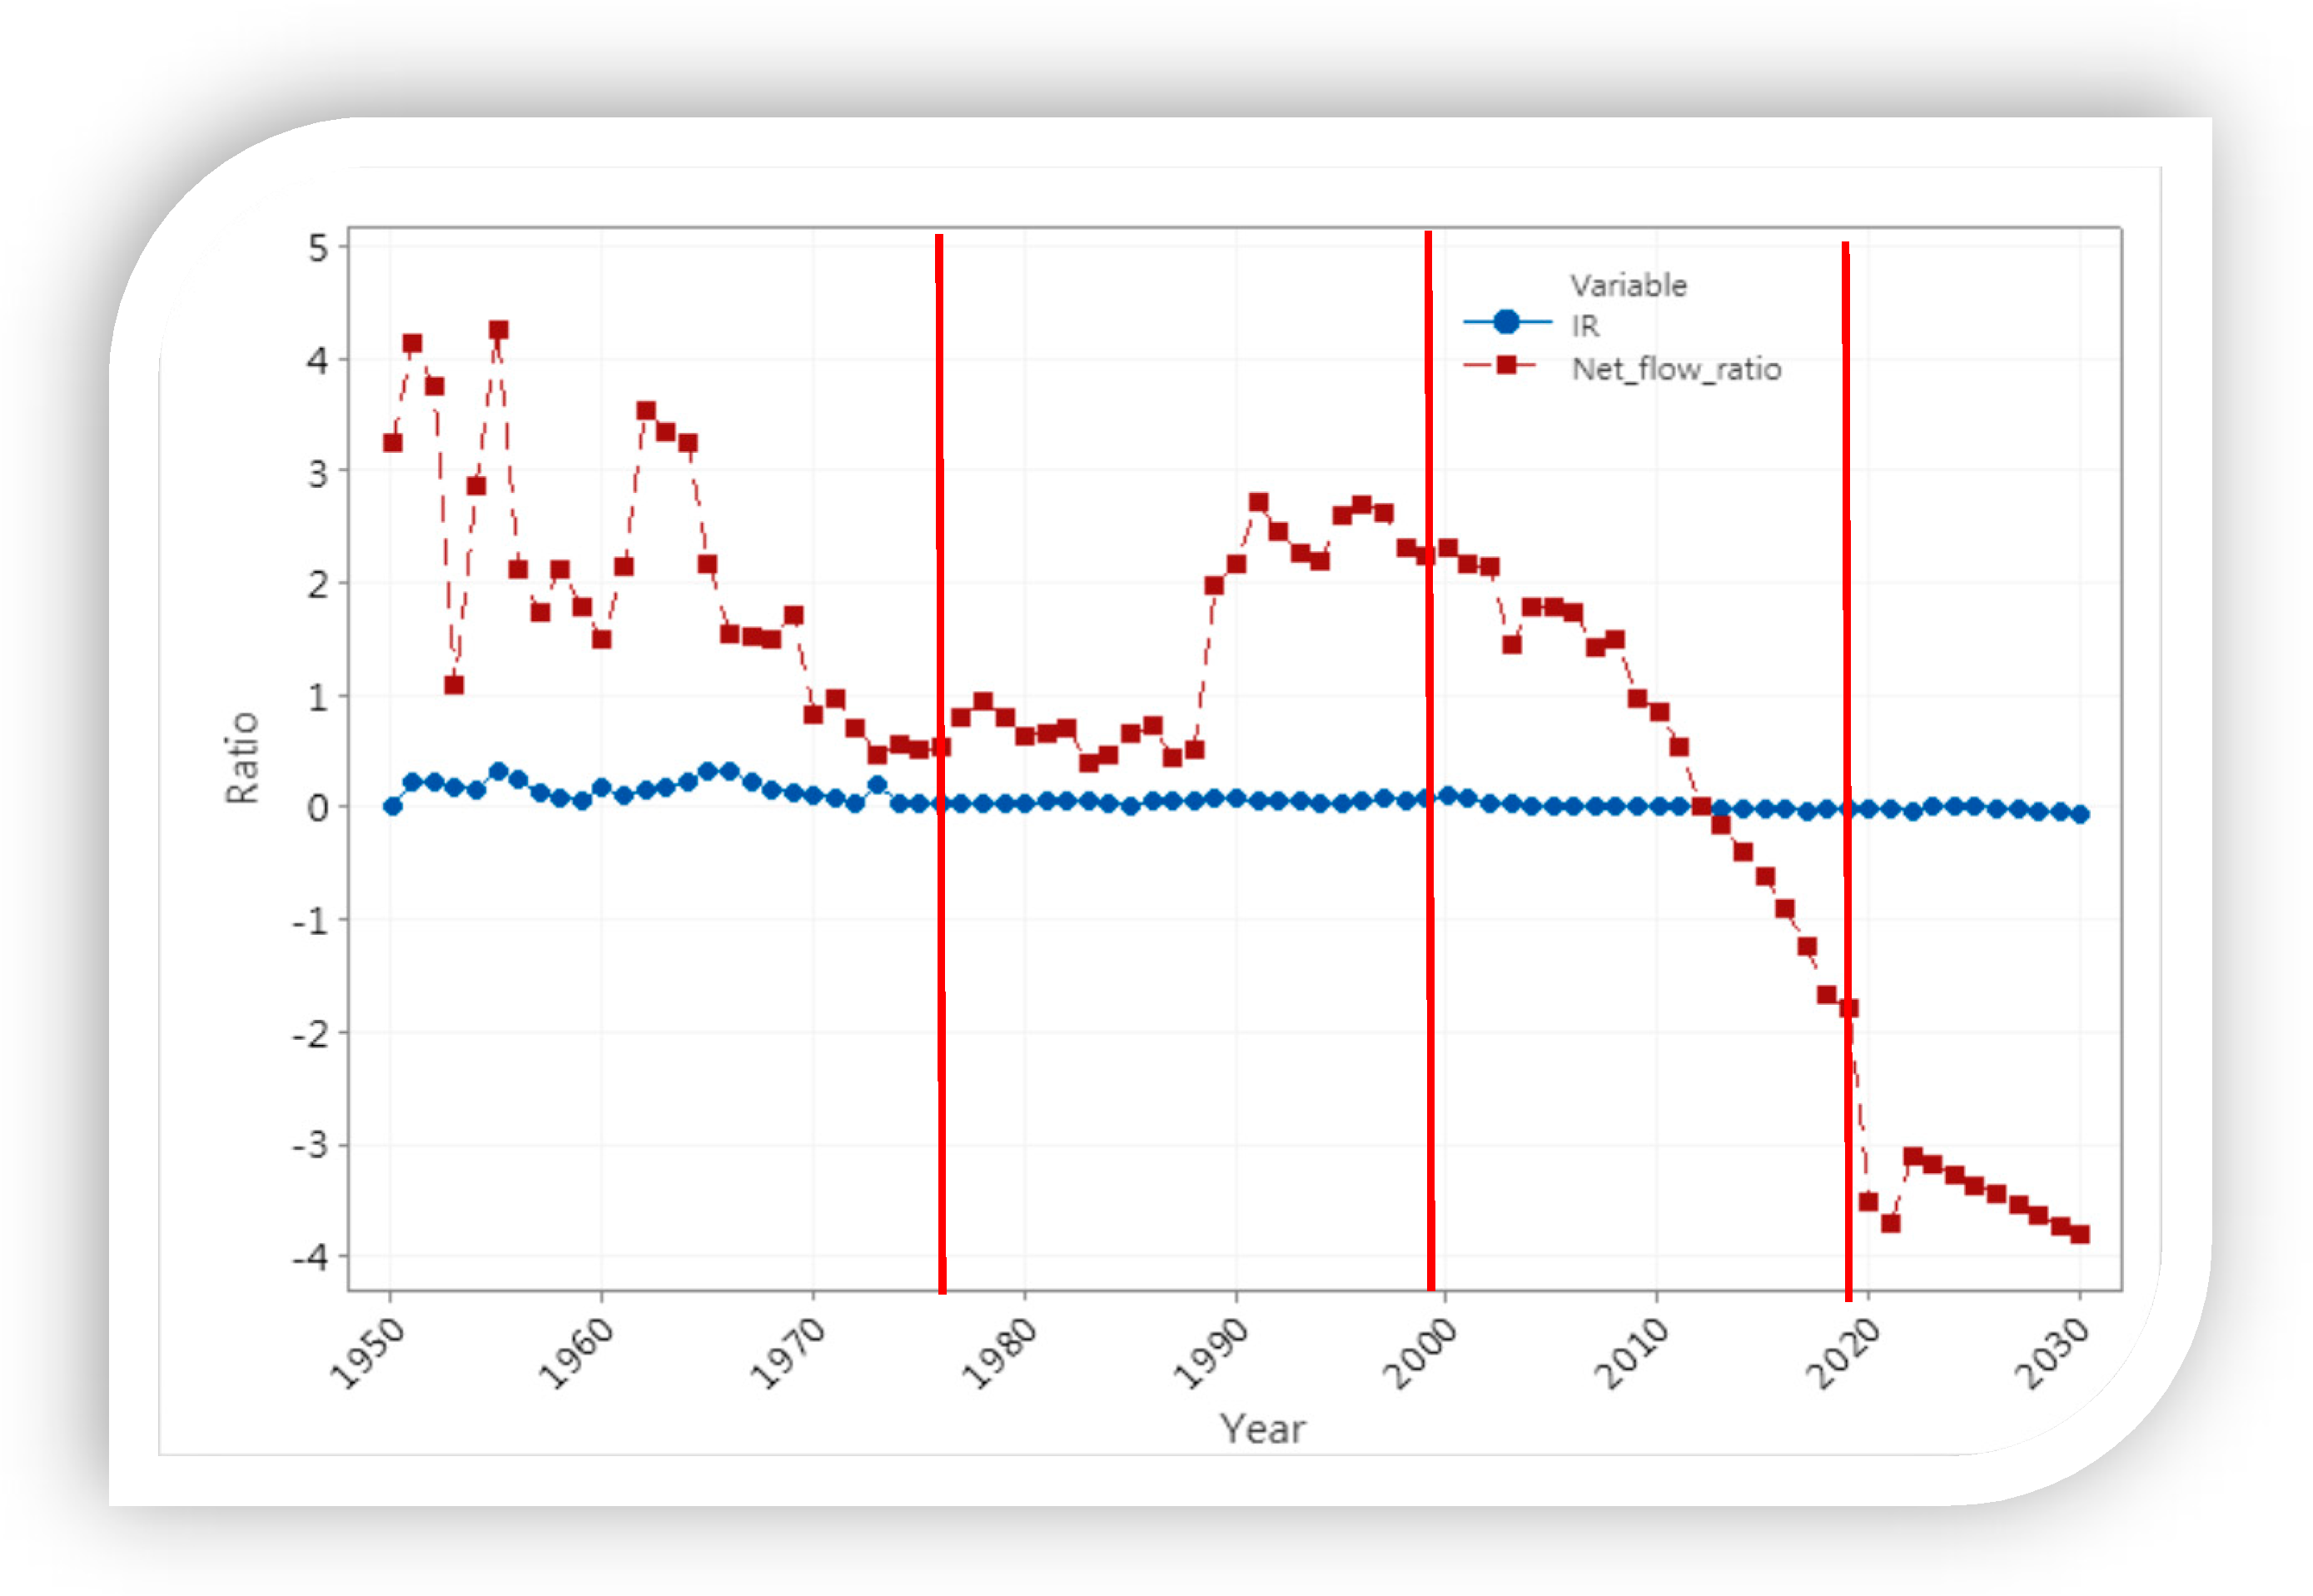
Figure 3 shows the trend of IR from 1950 to 2021. Since 2020, the IR has been declining in the target higher education system. IR can reflect the enrollment increasing or decreasing directly. The negative values of IR indicate that the higher education system stopped its enrollment expansion in 2013. Although the GER is increasing, the increasing ratio has declined.
4.3. Students’ Mobility Flow
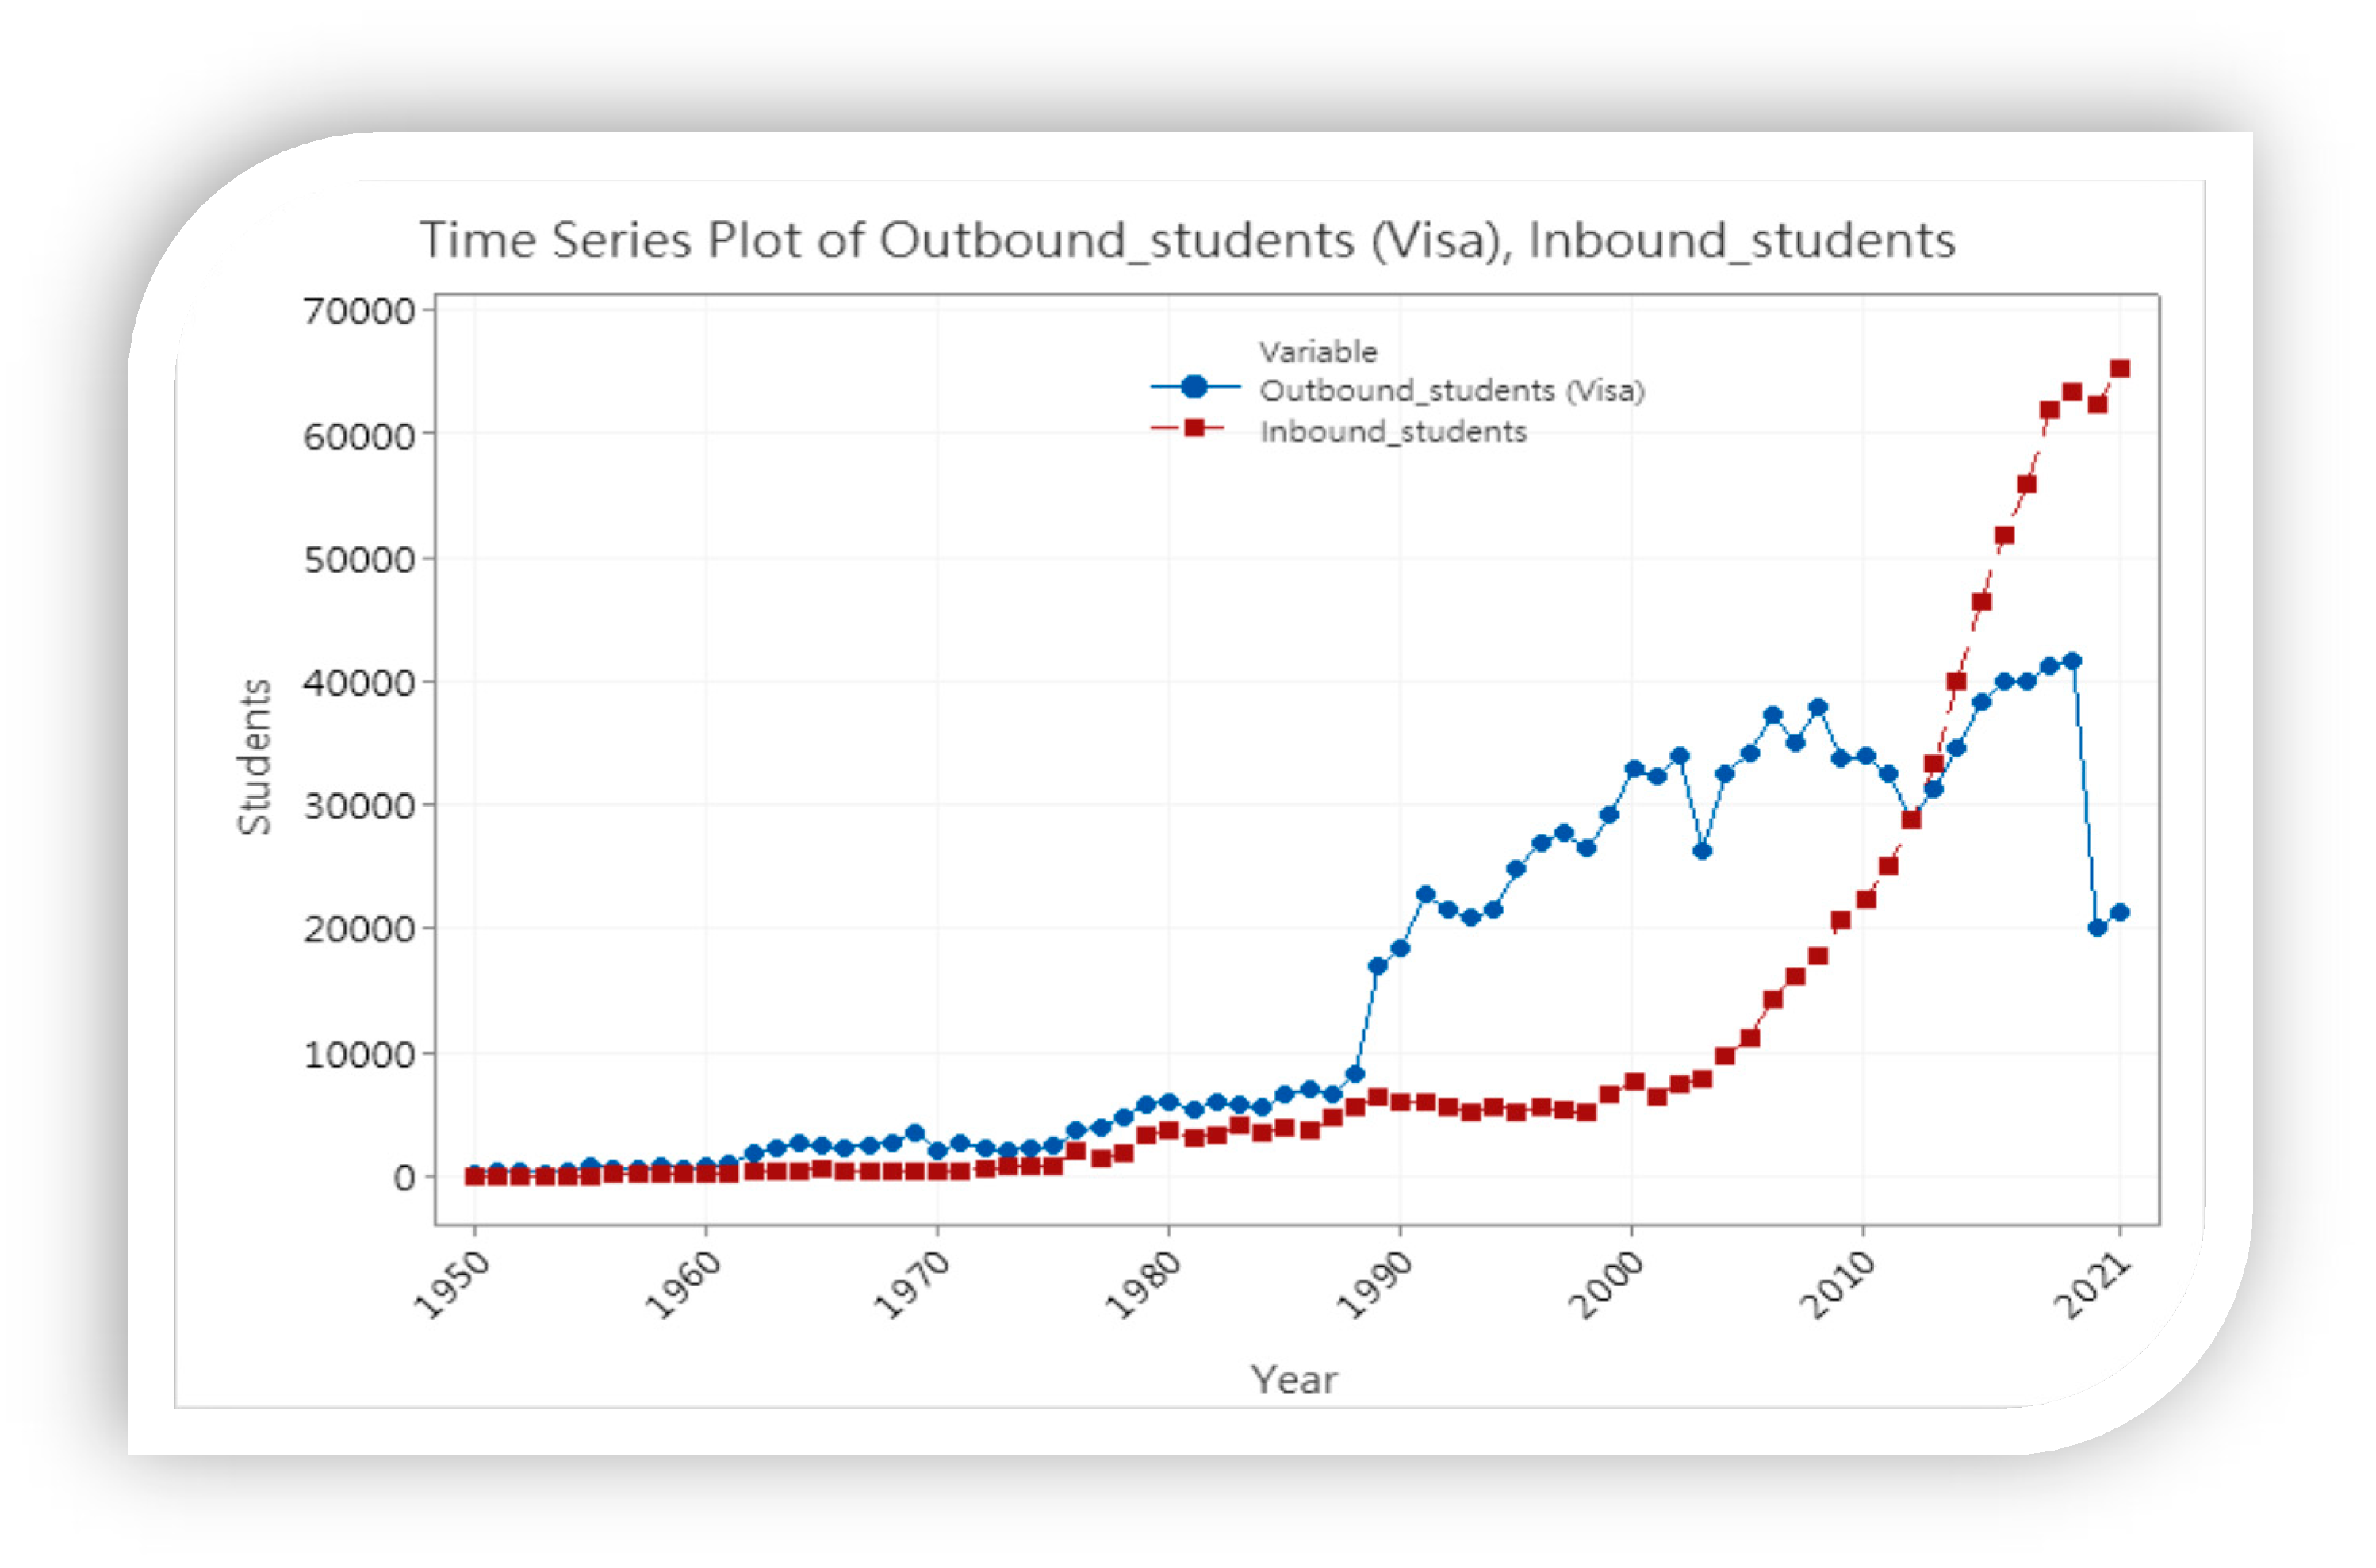
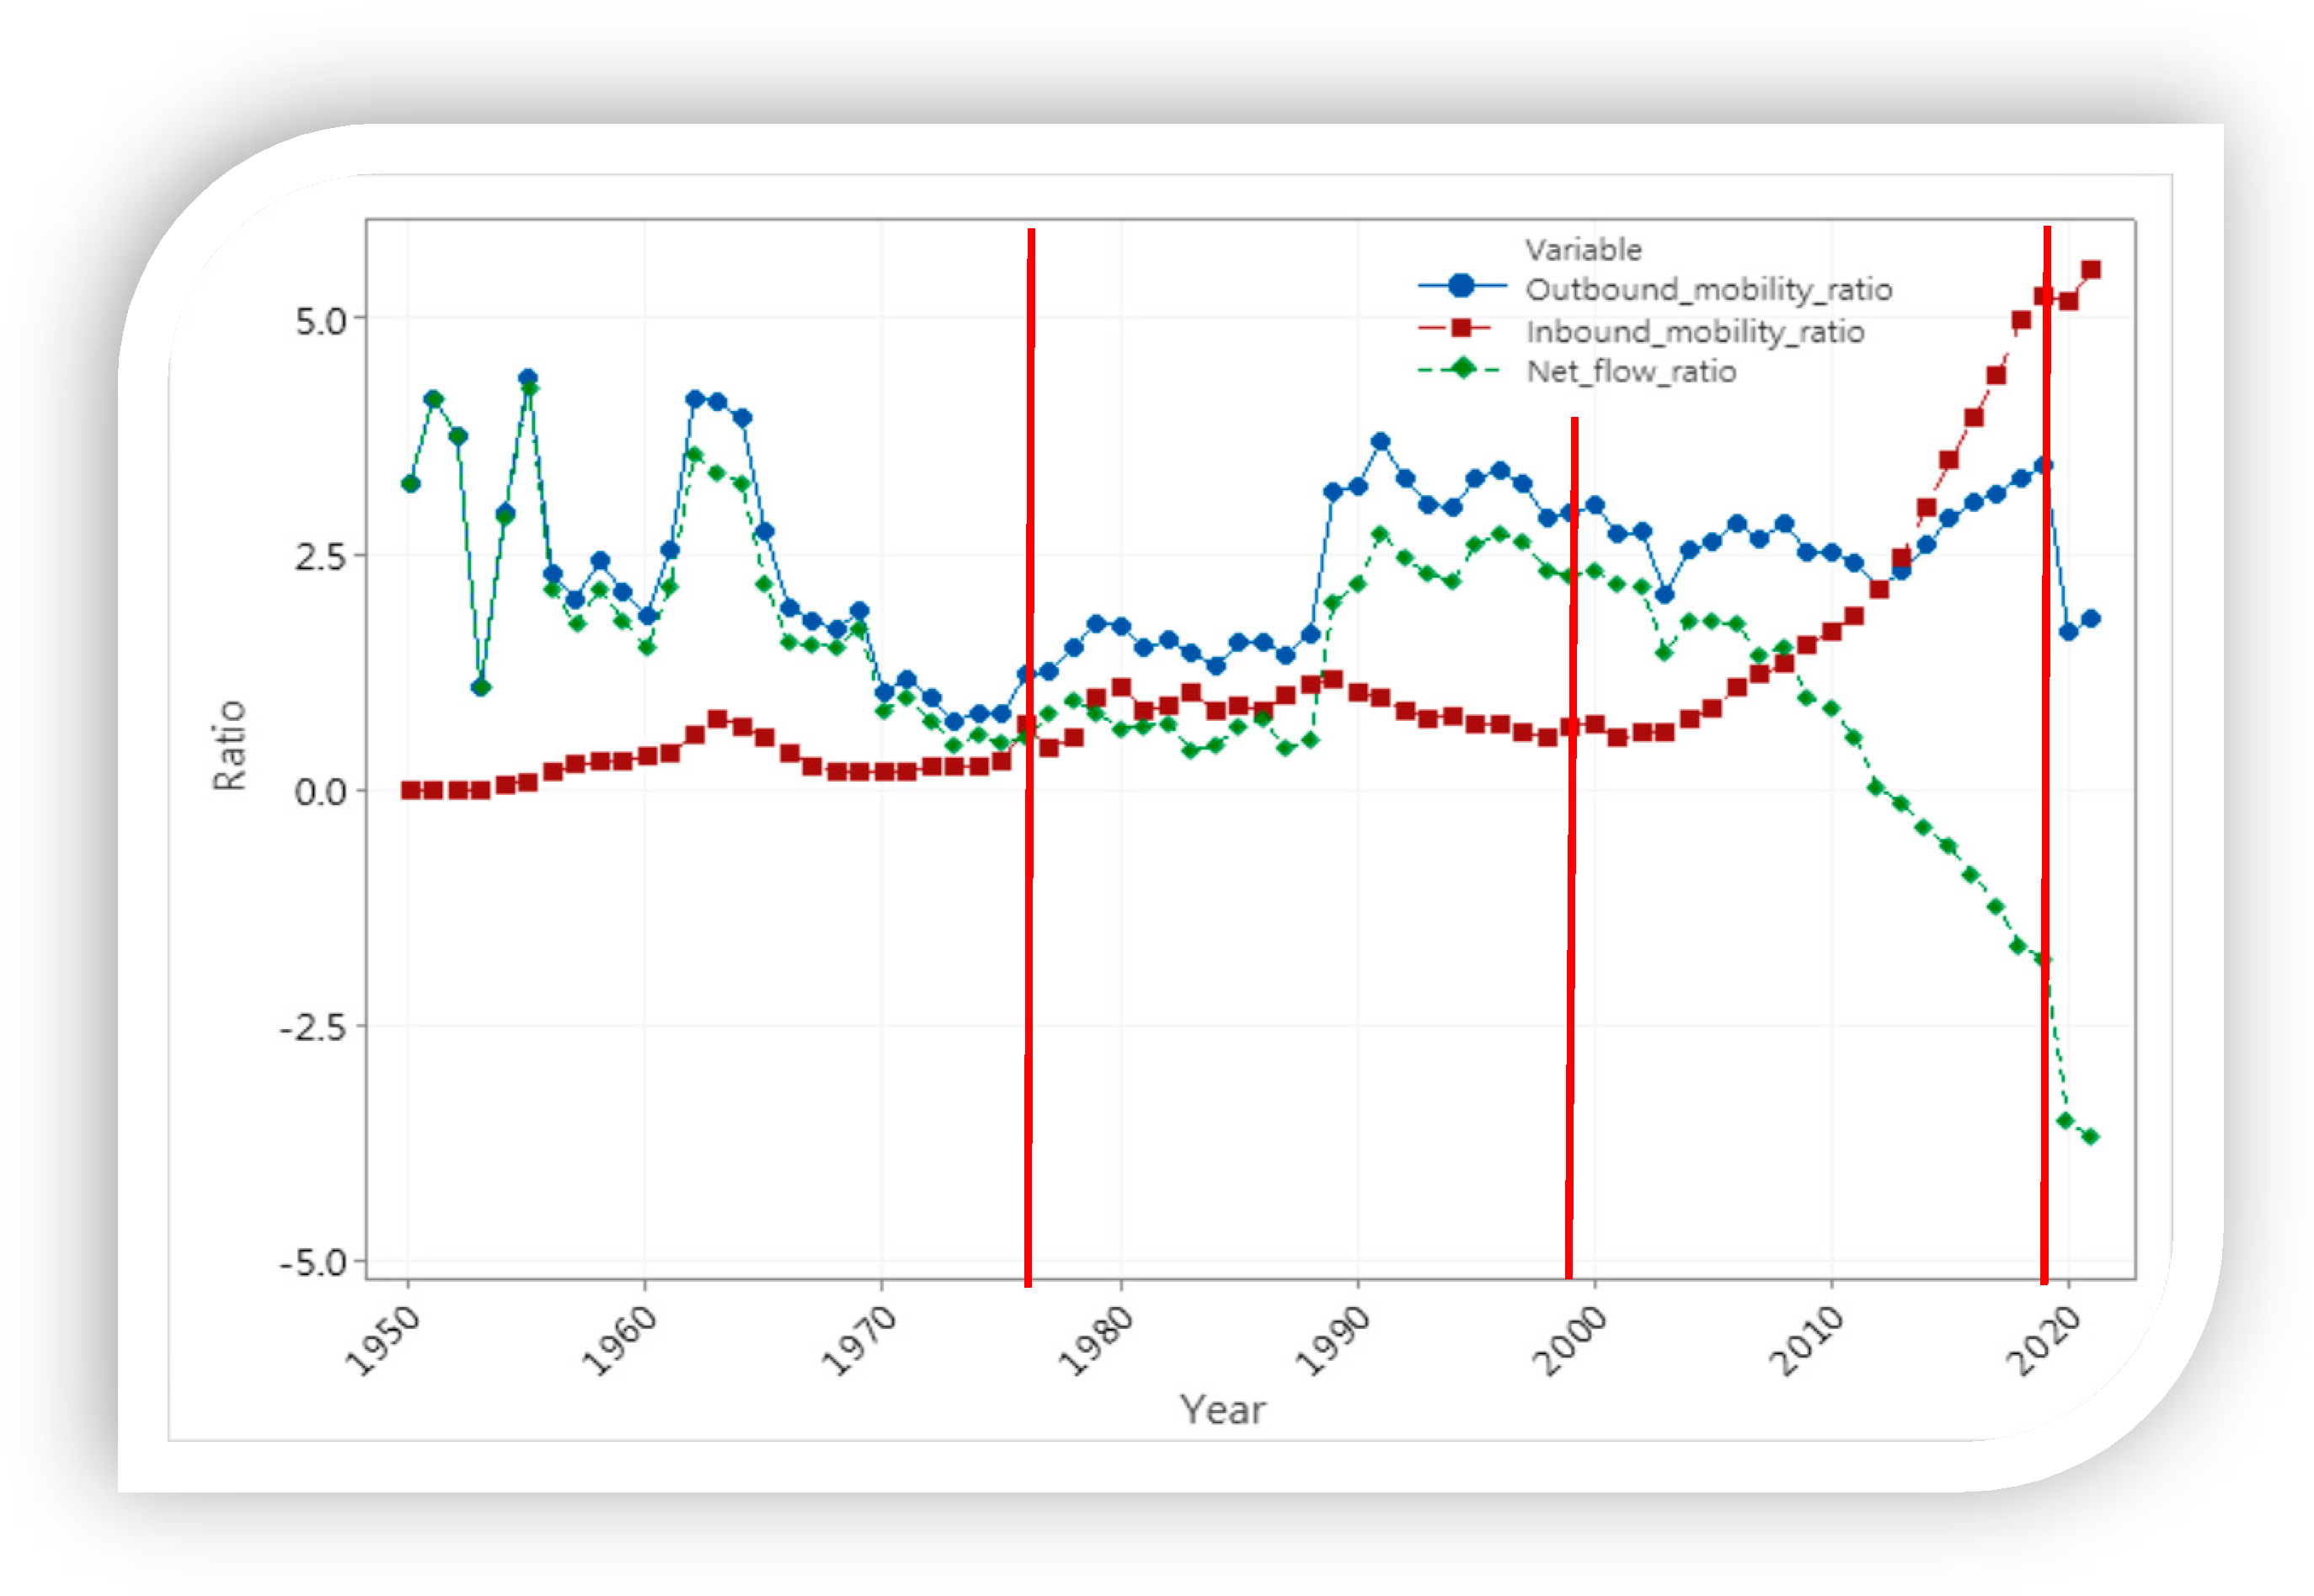
During 1990–2019, the outbound students increased rapidly in the higher education system, while the COVID-19 pandemic impacted the number of outbound students significantly from 2020 to 2021. The number of inbound students increased significantly in 2004. Since the higher education expansion, the system has transformed to an inbound oriented pattern. The numbers of inbound and outbound students from 1950 to 2021 in the system are shown in
Figure 4.
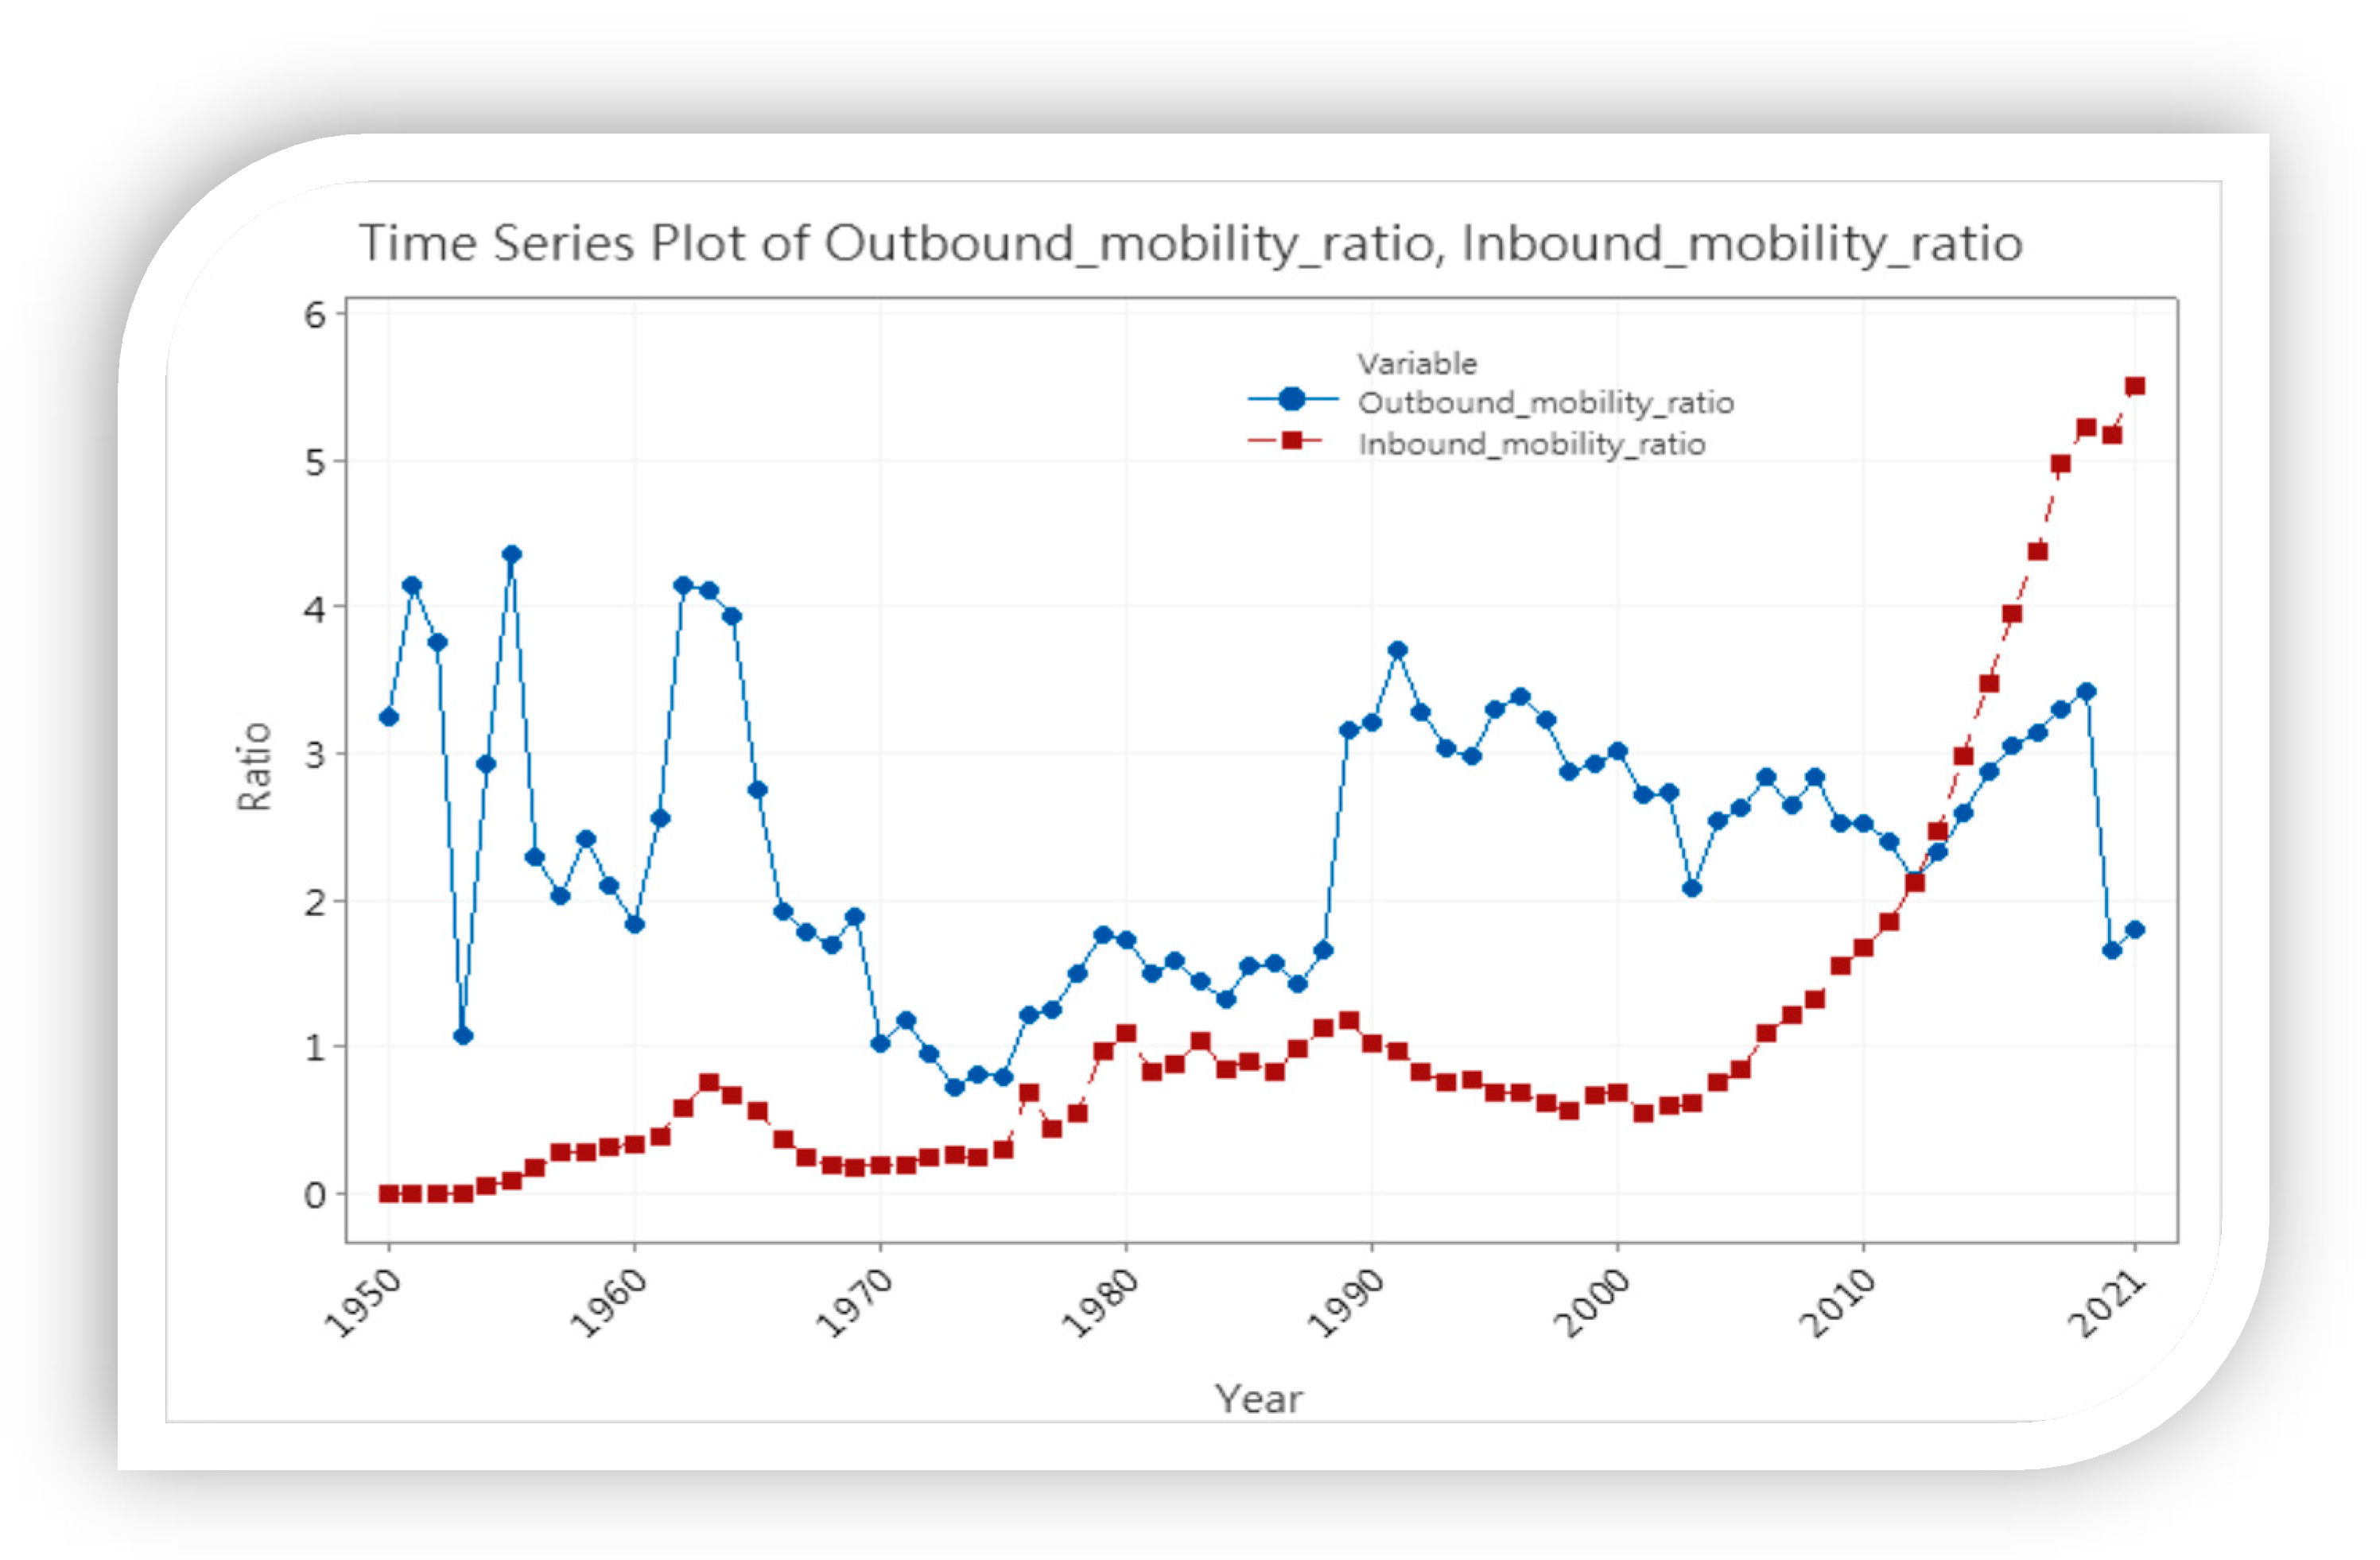
The trends of outbound and inbound mobility ratios are presented in
Figure 5. Both ratios overlapped in 2012. The results indicate that the inbound mobility ratio is increasing, while the outbound mobility ratio is decreasing steadily in the higher education system. The government’s policy initiative may contribute to this transformation.
4.4. The Effect of GER and IR on Mobility Flows
Regarding the effect of higher education expansion, we applied the CCF to determine the effects of GER and IR on mobility flows. The results of the CCF are presented in
Section 4.4.1 and
Section 4.4.2.
4.4.1. CCF with GER and Mobility Flows
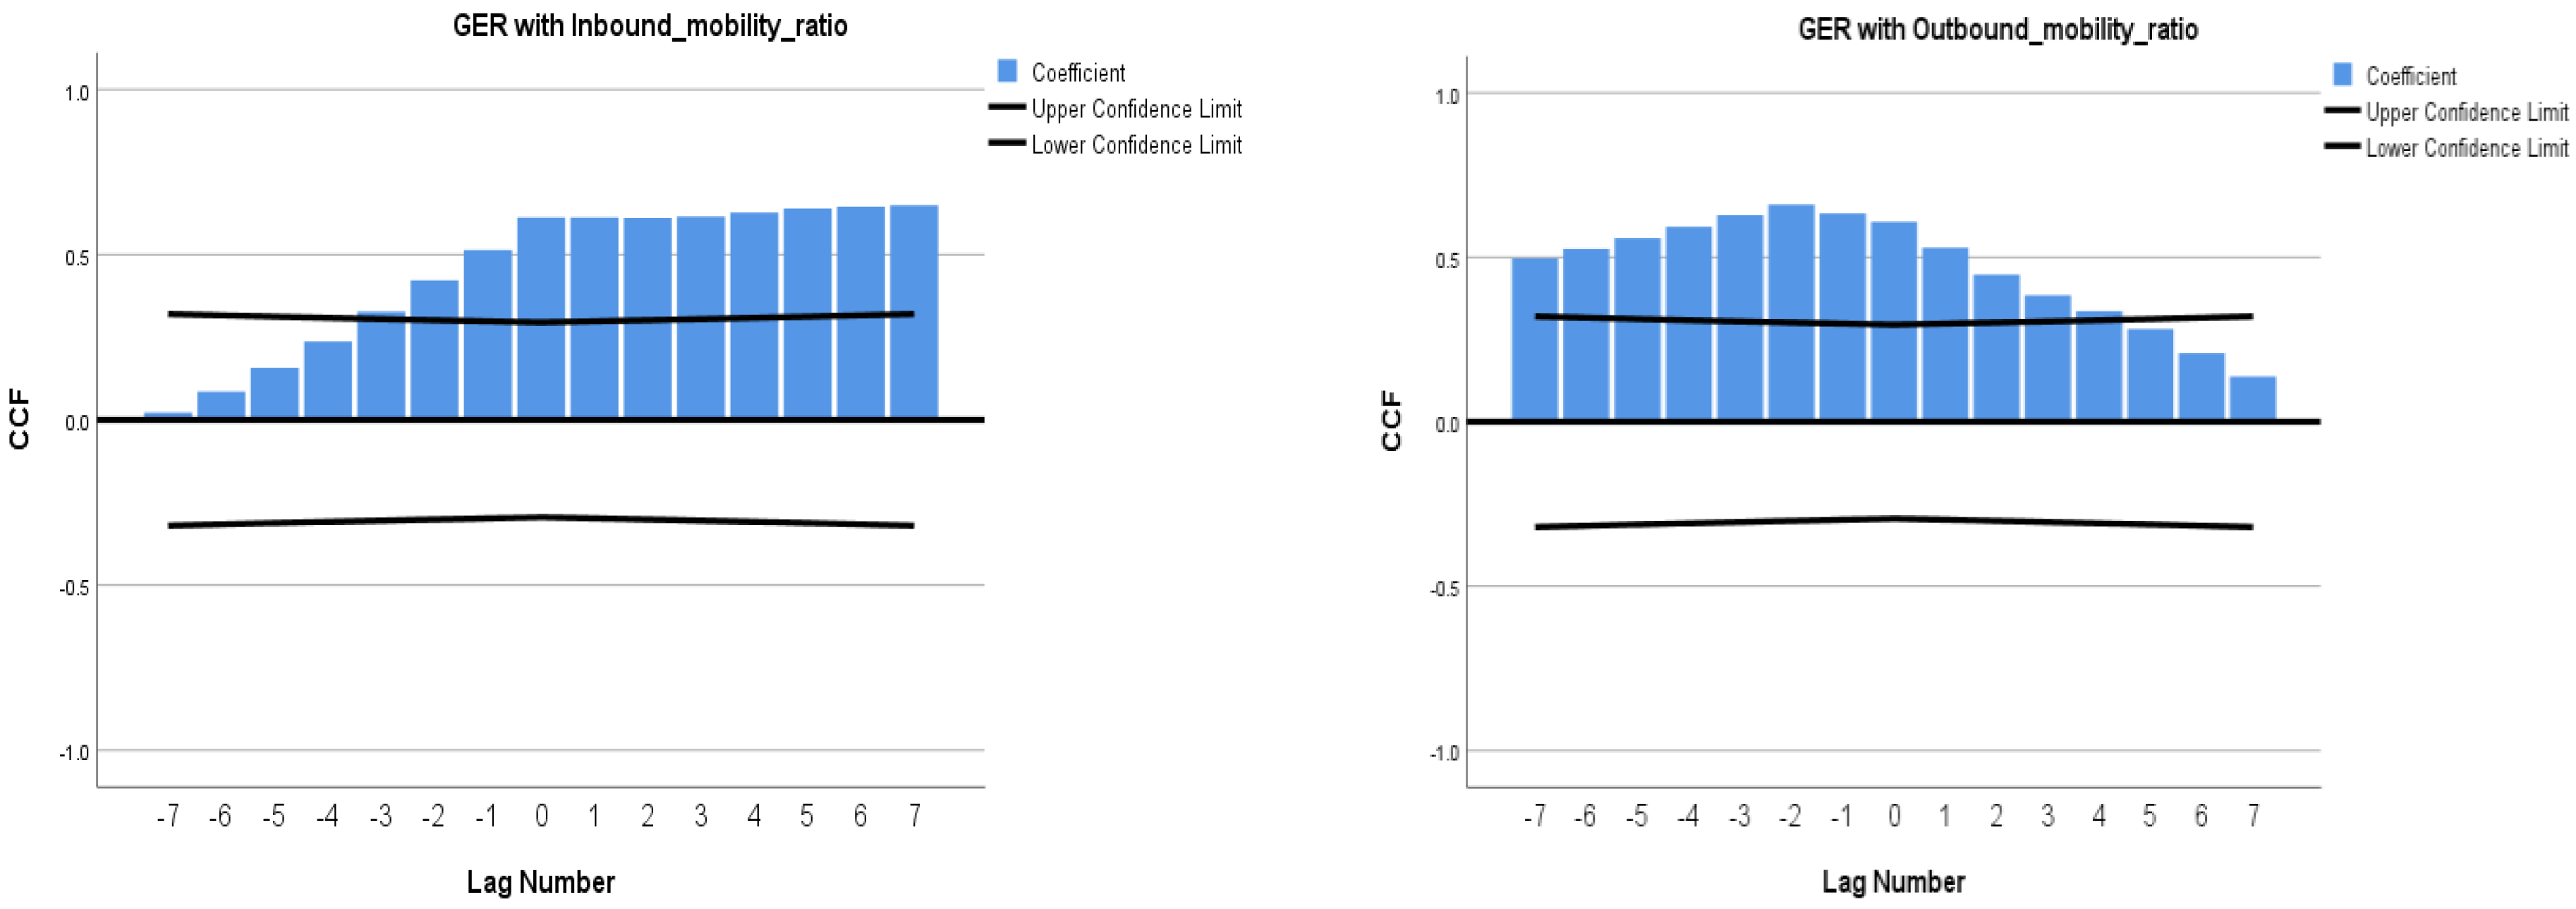
Due to the inbound students increasing in the last decade, the target higher education system might move into a brain gain stage in 2013. First, we checked the concurrent relationship between GER and IMR. We transformed the CCF with a natural logarithm transforming both series, and there was no seasonal or non-seasonal differencing. The result revealed that the significant positive cross-correlations are located in lag −2 to lag 7. This implies that the GER might lead the IMR. This implies that the increasing inbound mobility students might contribute to the GER directly. Similarly, the concurrent relationships between GER and OMR are positive, which implies the effect of GER on OMR. The result suggests that the effect of GER might lag behind the OMR. The results of CCF with GER and both IMR and OMR are presented in
Table 2.
Figure 6 shows the coefficients with upper and lower confidence limits. The effect of GER influences the inbound and outbound mobility ratio and was supported.
4.4.2. CCF with IR and Mobility Flows
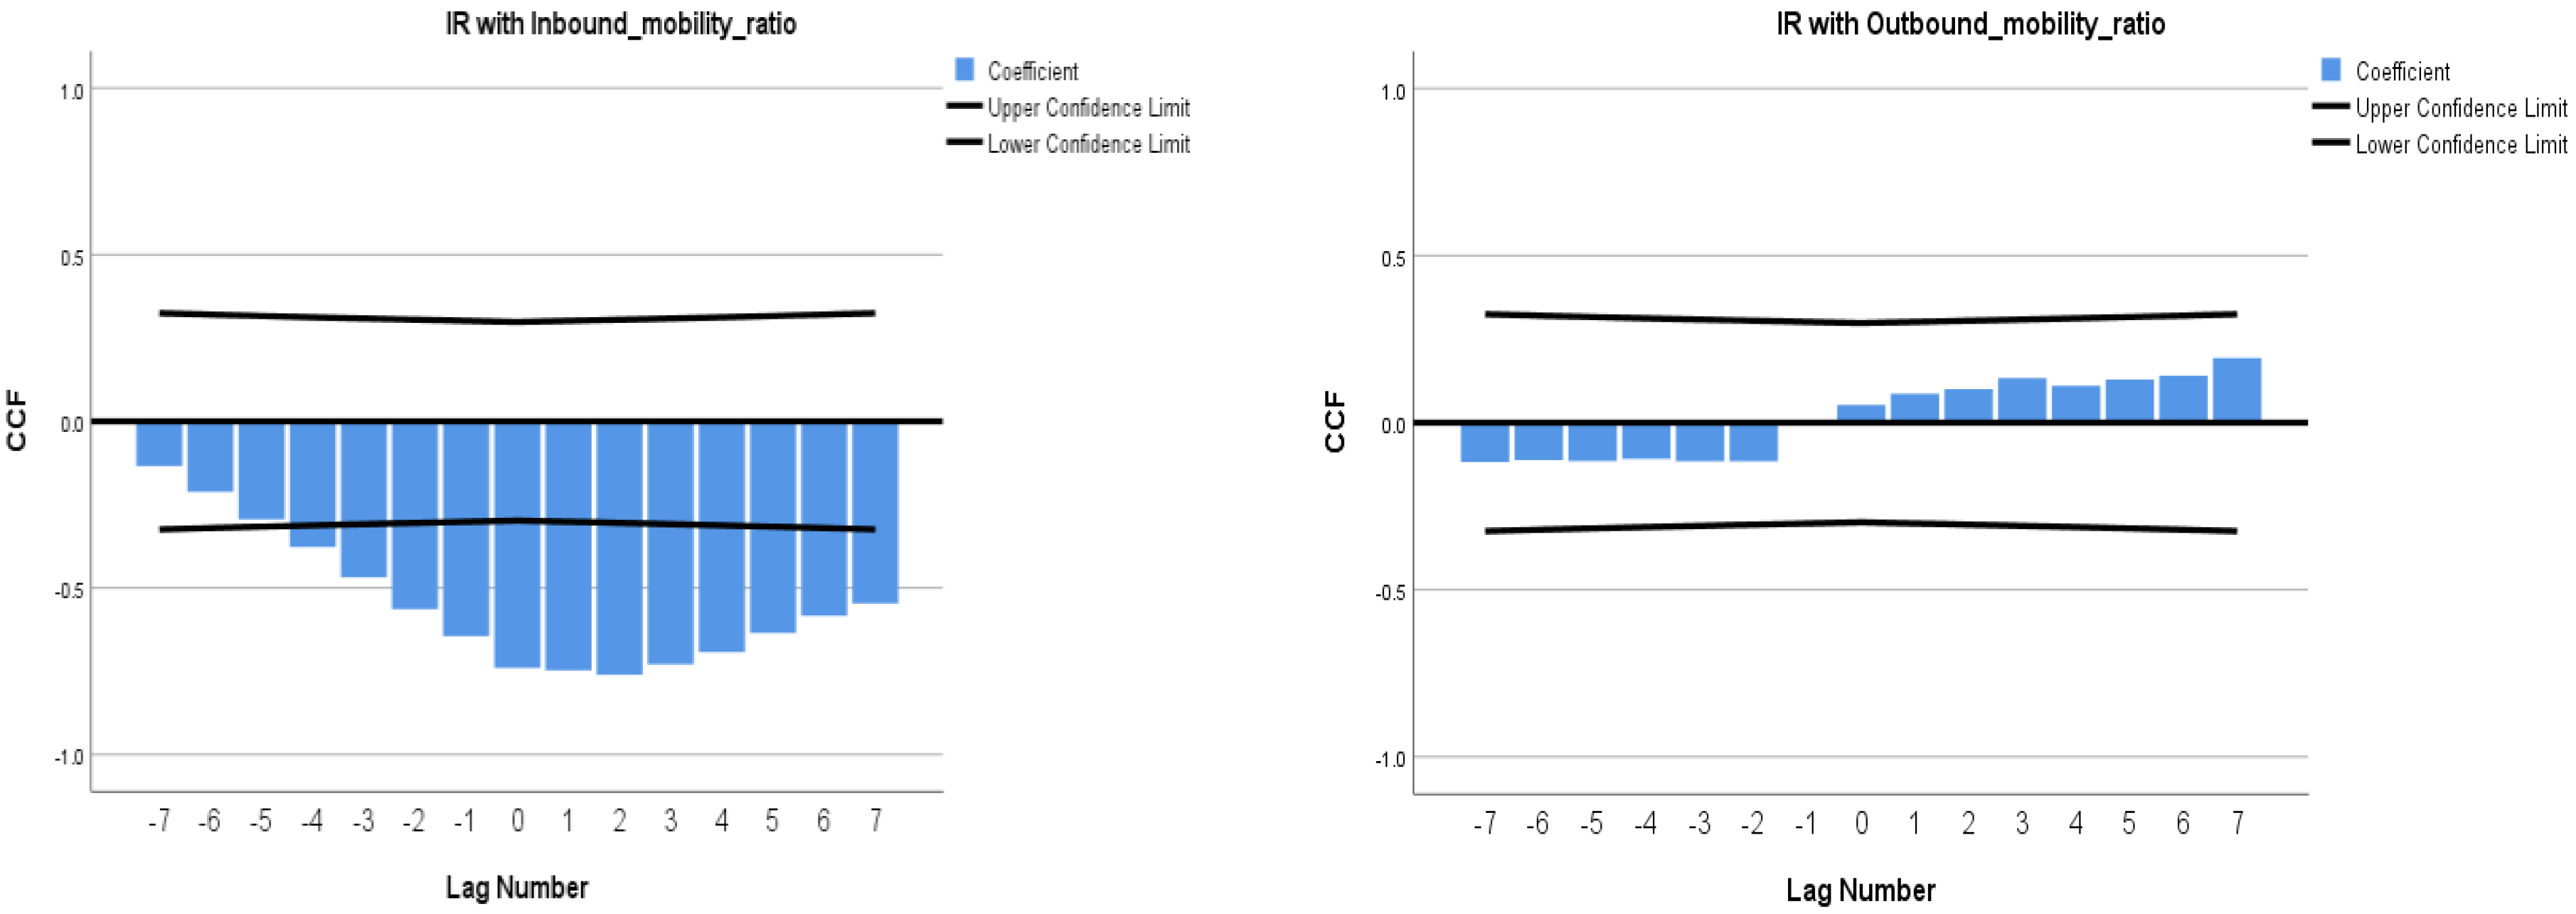
Due to the IR with some negative values, it cannot be transformed with a natural logarithm in CCF. After checking the concurrent relationship between IR and IMR, we found that there were significant negative cross-correlations located in lag −4 to lag 7. This implies that the IR might lag behind the IMR. The increasing inbound mobility students might contribute to the IR directly. With a similar approach, we found that there was no cross-relationship between IR and OMR. This implies that the IR did not impact on OMR. The results of CCF with IR and both IMR and OMR are presented in
Table 3.
Figure 7 shows the coefficients with upper and lower confidence limits. The effect of IR influencing the inbound mobility ratio was supported, while the effect of IR influencing the outbound mobility ratio was not supported.
4.5. The Effect of GER and IR on Net Flow Ratio
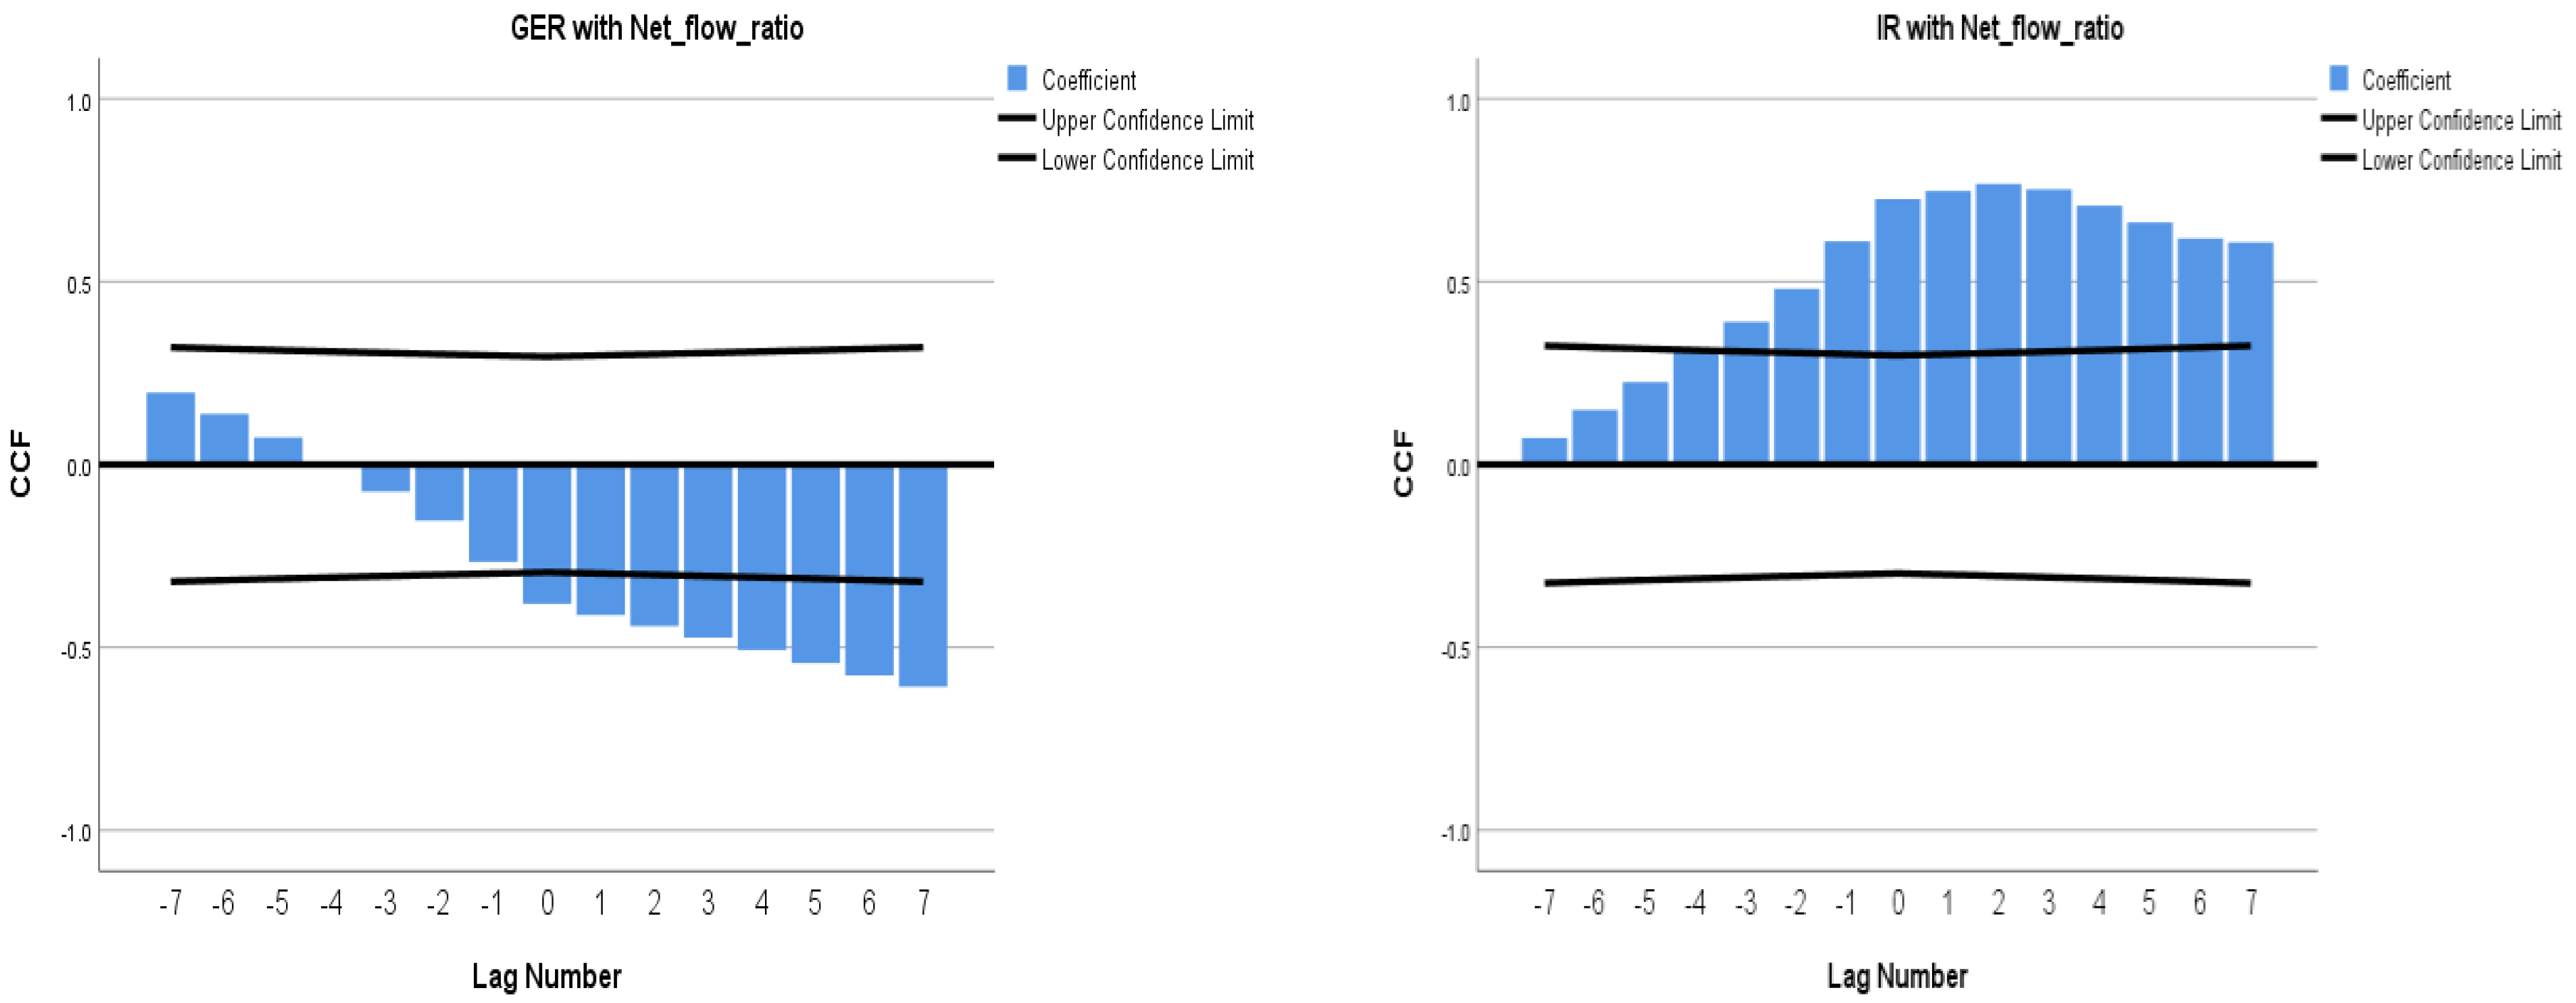
Since some of net flow ratios with negative values, the series cannot be transformed with a natural logarithm in CCF. The negative net flow ratio implies that the higher education belongs to an inbound-oriented system. The result of CCF with GER and the net flow ratio reveals that the cross-correlations are negative at the 0.05 level, and the lags are located from 1 to 7. The result may indicate that the GER lags behind the net flow ratio, while the GER on the net flow ratio belongs to the lag effect.
The IR was negative from 2013 to 2021, and the result implied that the enrollment of the higher education system has declined. Checking the CCF with the IR and net flow ratio, we found that the significant positive cross-correlations are located in lag −3 to lag 7. The finding suggests that the IR tends to lead the net flow ratio. In this case, the effect of IR influencing the net flow ratio was supported. The details of the effect of GER and IR on net flow ratio are presented in
Table 4 and
Figure 8.
4.6. Predicting GER, IR and Net Flow Ratio for 2030
4.6.1. Predicting GER for 2030
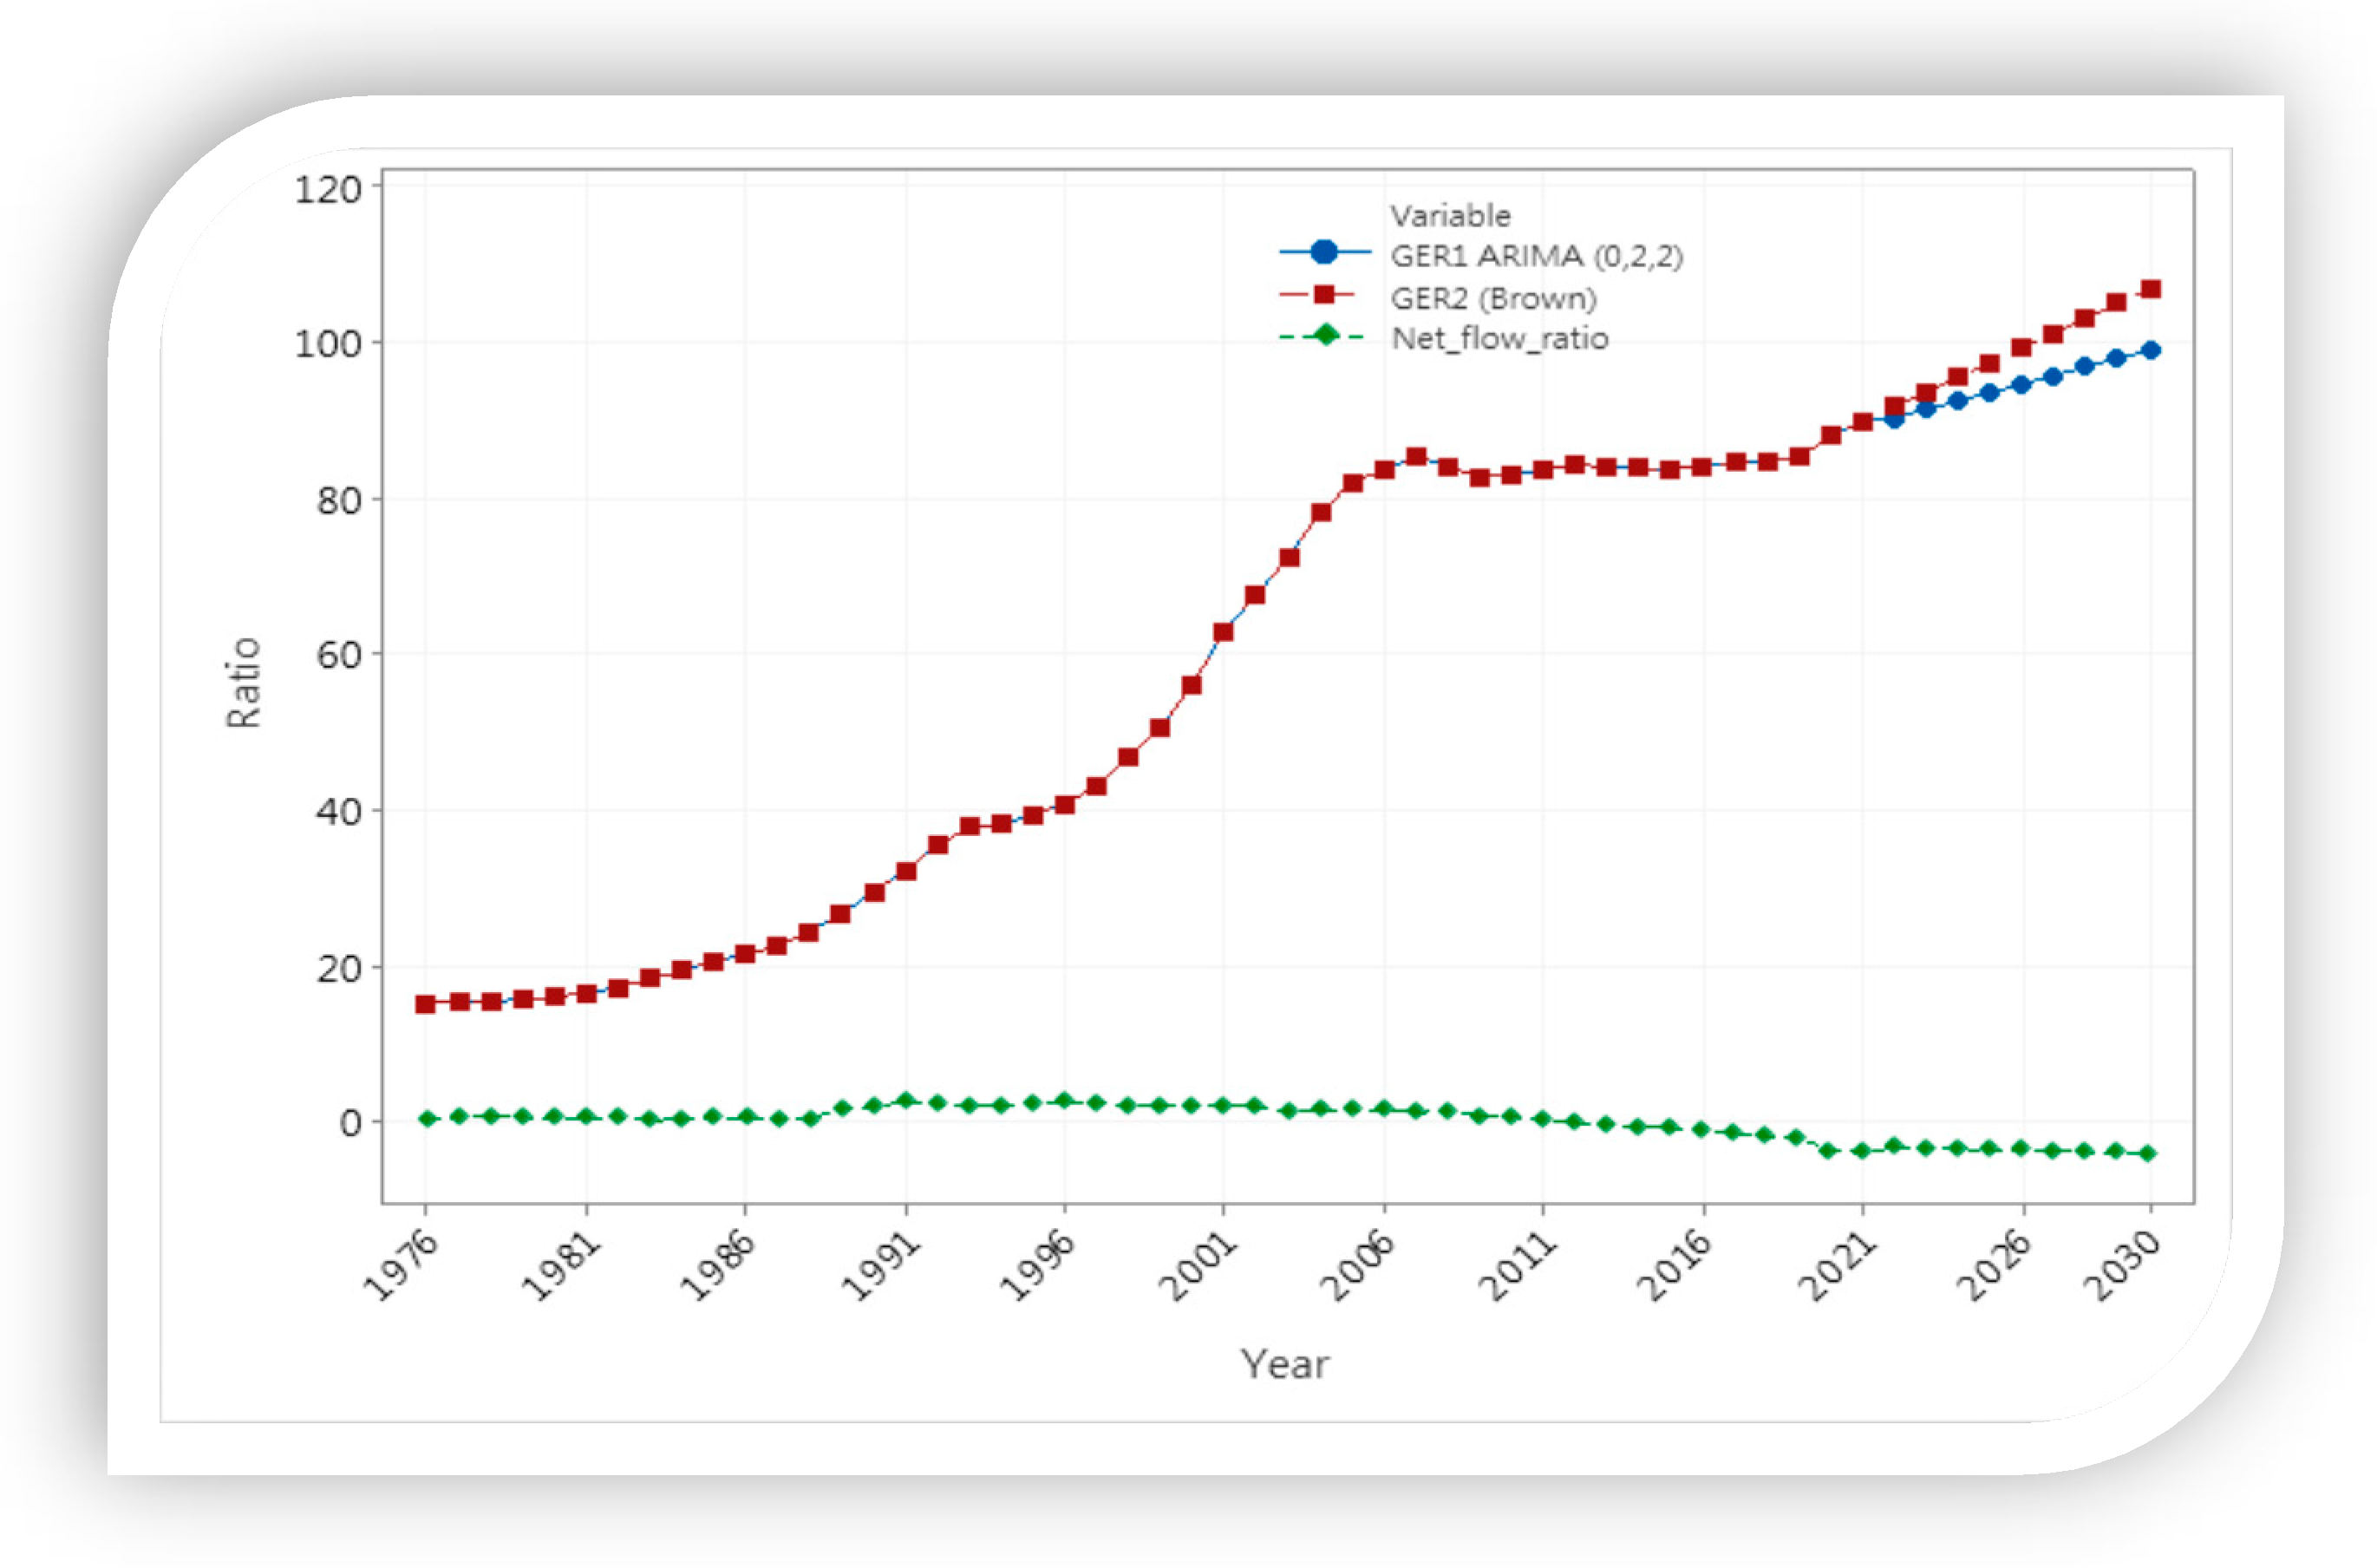
Based on SPSS expert explorer, the system suggests that the GER series fit Brown’s linear trend (it is a linear trend with no seasonality). Brown’s exponential smoothing is most similar to an ARIMA (0,2,2) [
70]. First, we checked that the GER series fit the ARIMA (0,2,2) model with Minitab. Second, after two orders of differencing, we found that the coefficient of MA (2) was 0.558 (t = 4.29,
p = 0.000). Third, the Ljung–Box Chi-square statistics demonstrated values of 8.34 in lag 12 (
p = 0.595), 16.42 in lag 24 (
p = 0.794) and 18.82 (
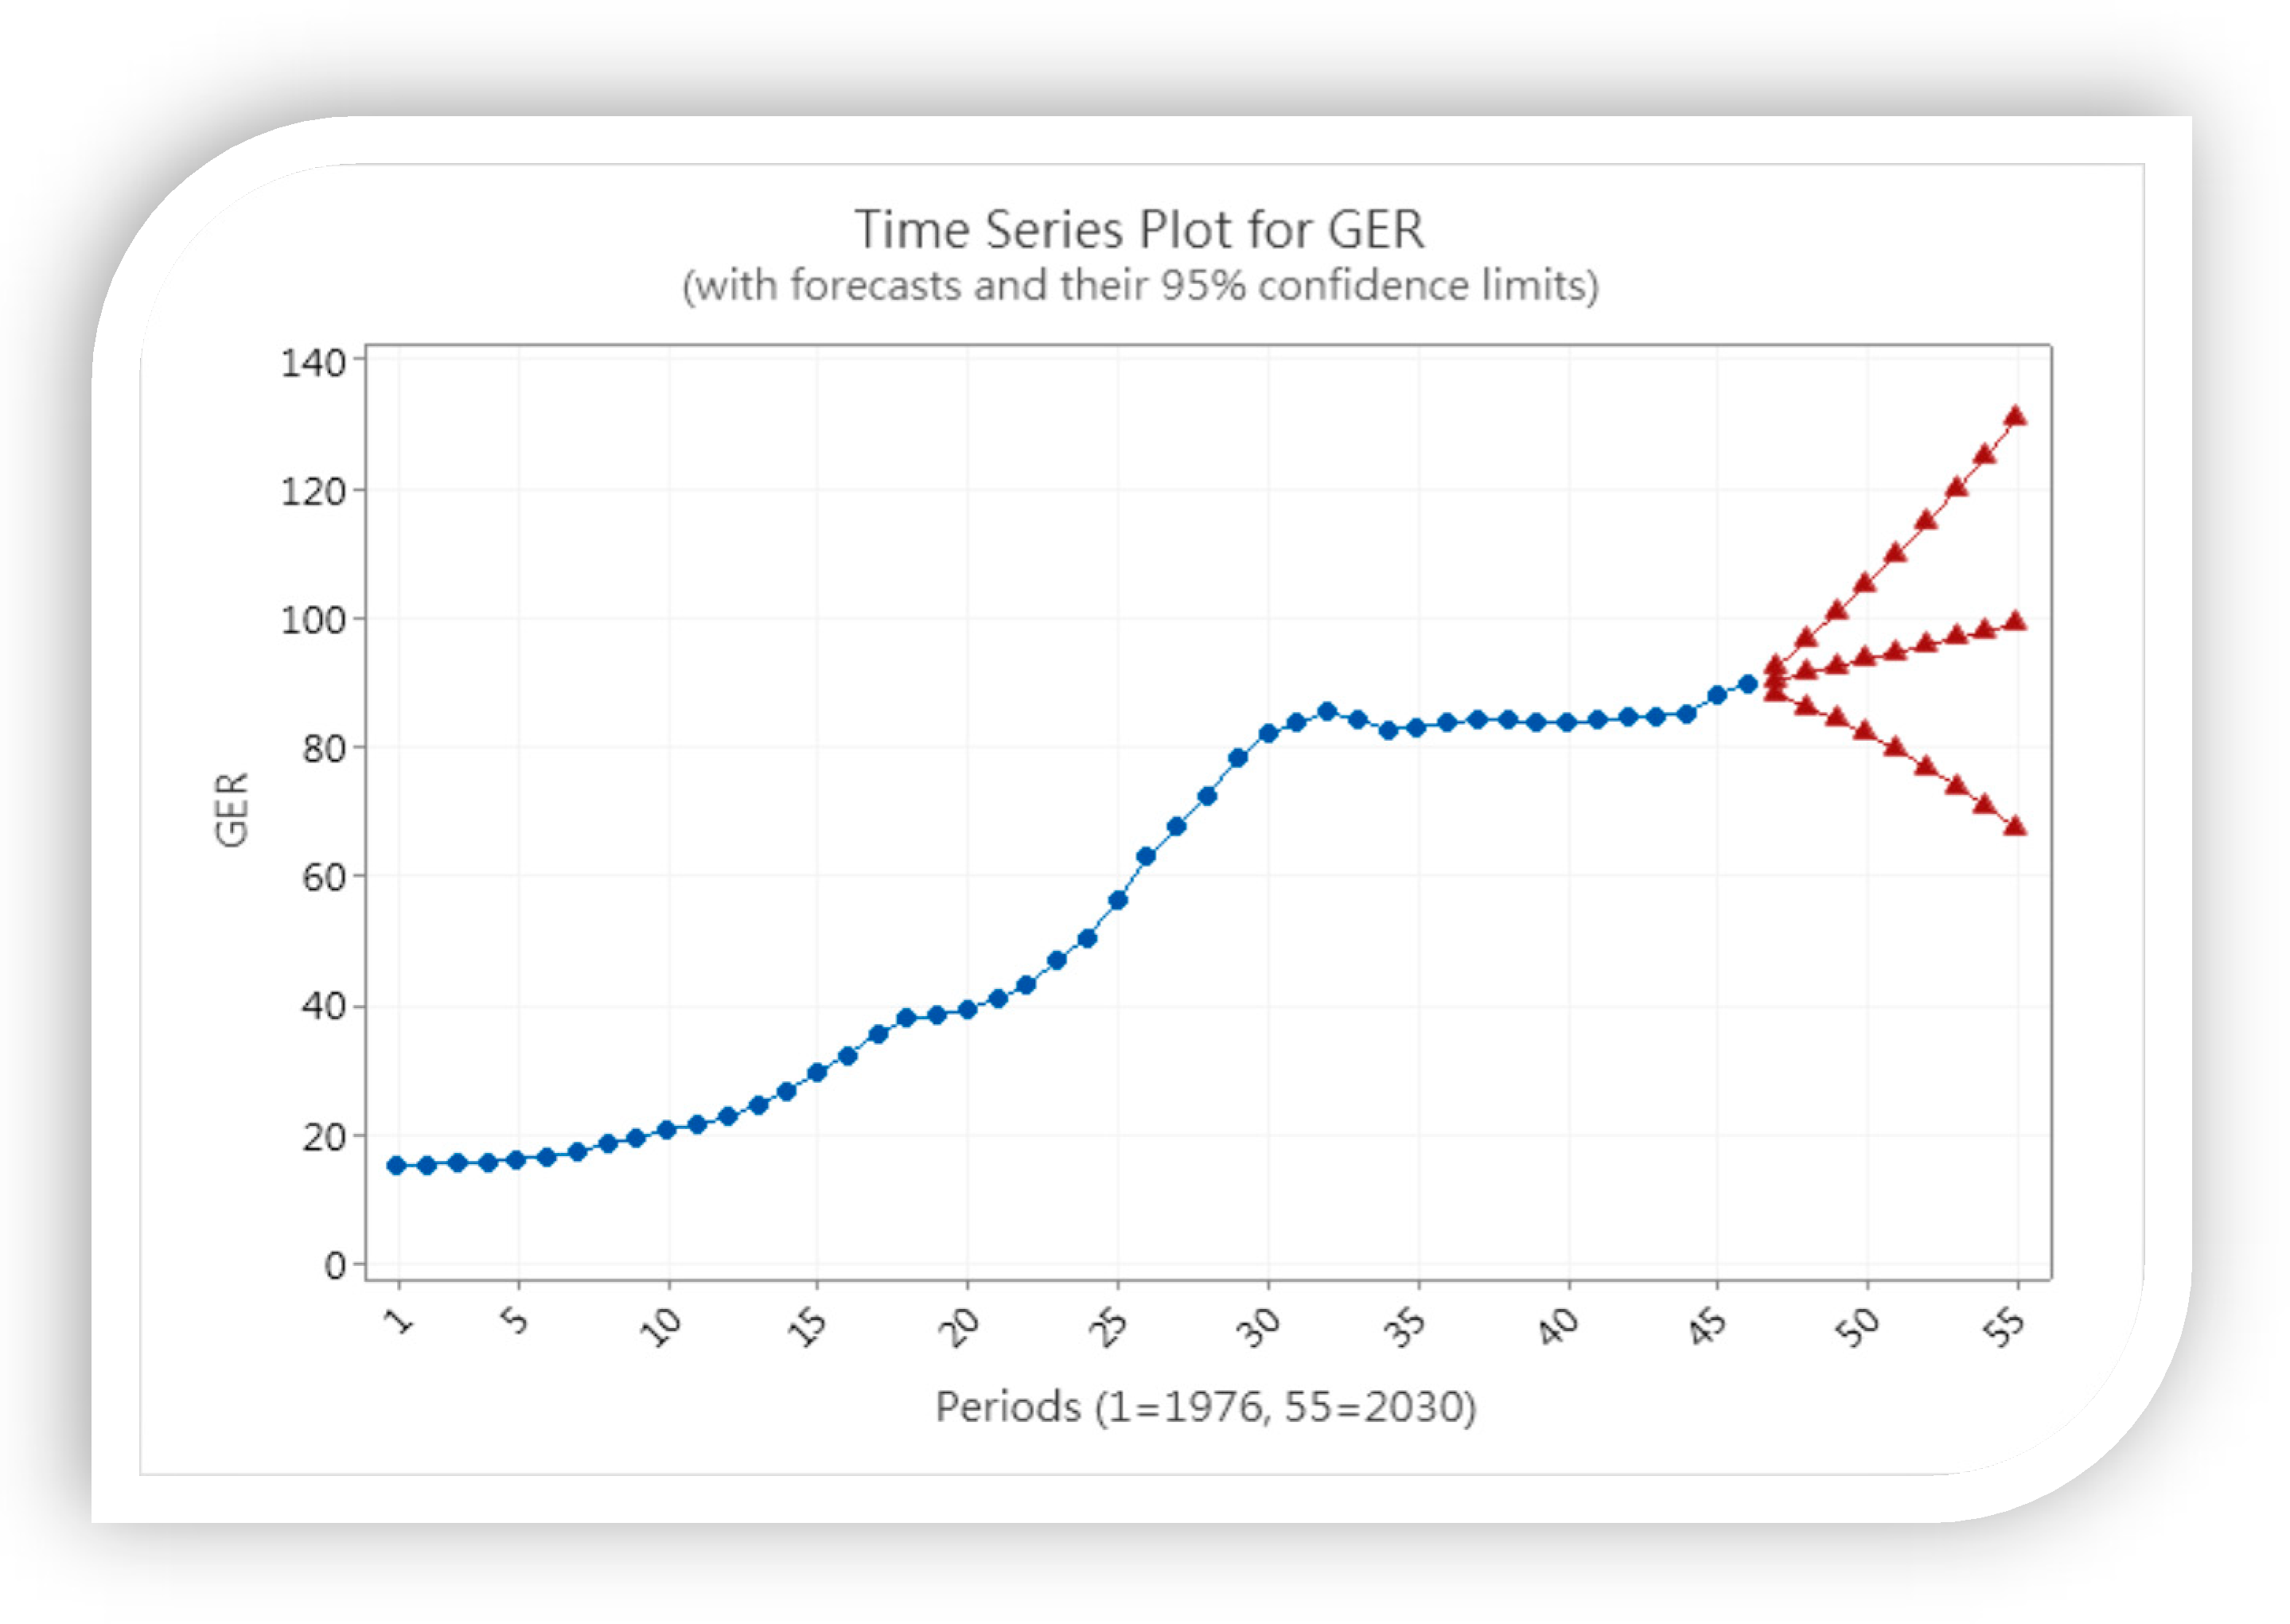
p = 0.984). The result reveals that the residuals were independent. The result also reveals that the GER will increase from 90.225 in 2022 to 98.937 in 2030 in the higher education system, as shown in
Table 5.
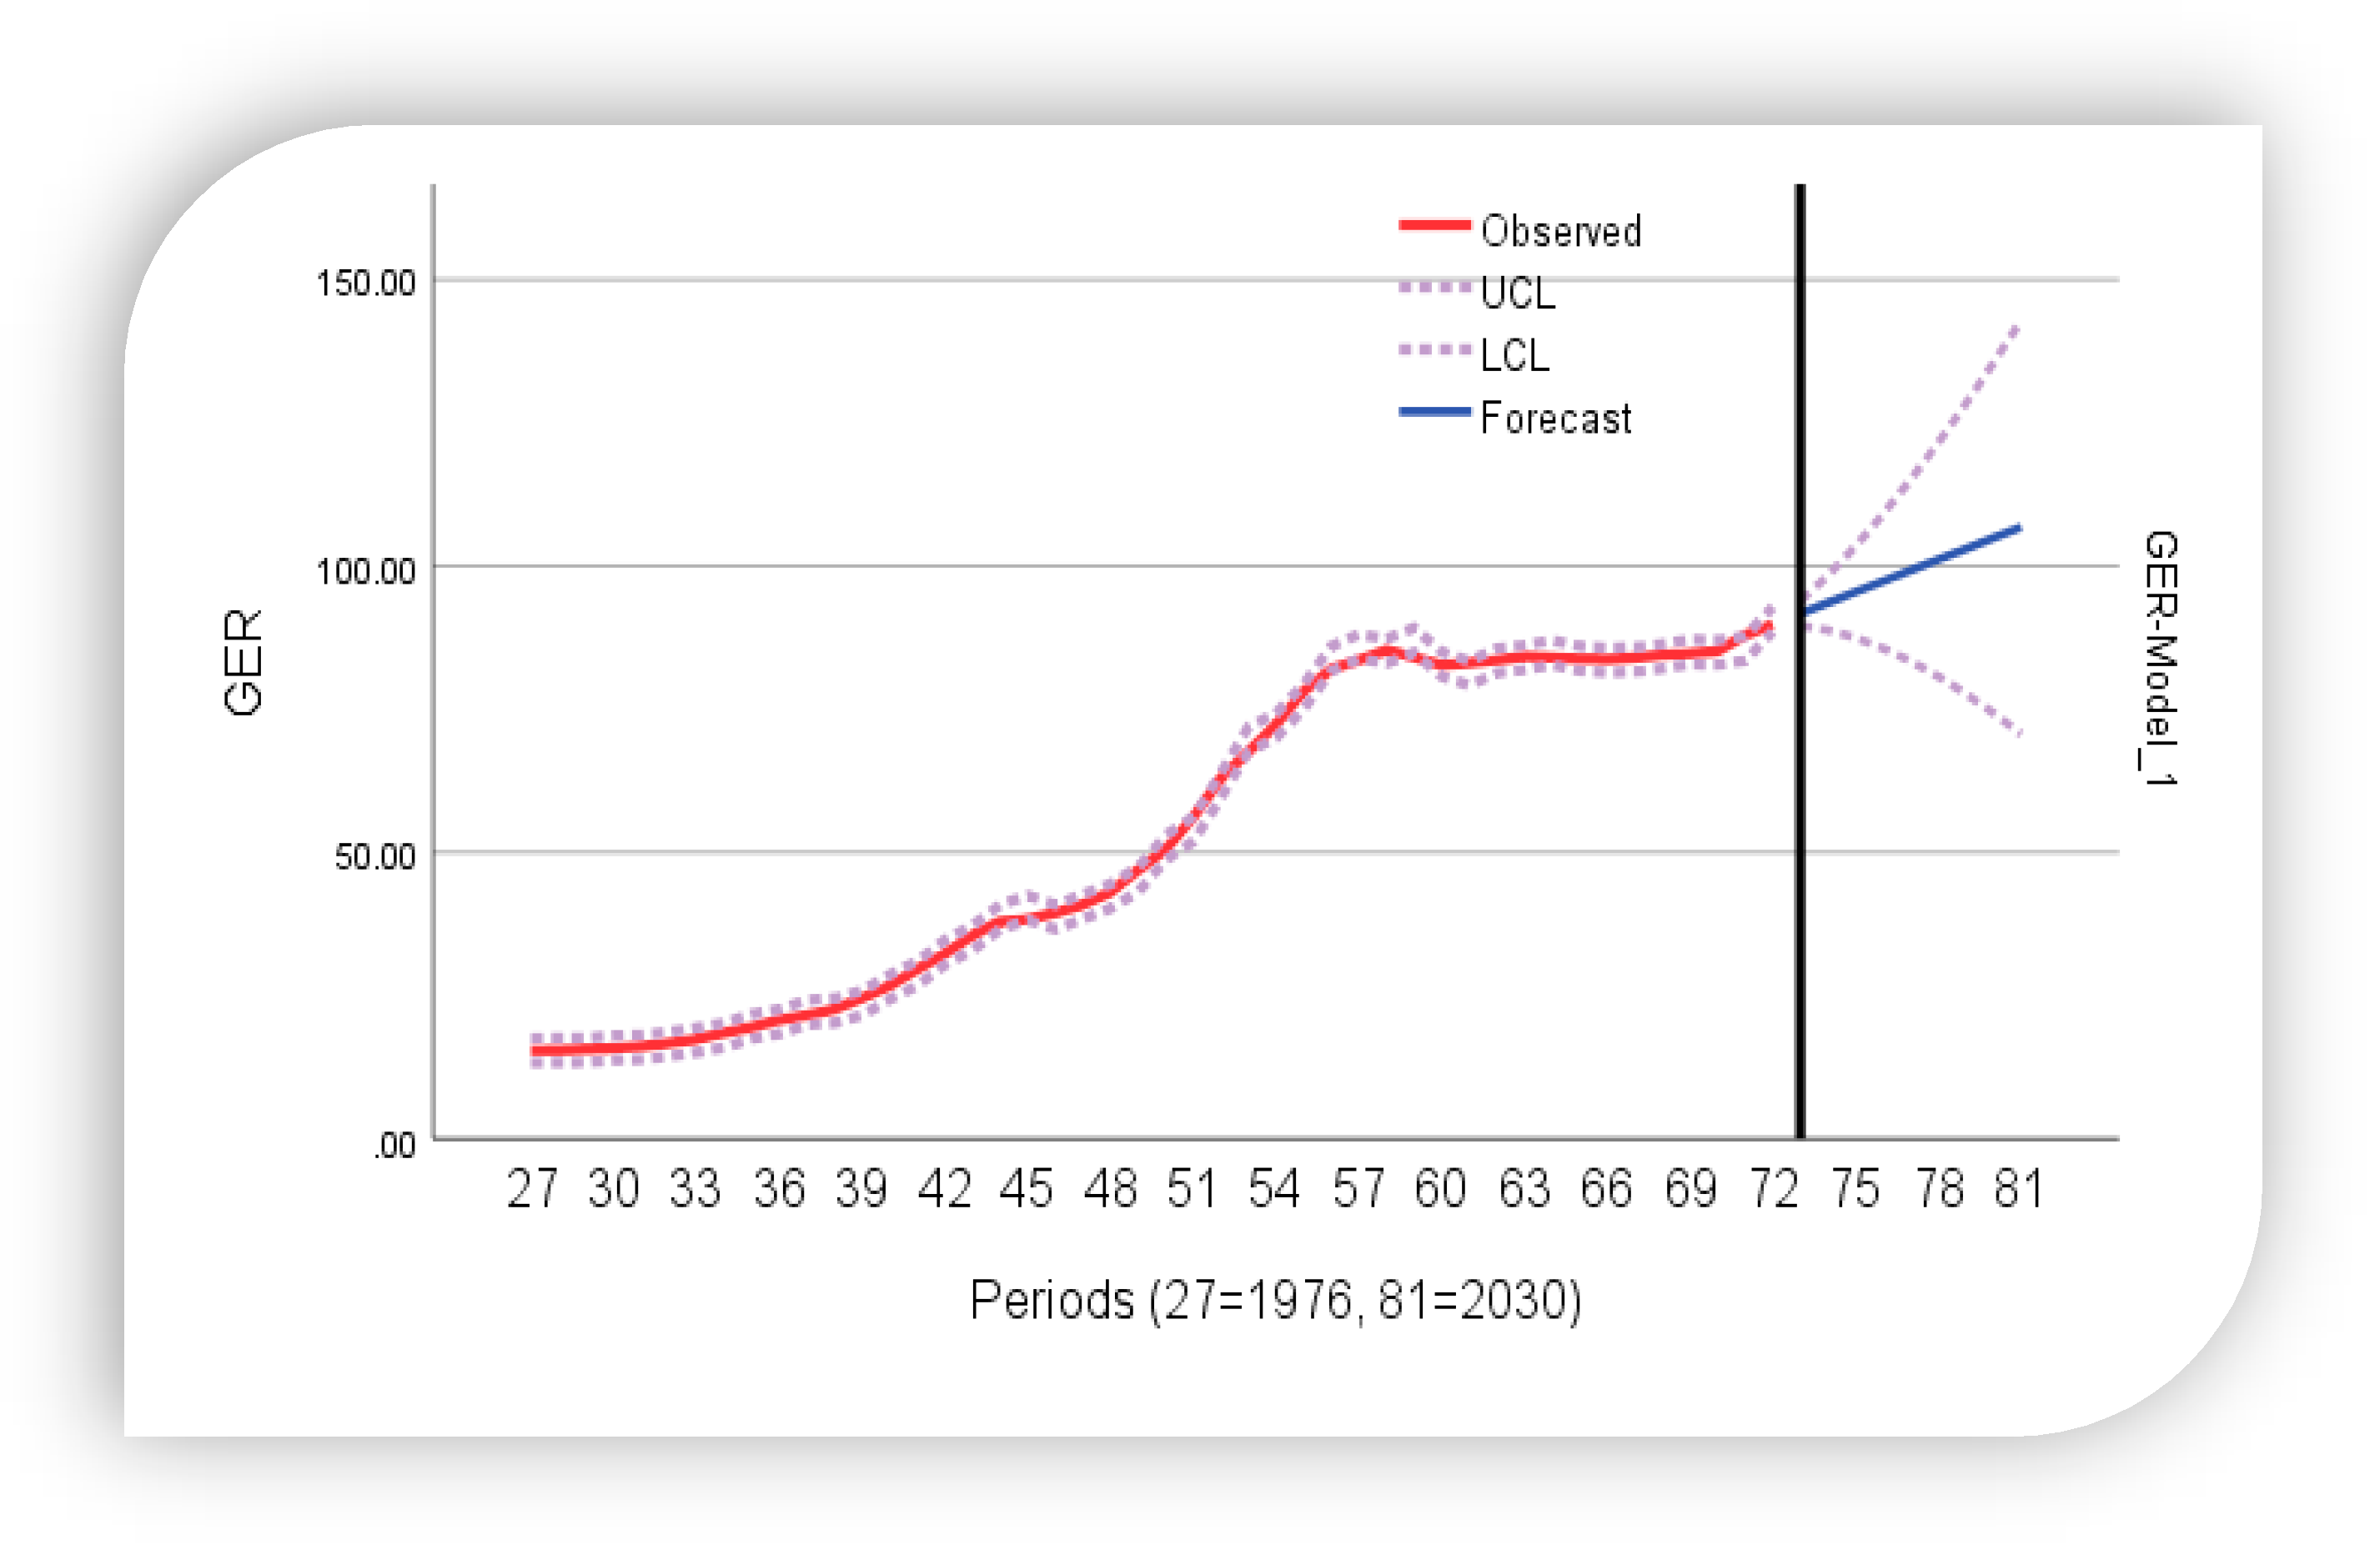
Figure 9 shows the result of the prediction with ARIMA (0,2,2). The values from 1 to 46 periods with blue color are previous GER; The values from 47 to 55 with red color are forecasts. While the result of Brown’s exponential smoothing reveals that alpha (level and trend) is 1.00 (t = 13.315,
p = 0.000), Ljung–Box Q (18) = 14.019 (df = 17,
p = 0.666), implying that the residuals are independent. The GER is forecast to change from 91.695 in 2022 to 106.773 in 2030. The details of the predicted GER obtained with Brown’s method are presented in
Table 5 and
Figure 10. Both predicted methods indicated that the GER will increase in the future.
4.6.2. Predicting IR for 2030
The SPSS suggests that the IR series fit the simple seasonal exponential smoothing model. Simple seasonal exponential smoothing is similar to an ARIMA (0,1,1) (0,1,12) model [
67]. The observations of the original series are 72, and those after differencing are 59. The result of ARIMA (0,1,1) (0,1,12) shows that the coefficient of MA (1) is 0.431 (t = 3.88,
p = 0.000) and the coefficient of SMA (12) is 0.924 (t = 11.84,
p = 0.000). The Ljung–Box Chi-square statistics are not significant at lag 12, 24, 36 and 48, implying that the residuals are independent. The result of forecasts shows that the IR will fluctuate from −0.027 in 2022 to −0.055 in 2030. This implies that the enrollment expansion is intended to decline in the future. The details of forecasts are represented in
Table 6 and
Figure 11.
4.6.3. Predicting the Net Flow Ratio for 2030
We predicted the net flow ratio to determine the trend of 2030 in the target higher education system. Based on the candidate ARIMA models, we compared the model fit with parameters ACF, PACF and residuals. Finally, the ARIMA (0,1,2) was the fitted model used to predict the net flow ratio. The coefficient of MA (1) is −0.054 (t = −0.48,
p = 0.633) and the coefficient of MA (2) is 0.383 (t = 3.15,
p = 0.007). The result demonstrates that the residuals are independent in this model.
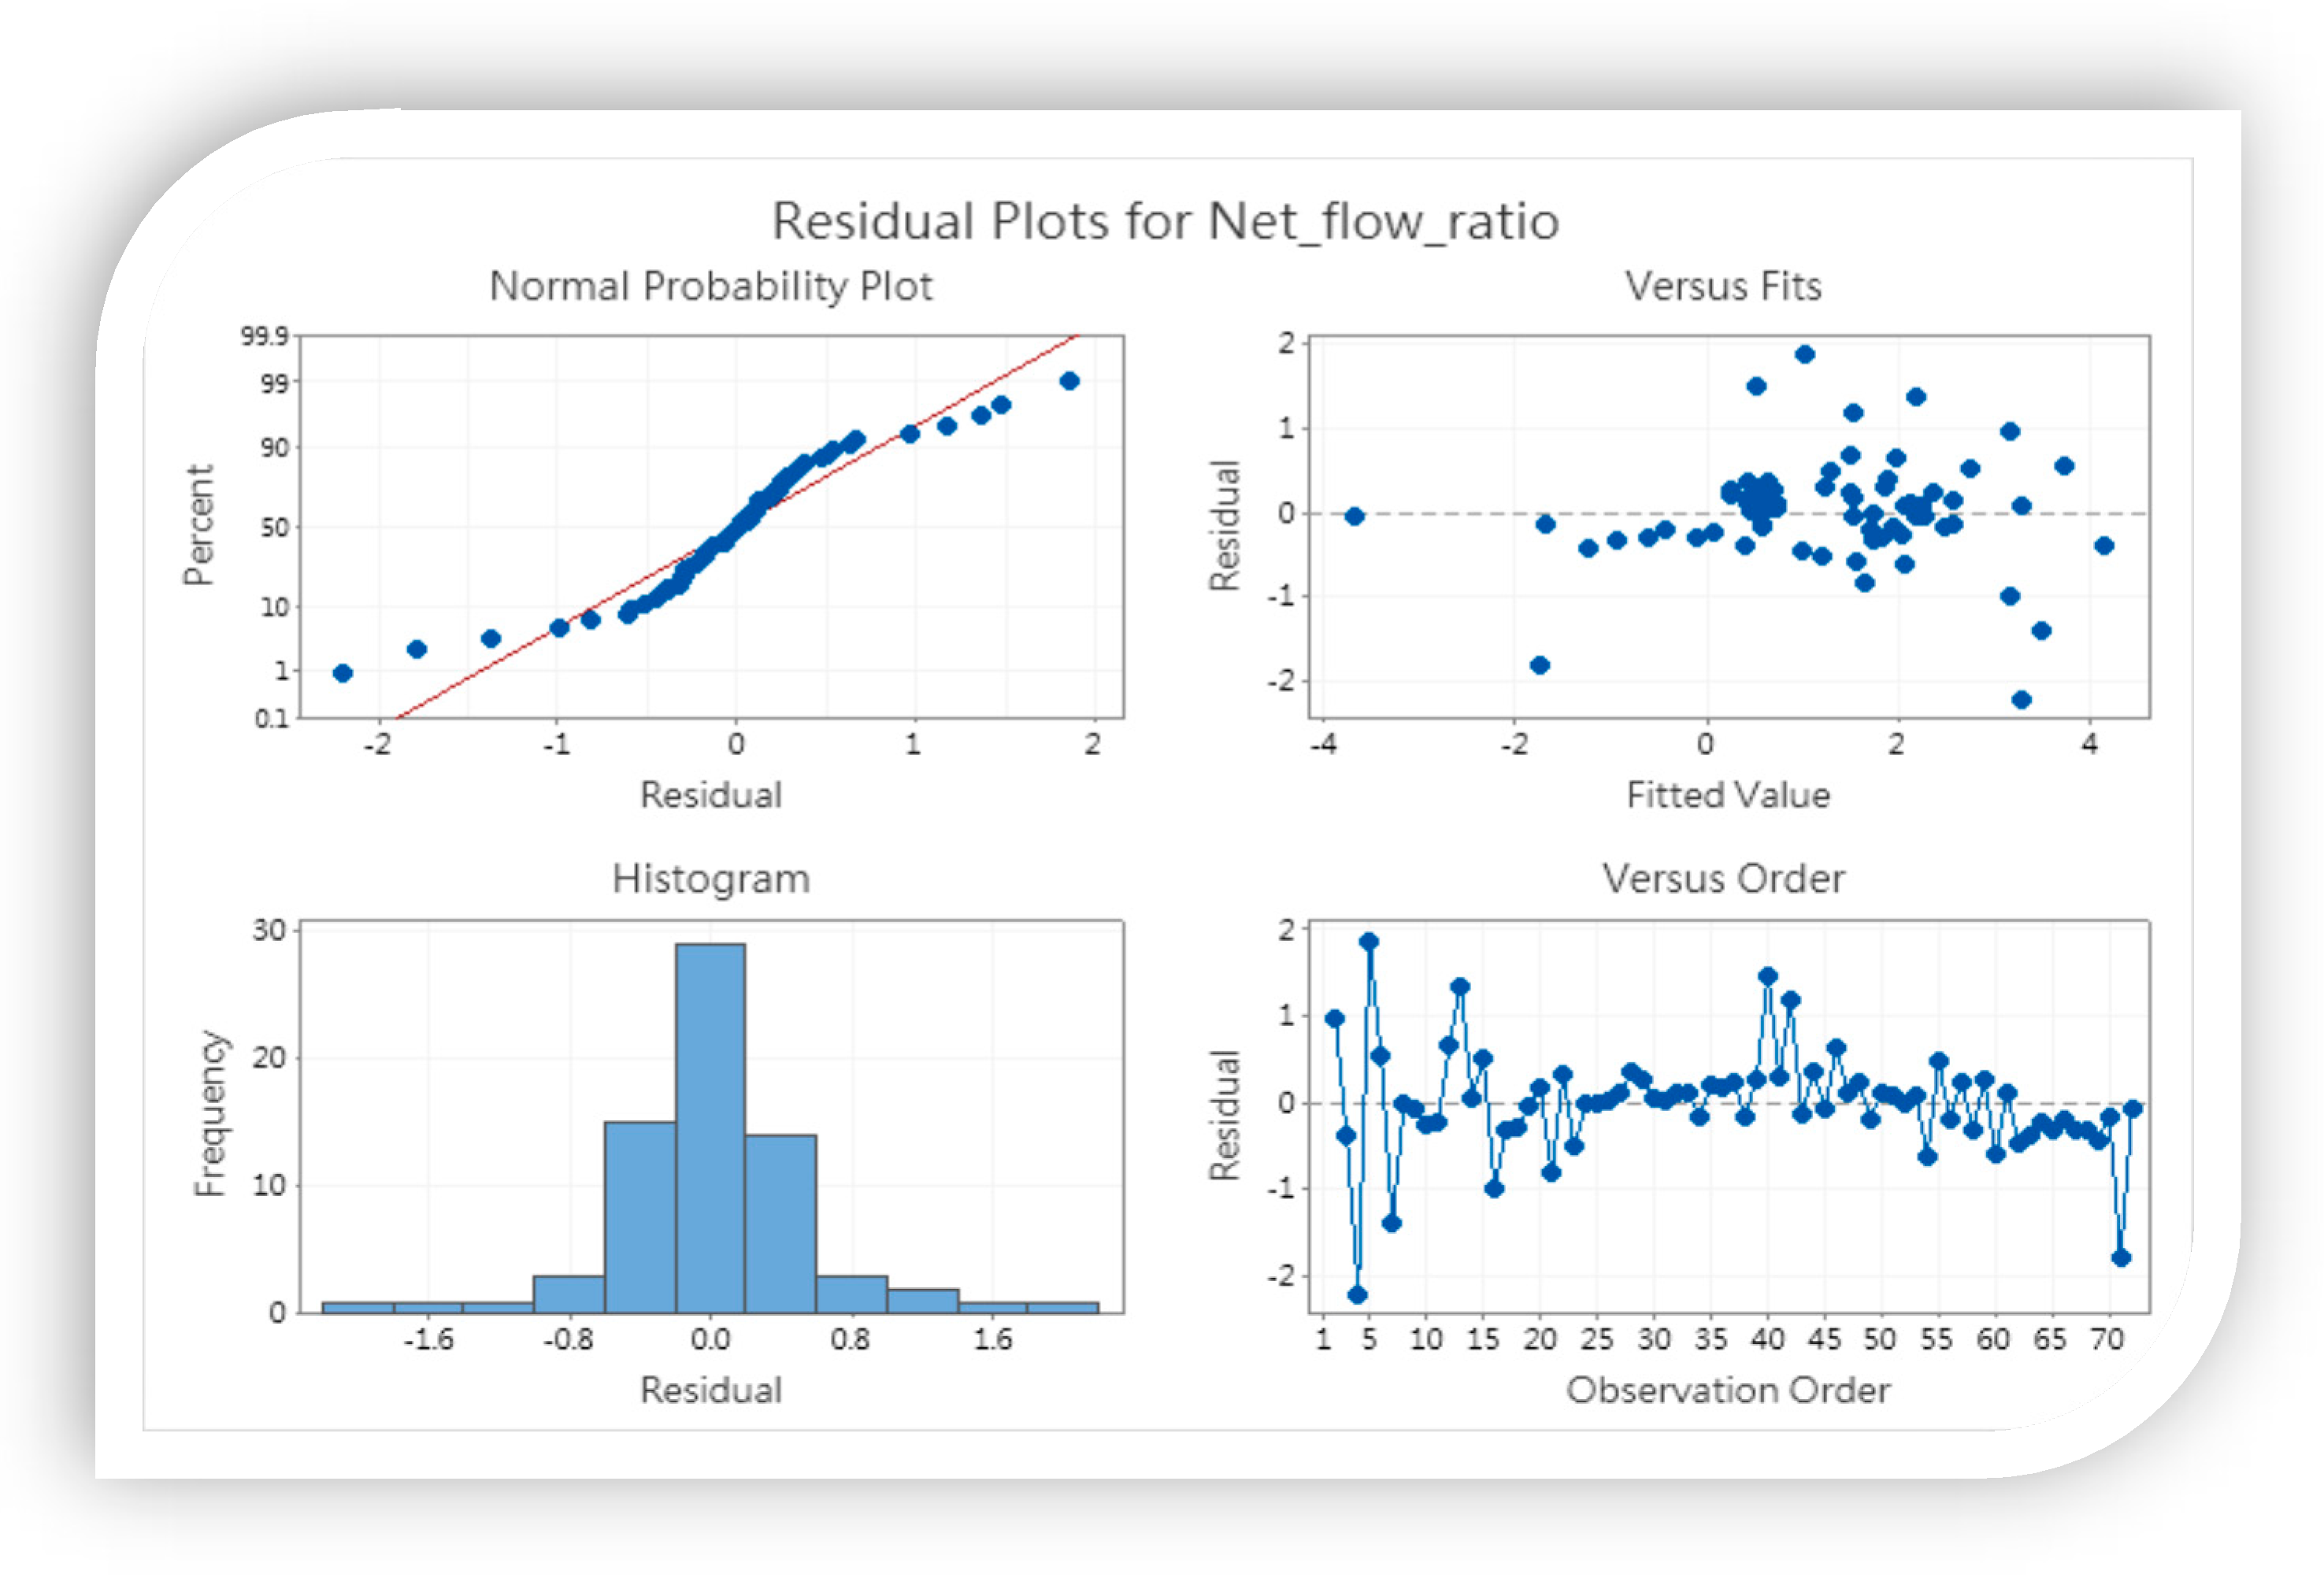
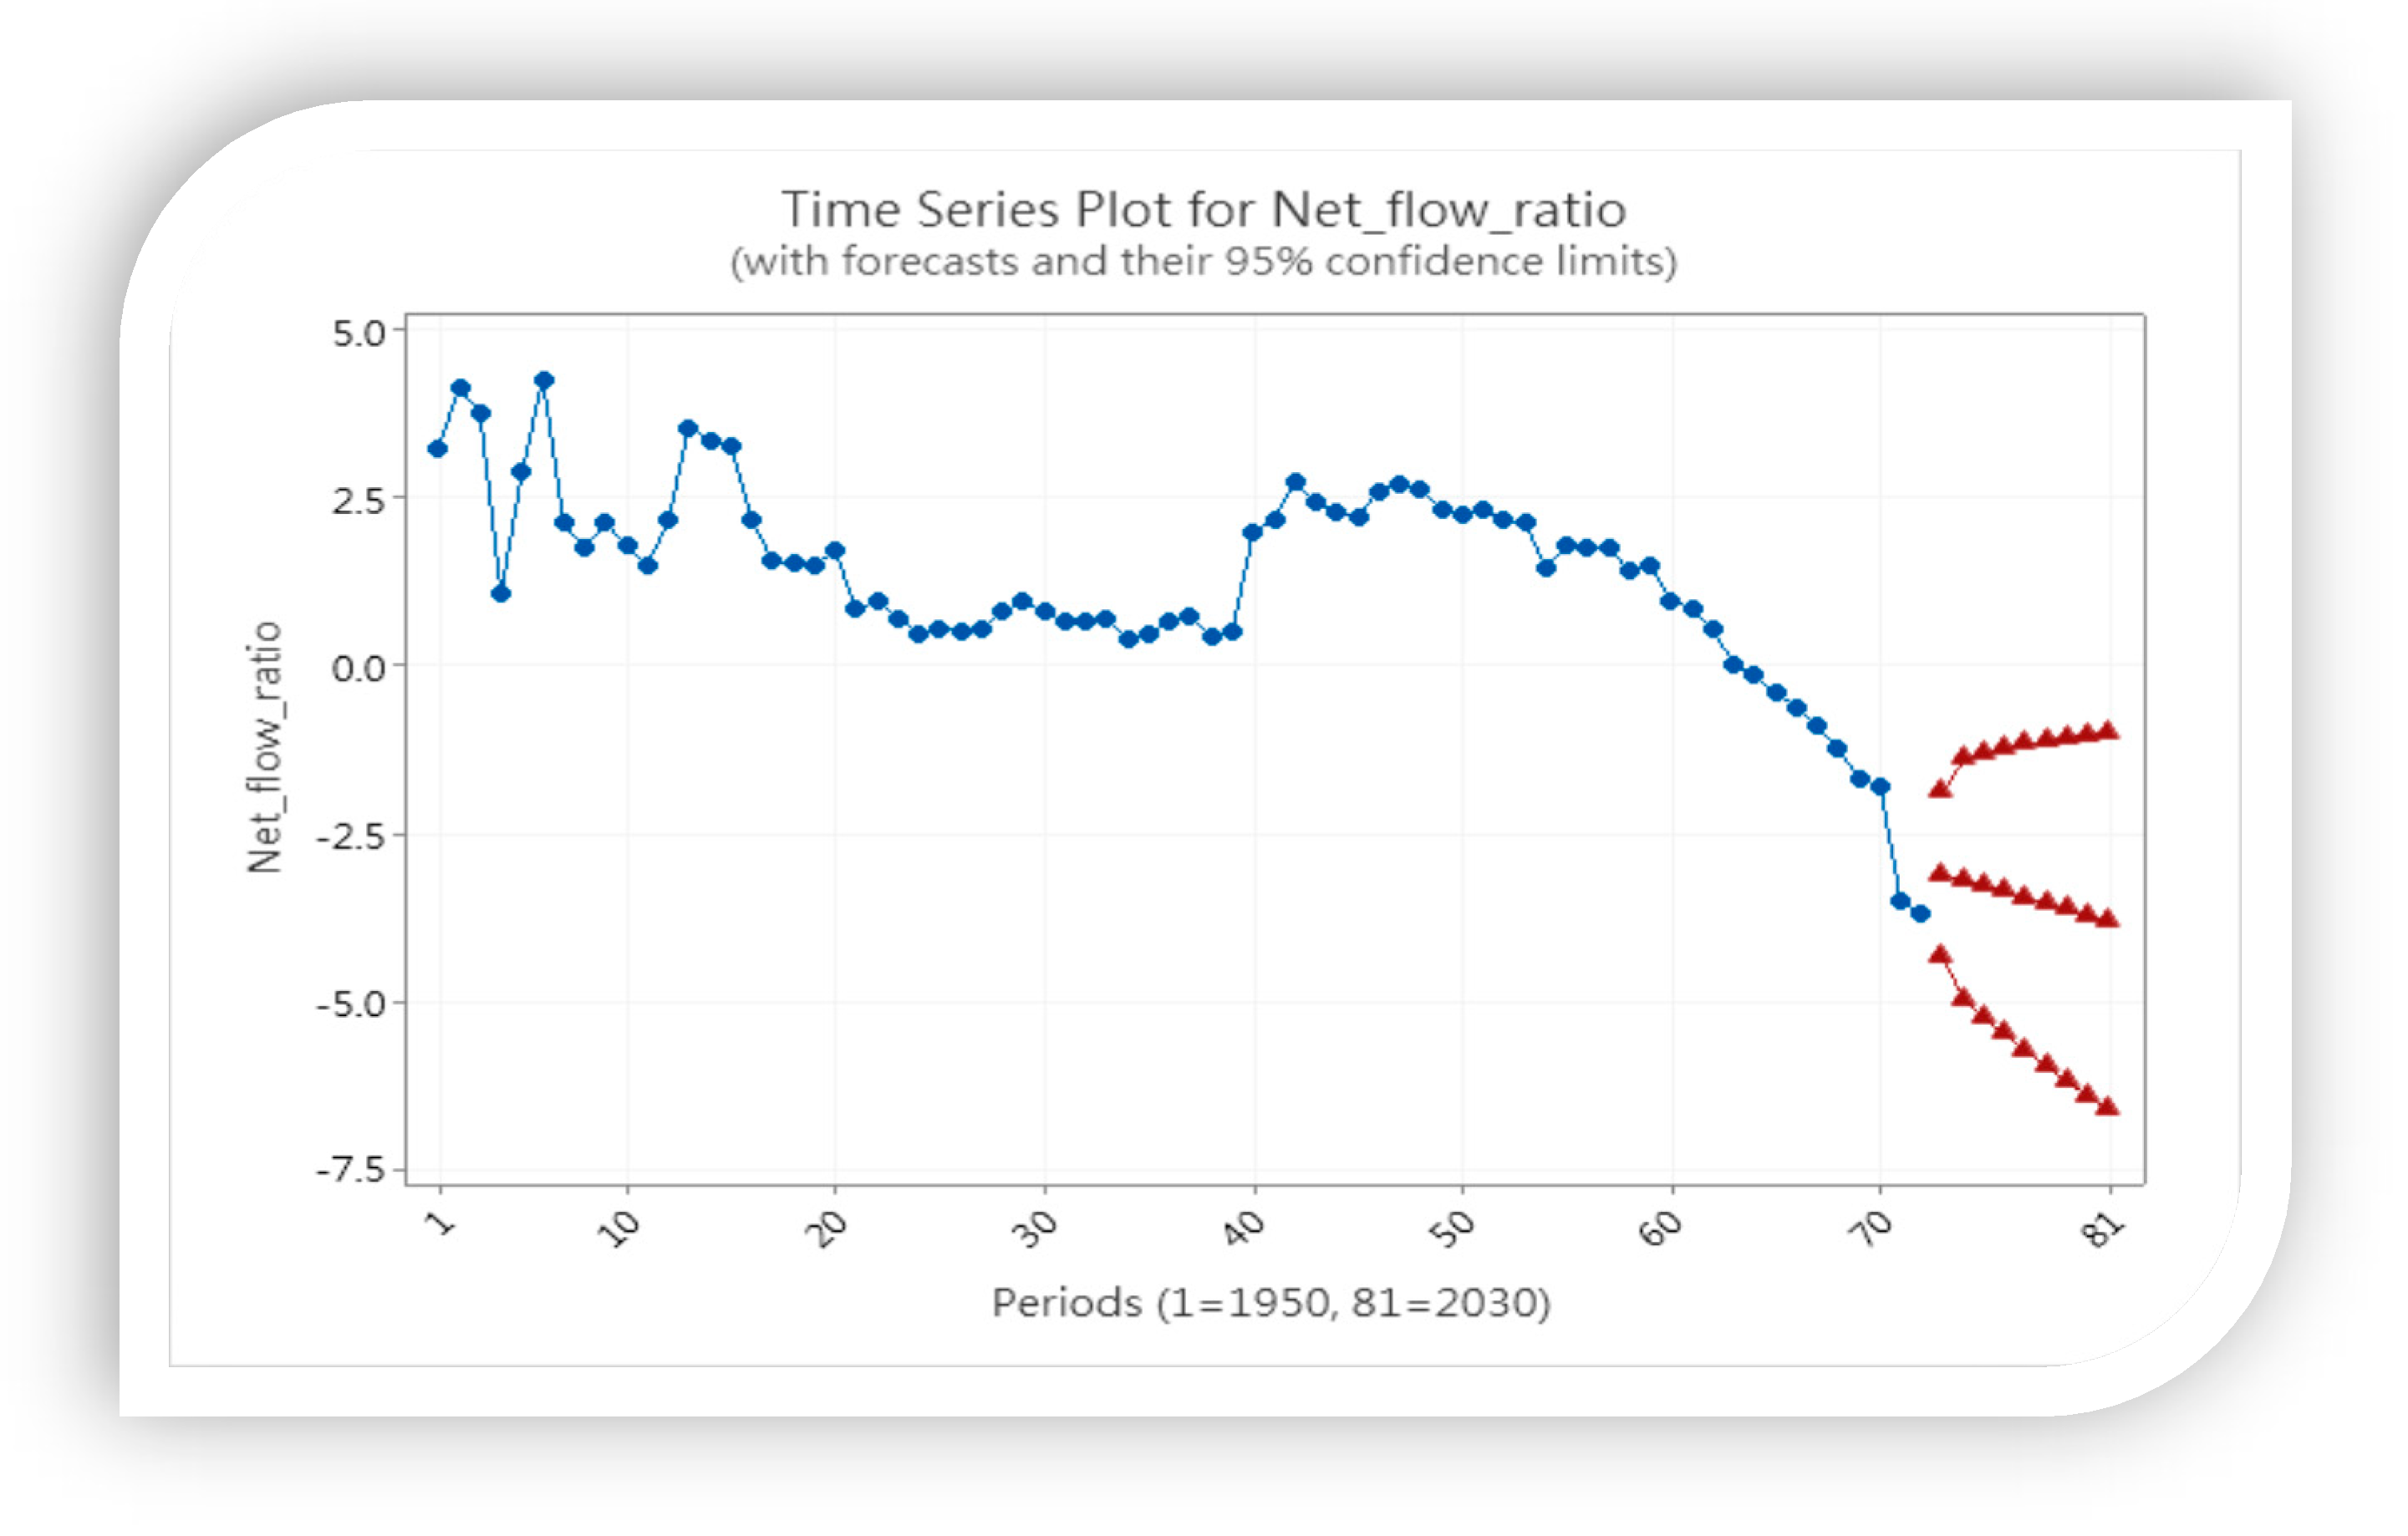
Figure 12 shows that the residual is better with the normal probability plot and histogram in this model. The result reveals that the net flow ratio in the higher education system will expand from −3.116 in 2022 to −3.816 in 2030.
Table 7 and
Figure 13 present the results of the prediction with ARIMA (0,1,2).
4.7. Comparing the Expansion Effect in Different Stages
Significant changes in the system expansion have been demonstrated in the later stage of GER (15–50%) and the state of GER (over 50%) according to Trow’s classification [
37]. This study compared the IMR, OMR and net flow ratio with the following expansion stages in the higher education system:
The GER is less than 15% (pre-mass stage, 1975);
The GER is over 25% to 50% (mass stage, 1976–1998);
The GER is over 50% to 85% (pre-universal stage, 1999–2018);
The GER is over 85% (post-universal stage, 2019–).
Figure 14 presents the IMR, OMR and net flow ratio from 1950 to 2022 in the four expansion stages. The universal stage of the system (in 1999) has demonstrated that the inbound student ratios are increasing rapidly, while the ratios of outbound students are constant. The inbound mobility ratio was significantly associated with the net flow ratio. Considering the significant negative cross-correlations located in lag −4 to lag 7, there was a lag effect of the inbound mobility ratio on net flow ratio. Thus, the inbound mobility ratio influences the net flow ratio. This trend could be continued in the future.
4.8. Comparing the Effects of GER and IR on Net Flow Ratio in Future
Figure 15 indicates that the net flow ratio in the future will steadily expand with a negative format. The result of the CCF indicates that the GER leads the net flow ratio. This trend will continue in the future. Since the higher education system moved into the pre-universal stage in 1999 and the post-universal stage in 2019, the system expansion in the post-universal stage has been demonstrated to be aligned with the net flow ratio. This finding may indicate that international students will significantly contribute to the higher education system in the post-universal stage. In this study, we have thus confirmed that the GER influences the net flow ratio in the future.
Figure 16 shows the trends of the IR and net flow ratio from 1950 to 2030. In last two decades, the IR reflects on a steady declining enrollment in the system. The result reveals that the net flow ratio changed significantly in 2013; since then, the volume of inbound students in the higher education system has driven the system moved into a negative net flow stage, implying that the number of inbound students is increasing steadily and surpassing the number of outbound students. Both series are associated with negative trends in the future. We have confirmed that the IR influences the net flow ratio in the future.
5. Discussion
Global society is currently facing numerous challenges, as illustrated in the 2030 global goals for sustainable development. This study sheds light on the issue by examining the sustainable higher education with a sample of system expansion and student mobility in an economic context. Widening higher education participation is one of the indicators to achieve SDG 4, “ensuring inclusive and equitable quality education and promoting lifelong learning opportunities for all”, and targets education for sustainable development [
2,
22]. Although the study focused on the higher education system in Taiwan, its application may extend to those systems that have been neglected in the field in terms of sustainable development. Focused on the influential economic factors, we found that the economic growth ratio will drive student mobility flows. The findings suggest that this impacts not only inbound students but outbound students. This study explored the higher education system expansion and provided helpful information to interpret the effects of expansion. The research questions are answered.
First, this study addressed the “human capital theories” [
23], individual “status competition” theory [
24] and “signaling theory” [
25] to explain higher education expansion phenomena. These theories can deeply address the issue that the system has confronted. We found economic factors used here based on human capital theory [
23], with some limitations as Marginson’s comment [
38]; only the positive economic growth makes sense for students’ global mobility in this study.
Second, the GER of higher education may reflect the expansion, with different meanings in various systems. Only meaningful expansion can trigger healthy higher education development. This case study provides an example that system expansion might reduce the outbound mobility, but it did not change the trend of inbound mobility. Target 2030, we needed to continue to monitor the progress in this field.
Third, Trow’s expansion stage is a useful framework [
37]; however, he did not define the universal stage appropriately for increasing high-participation systems. Based on the notion of high-participation in higher education [
3], we redefined the universal stage as two sub-stages: there is a pre-universal stage, in which the GER in the higher education system is over 50% to 85%; and a post-universal stage, in which the GER in the higher education system is over 85%. According to the proposed criteria, the target higher education system moved to the post-universal stage in 2019. In the future, the GER will increase steadily.
Fourth, GER refers to not only the enrollment in higher education but the cohort group; the specific population group with a 5-year cohort (for example, age 18–22 in the target system) will exert an influential effect to determine the GER. IR refers to enrollment in higher education on an annual basis regardless of the 5-year cohort group. Both GER and IR reflect different phenomena in higher education. Therefore, we found that the functions of the two indices are various. The values of IR can reflect whether the system might oversupply or not, while the values of GER cannot reflect the issue directly, since the population of those aged 18–22 in Taiwan has declined significantly in the last decade. Meanwhile, the GER is automatically increasing during this period. Based on our estimation of the GER, the target higher education system will increase and reach 100% in 2030. Considering that the Education 2030 does not mention the size of the GER that is acceptable, when we deal with the expansion issue, both GER and IR should be taken into account.
Fifth, this study found that expansion is associated with mobility flows. For example, we confirmed that the effect of GER influences the inbound and outbound mobility flows, the GER influences the net flow ratio and the IR influences the net flow ratio. The effect of IR influencing the inbound mobility ratio was supported, while the effect of IR influencing the outbound mobility ratio was not supported. In this study, we confirmed that the inbound mobility ratio will influence the net flow ratio significantly in the target system. Projecting into the future, we confirmed that GER influences the net flow ratio in the future and the effect of IR influences the net flow ratio in the future. Since the higher education system moved into the pre-universal stage in 1999 and the post-universal stage in 2019, the system expansion’s in the post-universal stage has been demonstrated to be aligned with the net flow ratio. This phenomenon may reflect the policy intervention in higher education [
17].
Finally, the finding may suggest that international students contribute to the system in its expansion in the post-universal stage. The net flow ratio reflects the target country’s inbound mobility pattern in terms of the steadily increasing inbound students, and the net flow ratio will continue with a negative form in the future. This study found that the CCF can be used to determine the cross-correlation of series data. For predicting future trends, the time series approaches in terms of ARIMA can work well to deal with series data. Both SPSS and Minitab are helpful tools to conduct these types of analyses.
6. Implications
Student mobility is one of the most important indicators that can reflect the institutional internationalization in a sustainable higher education system. Since the topic of sustainable development has received much scholarly attention in higher education, monitoring student mobility flows to adjust international strategies is necessary. While student mobility issues have been addressed persistently in internationalized campuses, the phenomenon has rarely been discussed in association with sustainable higher education systems. This study provides a practical approach to tackle this issue within the system and economic context.
For a sustainable higher education system, widening the participation may consider recruiting the international students. This study focused on the system expansion and the global mobility of students to determine their concurrent relationships. We proposed two ways to detect the higher education expansion, one is GER and the other is IR. The student mobility flows can be explored using IMR, OMR, and net flow ratio. This study provided a wide viewpoint to address the effect of higher education expansion on student mobility. The findings of this study can enrich the knowledge in this field.
Regarding Education 2030, we may confront numerous challenges in the future. Since various countries still lack effective policies to manage the net flow issue, this study provides an example for data transformation and model selection, which can serve to quickly address the issue. Considering that there are various countries confronted with a similar issue, the approach can be extended to similar countries or areas.
7. Conclusions
This study demonstrated that the inbound mobility is over the outbound mobility in the post-universal stage. Is this a prevailing phenomenon in the higher education expansion process? It is needed to redefine a post-universal stage, in which the GER in the higher education system is over 85%. We may need more evidence to interpret the phenomena in the post-universal stage. Moreover, the economic growth has become a critical driver that attracted international students. For a long-term development, the target higher education has become a brain gain system. “International at home” could be a new pattern in this higher education system. This format of internationalization is different from that of the “international abroad”. For sustainable higher education purposes, transforming international education may provide a new thinking for related policy makers or practitioners in higher education.
Since the development of sustainable higher education is a long-term task, the purpose of system expansion not only provides services for national students but also international students. Regarding SDG 4, focusing on ensuring inclusive and equitable quality education for all, the notion may extend to quality higher education in the global student mobility context. This study provided an example to tackle the effect of higher education expansion on student mobility within economic contexts. The evidences can be used to interpret the inbound and outbound mobility flows for developing sustainable higher education. We focused on Taiwan’s higher education system, but the application is not limited. Since global student mobility is a prevailing phenomenon, the trend of the net flow ratio might be useful to determine whether a higher education system is confronted with brain drain or brain gain phenomenon. In this sense, this study provides helpful approaches to deal with the issue in higher education.
Considering the importance of evidence-based policy, monitoring the progress of higher education with novel approaches in this field is necessary. This study suggests that the importance of appropriate data sets, CCF, and the time series methods can work well to determine the effects of the phenomena of higher education expansion on student mobility flows in the future. This study successfully applied the economic and expansion indices to interpret the student mobility flows. Since time series data are different from randomized data, this study demonstrated that the CCF and ARIMA models can be used to determine the cross-correlations and their future trends. We suggest that the economic influential factors, expansion information, and student mobility data can be transformed using index formats to monitor the phenomena in other areas. For further studies, we encourage the selection of related meaningful factors to tackle the described phenomena, which might serve to enrich the knowledge in this field.
8. Limitations
The expansion of higher education might shape the landscape of student mobility. However, the factors that impact student mobility are complicated in uncertain global settings. This study may limit its selected variables in the model. The study is important for Taiwan; how far this can generalize beyond Taiwan is unproven. Therefore, to extend this study, there may be challenges. In this study, we considered the phenomenon with the trend format only and it is limited to the interpretation of the issue within a particular period. For example, the lockdown event happened during the COVID-19 pandemic period. Economic factors are always complicated and hard to predict in the long term. Moreover, the impacts of social and cultural factors have been addressed very well in previous qualitative studies; however, this study has limitations due to there being no fitted data set available. We focused on the target Education 2030, the temporary event, for example, the inflation issue. It is hard to know how long it should be treated in the time series analysis.
