1. Introduction
Water distribution networks ensure the transport of a given water demand by a particular population or ecosystem. During supply processes, water experiences a direct interaction with trapped air in different transport scenarios through hydraulic networks [
1]. In maintenance and/or repair activities, hydraulic networks are exposed to filling and emptying events, where trapped air undergoes thermodynamic processes, such as (i) overpressures and vacuum pressures, (ii) transient flows, (iii) temperature changes, and (iv) backflow air, which may damage the infrastructure of the pipelines [
2,
3,
4,
5] and additionally lead to a decrease in operational efficiency [
6,
7]. Transient flows during pipeline drainage can have serious environmental and economic consequences, compromising the serviceability of the entire system and prejudicing access to the water resource for society. Protective devices, such as suction valves, are often installed at the high points of hydraulic systems to expel or admit air in hydraulic networks and mitigate potential hazards [
5,
8,
9].
Different authors in the literature have studied the influence of air valves in hydraulic networks during filling events using experimental tests and by developing analytical models. Martin and Lee [
10] performed experimental tests to study the influence of air valves on the overpressure peaks, where the authors mention that increasing ratios of orifice diameter over pipe diameter (
) cause a decrease in the overpressure peaks. Zhou et al. [
11,
12] developed an analytical model to study the impact of discharge orifice sizing on the air release trapped in pipes during rapid-filling events, where they observed that large orifices generate water hammer overpressure dominance, and small orifices cause high overpressure due to air pocket compression. De Martino et al. [
13] conducted a study of the duration of transient events and pressure gradients in trapped air pockets during filling events with a discharge orifice. The results were compared with analytical expressions. In addition, an analysis of pressure peaks due to the water hammer phenomenon was performed. Balacco et al. [
6] made a contribution to study the sizing of air valves. Fuertes-Miquel et al. [
14] studied the hydraulic and thermodynamic behaviour of trapped air pockets due to compression effects using a mathematical model based on rigid column models, considering the effect of air expulsion. Coronado-Hernández et al. [
15] explored the effect of commercial air valves in the control of overpressures generated in a small-scale hydraulic pipeline using a mathematical model, in which the authors reported different technical recommendations for the use of these protection devices in the control of overpressures. Zhou et al. [
16] developed a mathematical model based on elastic column models to study the influence of air valve sizing on the control of overpressure in trapped air pockets, which was validated with experimental results.
On the other hand, in the last decade, mathematical models have been developed, and they allow to adequately predict the hydraulic phenomena that occur in pipelines with trapped air, considering the effect of air admission by air valves. For instance, Coronado-Hernández et al. [
8] and Fuertes-Miquel et al. [
17] developed a mathematical model based on rigid column models, which considers the physical behaviour of air admission in simple and branch hydraulic pipes, which represent with good numerical accuracy different physical parameters associated with: (i) vacuum pressures in trapped air pockets, (ii) the drainage velocity in hydraulic networks, and (iii) water column length. These models can also predict water drainage flow rates and air inflow rates.
In the last decade, computational fluid dynamics (CFD) models have been implemented to solve problems involving hydraulic and thermodynamic behaviour in pressurised pipelines [
18]. Modelling hydraulic filling and emptying events using CFD models to study the effect of air valve sizing has been a challenge in recent years due to the complexity of capturing in detail the thermodynamic and aerodynamic behaviour of air when it is expelled or admitted in water pipelines. Some authors have developed 2D CFD models to study hydraulic and thermodynamic phenomena that occur in pipelines, considering the influence of air valves. Aguirre-Mendoza et al. [
19,
20] developed 2D CFD models to study the effect of air valve sizing during filling events in a branched pipeline, showing the dynamic interaction between the expelled air and the water filling. The research of these authors shows the numerical accuracy of these models, and additionally hydraulic–thermodynamic phenomena, such as the water hammer phenomenon with trapped air, due to the rapid filling of pipes with large air valves, being captured. In addition, Paternina-Verona et al. [
21] developed a 2D CFD model to represent the drainage events of a hydraulic network, considering commercial air valves with internal diameters of 3.175 and 9.0 mm, which was validated with experimental measurements obtaining good fits to the numerical results. Additionally, it is shown that the drainage velocity is influenced by the sizing of the air valve.
Currently, the effect of air valves on transient flows has not been studied in depth, as evidenced by the gaps in the literature on the development of 3D CFD models to simulate two-phase transient flows, considering the three-dimensional dynamic effect of air valves in hydraulic pipelines. The objective of this research is to study the dynamic behaviour of air-admission orifices presented in drainage events of a single pipe with trapped air through a 3D CFD model, for which the drainage of a water pipe with a diameter of 42 mm is studied, with different initial air pocket sizes and drain valve-opening percentages. The models are validated with experimental measurements, and additionally, hydraulic and aerodynamic phenomena are studied in drainage events using orifices with diameters of 1.5 and 3.0 mm. Through the 3D CFD model, visual and numerical information is obtained to study different aerodynamic phenomena that occur in the air-admission orifice and in the trapped air pocket. Additionally, the influence of these orifices on the efficiency of water drainage is observed by evaluating the ratio between the volume differential of the entrapped air pocket and the admitted airflow.
2. Experimental Model
To study the effect of the air-admission orifice in hydraulic conduits, an experimental model was used which consists of a pipe with an internal diameter of 4.2 cm, a length of 4.36 m, divided by a 90
elbow. In addition, the pipe has a pipe slope
= 29.5
. This experimental model is composed of a trapped air pocket at the upstream end with an initial length defined by the term
. Additionally, at the upstream end, an orifice is defined to allow the admission of air into the pipe, with a diameter given by the term
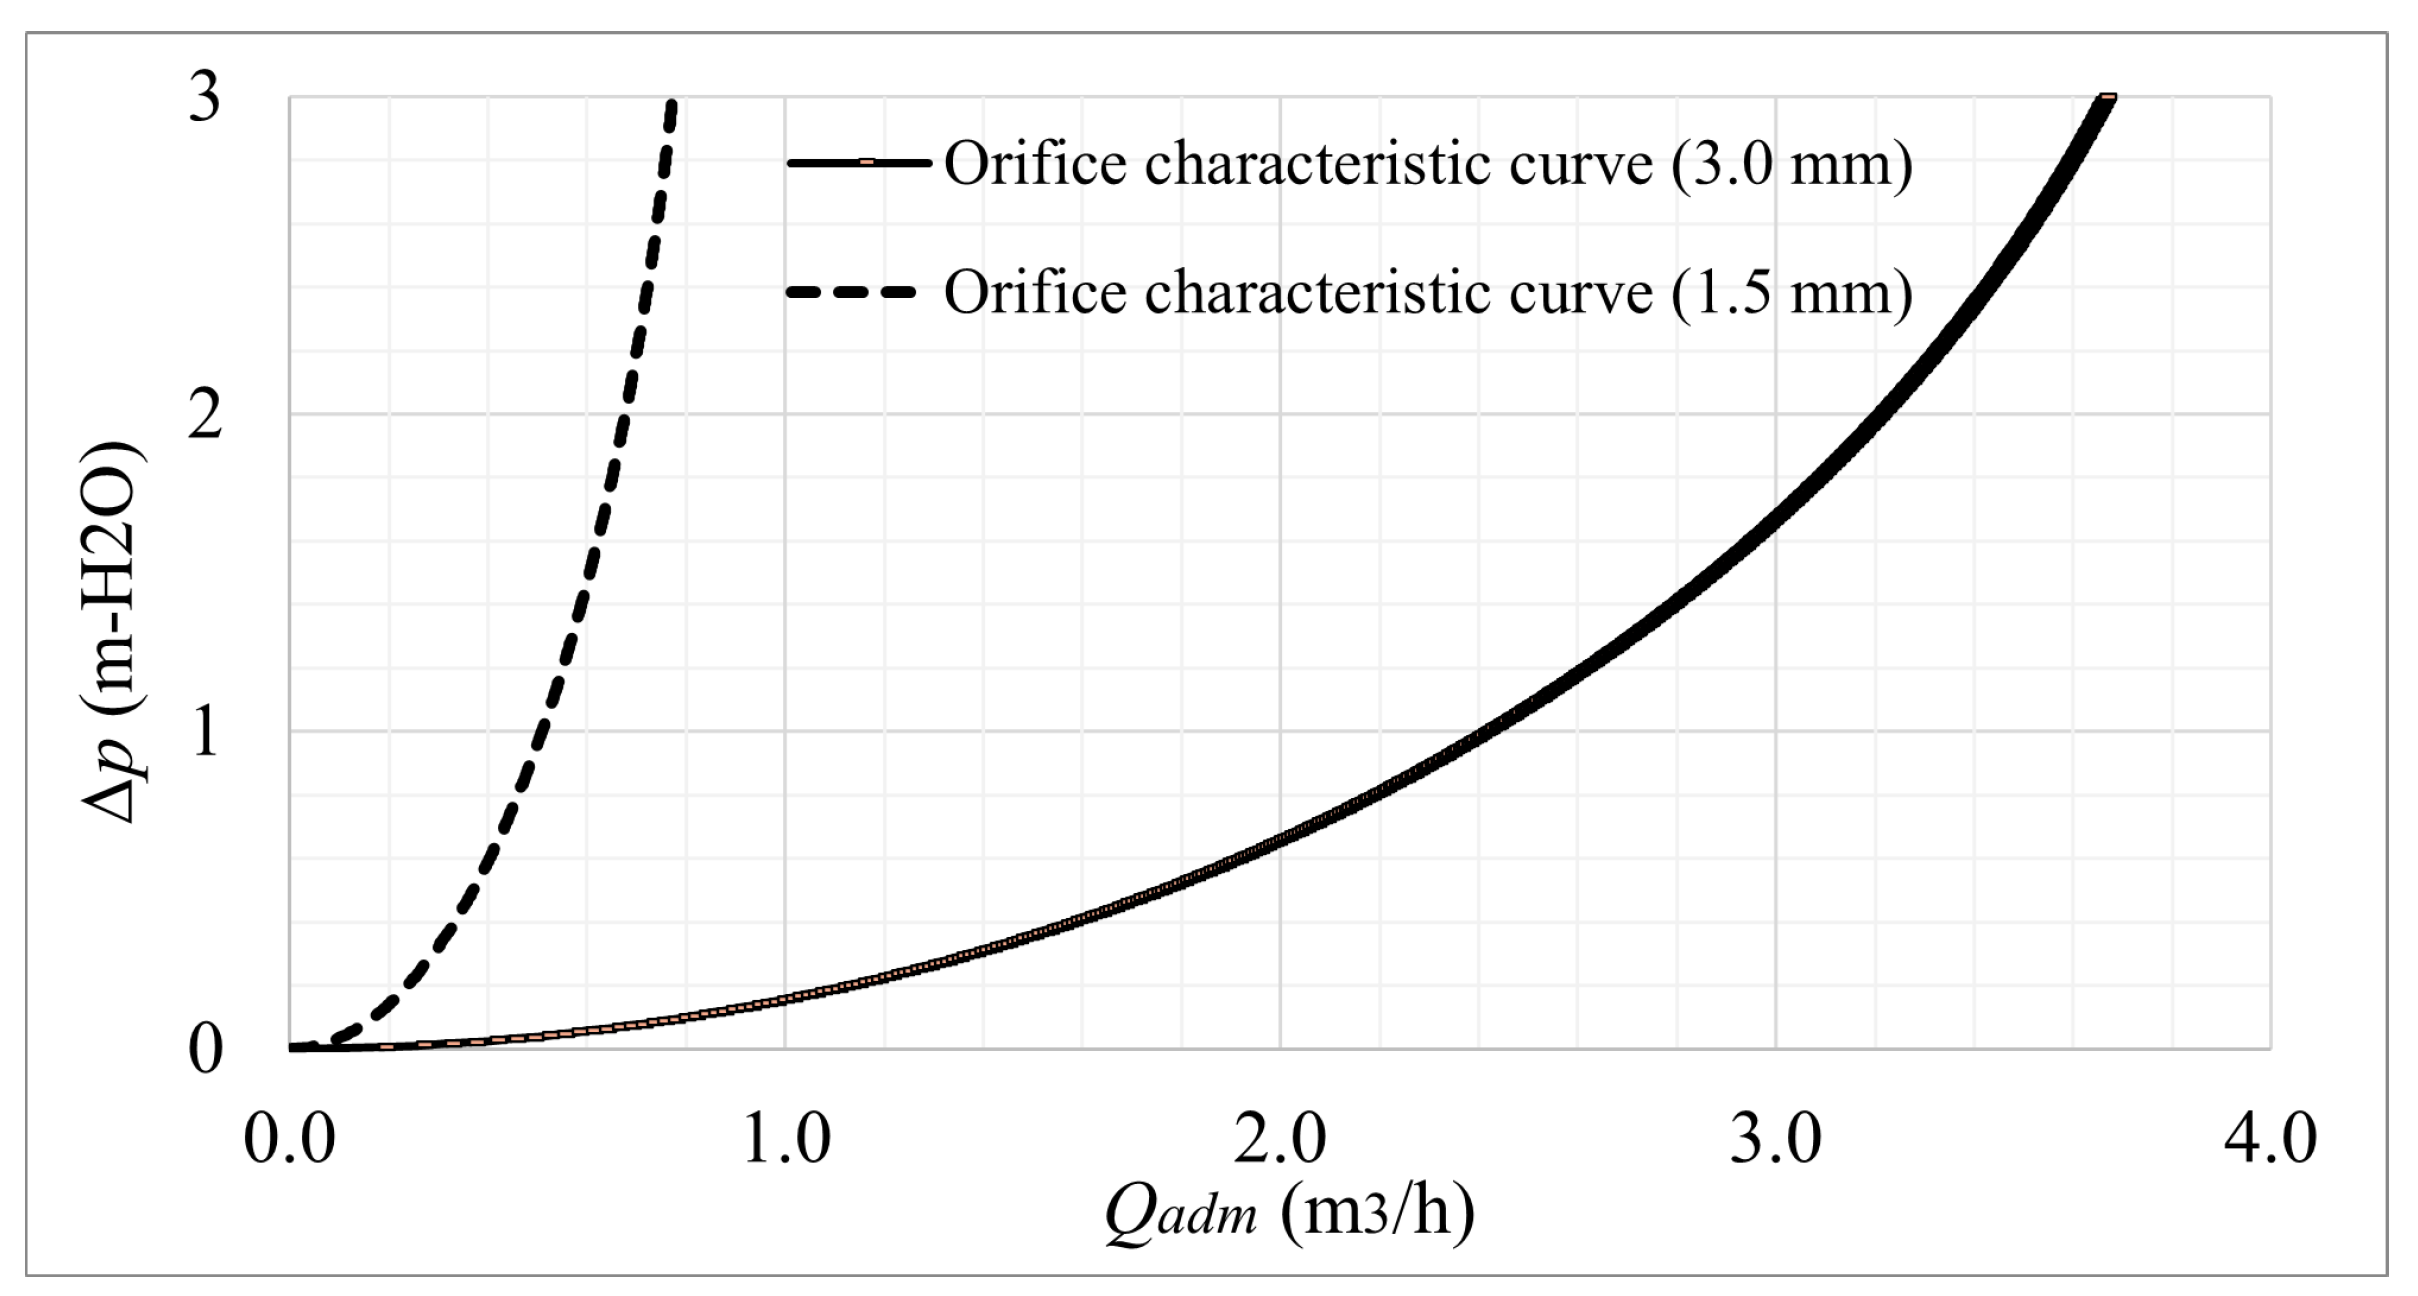
. Two orifices, with diameters of 1.5 and 3.0 mm, were experimentally calibrated through laboratory tests at the Universitat Politècnica de València in Valencia, Spain, defining orifice discharge curves that correlate the air inflow as a function of the differential inlet–outlet pressure of the pipe, where air-admission coefficients (
) of 0.55 and 0.65, respectively, are obtained. In addition, the orifices were calibrated using different steady-state airflow conditions. Consequently, the differential pressures are measured to develop an orifice characteristic curve. For 3D CFD model validation, four (4) experimental tests were used with different initial air pockets
, drain valve-opening percentages and times (
and
, respectively), and different air-admission orifice diameters (
).
Figure 1 shows the details of the experimental model. The initial conditions for the four (4) experimental tests are defined in
Table 1. Additionally, the orifice characteristic curve is shown in
Figure 2.
To represent the drainage events, the drain valve with inner diameter of 42 mm, located at the downstream end of the hydraulic system, was opened with percentage and opening times of the drainage valve. During the pipe drainage tests, a pressure transducer was used to measure the vacuum pressures in the entrapped air pockets with a frequency of 500 data per second. In all tests, measurements of vacuum pressures were taken from the initial time t = 0 until full discharge of the water to a reservoir at the downstream end.
3. 3D CFD Model
Computational fluid dynamics models have been used in different research to study physical–chemical processes in order to define optimal processing conditions and additionally to facilitate the visualisation of these phenomena in which moving fluids interact [
22,
23,
24]. CFD models have been used in different research for simulation of two-phase transient flows in drainage events, where reliable results were obtained [
21,
25,
26,
27]. In this research, a three-dimensional CFD model was performed using the open-source software OpenFOAM [
28]. A solver of compressible immiscible and non-isothermal multiphase compressible fluids was used. The dynamic behaviour of the two-phase fluids is simulated considering the following principles of CFD modelling:
3.1. Governing Equations
The fluid dynamics applied in this CFD model are based on the Navier–Stokes continuity, momentum, and energy equations for two-phase flows, as shown in Equations (
1) and (
2), respectively, below [
28]:
where
= mixture density,
= mixture dynamic viscosity,
= velocity (vector),
p = static pressure,
= gravitational acceleration (vector), and
= body forces. The mixture density and the mixture dynamic viscosity are defined through the air-phase fraction term (
), which is in range between 0 and 1, where
= 0 corresponds to absence of air in cells, and
= 1, corresponds to the cells fully occupied by air. Fundamental formulations of air-phase fraction are shown in Equations (
3) and (
4). In addition, the equations are complemented by the equation of state, which contains a term of velocity field (
) (Equation (
5)).
Turbulence model
SST with standard wall-function treatment was applied to represent turbulence phenomena that occur in water drainage and aerodynamic effects of air associated to admission process through orifice. This turbulence model includes the turbulence kinetic energy (
k) and dissipation frequency (
). The transport equations of
k and
are shown in Equations (
6) and (
7) [
29,
30].
where
= blending function,
= specific flow velocity,
= turbulent dynamic viscosity,
= shear stress,
= turbulent kinematic viscosity. The terms
,
,
*,
, and
are standard coefficients of turbulence model that depend on the following terms:
,
,
,
,
,
,
, and
.
3.2. Computational Mesh
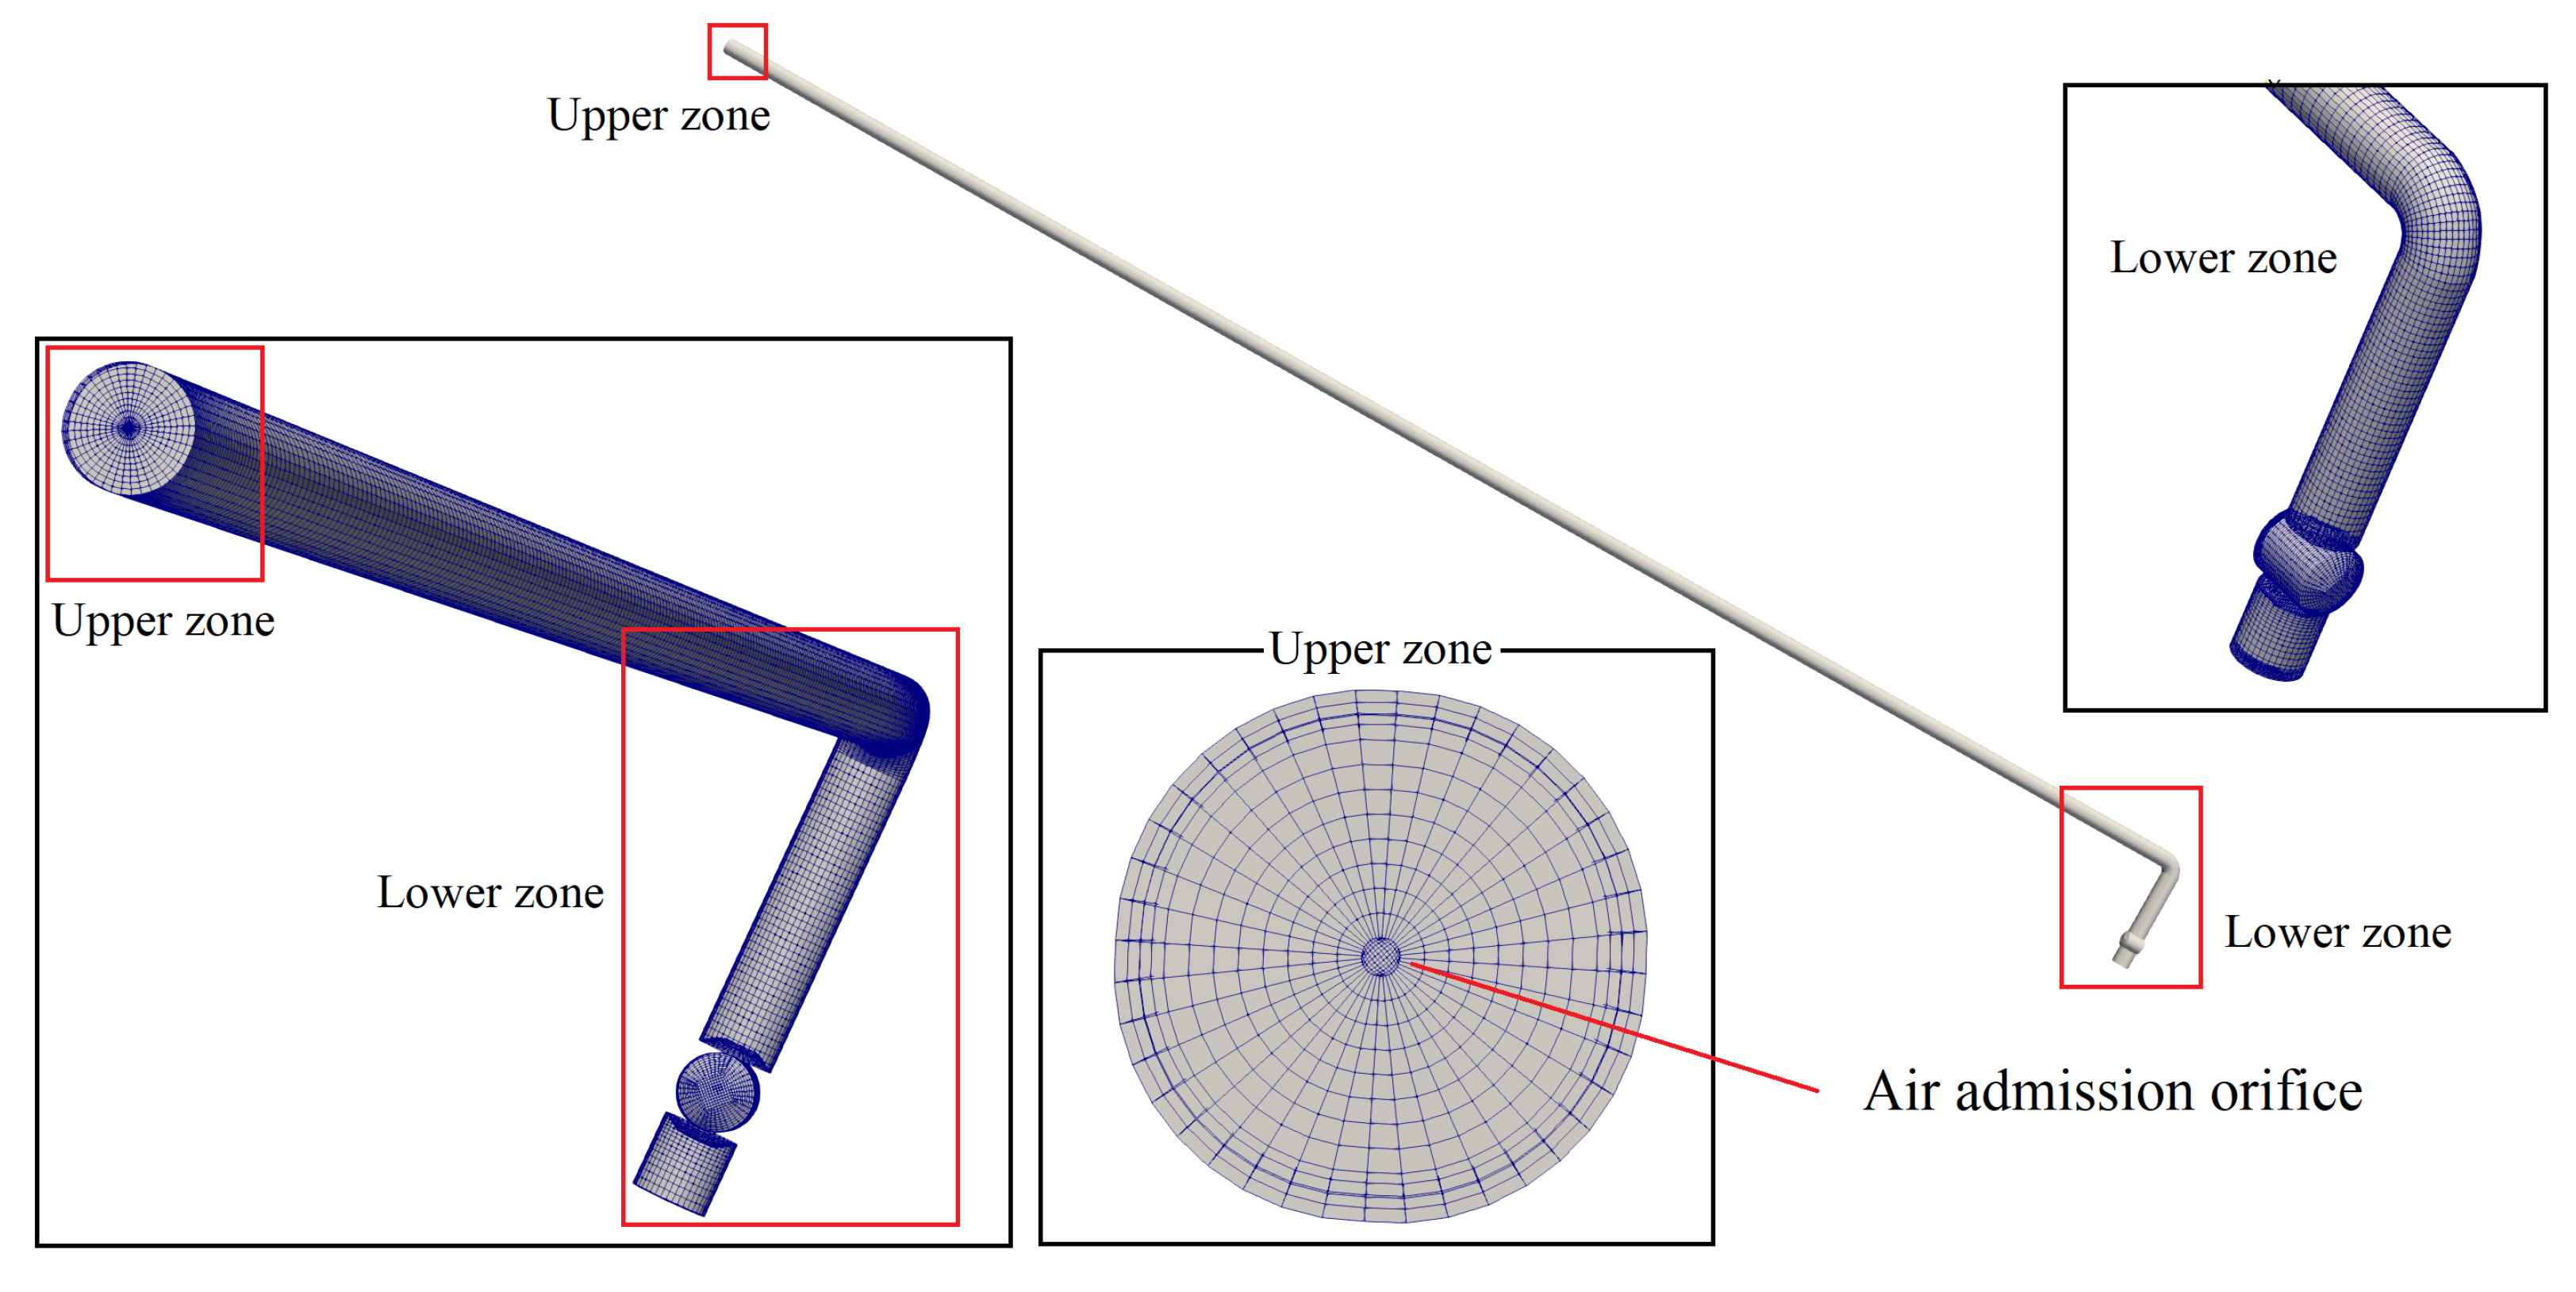
The mesh distribution in the 3D CFD model plays a fundamental role in the numerical and visual resolution of the hydraulic–thermodynamic parameters that influence the drainage events in pipes, considering the air-admission orifice [
21]. The 3D CFD model was distributed in hexaedrical structured cells. The mesh sensitivity analysis was performed based on the number of cells to ensure a model with adequate spatial and numerical resolution. The structured mesh configuration was defined based on contributions made by other authors in the development of CFD models for transient flow simulation [
26,
31,
32]. A 3D CFD model with 173,500 cells, with a minimum and maximum cell size of 0.24 and 19.9 mm, respectively, is adequate for the simulation of a single pipe with air-admission orifice to ensure a good visual resolution and adequate numerical accuracy. The mesh has the following properties: (i) a maximum aspect ratio = 14.03, (ii) a non-orthogonality = 8.82, and (iii) a maximum skewness = 2.10. These values were confirmed by a mesh check process, obtaining an adequate mesh configuration. In the near zone to the orifice, and the 90
elbow, a longitudinal refinement of the cells on the axis of the pipe is carried out, applying a cell size ratio of 1:4 with respect to the size of the cells located along the main pipe section.
Figure 3 shows the mesh configuration of the pipeline and the air-admission orifice.
3.3. Boundary Conditions
On the pipe walls, a non-slip velocity condition, zero heat transfer between the fluids and the walls, and a fixed flux pressure condition were used. For the air-admission orifice (inlet) and the drainage zone (outlet), an absolute pressure condition given as a function of atmospheric pressure ( = 101.325 Pa) was used, where the velocity values depend on the inlet–outlet pressure gradients. A function known as Valve Sliding Interface (VSI) was defined at draining valve, which allows to control the flow from the inside to the outside of the pipe. The initial conditions of the hydraulic system are assumed as follows: (i) the fluids inside the pipe are at rest and at atmospheric pressure, and (ii) the fluids (air–water) are at ambient temperature conditions.
3.4. Numerical Schemes
The numerical approximation of the fundamental equations is performed using the PIMPLE method, which combines elements of the SIMPLE (Semi-Implicit Method for Pressure-Linked Equations) and PISO (Pressure Implicit with Splitting of Operator) algorithms, which links the pressure term with the flow velocity, applied for two-phase flow. On the other hand, the Euler method was used for the time discretisation process, being a first-order and implicit scheme. For the resolution of the pressure, temperature, and velocity variables, first-order Gaussian approximations are used. The Laplacian and interpolation terms use linear approximation schemes corrected between cells.
4. Results and Discussion
The vacuum pressure measurements obtained by the pressure transducer during the experimental tests were used to compare the numerical results of the 3D CFD model of the different tests. Vacuum pressure measurements in entrapped air pockets have been used by different authors to validate the numerical accuracy of computational fluid dynamics models [
19,
21,
25,
26]. In addition, this comparison allows to analyse the uncertainty between numerical and experimental results, according to the contribution performed by Oberkampf and Trucano [
33].
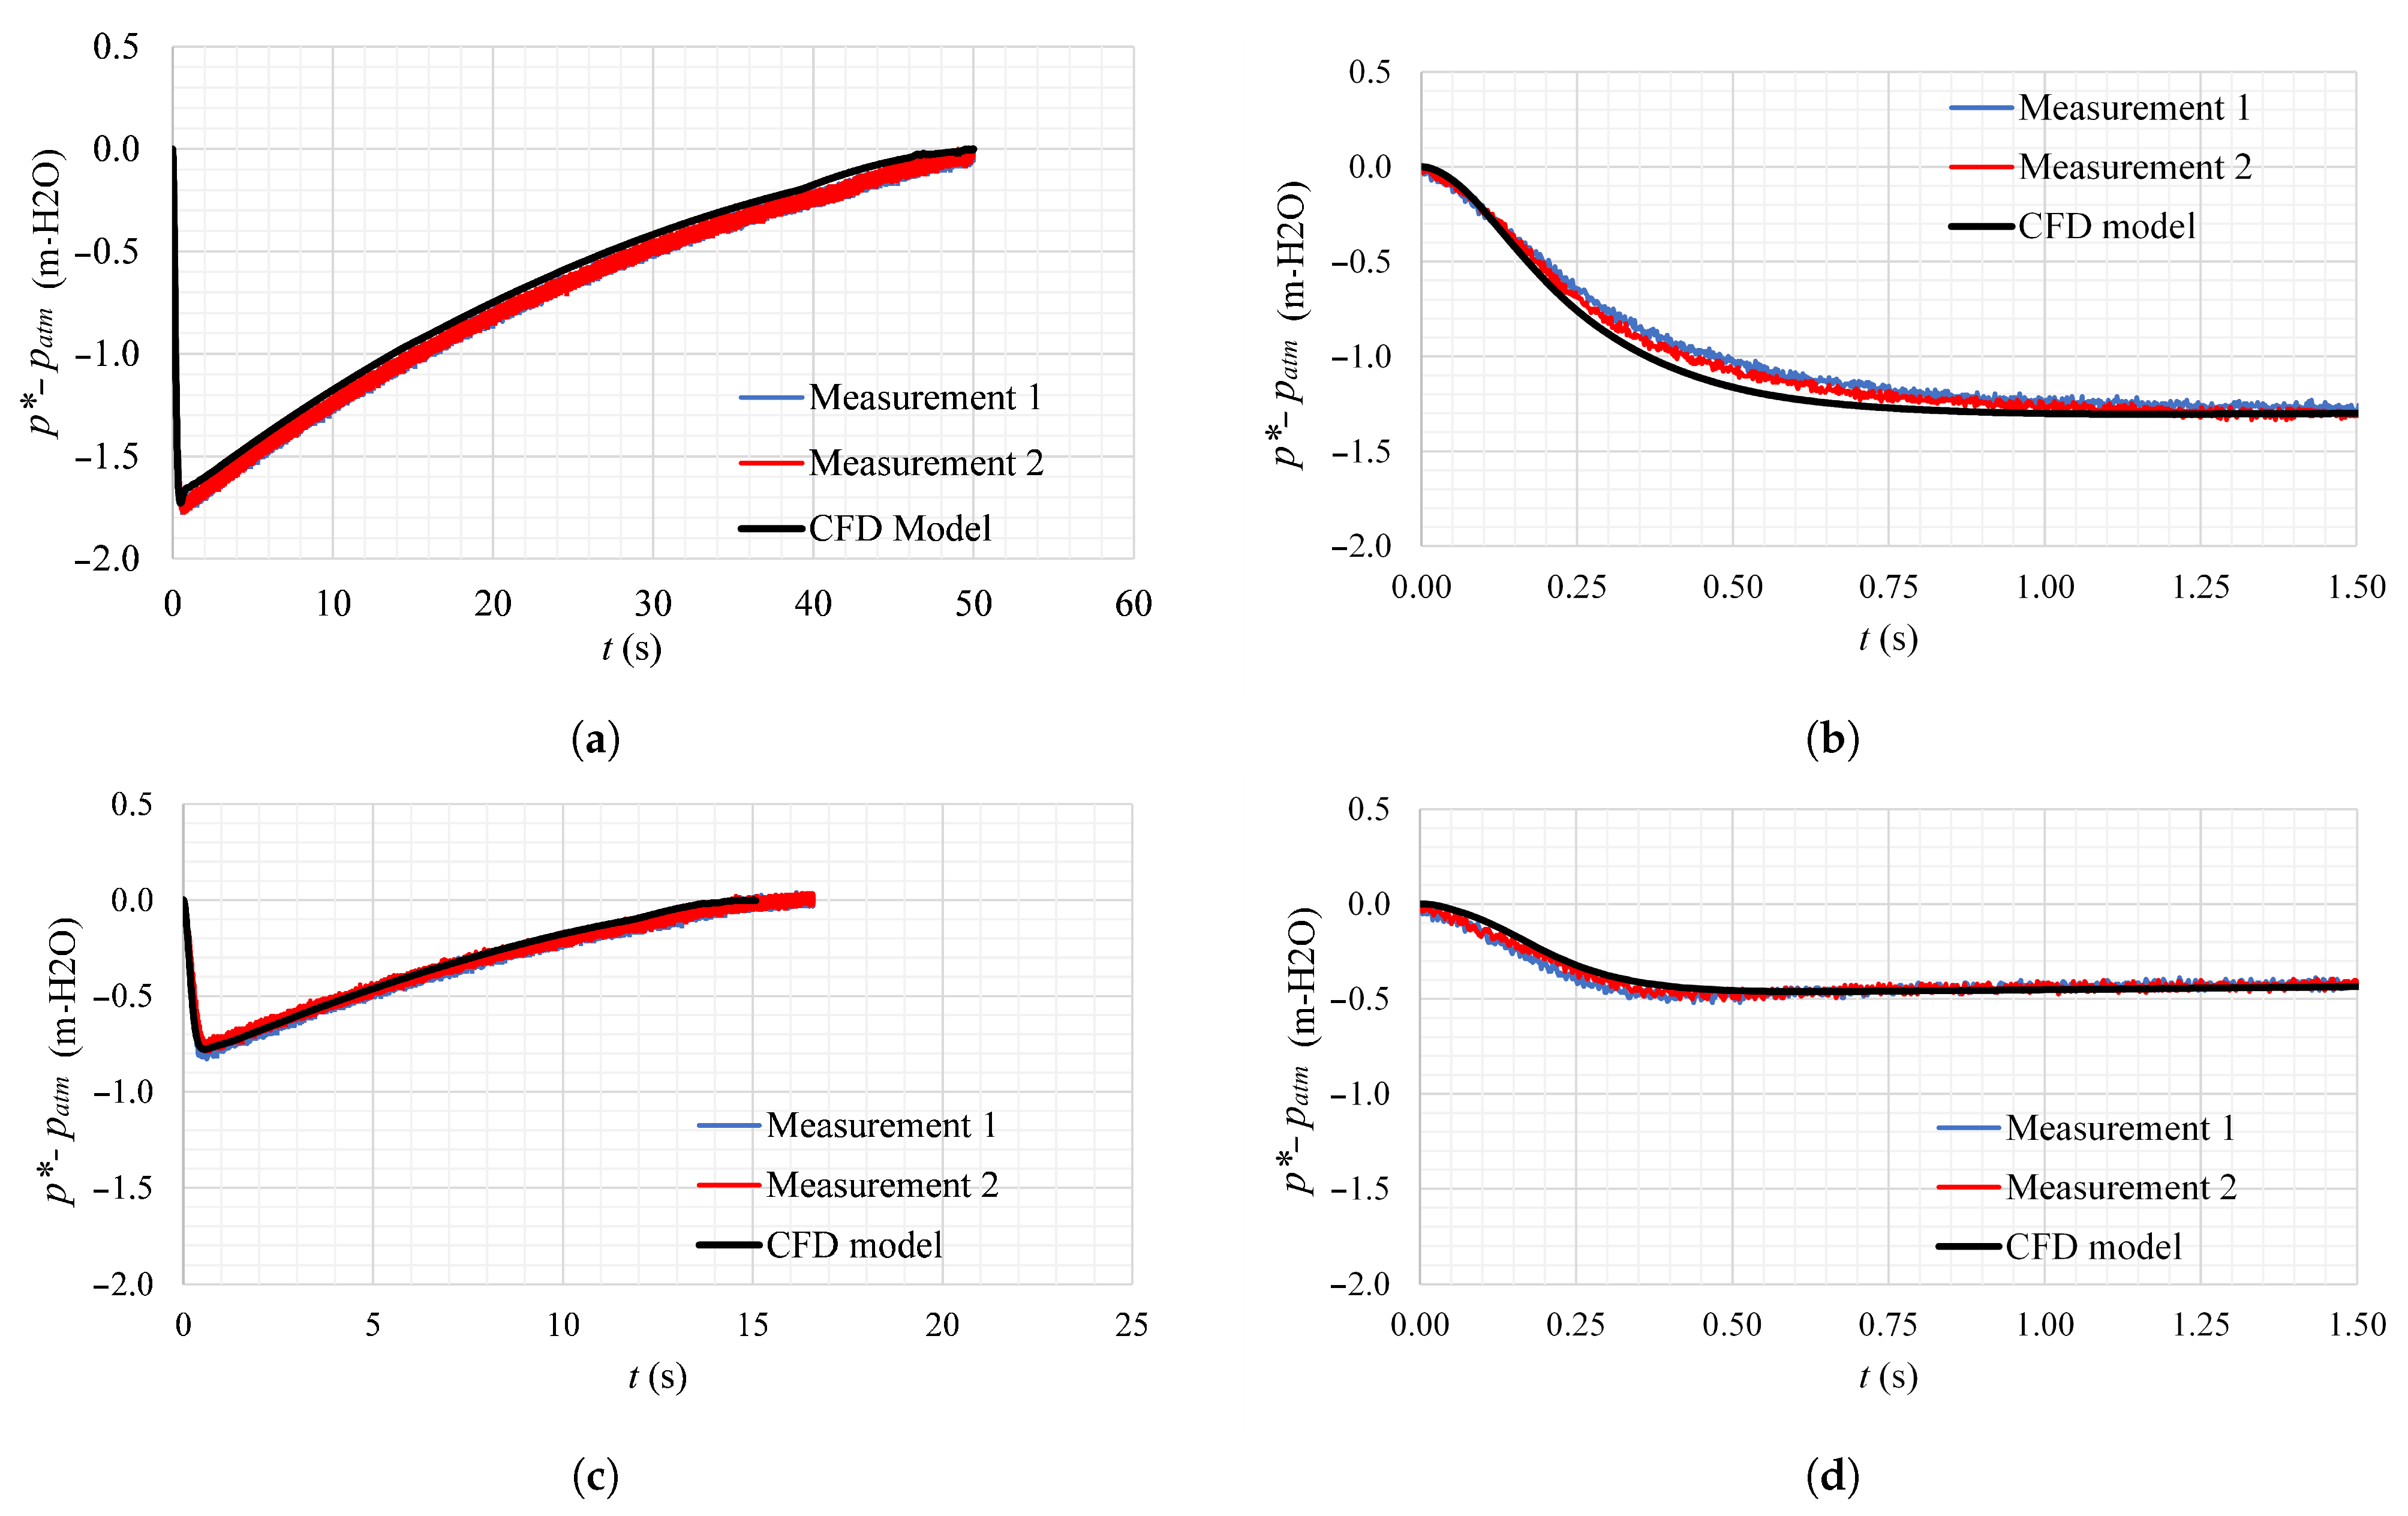
Figure 4 shows the vacuum pressure patterns obtained in the CFD models, using the formulation for vacuum pressure (
=
-
), where
= atmospheric pressure and
= absolute pressure. Test 1 corresponds to a full drainage event using a 1.5 mm diameter orifice, and Test 2 corresponds to the drainage event up to
t = 1.50 s with the same orifice. Similarly, Tests 3 and 4 correspond to full drainage events and up to
t = 1.50 s, respectively, considering an orifice diameter of 3.0 mm.
The pressure patterns exhibit reliable results when compared to Tests 1, 2, 3, and 4; this is demonstrated by the estimation of the Root Mean Square Error (RMSE) obtained between the experimental test vs. the 3D CFD model.
Table 2 shows the fit obtained between the experimental pressure patterns and those obtained in the 3D CFD model.
The pressure patterns of Tests 1 and 2 have RMSE values between 6.01 and 6.67%. In these scenarios, the CFD model adequately predicts the minimum sub-atmospheric pressure peaks. However, when the pressure patterns are rising (from
t = 0.9 s), the pressure patterns of the CFD model present a slight discrepancy compared to the experimental measurements. This is evidenced in more detail in the numerical results of Test 1 (see
Figure 4a). On the other hand, the pressure patterns of Tests 3 and 4 present a good fit with respect to the experimental tests. From the point of view of computational fluid dynamics, RMSE values less than 10% are acceptable in the validation of numerical results, according to the contribution made by Besharat et al. [
25].
4.1. Air Inflow Effect
The air inflow effect that is admitted into the pipe to compensate for the pressure differences between the inside–out of the hydraulic network is studied in the three-dimensional CFD models. When the trapped air pocket expands, vacuum pressures predominate, so the pressure drop is compensated by the air inflow at atmospheric conditions. To understand the dynamic behaviour of the air inflow, the physical ratio between the pressure differential (
) and the air inflow (
) obtained from the different tests represented in the 3D CFD model is analysed. The data obtained from the CFD model are compared with the experimentally calibrated orifice curves.
Figure 5 shows a good numerical correlation between the different measurements of the 3D CFD model with the experimental curves calibrated at the Universitat Politècnica de València.
The air inflow through the orifices allows to identify the type of aerodynamic flow present. Test 1, which has an orifice diameter of 1.5 mm, allows an inflow that reaches a maximum value of 0.66 m
/h, which represents a maximum velocity of 103.91 m/s. On the other hand, Test 2, which considers a lower drain valve-opening percentage compared to Test 1, generates an inlet flow rate of 0.59 m
/h, which is equivalent to a maximum flow velocity of 92.23 m/s. The orifice with a diameter of 3.0 mm has a larger cross section compared to the 1.5 mm orifice, guaranteeing a higher airflow capacity, this is demonstrated in Test 3, where the orifice can receive a maximum flow of 2.05 m
/h, which is equivalent to a flow velocity of 80.7 m/s. In addition, Test 4, which considers a lower drain valve-opening percentage compared to Test 3, presents a maximum air inflow of 1.59 m
/h. In the field of aerodynamic flows, the Mach number (
M) scale is used to classify the airflows presented at the inlet orifices.
Table 3 shows the Mach number values for the different tests of the CFD 3D model.
The tests defined for the analysis of the air-admission orifices of the 3D CFD model show that subsonic airflows are present, which correspond to
M < 0.7. Although the orifices of Tests 1 to 4 show subsonic inflow velocities with a Mach number between 0.18 and 0.30, these flows present a dissipation process that can be studied by streamlines. The 3D CFD model can predict the dynamic behaviour of the air admitted inside of the entrapped air pocket in the different drainage events. Additionally, the 3D CFD model allows to evaluate the influence of orifice sizing on the control of turbulent effects in the entrapped air pocket. If the drainage events are considered under similar conditions of the drainage valve-opening time and percentage (
= 17.5%,
= 0.40 s, and
= 0.205 m) with different air-admission orifices (
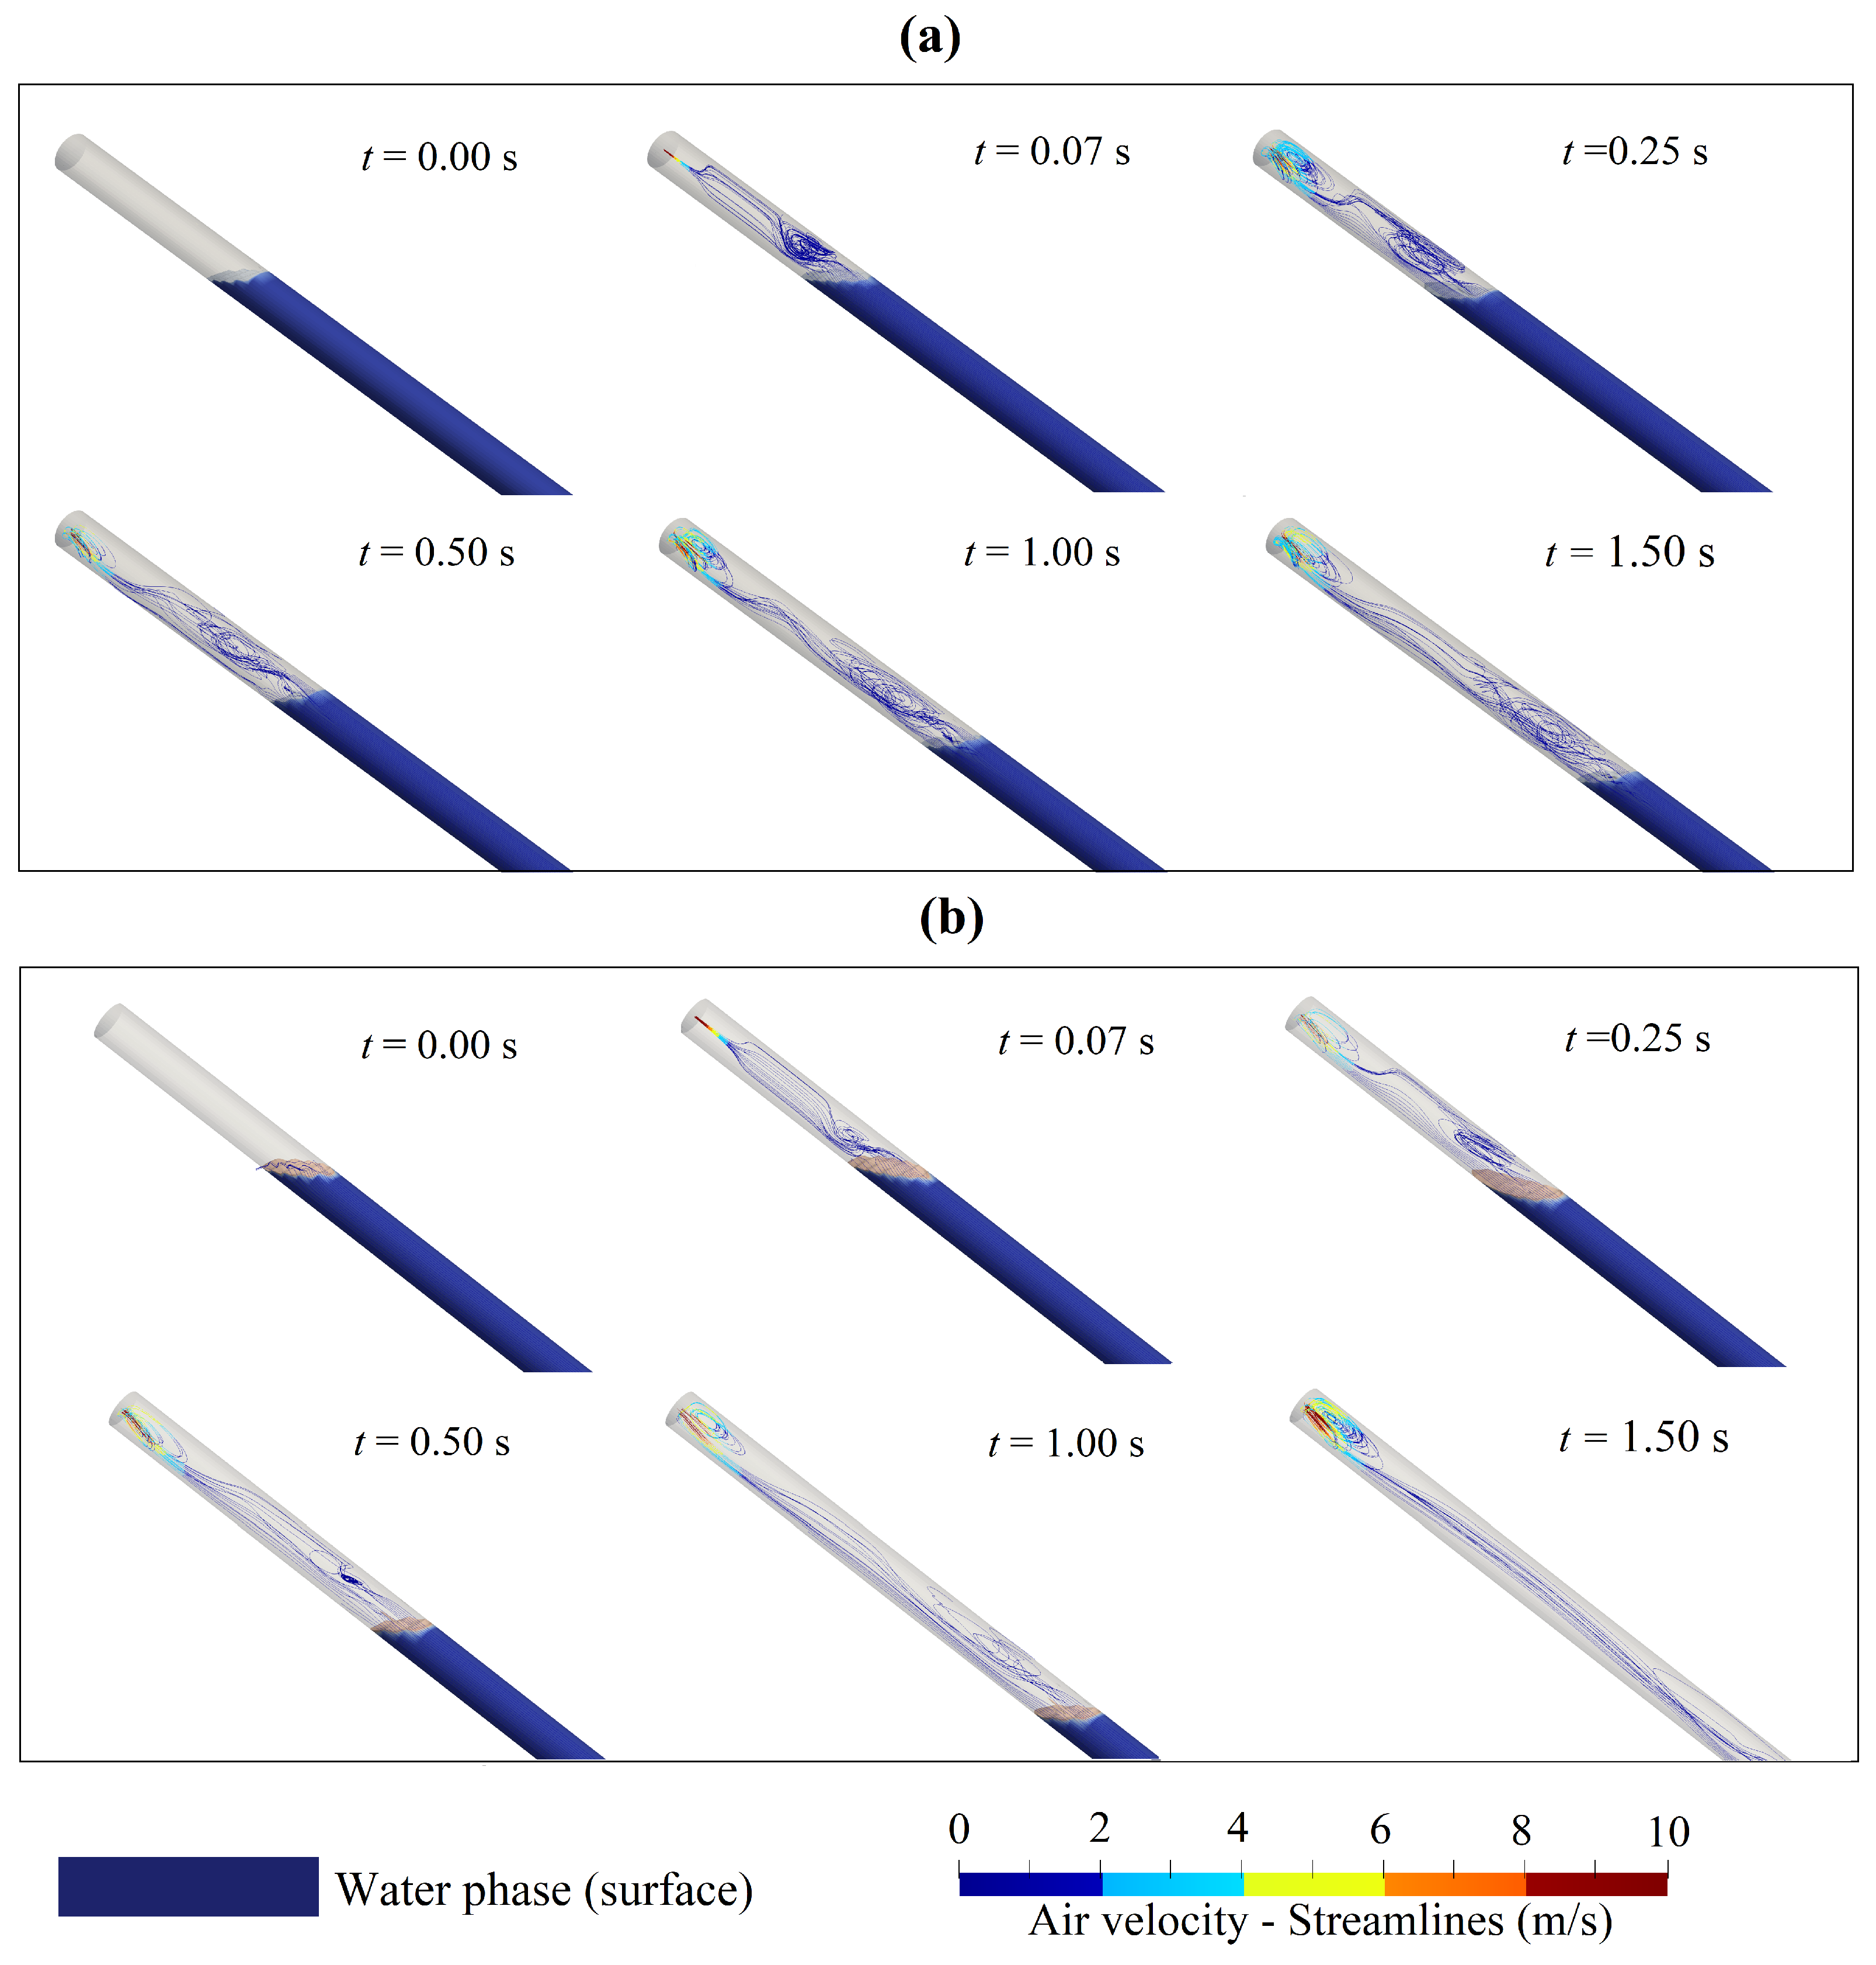
= 1.5 and 3.0 mm), the differences in the resulting streamlines can be observed in the effect of the vorticity on the entrapped air pocket, as shown in
Figure 6.
During the air-admission process through the different orifices, the streamlines diverge towards the pipe walls and subsequently generate a vorticity effect on the air–water interface, as shown in
Figure 6a,b, at
t = 0.07 s. Subsequently, the streamlines have a circulatory trajectory over the air-admission region manifested in an airflow circulation process, where the velocities are higher than 2.0 m/s. In addition, the airflow follows its course along the air pocket, in the direction of draining, in order to occupy the space previously occupied by the water. Finally, the results of
Figure 6 show that the vorticity effect is worse in the drainage event with an orifice
= 1.5 mm, compared to the dynamic effect presented in the drainage event with an orifice
= 3.0 mm, due to the velocities reached by the air inlet flow over the smaller-diameter orifice. In the smaller-diameter orifice, a maximum Mach number of 0.23 is reached, while in the scenario studied with the larger-diameter orifice, a maximum Mach number of 0.17 is reached under similar drainage conditions.
4.2. Influence of Air-Admission Orifice on Water Drainage Velocity
The air-admission orifice has a fundamental role in supplying the air volume required to generate an efficient drainage process in the hydraulic system with a dissipation of the vacuum pressures and a reduction in the transients inside the pipeline.
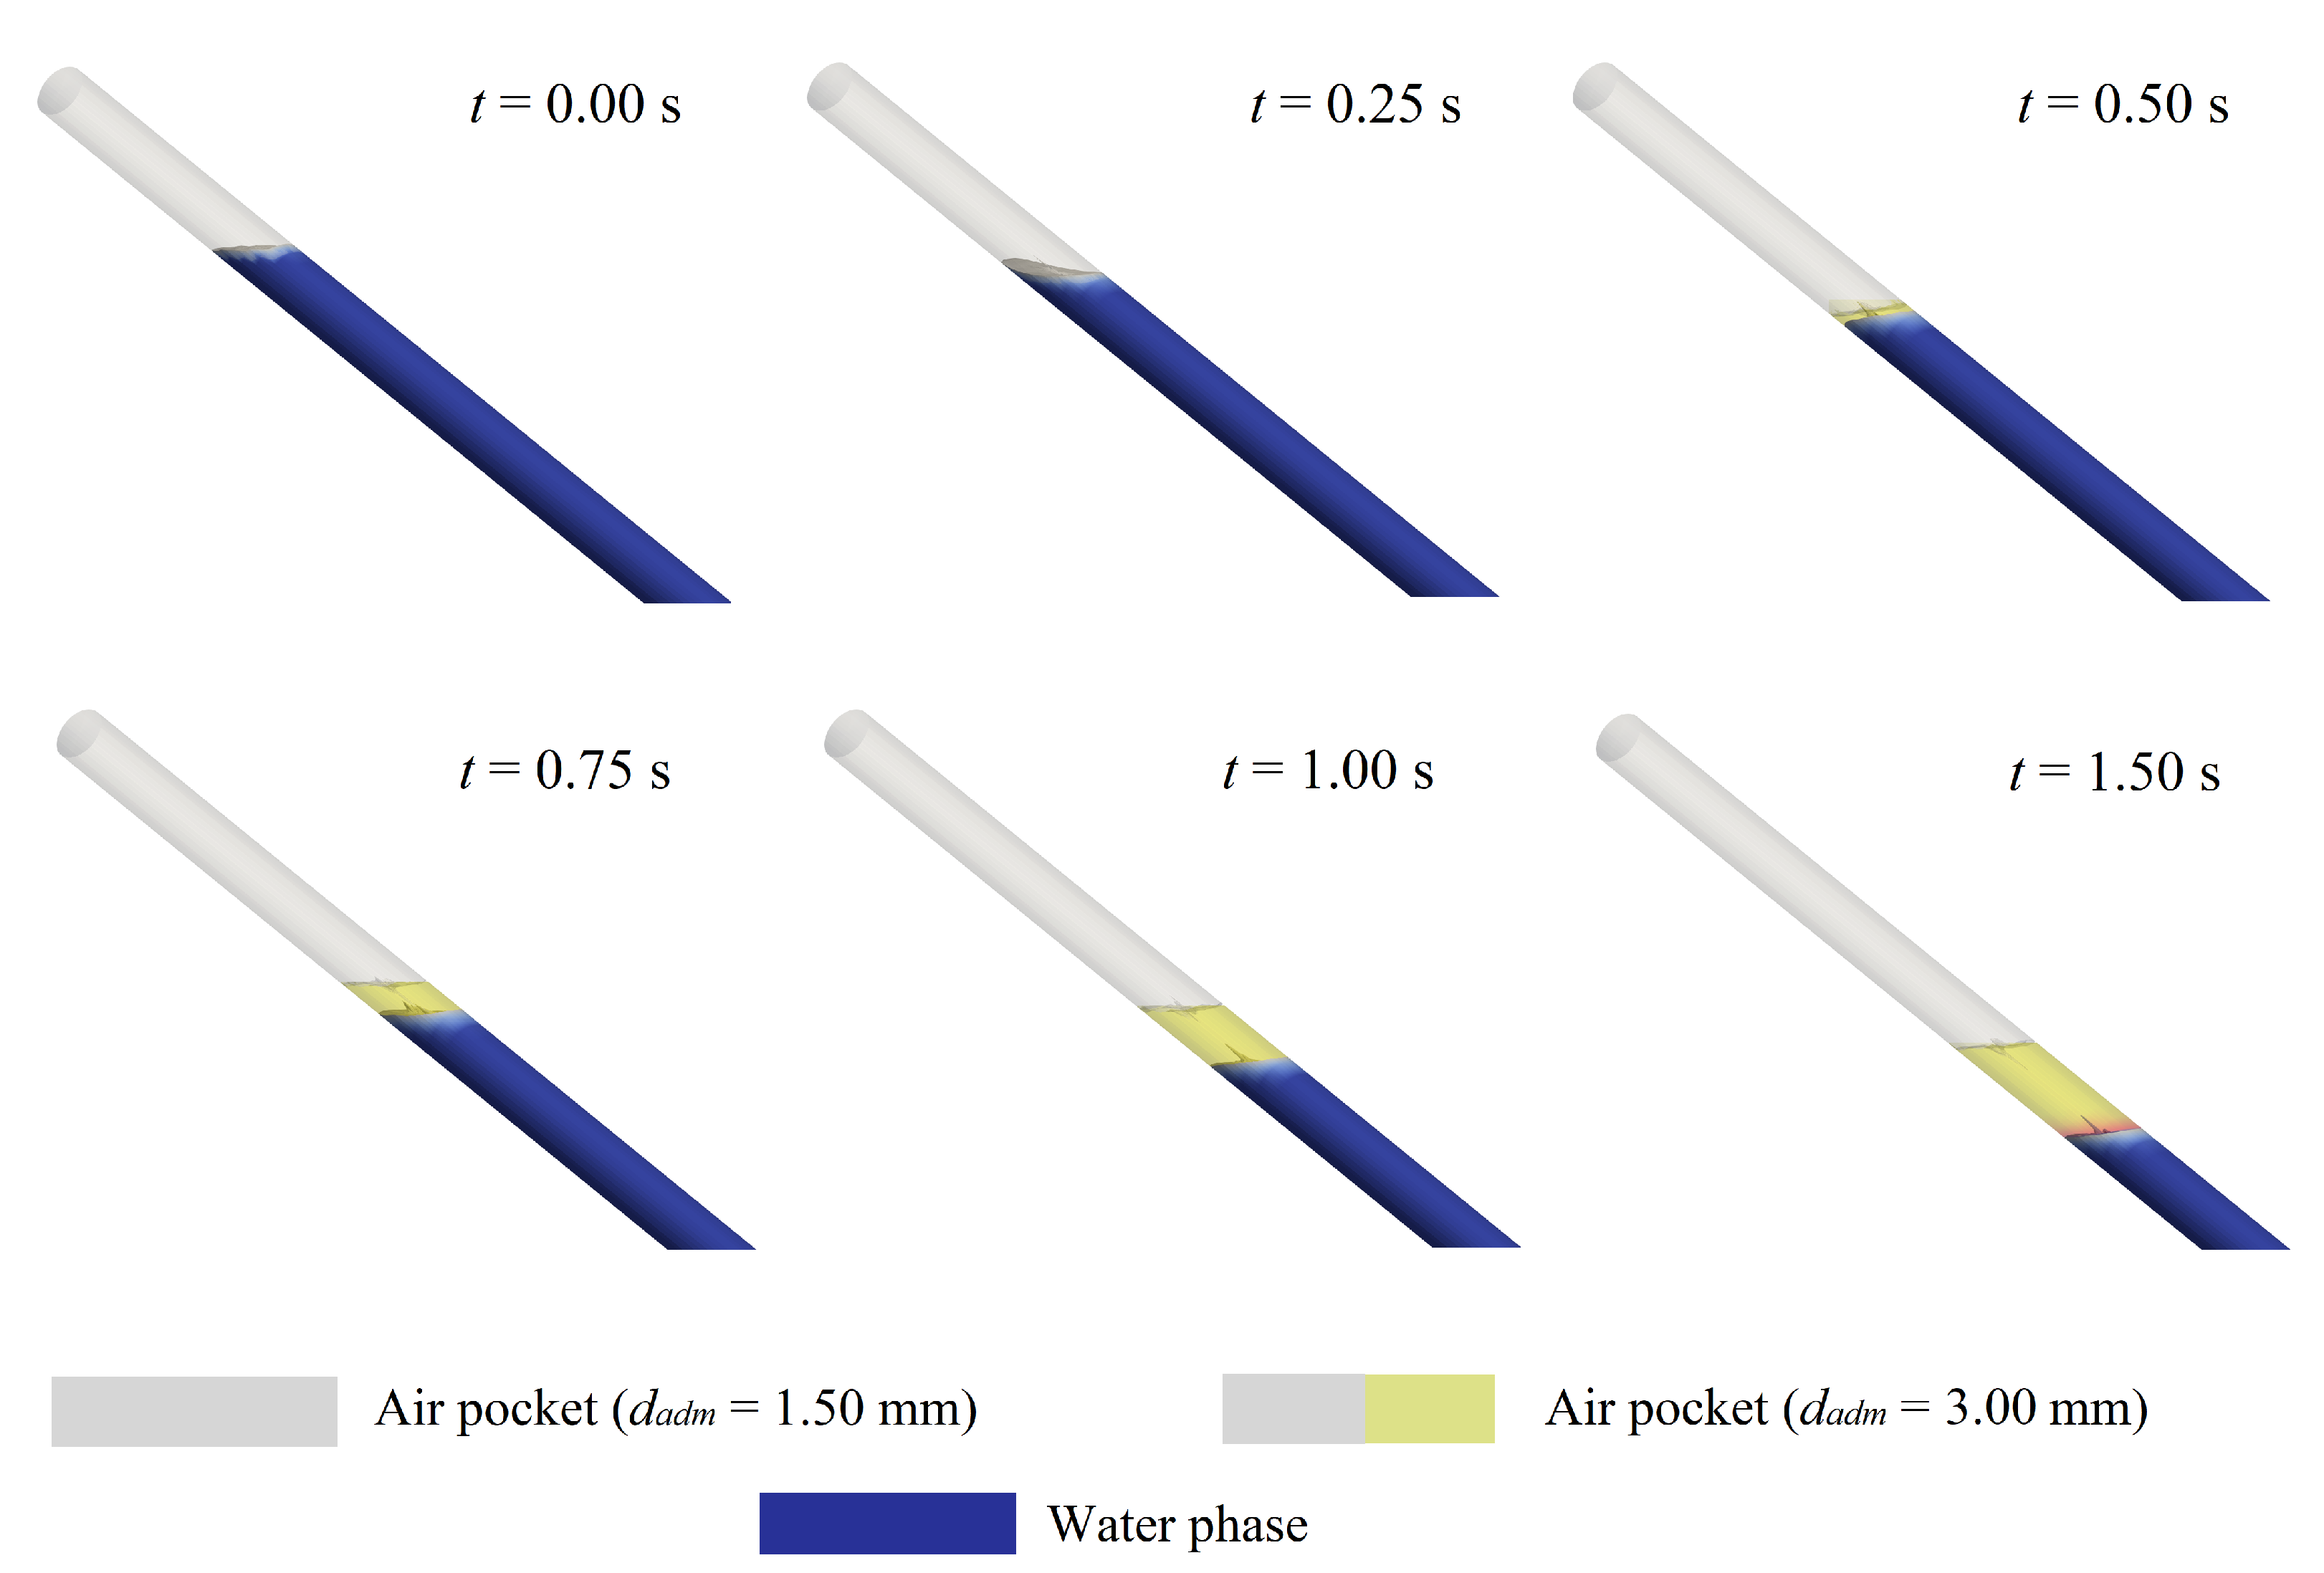
Figure 7 shows the evolution of the water drainage and the expansion of the trapped air pocket during similar draining events (
= 17.5%,
= 0.40 s, and
= 0.205 m), considering the two orifices analysed in this research.
The volume differences in the events presented lie in the principle of conservation of mass between the volume of air admitted to the hydraulic system and the expansion of the air pocket during the drainage events.
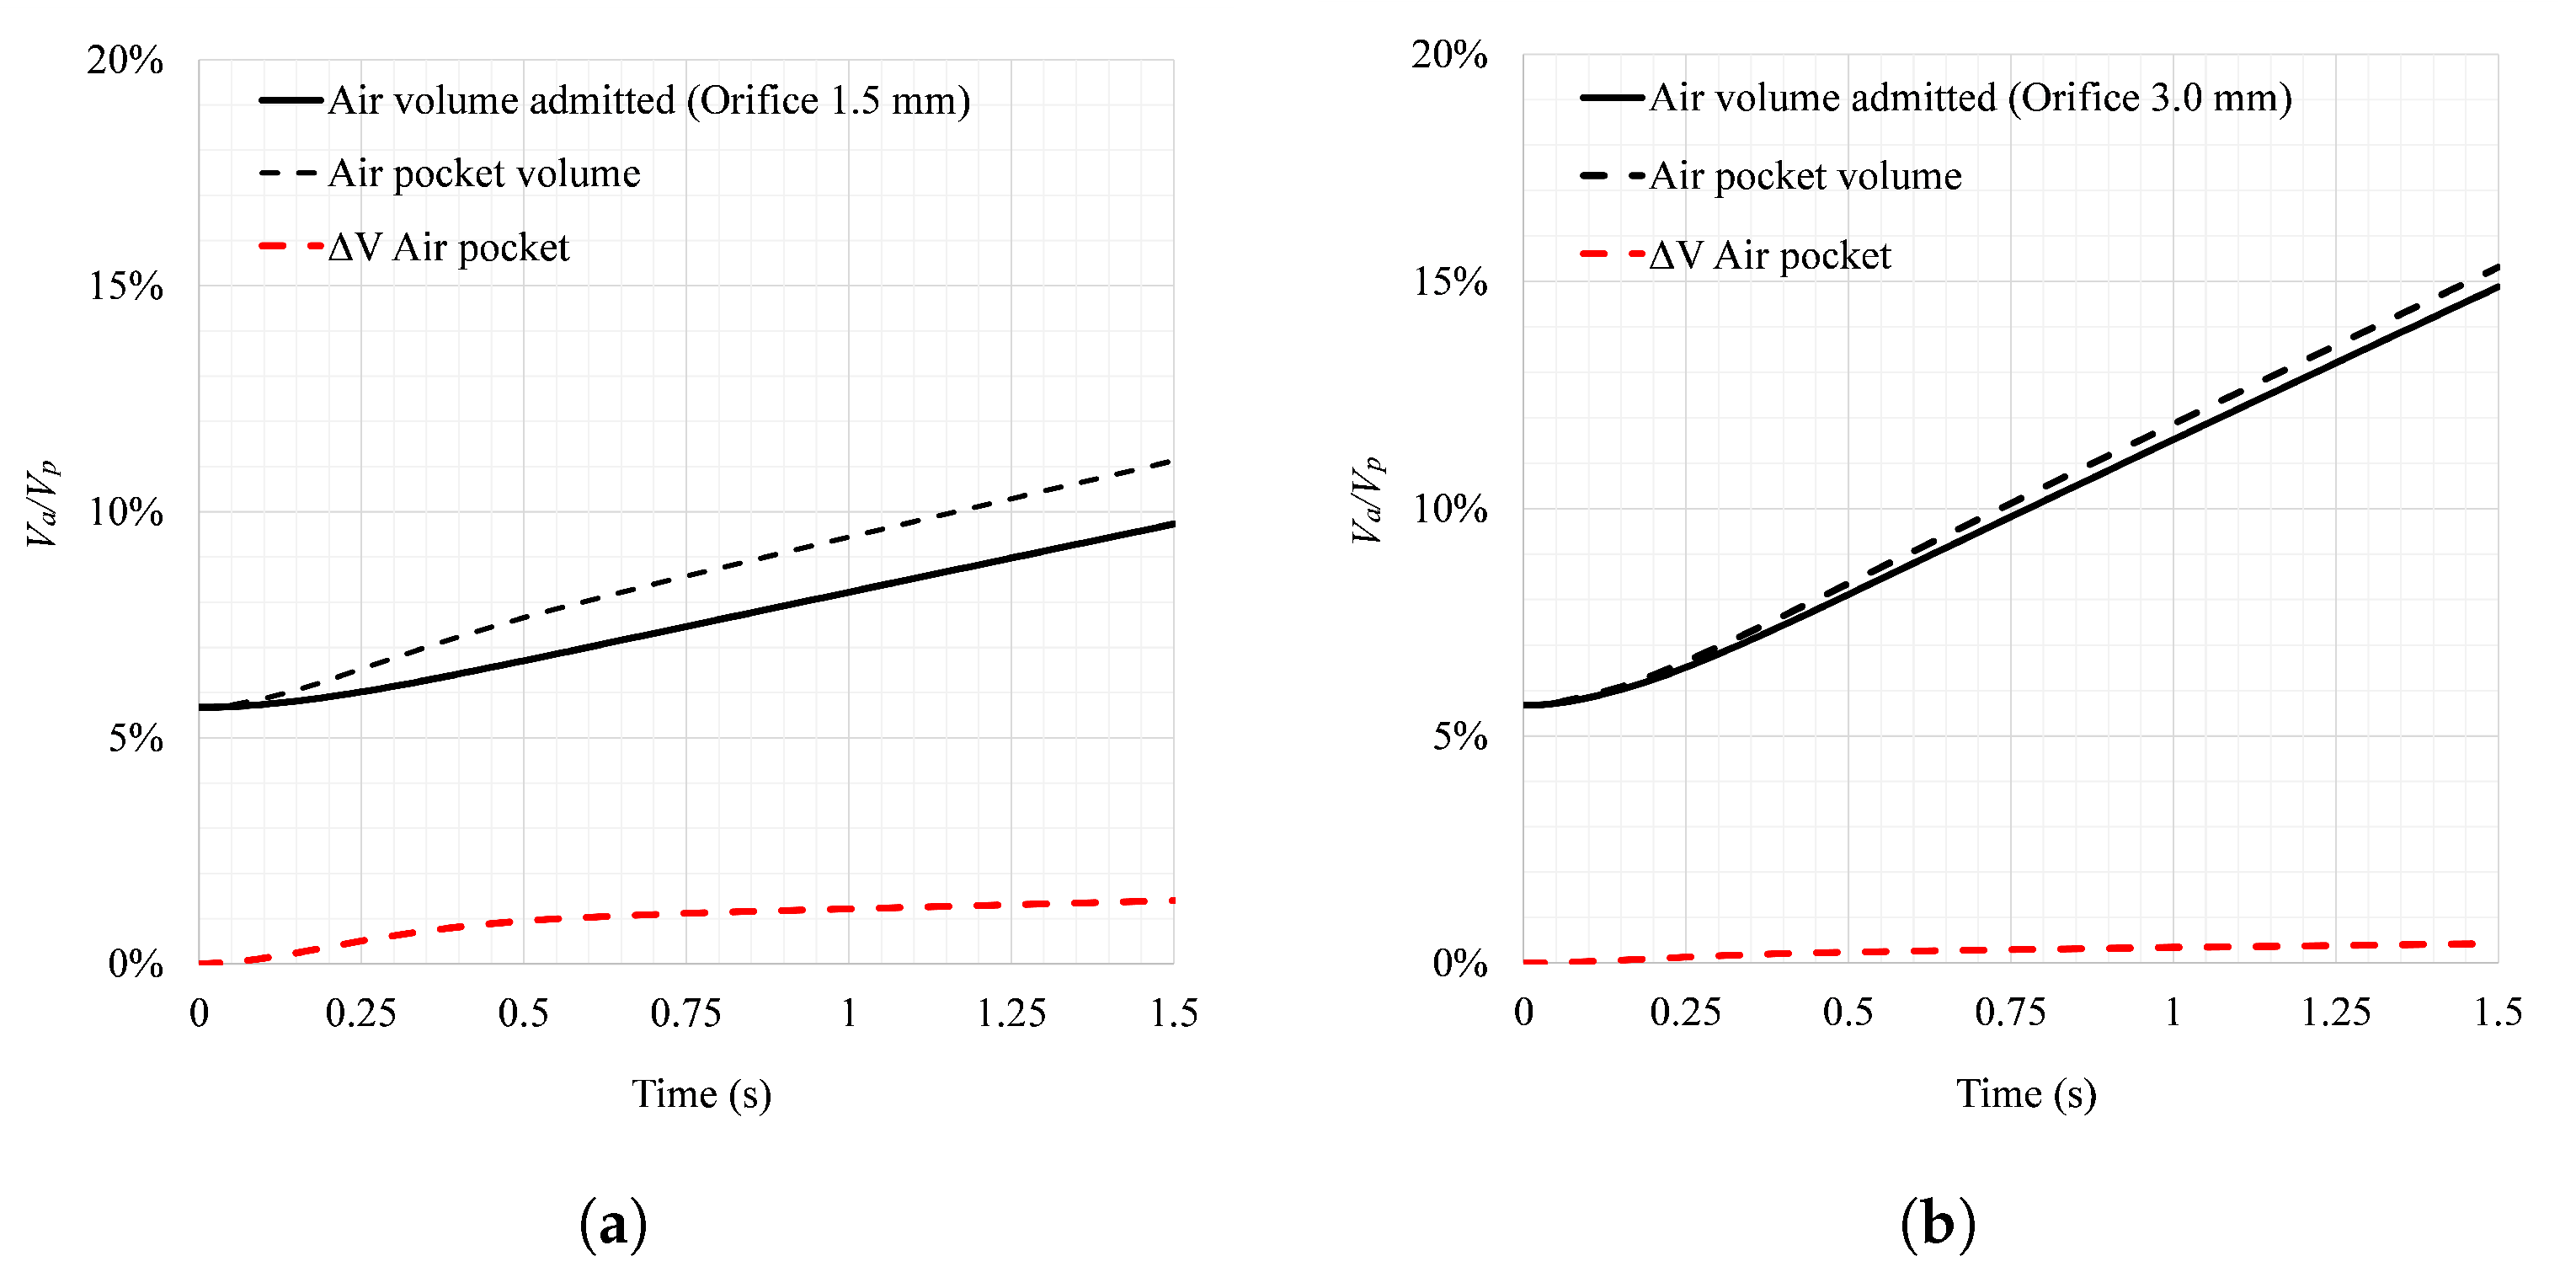
Figure 8 shows the evolution of the admitted air volume and the volume of the air pocket in the pipes with orifices of a diameter of 1.5 and 3.0 mm under the same drainage conditions as defined above, analysing the volume changes presented as a function of the term
, where
= air volume and
= volumetric capacity of the single pipe. Additionally, the presented volume difference
between the admitted air volume and the resulting volume of the air pocket is shown.
Initially, the volume of the air pocket corresponds to 5.67% of the volumetric capacity of the single pipe (
= 5.67%) in the two drainage events.
Figure 8a shows the evolution of the air-admitted volume during the drainage event with an orifice diameter of 1.5 mm, which reaches a value of
= 9.73% at
t = 1.50 s. Therefore, the volume of the entrapped air pocket reaches an equivalent volume of
= 11.13% at
t = 1.50 s during the expansion process caused by the drainage event. This scenario shows that the increase in the volume of the trapped air pocket is greater than the volume of air admitted by the orifice over time, resulting in a volume differential of
= 1.40% at
t = 1.50 s. The behaviour of
corresponds to the air pocket volume that has not been compensated for by the air volume admitted over time. On the other hand,
Figure 8b shows the volumetric flow rate admitted through the orifice with a diameter of 3.0 mm and the variation in the air pocket volume. In contrast to the drainage event with an air-admission orifice diameter of 1.5 mm, the orifice with a diameter of 3.0 mm facilitates the admission of a larger volume of air, demonstrated in a volume differential of
= 0.43%. Thus, the orifice diameter of 3.0 mm adequately compensates for the volume of air that expands inside the pipe during the drainage event.
5. Conclusions
Drainage events in pipelines are common practice in hydraulic pipelines. Air valves or orifices have been devices to protect hydraulic systems against two-phase transient flows. Detailed knowledge of the operation of these devices and the influence of their sizing is currently very scarce in the literature, and by developing CFD models, it is possible to study those hydraulic, thermodynamic, and aerodynamic phenomena that analytical models cannot capture in detail. Based on the results obtained in this research, different points can be concluded:
The three-dimensional CFD models adequately represent the dynamics of different air-admission orifices in different drainage events with trapped air, showing good numerical results in obtaining vacuum pressures, even in the representation of the air inflow effect using the calibration curves of orifices with diameters of 1.5 and 3.0 mm. The Root Mean Square Error values are adequate (between 2.34 and 6.67%), according to the contribution of Besharat et al. [
25].
The vorticity effect in the trapped air pocket corresponds to a phenomenon that has been scarcely studied in air-admission orifices of hydraulic systems. The 3D CFD model provides the possibility to know the behaviour of the airflow streamlines inside the pipe over time. This information is useful to verify the impact of the airflow turbulence phenomena inside the pipe.
In similar drainage events, an air-admission orifice with a diameter = 3.0 mm guarantees a differential volume fraction of 0.41%, thus allowing a continuity of the airflow over the trapped air pocket and an adequate expansion of the air pocket during the drainage processes. On the other hand, the orifice with = 1.5 mm generates a higher differential volume fraction than the orifice = 3.0 mm (1.40%). For the maximum time instant analysed (t = 1.50 s), the continuity of the airflow over the air pocket is approximately 3.25 times more effective at the 3.0 mm diameter orifice than at the 1.5 mm diameter orifice. An effective control of the vacuum pressures and hydraulic transients lies significantly in the appropriate sizing of the air-admission orifices. A larger orifice allows the admission of a higher volumetric rate in order to preserve the principle of continuity between the air-admitted volume and the air pocket volume. If a rapid drainage process is considered (high drain valve-opening percentages), it is important to choose to use a larger orifice in order to compensate for the volume differential generated between the air pocket volume and the air-admitted volume to the hydraulic system over time.
The scenarios studied correspond to admission orifices suitable for the experimental scheme, with diameters of 1.5 and 3.0 mm, where the predominant airflow in the tests corresponds to a subsonic flow. The analysis of the air-admission orifices in water pipelines allows to define practical measures to provide the safe and efficient management of pipe water infrastructures, ensuring the improved conditions of safety, efficiency, and sustainability. For future research, it is appropriate to study the performance of air orifices or air valves in real hydraulic pipelines during filling and drainage events through two-/three-dimensional CFD models to assess their numerical reliability. The application of CFD models allows to obtain additional information that simple models cannot (air–water interaction, air bubbles, temperature gradients, etc.). The visualisation of physical phenomena inside water pipe networks with air valves facilitates the detailed management of water resource management, where the user can monitor the dynamic behaviour of the air–water interaction. Additionally, it is important to study the dynamic behaviour of air-admission orifices under supersonic flow conditions using two- or three-dimensional computational fluid dynamics models.

