Article

Study on the Hydraulic Fracturing Failure Behaviour of Granite and Its Comparison with Gas Fracturing

1
Guangdong Provincial Key Laboratory of Deep Earth Sciences and Geothermal Energy Exploitation and Utilization, Institute of Deep Earth Sciences and Green Energy, College of Civil and Transportation Engineering, Shenzhen University, Shenzhen 518060, China
2
Shenzhen Key Laboratory of Deep Underground Engineering Sciences and Green Energy, Shenzhen University, Shenzhen 518060, China
3
DOE Laboratory of Deep Earth Science and Engineering, College of Water Resource and Hydropower, Sichuan University, Chengdu 610065, China
*
Author to whom correspondence should be addressed.
Sustainability 2022, 14(21), 14593; https://doi.org/10.3390/su142114593
Submission received: 12 September 2022 / Revised: 30 October 2022 / Accepted: 3 November 2022 / Published: 6 November 2022

Abstract

:
Efficient technology is needed to realise reservoir stimulation for deep geothermal energy exploitation. However, the main control parameters of traditional hydraulic fracturing technology are not clear, as well as their coupling effects; besides, the damage mechanism of novel gas fracturing technology is still not determined, which restricts the mining of hot dry rock resources. Therefore, through a series of true triaxial hydraulic fracturing tests, this paper explores the coupling effect of horizontal stress difference and injection rate on hydraulic fracturing; then, the cohesive element is used to establish hydraulic fracturing and gas fracturing models under the same test conditions. Differences in fracture width and fracture network morphology between the two technologies were compared, and the rock-breaking effects in in-situ reservoirs were analysed. The results show that the breakdown pressure of granite increases gradually with the increase of injection rate, at the small horizontal stress difference; but this trend is opposite at the large horizontal stress difference. Under a higher horizontal stress difference, the increment of the maximum fracture width of gas fracturing becomes larger than that of hydraulic fracturing after increasing the injection rate. When the fracturing cluster spacing is reduced, the fracture width and length of gas fracturing gradually become larger than those of hydraulic fracturing; when the injection rate is increased, the hydraulic fracturing network becomes more complex than gas fracturing. This study can provide useful information for applying hydraulic fracturing and gas fracturing in deep geothermal reservoirs.

1. Introduction

As a kind of clean, renewable energy, geothermal is a potential choice to reduce carbon emissions and achieve sustainable development [1,2,3]. Geothermal energy mainly exists in tight, low-permeability hot dry rock reservoirs, and it needs to be stimulated to increase production [4]. Hydraulic fracturing (HF) is the core technology for enhancing geothermal systems (EGS) [5,6,7], but it often faces difficulties such as high breakdown pressure (BP) and single fracture network shape in deep geothermal reservoirs [8,9], which brings challenges to fracturing equipment. Therefore, reducing the reservoir’s BP and increasing the fracture network complexity is crucial for the stimulation of deep geothermal reservoirs. Horizontal stress difference (HSD) and injection rate (IR) are two core parameters affecting reservoir BP and hydraulic fracture propagation patterns [10]. Based on a large number of experiments, it is found that increasing the IR can enlarge the fracture network area [11,12], thereby further improving the reservoir permeability [13,14]. However, the BP of the rock stratum increases if IR is heightened, and there is an approximately linear relationship between them [15], making rock initiation difficult. In addition, higher IR exerts more energy on the reservoir [16], which increases the risk of induced earthquakes. Although decreasing the IR can make it easier for HF to immerse the reservoir to reduce the BP of the rock, it is hard to fail the rock when the IR is lower than a certain threshold [17]; besides, an excessively low IR may increase the cost of mining. On the other hand, the fracture network morphology is very sensitive to the changes of in-situ stress [18]. Under true triaxial geostress field, the hydraulic fractures expand along the direction of the maximum horizontal principal stress [19], and the fracture’s direction is often determined by the HSD’s magnitude. At a lower HSD, the hydraulic fractures are slenderer and more tortuous [20]; as the HSD increases, the fracture length gradually decreases, but branch cracks are more easily generated in the area close to natural fractures [21], which increases the complexity of the fracture network. However, most of the above studies usually ignore the combined effect of HSD and IR, with the change of geostress field, the influence of IR on BP and fracture network morphology still needs to be further investigated.
In laboratory and field experiments, errors are easier to be caused by equipment; previous researches indicate numerical simulation is helpful to accurately analyse the fracturing damage evolution process at a lower cost [22,23,24]. After reviewing recent studies of HF numerical simulation, it is found that fluid viscosity also plays an important role in HF [12,25,26]. Liao et al. [27] found that compared with HF, the low-viscosity supercritical CO2 fracturing fluid can reduce the BP of hot dry rock by 14.4%. In addition, because low-viscosity fracturing fluid has lower flow resistance, gas fracturing (GF) is easier to penetrate the micro-fractures of the rock to increase the area of the fracture network [28]; meanwhile, the heat extraction efficiency is higher [29,30]. However, the opposite phenomenon is that the ultra-low viscosity fracturing fluid is unable to form a complex fracture network, even fractures in the rock were also inconspicuous, while the high viscosity fracturing fluid will form more extended fractures [12,31]. In fact, most of the above-mentioned research is based on regular mesh patterns or prefabricated fracture propagation paths, which are inconsistent with the actual fracture propagation situation; this may be an important reason for the divergence of research results. In recent years, the modelling method of random fracture propagation has been tried. Many studies have shown that, not only IR, but also the spacing of fracturing clusters impact the fracture network morphology of HF [32,33]. By arranging fracturing clusters meanwhile reducing the cluster spacing, the density of the fracture network can be increased, thereby enhancing the thermal conductivity of EGS, also effectively improving the heat recovery efficiency [34,35]. However, even using the same finite element calculation method, sometimes different conclusions were obtained; for example, increasing the fracturing cluster spacing can increase the fracture length and extract a higher temperature [36]. It can be seen that the numerical simulation results are quite different due to different boundary conditions. At present, there are still few reports on the differences in the mining effects between HF and GF under the same conditions. The parameters that affect heat extraction efficiency are still unclear, such as fracture width, which limits the application of the two fracturing technologies in in-situ reservoir stimulation.
In this paper, to explore the combined effect of HSD and IR, HF laboratory experiments under different HSD and IR were carried out, failure behaviour of granite under HF were detailed analysed. At the same time, random fracture propagation numerical models under the same experimental conditions were established to simulate the progressive damage behaviour of granite. Then, the effects of the novel GF technology and the traditional HF technology on the fracture width and fracture network morphology during fracking process were compared. Finally, to evaluate the reservoir stimulation effect of HF and GF technologies in engineering scale, simulation results of HF and GF under different fracturing cluster spacings and different IRs were compared. The research provides a reference for optimising deep geothermal reservoir fracturing technology.

2. Materials and Methods

2.1. Testing Material

In this experiment, the granite samples were taken from the early Yanshan granite outcrops in the Guangdong-Hong Kong-Macao Greater Bay Area, China [1]. According to X-ray diffraction (XRD), the main mineral components of the rock samples include micro plagioclase (30.8%), quartz (25.7%), albite (24.6%), muscovite (13.2%) and kaolinite (5.7%) (Figure 1). This granite is mainly composed of hard minerals, with high micro plagioclase, quartz, and albite, leading to greater brittleness. According to the International Society of Rock Mechanics (ISRM) standard specification [37], the basic mechanical parameters of this granite were determined (Table 1). The average uniaxial compressive strength is 142.45 MPa, the average Poisson’s ratio is 0.20, the average elastic modulus is 21.71 GPa, the average tensile strength is 12.34 MPa, and the average fracture toughness is 2.09 MPa·m1/2. These parameters also can be used for subsequent numerical simulation. The granite outcrops were cut into cube samples with a length of 100 mm, a width of 100 mm, and a height of 100 mm, and each plane was ground. The 12 edges of the cube rock sample were chamfered with a width of 3 mm and inclination of 45° to avoid stress concentration damage at the corners [38]. A cylindrical borehole with a diameter of 10 mm was drilled in the centre of the specimen to simulate a fractured wellbore, and the hole depth was 50 mm (Figure 2).

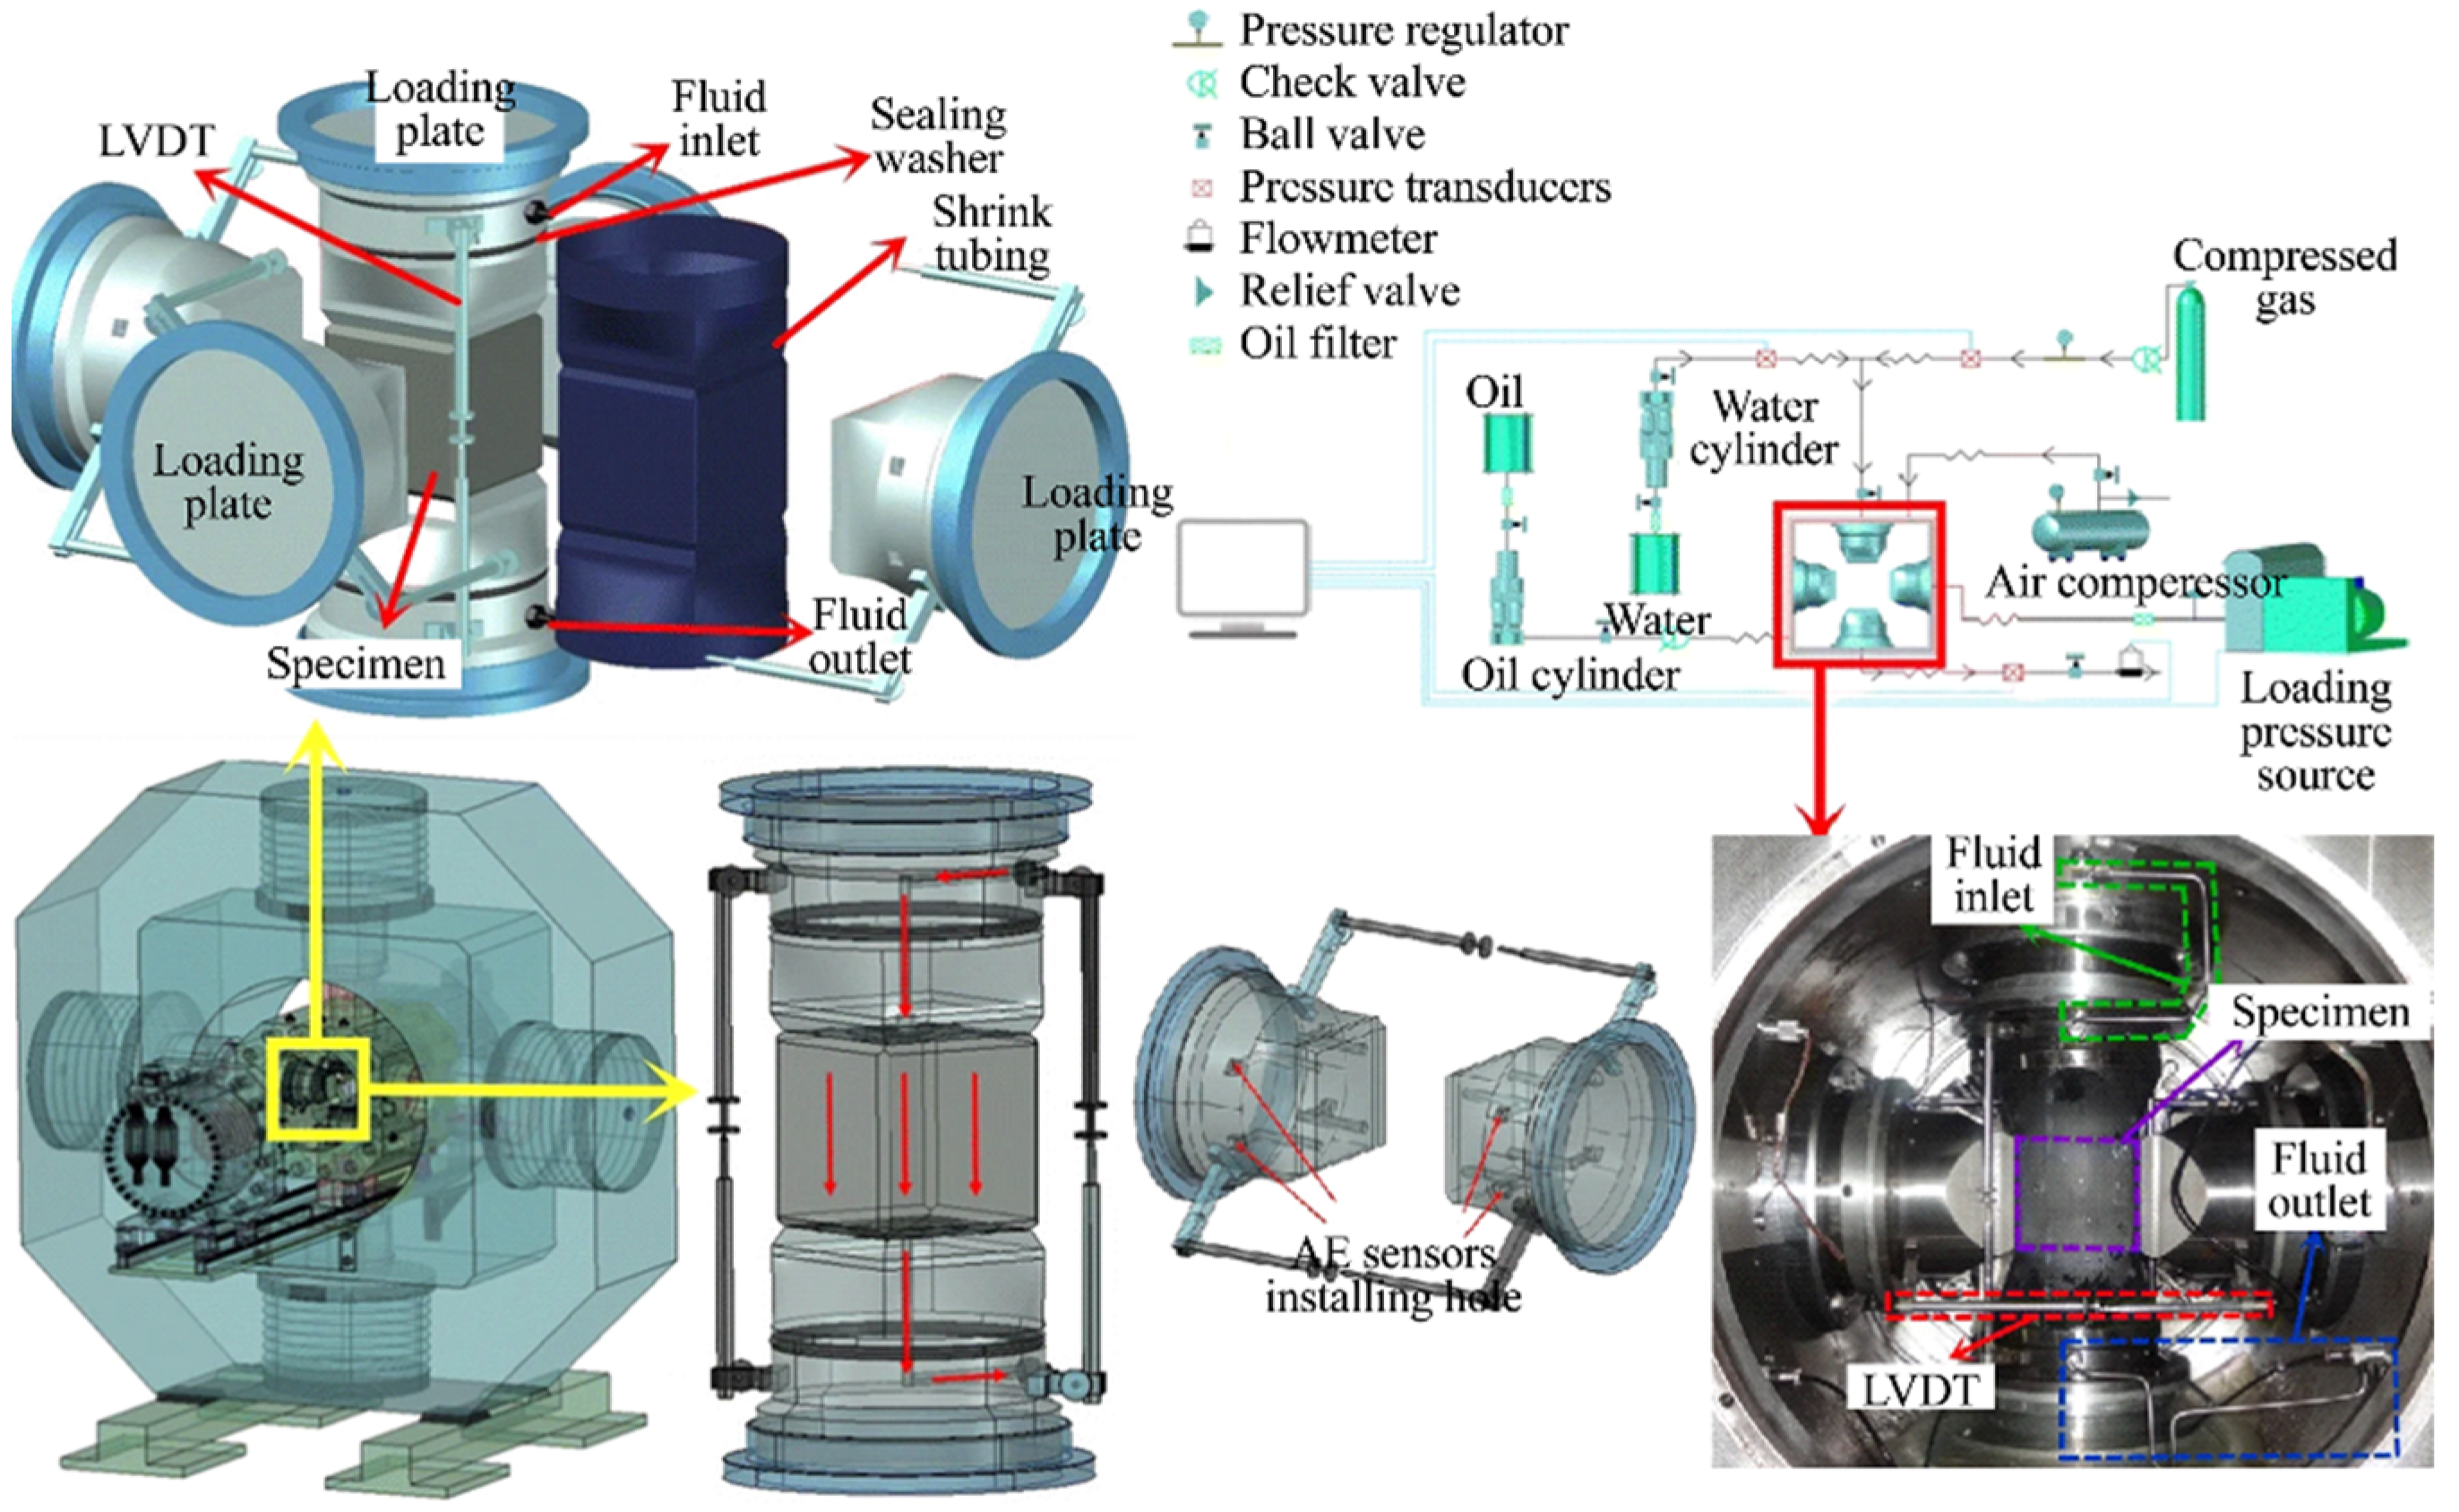
2.2. Experimental Equipment

The HF test was carried out on the multifunctional true triaxial fluid-solid coupling geomechanics experimental system (Figure 3). As shown in Figure 3, this device mainly consists of a pressure chamber, a true triaxial loading system, a fluid pressure system, an axial force-displacement measurement system, a precision control system, and a data acquisition system [39]. This device can load stress in three axes from six directions, the maximum load can reach 6000 kN, and the fluid pressure can reach up to 60 MPa. Each loading plate can be independently loaded to realise uniform stress. At the same time, it is equipped with an LVDT sensor with an 8 mm range, and the accuracy is higher than 0.1% [40].

2.3. Experimental Scheme and Testing Procedure

As this test equipment can simulate the stress field of the geothermal reservoir, based on practical engineering in offshore southeast, China [42], three groups of HSDs were designed as variables (σH/σh was 3/3 MPa, 6/3 MPa, and 9/3 MPa, respectively, and the corresponding HSDs were 0 MPa, 3 MPa, and 6 MPa), σV was set as a constant (25 MPa) abide by the single-variable criterion. Meanwhile, three IRs (10/60/100 mL/min) were designed to explore the coupling effect of HSD and IR on granite failure behaviour. Before the test, rock samples were numbered, and fluid pressure was monitored during the test in real-time to determine BP. Granite samples were numbered in the format of “Hydraulic Fracturing abbreviation (HF)—sample (1, 2, 3)”. The specific test process is as follows:
(a)
Connect the fractured wellbore to the fluid inlet, and install a heat-shrinkable sleeve to seal the granite sample.
(b)
Put the sample into the true triaxial cavity, and slowly load to reach the designed stress in six directions to avoid eccentric compression damage.
(c)
Use the plunger pump to pump the fracturing fluid, mixed with the tracer, into the fractured wellbore until the pressure curve drops sharply.
(d)
Take out the rock sample and observe the fracture morphology signed by the tracer. If the fracture extends to the boundary, the sample is declared to be broken.

3. Laboratory Experimental Results and Discussion

3.1. Breakdown Pressure

Table 2 summarises the test conditions and fracturing results. Time-injection pressure curves are shown in Figure 4. It can be seen that when the HSD was 0 MPa and the IR was 10/60/100 mL/min, the BP of the rock sample was 6.66 MPa, 12.22 MPa, and 14.10 MPa, respectively (Figure 4a). Among them, when IR was 10 mL/min, the BP was respectively increased by 83.48% and 111.71% when IR was 100 mL/min and 60 mL/min. Obviously, when the HSD is low, the BP of granite increases with the IR, which is consistent with the failure behaviour of coal, shale, and sandstone under the same conditions [43,44]. Zoback et al. [45] explain that high IR would aggravate the filtration of fracturing fluid, and the fracturing fluid did not fully penetrate the microscopic defects of the rock, which inhibits the propagation of fractures and may be the cause of high BP, being difficult to crack granite under IR of 60/100 mL/min. However, the variation trend of BP changed at the HSD was 3 MPa. As the IR gradient increased, the value of BP was initially decreased by 2.37% and then increased by 32.29% (Figure 4b). This means, under this HSD, there may be a threshold between 10 mL/min and 100 mL/min that can effectively reduce the BP of granite [17]. Figure 4c manifests the curve of time-injection pressure under HSD is 6 MPa; with the increase of IR, the BP of the rock sample showed an accelerated decrease trend, it decreased from 12.75 MPa to 9.54 MPa and 5.79 MPa, with a decreased range of 25.18% and 39.31%, respectively. However, this phenomenon is the opposite when the HSD is 0MPa. It means that in the in-situ stress field with a larger HSD, increasing IR may help to reduce the difficulty of rock fracturing; while in the state of smaller HSD, reducing IR may easier to crack the reservoir.

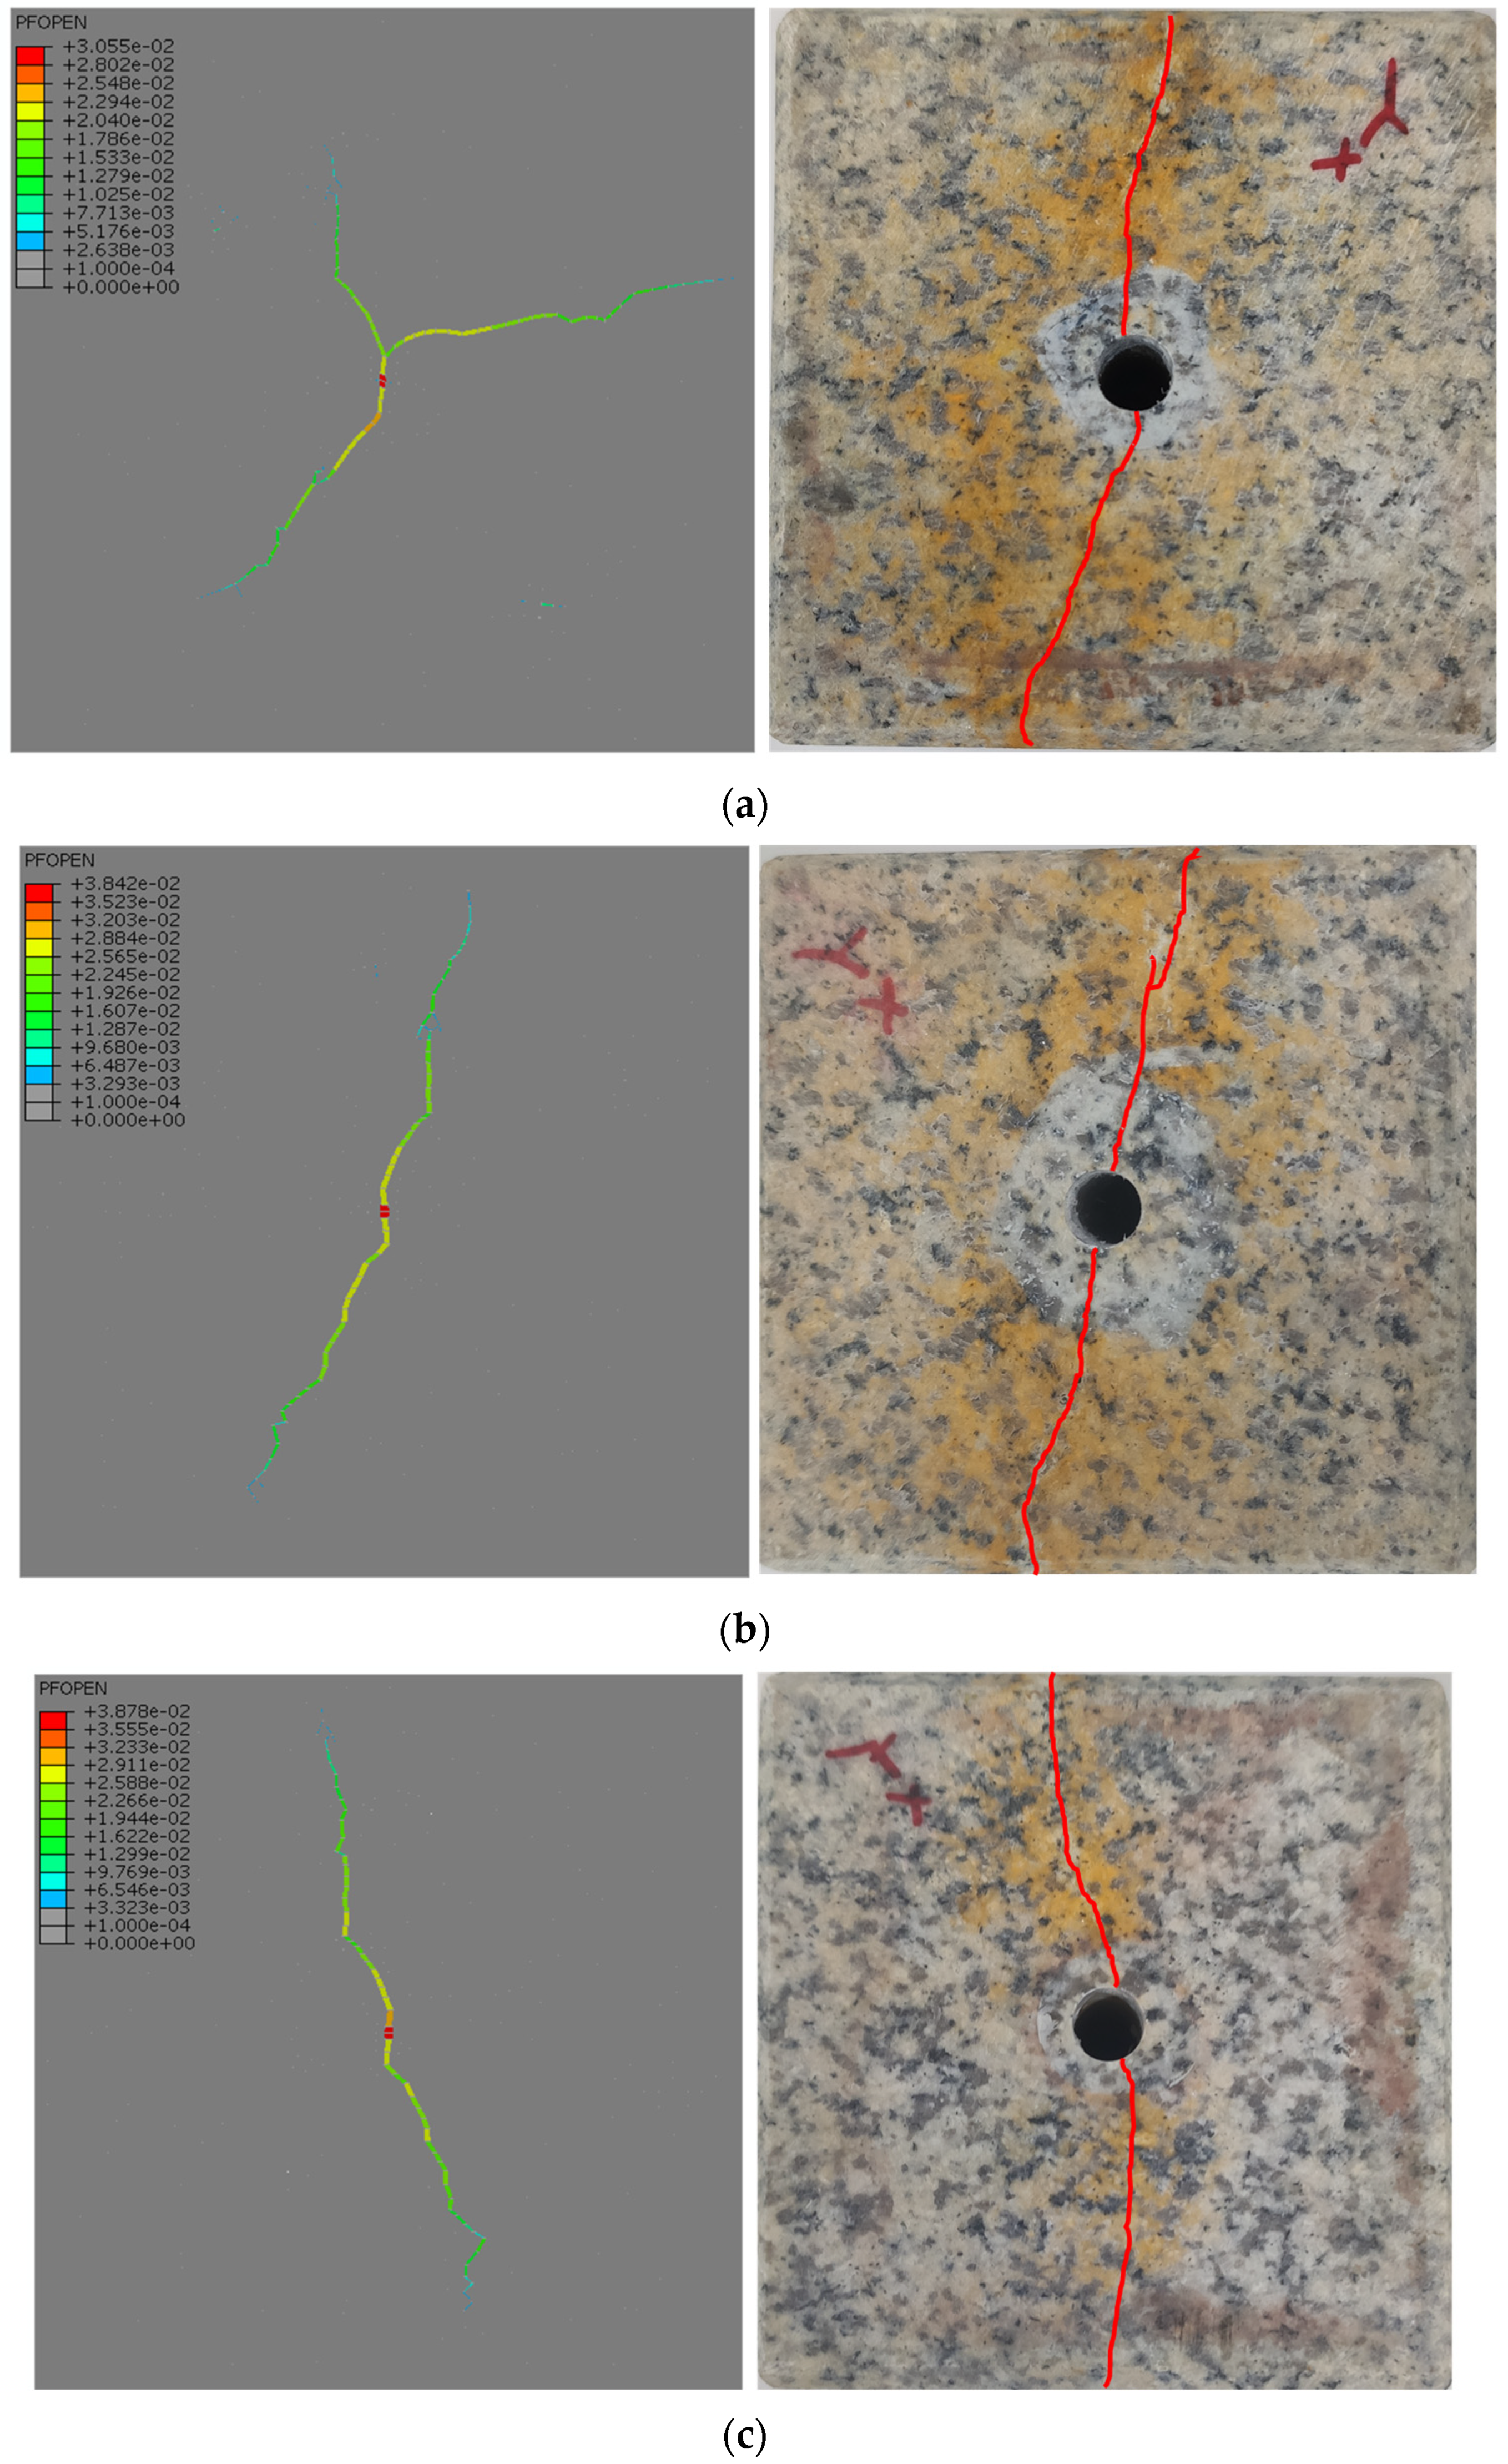
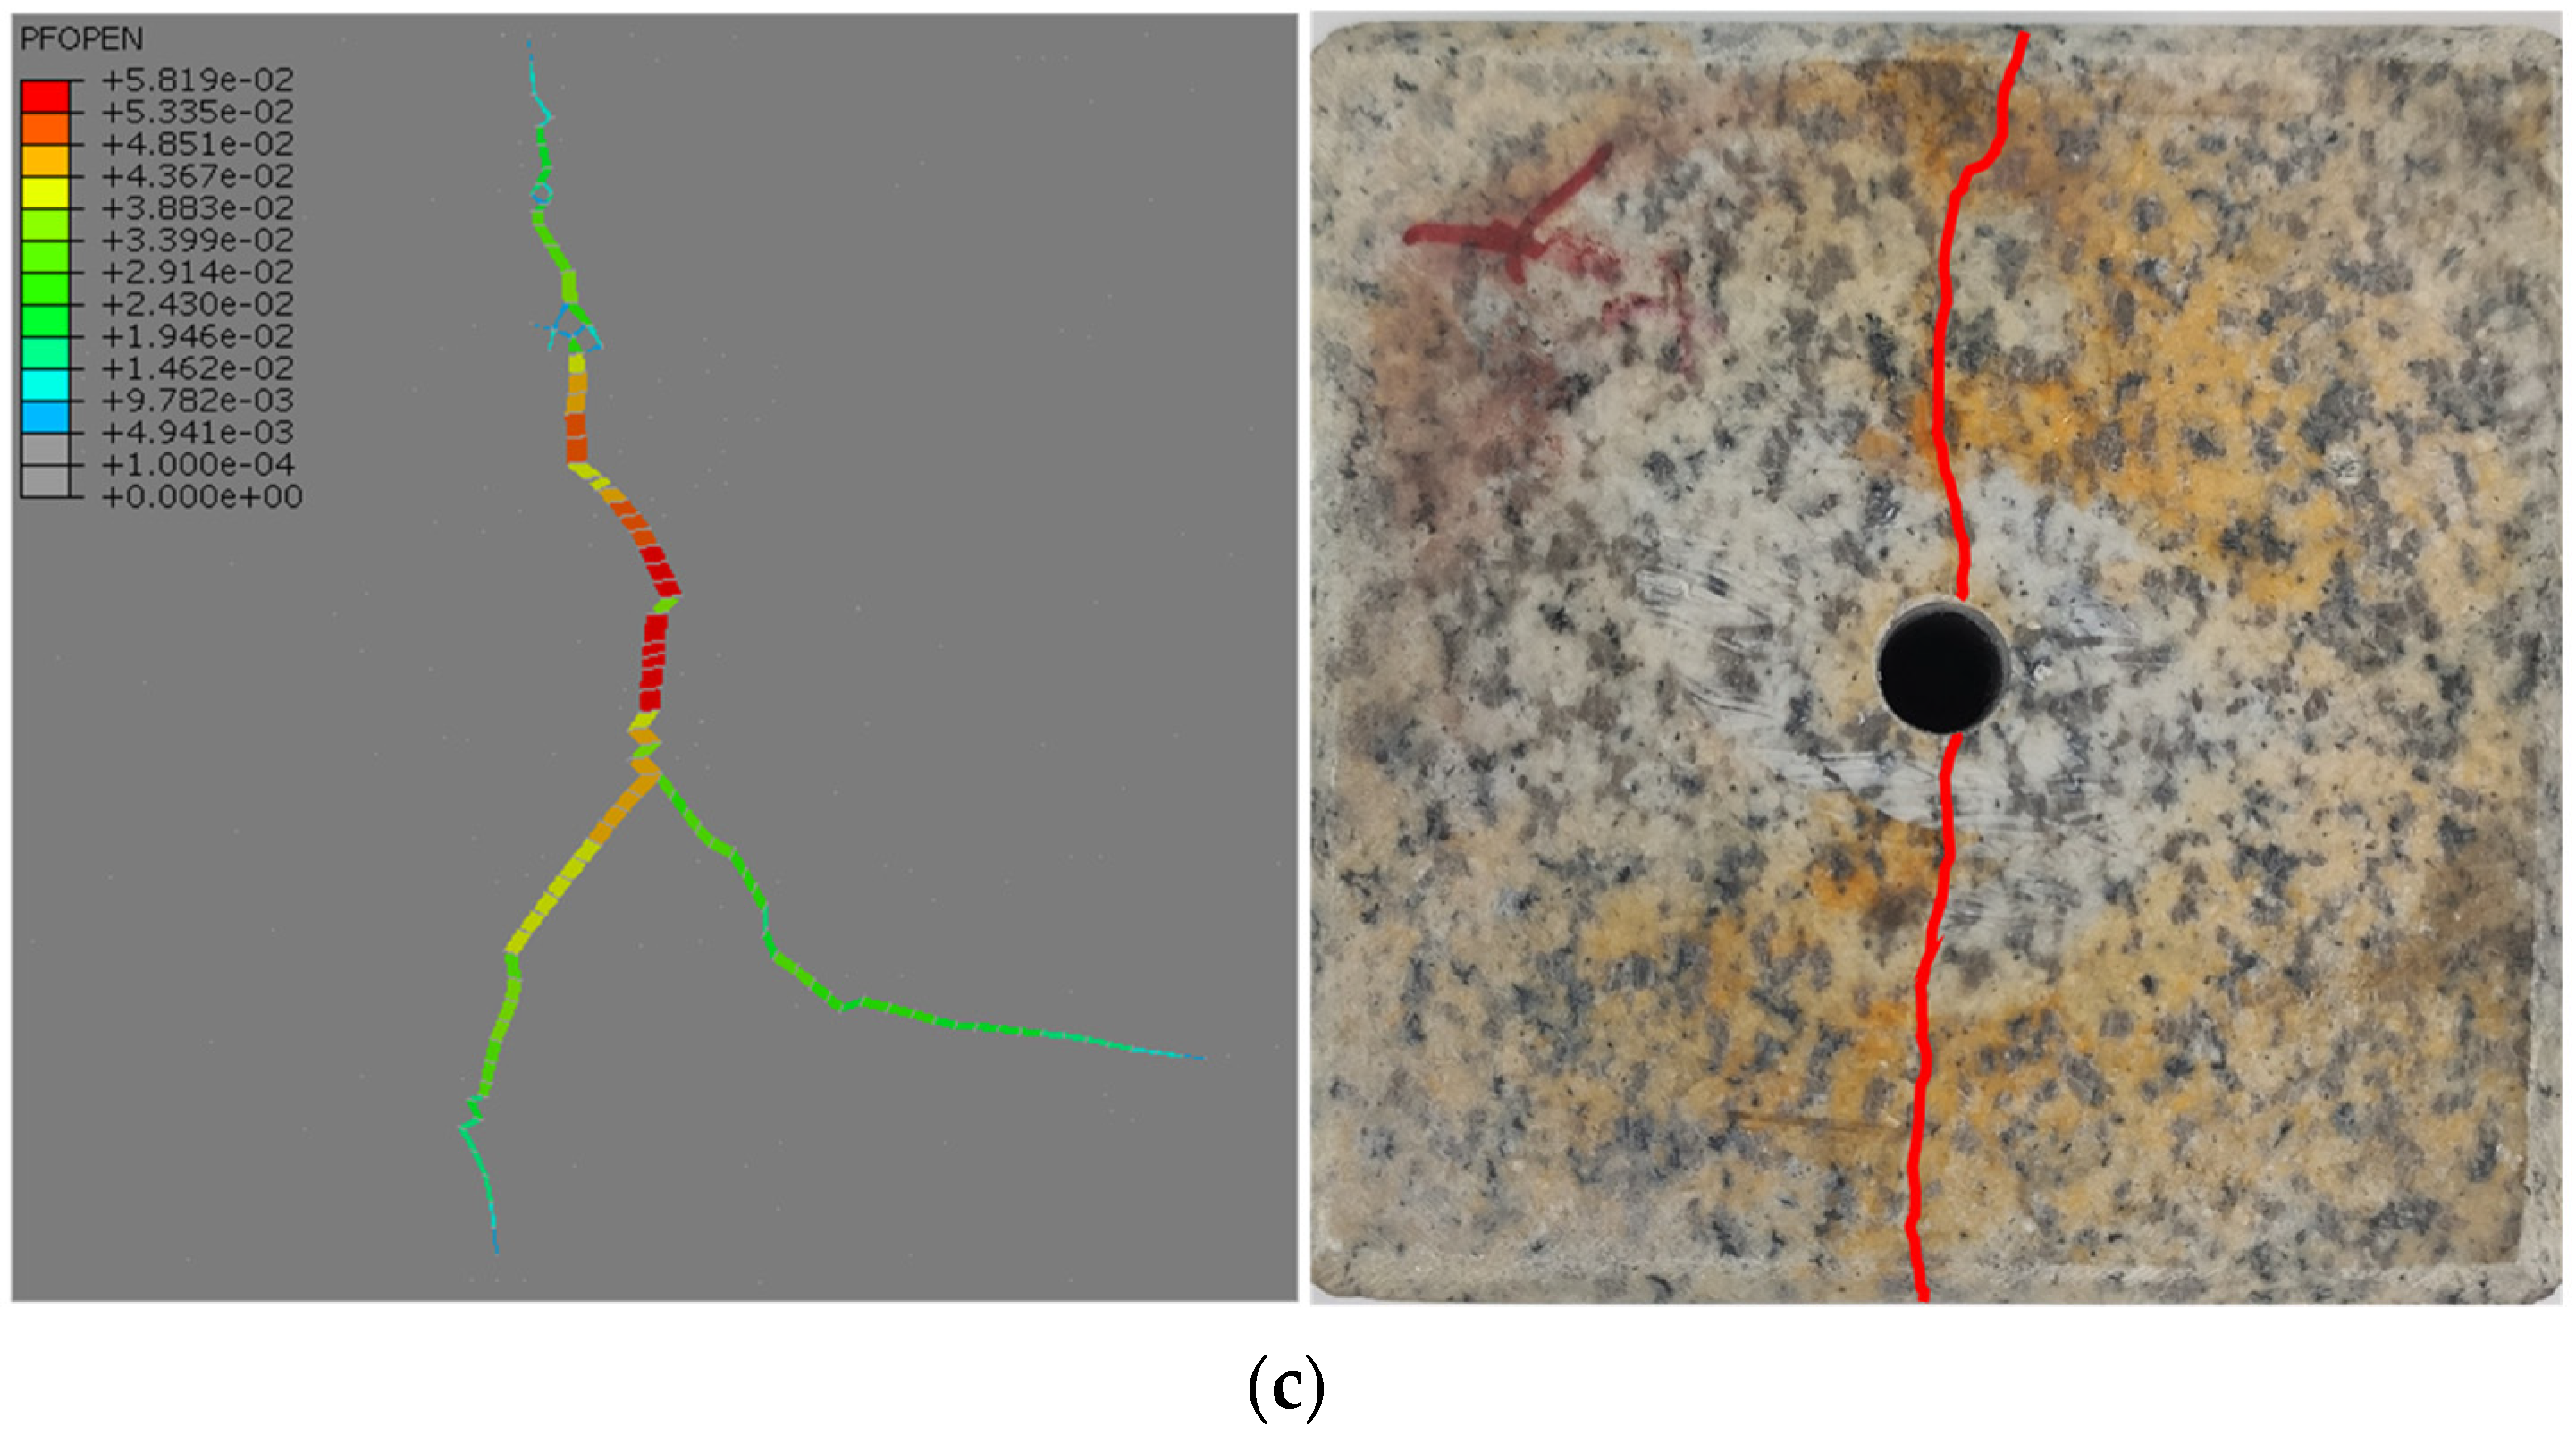
3.2. Macroscopic Fracture Morphology

It can be seen from Figure 5 that the bi-wing cracks of the sample extend in the direction of the maximum horizontal principal stress, which is consistent with the previous research results [46]. When the HSD is 0 MPa, the macro-cracks of HF1, HF4 and HF7 mainly display serrated, and its tortuosity is more obvious with the increase of IR. Moreover, when the maximum and minimum horizontal principal stresses are nearly equal, the distribution of mineral crystals plays a dominant role in fracture propagation [10]. From the sketch of crack lines, the crack propagation path is different under different IR. At lower IR, cracks can directly break biotite crystals to make transgranular fractures; but at higher IR, the cracks usually generate intergranular fractures along the edge of biotite crystals. Under the condition of HSD of 3 MPa, with the increase of IR, the tendency of hydraulic fractures to deflect along the direction of the maximum horizontal principal stress becomes more obvious; especially at 100 mL/min, the cracks expand approximately linearly. This indicates that the increase in IR exacerbates the deflection of the fracture, making it more susceptible to the in-situ stress field. At the same time, the hydraulic energy under high IR is large, and the fracture tip of the main fracture can directly pass through when it is close to natural fractures or bulk mineral particles. With the HSD increasing to 6 MPa, the vertical fractures along the wellbore direction are more tortuous, but the effect of increasing IR on fracture morphology is not obvious. Thus, when the HSD is large, the dominant factor controlling the fracture morphology is HSD, rather than IR.

4. Numerical Simulation of HF and Its Extension to GF

4.1. Basic Principle and Model Setup

4.1.1. Brief Introduction of Cohesive Element

Cohesive element, which existed in ABAQUS, has sufficient reliability for the simulation of the progressive failure process by fluid-solid coupling [47,48]. The cohesive element neither represents any material type nor has material properties, but it can resist the tensile stress at the tip of the crack, and the element fails and degrades when the ultimate strength is reached, which can simulate crack generation and expansion [26]. It is worth noting that cohesive elements must be embedded between elements during meshing (Figure 6a), and cracks can only propagate on cohesive elements. Therefore, the mesh configuration will affect the fidelity of the simulation results.
The modelling essence of HF is to define the bilinear constitutive model of the cohesive element (Figure 6b) and the rock matrix parameters. In this constitutive model, T1 represents the ultimate bearing capacity of the cohesive element, the corresponding separation displacement is δ1, and the fracture occurs when this failure displacement is δ2.
The maximum nominal stress criterion can be used to define the initial damage criterion of the cohesive element as follows:
max { t n t n 0 , t s t s 0 , t t t t 0 } = 1
where t n 0 , t s 0 , t t 0 are the ultimate strengths of type I, type II, and type III failures, respectively; when the ratio of fluid pressure to the failure strength reaches 1, the damage evolution of the element begins. With the degradation of the cohesive element, the fluid starts to move in the element with a laminar flow, obeying the law of mass conservation [22], wherein the fluid is defaulted to incompressible in ABAQUS. The failure effect of different fracturing media can be simulated by changing the fluid properties (e.g., viscosity and specific gravity) at the same IRs. Furthermore, the fluids’ analysis mode mainly considers tangential and normal flow. The tangential flow is along the direction of the cohesive element, and the flow rate follows Equation (2):
q = w 3 12 μ p 0
where q is the flow rate, w is the crack width, μ is Poisson’s ratio, and p0 is the net fluid pressure. The normal flow is filtrated into the rock matrix that is connected by the upper and lower surfaces of a cohesive element, respectively, as shown in (3):
{ q Upper   surface = C Up ( p f p Up ) q Lower   surface = C Lower ( p f p Lower )
where qUpper surface and qLower surface respectively represent the fluid leakage velocity on the upper and lower surfaces of a cohesive element, CUp, and CLower, respectively, represent the filtration coefficient in Carter’s filtration model, pf is the pressure of fracturing fluid. pUp and pLower are the net fluid pressure on the upper and lower surfaces of a cohesive element, respectively.

4.1.2. Simulation Model Setup and Parameter Input

It is assumed that the mineralogical composition of granite is isotropic, homogeneous, and porous elastic [49]. According to the size of the rock sample in Section 2, a 2D square model with a side length of 100 mm was established, a fractured well was arranged in the geometric centre of the model, and the model boundary displacement is also restricted (Figure 7). Considering the calculation time and simulation accuracy, setting the mesh element length to 2 mm is reasonable. Cohesive elements are globally embedded between the meshes, with a total of 6260 elements. The specific parameters of the model are based on the relevant measurement data of granite samples, as shown in Table 3.

4.2. Comparison between Experiments and Simulations of HF

Figure 8 illustrates the simulation and test results of HF under different HSD when the IR was 10 mL/min. When the HSD was 0 MPa, the HF model showed 3 main fractures, which branched from the vicinity of the fractured well to expand in three directions (Figure 8a). It was a certain difference between the simulation results and the test results, which may be because when HSD is 0 MPa, the distribution of mineral crystals is a dominant factor in affecting the fracture direction [50], while the numerical model in this study ignores the influence of mineral distribution.
When the HSD was increased to 3 MPa, the simulation and experimental results presented consistency. The cracks were deflected in the direction of the maximum horizontal principal stress, and branch cracks appeared near the rock boundary (Figure 8b). Moreover, at the far position from the wellbore, the numerically simulated fracture length decreased when the HSD was further increased to 6 MPa (Figure 8c). Therefore, when the IR was low, with the increase of HSD, the fracture network complexity of HF has a certain reduction, but the deflection trend of the fracture, along the direction of the maximum horizontal principal stress, became more obvious.
After increasing the IR to 60 mL/min, the simulation results and test results are shown in Figure 9; it is clearly seen that the numerical simulation produced 2 main fractures, accompanying a slender branch fracture when the HSD was 0 MPa (Figure 9a), and the fracture network morphology is almost consistent with the laboratory test results. Under the same HSD, compared with the IR of 10 mL/min, increasing the IR effectively improves the complexity of the fracture network. When the HSD was 3 MPa, both the numerical simulation and the laboratory test produced bi-wing cracks, which deflected in the direction of the maximum horizontal principal stress, and the crack width at the far position from the wellbore was increased (Figure 9b). As the HSD increased to 6 MPa, the numerical simulation produced 2 main fractures and 1 slender branch fracture (Figure 9c). At this time, the expansion morphology of fractures matches the experimental results, at the peripheral wellbore; but the simulation results become inconsistent with the experimental results with the generation of secondary fractures.
In general, at IR of 60 mL/min, the crack propagation trend of the HF numerical model is generally consistent with the experimental results, except in the case of HSD = 6 MPa. This may be because the mineral distribution of granite is heterogeneous, and its mechanical property is different. The crack propagation obeys the principle of minimum energy dissipation [51], different minerals require different energy to destroy, which makes the crack expands in the direction most prone to crack initiation; but the numerical model has been established based on the assumption that the granite is isotropic and homogeneous, ignored the influence of different mineral particles, which may cause distinguishment from the laboratory test results.

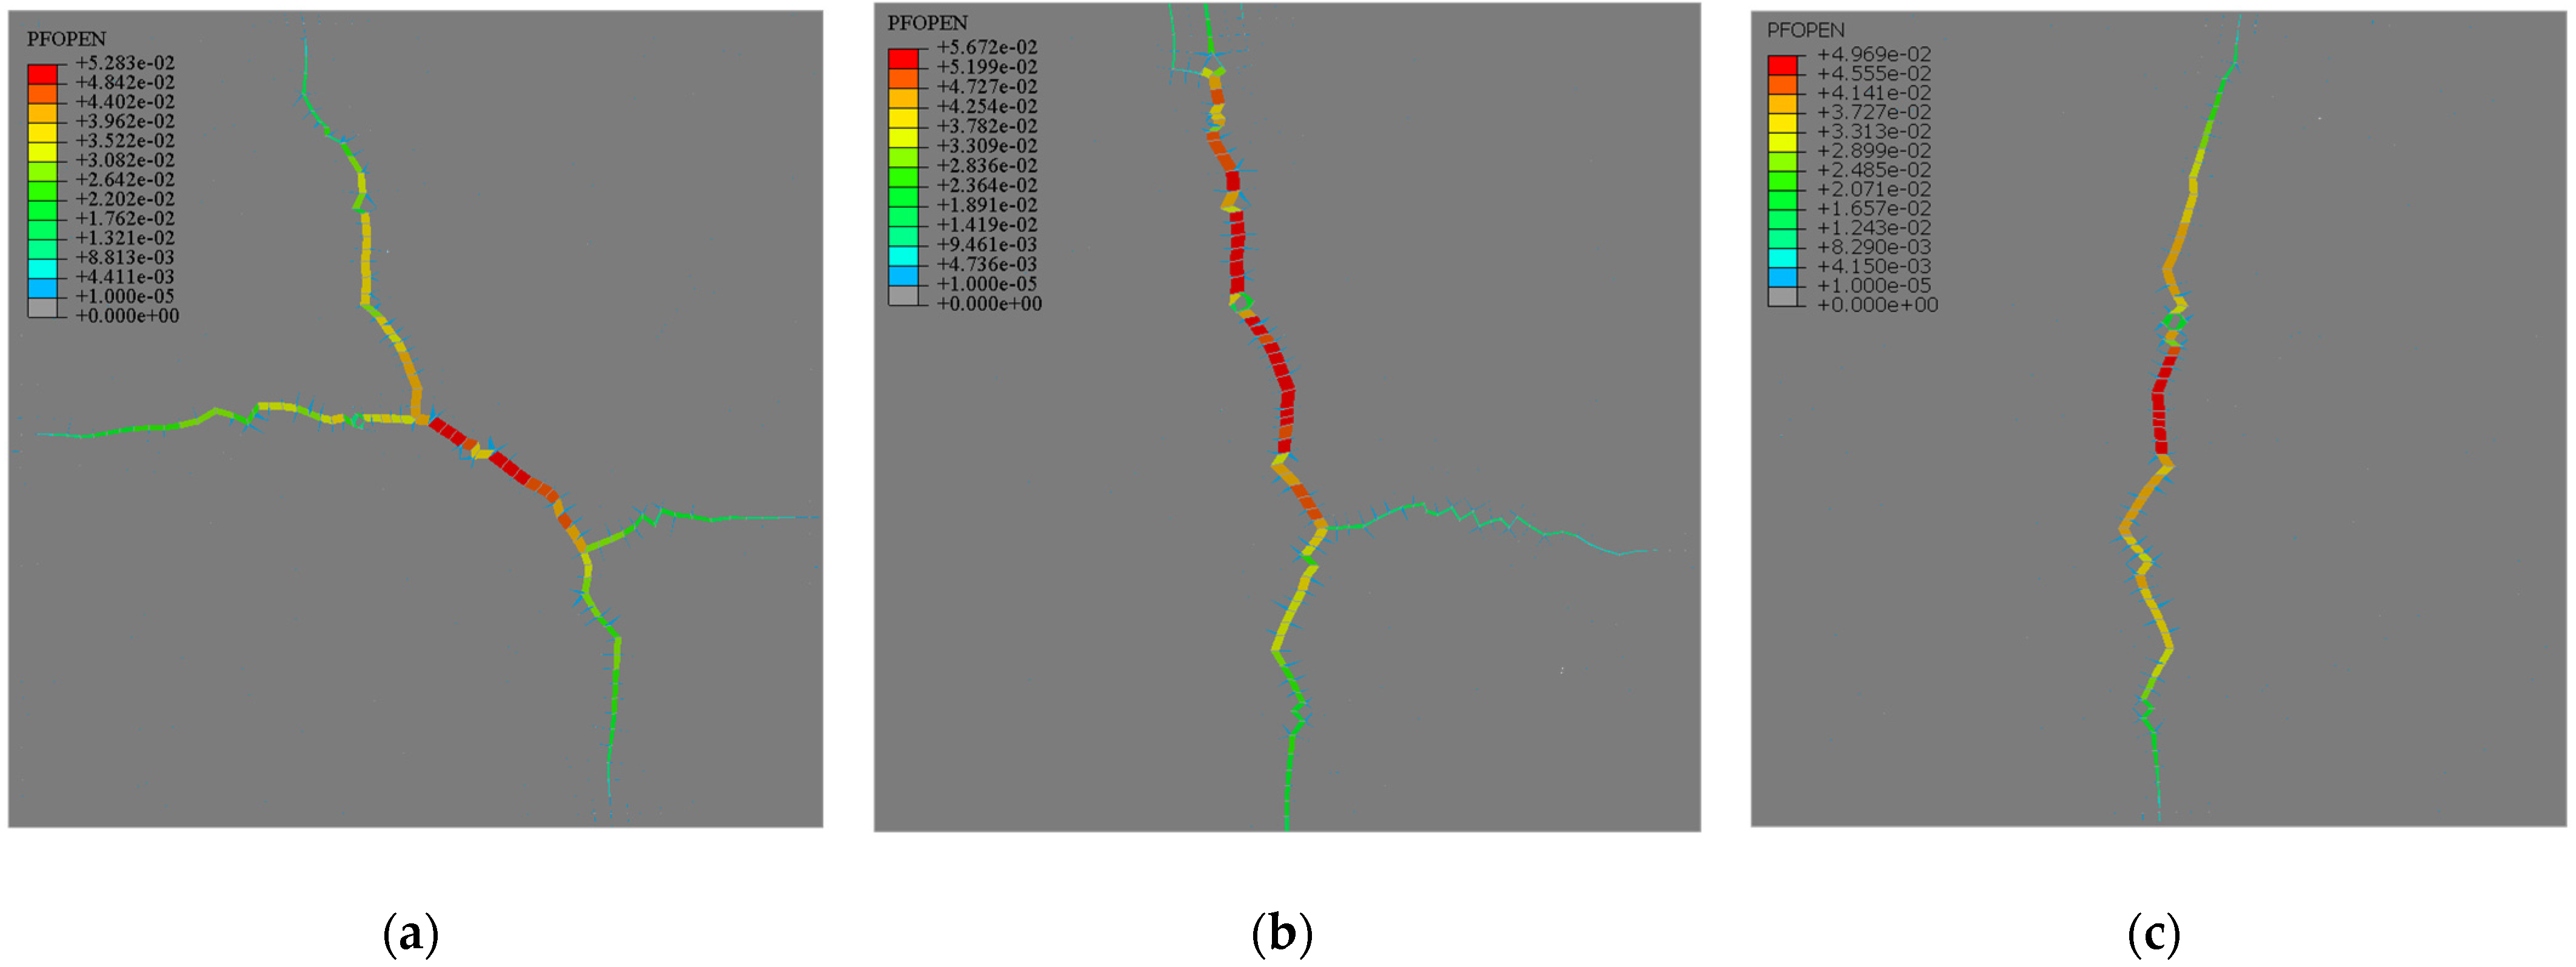
4.3. Simulation of True-Triaxial GF

As a novel technology, GF is worth to be explored. Based on the above model, variable parameters such as fracturing fluid viscosity, permeability, and specific gravity were changed; meanwhile, a GF simulation with the same conditions as the HF test was constructed. The simulation results of GF at 10 mL/min IR are shown in Figure 10. It can be seen that the crack propagation trend of GF is similar to that of HF, and symmetrical bi-wing cracks are generated under any geostresses.
Set the HSD to 0 MPa (Figure 10a), the GF formed a through bi-wing crack, and the crack on one side showed a zigzag expansion trend. At this time, the maximum crack width reached 4.969 × 10⁻² mm, which was 62.65% larger than that of HF under the same conditions. However, when the HSD increased to 3 MPa (Figure 10b), the maximum crack width of GF was 3.016 × 10⁻² mm, which was 24.50% lower than that of HF; with the HSD continued to increase to 6 MPa (Figure 10c), The maximum crack width of GF was 2.941 × 10⁻² mm, which was 24.17% lower than that of HF.
This may be because, in a higher HSD situation, high-viscosity water-based fracturing fluids can accumulate more energy near the wellbore [31,52,53], making HF easier to generate wide fractures. However, HF’s advantage will weaken as the propagation path of fracturing fluid expands. In addition, under the condition of HSD of 6 MPa, the fracture length of GF became longer, and two finely branch fractures were generated near the wellbore, making the fracture network complexity higher than that of HSD of 0 MPa or 3 MPa. This may be because the gas has higher diffusivity than water, GF can diffuse farther under the action of high pressure [54], thereby increasing the length of the fracture.
Figure 11 shows the GF results, wherein the IR of GF was increased to 60 mL/min under each HSD. It can be seen that the maximum crack width of GF was 5.283 × 10⁻² mm when the HSD is 0 MPa, which is slightly smaller than 5.733 × 10⁻² mm of HF. However, GF produced four main cracks extending in four different directions, and the complexity of the fracture network is higher than that of HF. Increasing the IR can additionally utilise the advantages of the gas fracturing medium (i.e., low viscosity and high diffusivity), making the high-energy nitrogen fully penetrate into the micro-cracks of the rock mass, thereby generating a wider damage area.
When the HSD was 3 MPa, the maximum crack width of GF was 5.672 × 10⁻² mm, which is 22.90% higher than that of HF. Moreover, the crack network of GF also showed a high complexity and produced several secondary fractures at the fracture tip. However, when the HSD was 6 MPa, secondary cracks were rare in GF, and the crack width decreased as well. Therefore, the GF technology in a high HSD situation still needs to be further explored.
In summary, under the HSD of 0 MPa, 3 MPa, and 6 MPa, as the IR increased from 10 mL/min to 60 mL/min, the maximum fracture width of both GF and HF techniques was increased to a certain extent, and the increased amplitude of HF were 87.66%, 44.90%, and 50.05%, respectively, corresponding to 6.32%, 88.06%, and 68.96% of GF, respectively. Obviously, the crack width of HF under low HSD is significantly affected by IR. In addition, under high HSD, increased the IR of GF could greatly increase the crack width. This may be because, driven by high IR, low-viscosity nitrogen can sufficiently act on the natural pores of the rock in a short period, effectively expanding the width of the fractures, and even more secondary fractures were easily generated. Whereas, in the condition with a small HSD, using a water-based fracturing fluid with a higher viscosity meanwhile increasing the IR can greatly increase the fracture width. Thus, it is appropriate to select the fracturing technology based on the in-situ reservoir geomechanical environment.

5. Application of HF and GF Numerical Method in Engineering Scale

5.1. Model Setup of In-Situ Engineering

Based on the measured data of field engineering, this chapter respectively established engineering-scale numerical models of GF and HF to deeply explore the differences between the two technologies in EGS engineering. Meanwhile, the two core parameters of fracturing cluster spacing and IR are selected to research the reservoir stimulation’s outcome, involving fracture width and fracture network morphology. The model is a stratigraphic profile along the normal direction of the horizon, which is divided into three parts: caprock (40 m), reservoir (20 m), and bottom layer (40 m) from top to bottom. The horizontal well is set at the centre of the reservoir, and the caprock and bottom layer adopted a sparse mesh configuration to improve the calculation rate.
The total number of elements is 137,550, wherein the number of the embedded cohesive element is 75,506, and the mesh form is shown in Figure 12. According to the geological environment of the deep in-situ geothermal reservoir, the rock mass and fluid parameters are defined and shown in Table 4. In this project, nitrogen with stable properties and low cost is selected as the fracturing medium of GF. The fracturing cluster numbered 1–6 from left to right is arranged in a cluster network, and the perforation length is 0.4 m. The cluster spacing and IR are adjusted according to the corresponding simulation scheme.

5.2. Results of HF and GF under Different Cluster Spacing

According to the in-situ engineering parameters, the IR is set to 18 m3/min; the single variable is the fracturing cluster spacing, which is set as 18 m, 14 m, 10 m, and 6 m to explore its effect on HF and GF. It can be seen from Figure 13 that both HF and GF can generate visible cracks in a high-stress environment, and the crack tip will be deflected to different degrees under different geostress.
When the fracturing cluster spacing was 18 m (Figure 13a), the overlong cluster spacing led to insufficient stimulation at inter-cluster reservoirs between HF and GF, only HF produced a connected fracture at the edge of the reservoir. When the fracturing cluster spacing of 14 m was adopted (Figure 13b), the maximum fracture width generated by HF was increased from 1.720 cm at 18 m spacing to 2.012 cm, and the corresponding maximum fracture width was increased from 1.694 cm to 1.908 cm. At this time, the GF and HF fractures were distinctly deflected under the action of geostress, and the HF produced large contiguous cracks between the No. 2 and No. 3 fracturing clusters. As the fracturing cluster spacing was further reduced to 10 m (Figure 13c), compared with the 14 m spacing, the maximum fracture widths of HF and GF were increased by 1.84% and 28.77%, respectively.
Meanwhile, HF and GF produced a complex fracture network that overlapped each other, and the fracture morphology of the No. 1 and No. 2 fracturing clusters by HF was more torturous. When the fracturing cluster spacing was reduced to 6 m (Figure 13d), the maximum fracture widths generated by HF and GF were increased to 2.232 cm and 2.881 cm, respectively. Although the inter-cluster fractures of HF were denser, the undersized cluster spacing limits its production area; this is fundamentally consistent with previous research [55]. However, compared with HF, GF can generate fractures that gradually extend to the far position from the horizontal well to expand the stimulation range effectively.
In general, for the four different fracturing cluster spacings, the fracture widths generated by HF at the near-well position were all larger than those of GF, which confirms that high-viscosity fracturing fluids can accumulate more energy at the fractured well periphery, thereby widening the fracture width. However, at the distant reservoir, as the transmission distance of fracturing fluid increased, the fracture width of HF gradually became smaller than that of GF. When this flow distance is long enough, it is difficult for high-viscosity water-based fracturing to penetrate the distant stratum, and the high-pressure fluid is only limited to the vicinity of the fracturing cluster. By contrast, due to the extremely low viscosity, the high-energy gas being less affected by the flow distance, GF can diffuse to the area farther from the horizontal well more easily. Therefore, GF can also maintain a large fracture width at the distant reservoir. In general, to improve the fracture network complexity, HF technology with a shorter cluster spacing can be used. Furthermore, to increase the fracture width and the fracture length, it is better to adapt the GF technology at shorter cluster spacing.

5.3. Results of HF and GF under Different IRs

To compare the influence of IR on the fracture network morphology of HF and GF, referred to in Section 5.2, the cluster spacing with the optimal reservoir stimulation effect was selected, i.e., 10 m spacing. Four IRs of 6 m3/min, 12 m3/min, 18 m3/min, and 24 m3/min were separately used to build the model. When the IR is 6 m3/min (Figure 14a), the fractures of HF were deflected but not connected, while the GF’s fractures were explicitly overlapped. In particular, wide fractures were found between the No. 3 and No. 4 fracturing clusters, and the fracture network was more complex. As IR increased to 12 m3/min (Figure 14b), the width of maximum fracture produced by HF increased from 1.999 cm to 2.014 cm, and the fracture length also increased; however, HF is still hard to generate an obvious interconnected network. Under the action of geostress, the net pressure of the fractures between No. 3, 4, and 5 fracturing clusters were changed, and the complex fracture network began to appear, while the maximum fracture width of GF only increased from 2.407 cm to 2.433 cm, with an increased ratio of 1.08%. The IR was set as 18 m3/min (Figure 14c), and the maximum crack widths produced by HF and GF increased to 2.049 cm and 2.457 cm, respectively. At this time, the fracture network complexity of HF was further increased, in which the obvious branch fractures appeared in the No. 2 cluster, and the inter-cluster reservoir was fully stimulated, but the GF fracture network morphology was basically the same as that of the low IR. As the IR furtherly increased to 24 m3/min (Figure 14d), the complexity of the fracture network of HF decreased, and the overlapping tendency of main fractures was weakened; at the same time, the branch fracture of No. 2 cluster disappeared, and the maximum fracture width was 2.172 cm. It is noted that higher IR still did not significantly change GF’s fracture network morphology, but GF’s maximum fracture width was increased by 6.96% compared with IR of 18 m3/min. In conclusion, HF is more sensitive to IR than GF at in-situ reservoirs. Moreover, in these four IRs, there is a certain threshold in the range of 18–24 m3/min, which perhaps makes the fracture network of HF more complex. However, the effect of IR on the fracture network morphology of GF is very weak, but increasing IR can significantly widen the fractures, which contributes to increasing the area of the fracture network to improve recovery efficiency.

6. Conclusions

In this paper, HF experiments under true triaxial were carried out on granite, and the combined effects of HSD and IR for failure behaviour were analysed. The numerical models consistent with the experimental conditions were established, the differences in random fracture propagation behaviour between HF and GF were compared. In engineering scale, the effects of fracturing cluster spacing and IR on HF and GF were contrasted. The results of this study are summarised as follows:
(1)
The BP and fracture morphology of HF are affected by the combined action of HSD and IR. With the increase of IR, BPs of granite show an opposite change trend under low HSD and high HSD, respectively. Moreover, hydraulic fractures tend to expand towards the direction of maximum horizontal principal stress, especially when HSD and IR are high.
(2)
The maximum crack width and crack network complexity of HF and GF can be increased by increasing IR, but the increment is affected by HSD. At the area farther from the horizontal well, the fracture width of GF is larger than that of HF under the same conditions. Used gas as the fracturing medium has high diffusivity, which can stimulate the stratum even at a distant location from the fractured well.
(3)
In an in-situ reservoir, with the narrowing of the fracturing cluster spacing, GF can produce wider and longer fractures, while HF easily produces a complex fracture network morphology in the fractured well periphery. Increasing the IR of HF can improve the crack complexity, especially at the inter-clusters, but the crack complexity of GF is hardly affected by IR.

Author Contributions

Conceptualization, N.L. and C.L.; methodology and supervision, H.X. and C.L.; experiment and data analysis, N.L. and Z.G.; software, N.L. and Z.G.; writing—original draft preparation, N.L. and Z.G.; funding acquisition, H.X. and C.L. All authors have read and agreed to the published version of the manuscript.

Funding

This study was funded by National Natural Science Funding of China (No. U22A20166, No. 12172230, No. U2013603 and No. 52192625), Department of Science and Technology of Guangdong Province (No. 2019ZT08G315) and DOE Laboratory of Deep Earth Science and Engineering (No. DESE202102).

Institutional Review Board Statement

Not applicable.

Informed Consent Statement

Not applicable.

Data Availability Statement

The study did not report any data.

Conflicts of Interest

The authors declare that there are no conflicts of interest regarding the publication of this article.

References

  1. Xie, H.; Li, C.; Zhou, T.; Chen, J.; Liao, J.; Ma, J.; Li, B. Conceptualization and evaluation of the exploration and utilization of low/medium-temperature geothermal energy: A case study of the Guangdong-Hong Kong-Macao Greater Bay Area. Geophys. Geo-Energy Geo-Resour. 2020, 6, 1–22. [Google Scholar] [CrossRef]
  2. Kumari, W.G.P.; Ranjith, P.G. Sustainable development of enhanced geothermal systems based on geotechnical research–A review. Earth Sci. Rev. 2019, 199, 102955. [Google Scholar] [CrossRef]
  3. Zhao, Y.; Shu, L.; Chen, S.; Zhao, J.; Guo, L. Optimization Design of Multi-Factor Combination for Power Generation from an Enhanced Geothermal System by Sensitivity Analysis and Orthogonal Test at Qiabuqia Geothermal Area. Sustainability 2022, 14, 7001. [Google Scholar] [CrossRef]
  4. Xie, H.; Gao, F.; Xie, L.; Yang, Y.; Ju, Y.; Wang, J. Novel idea of the theory and application of 3D volume fracturing for stimulation of shale gas reservoirs. Chin. Sci. Bull. 2015, 61, 36–46. [Google Scholar]
  5. Schill, E.; Genter, A.; Cuenot, N.; Kohl, T. Hydraulic performance history at the Soultz EGS reservoirs from stimulation and long-term circulation tests. Geothermics 2017, 70, 110–124. [Google Scholar] [CrossRef]
  6. Lu, S.M. A global review of enhanced geothermal system (EGS). Renew. Sustain. Energy Rev. 2017, 81, 2902–2921. [Google Scholar] [CrossRef]
  7. AbuAisha, M.; Loret, B.; Eaton, D. Enhanced Geothermal Systems (EGS): Hydraulic fracturing in a thermo-poroelastic framework. J. Petrol. Sci. Eng. 2016, 146, 1179–1191. [Google Scholar] [CrossRef]
  8. Zang, A.; Stephansson, O. Special Issue “Hydraulic Fracturing in Hard Rock”. Rock Mech. Rock Eng. 2019, 52, 471–473. [Google Scholar] [CrossRef]
  9. Li, N.; Xie, H.; Hu, J.; Li, C. A critical review of the experimental and theoretical research on cyclic hydraulic fracturing for geothermal reservoir stimulation. Geophys. Geo-Energy Geo-Resour. 2021, 8, 1–19. [Google Scholar] [CrossRef]
  10. Cong, Z.; Li, Y.; Tang, J.; Martyushev, D.A.; Hubuqin; Yang, F. Numerical simulation of hydraulic fracture height layer-through propagation based on three-dimensional lattice method. Eng. Fract. Mech. 2022, 264, 108331. [Google Scholar] [CrossRef]
  11. Xie, J.; Tang, J.; Yong, R.; Fan, Y.; Zuo, L.; Chen, X.; Li, Y. A 3-D hydraulic fracture propagation model applied for shale gas reservoirs with multiple bedding planes. Eng. Fract. Mech. 2020, 228, 106872. [Google Scholar] [CrossRef]
  12. Zhao, X.; Jin, F.; Liu, X.; Zhang, Z.; Cong, Z.; Li, Z.; Tang, J. Numerical study of fracture dynamics in different shale fabric facies by integrating machine learning and 3-D lattice method: A case from Cangdong Sag, Bohai Bay basin, China. J. Petrol. Sci. Eng. 2022, 218, 110861. [Google Scholar] [CrossRef]
  13. Solberg, P.; Lockner, D.; Byerlee, J.D. Hydraulic fracturing in granite under geothermal conditions. Int. J. Rock Mech. Min. Sci. Geomech. Abs. 1980, 17, 25–33. [Google Scholar] [CrossRef]
  14. Song, M.; Li, Q.; Hu, Q.; Wu, Y.; Ni, G.; Xu, Y.; Zhang, Y.; Hu, L.; Shi, J.; Liu, J.; et al. Resistivity response of coal under hydraulic fracturing with different injection rates: A laboratory study. Int. J. Min. Sci. Technol. 2022, 34, 807–819. [Google Scholar] [CrossRef]
  15. Cheng, Y.; Zhang, Y.; Yu, Z.; Hu, Z.; Yang, Y. An investigation on hydraulic fracturing characteristics in granite geothermal reservoir. Eng. Fract. Mech. 2020, 237, 107252. [Google Scholar] [CrossRef]
  16. Cheng, Y.; Zhang, Y.; Yu, Z.; Hu, Z.; Ma, Y.; Yang, Y. Experimental and numerical studies on hydraulic fracturing characteristics with different injection flow rates in granite geothermal reservoir. Energy Sci. Eng. 2020, 9, 142–168. [Google Scholar] [CrossRef]
  17. Zhuang, L.; Kim, K.Y.; Jung, S.G.; Diaz, M.; Min, K.-B. Effect of Water Infiltration, Injection Rate and Anisotropy on Hydraulic Fracturing Behaviour of Granite. Rock Mech. Rock Eng. 2018, 52, 575–589. [Google Scholar] [CrossRef] [Green Version]
  18. Shi, X.; Huang, W.; Zhang, Y.; Mou, C.; Guo, T.; Jiang, S. Experimental study on hydraulic fracture propagation behaviour on dolomite rocks with open-hole completion. J. Petrol. Sci. Eng. 2022, 218, 110840. [Google Scholar] [CrossRef]
  19. Xu, T.; Zhang, Y.; Yu, Z.; Hu, Z.; Guo, L. Laboratory study of hydraulic fracturing on hot dry rock. Sci. Technol. Rev. 2015, 33, 35–39. [Google Scholar]
  20. Zhou, Z.; Jin, Y.; Zeng, Y.; Zhang, X.; Zhou, J.; Zhuang, L.; Xin, S. Investigation on fracture creation in hot dry rock geothermal formations of China during hydraulic fracturing. Renew. Energy 2020, 153, 301–313. [Google Scholar] [CrossRef]
  21. Liu, Z.; Ren, X.; Lin, X.; Lian, H.; Yang, L.; Yang, J. Effects of Confining Stresses, Pre-crack Inclination Angles and Injection Rates: Observations from Large-Scale True Triaxial and Hydraulic Fracturing Tests in Laboratory. Rock Mech. Rock Eng. 2019, 53, 1991–2000. [Google Scholar] [CrossRef]
  22. Franco, A.; Vaccaro, M. Numerical simulation of geothermal reservoirs for the sustainable design of energy plants: A review. Renew. Sustain. Energy Rev. 2014, 30, 987–1002. [Google Scholar] [CrossRef]
  23. Guo, L.-L.; Zhang, Y.-B.; Zhang, Y.-J.; Yu, Z.-W.; Zhang, J.-N. Experimental investigation of granite properties under different temperatures and pressures and numerical analysis of damage effect in enhanced geothermal system. Renew. Energy 2018, 126, 107–125. [Google Scholar] [CrossRef]
  24. Hu, J.; Xie, H.; Sun, Q.; Li, C.; Liu, G. Changes in the thermodynamic properties of alkaline granite after cyclic quenching following high temperature action. Int. J. Min. Sci. Technol. 2021, 31, 843–852. [Google Scholar] [CrossRef]
  25. Pavlova, P.L.; Minakov, A.V.; Platonov, D.V.; Zhigarev, V.A.; Guzei, D.V. Supercritical Fluid Application in the Oil and Gas Industry: A Comprehensive Review. Sustainability 2022, 14, 698. [Google Scholar] [CrossRef]
  26. Chen, Z. Finite element modelling of viscosity-dominated hydraulic fractures. J. Petrol. Sci. Eng. 2012, 88, 136–144. [Google Scholar] [CrossRef]
  27. Liao, J.; Cao, C.; Hou, Z.; Mehmood, F.; Feng, W.; Yue, Y.; Liu, H. Field scale numerical modeling of heat extraction in geothermal reservoir based on fracture network creation with supercritical CO2 as working fluid. Environ. Earth Sci. 2020, 79, 1–22. [Google Scholar] [CrossRef]
  28. Hou, P.; Liang, X.; Gao, F.; Dong, J.; He, J.; Xue, Y. Quantitative visualization and characteristics of gas flow in 3D pore-fracture system of tight rock based on Lattice Boltzmann simulation. J. Nat. Gas Sci. Eng. 2021, 89, 103867. [Google Scholar] [CrossRef]
  29. Guo, T.; Gong, F.; Wang, X.; Lin, Q.; Qu, Z.; Zhang, W. Performance of enhanced geothermal system (EGS) in fractured geothermal reservoirs with CO2 as working fluid. Appl. Therm. Eng. 2019, 152, 215–230. [Google Scholar] [CrossRef]
  30. Li, J.; Yuan, W.; Zhang, Y.; Cherubini, C.; Scheuermann, A.; Galindo Torres, S.A.; Li, L. Numerical investigations of CO2 and N2 miscible flow as the working fluid in enhanced geothermal systems. Energy 2020, 206, 118062. [Google Scholar] [CrossRef]
  31. Zhang, B.; Li, X.; Zhang, Z.; Wu, Y.; Wu, Y.; Wang, Y. Numerical Investigation of Influence of In Situ Stress Ratio, Injection Rate and Fluid Viscosity on Hydraulic Fracture Propagation Using a Distinct Element Approach. Energies 2016, 9, 140. [Google Scholar] [CrossRef] [Green Version]
  32. Cheng, W.; Jiang, G.-S.; Xie, J.-Y.; Wei, Z.-J.; Zhou, Z.-D.; Li, X.-D. A simulation study comparing the Texas two-step and the multistage consecutive fracturing method. Petrol. Sci. 2019, 16, 1121–1133. [Google Scholar] [CrossRef]
  33. Zhang, F.; Wang, X.; Tang, M.; Du, X.; Xu, C.; Tang, J.; Damjanac, B. Numerical Investigation on Hydraulic Fracturing of Extreme Limited Entry Perforating in Plug-and-Perforation Completion of Shale Oil Reservoir in Changqing Oilfield, China. Rock Mech. Rock Eng. 2021, 54, 2925–2941. [Google Scholar] [CrossRef]
  34. Aliyu, M.D.; Archer, R.A. Numerical simulation of multifracture HDR geothermal reservoirs. Renew. Energy 2021, 164, 541–555. [Google Scholar] [CrossRef]
  35. Yao, J.; Zhang, X.; Sun, Z.; Huang, Z.; Liu, J.; Li, Y.; Xin, Y.; Yan, X.; Liu, W. Numerical simulation of the heat extraction in 3D-EGS with thermal-hydraulic-mechanical coupling method based on discrete fractures model. Geothermics 2018, 74, 19–34. [Google Scholar] [CrossRef]
  36. Liu, G.; Wang, G.; Zhao, Z.; Ma, F. A new well pattern of cluster-layout for deep geothermal reservoirs: Case study from the Dezhou geothermal field, China. Renew. Energy 2020, 155, 484–499. [Google Scholar] [CrossRef]
  37. Fairhurst, C.; Hudson, J.A. Draft ISRM suggested method for the complete stress-strain curve for intact rock in uniaxial compression. Int. J. Rock Mech. Min. 1999, 36, 279–289. [Google Scholar]
  38. Lu, J.; Yin, G.; Zhang, D.; Li, X.; Huang, G.; Gao, H. Mechanical properties and failure mode of sandstone specimen with a prefabricated borehole under true triaxial stress condition. Geomech. Energy Environ. 2021, 25, 10027. [Google Scholar] [CrossRef]
  39. Yu, B.; Liu, C.; Chen, W.; Lu, J.; Liu, Y. Experimental study on deformation and fracture characteristics of coal under different true triaxial hydraulic fracture schemes. J. Petrol. Sci. Eng. 2022, 216, 100839. [Google Scholar] [CrossRef]
  40. Li, M.; Yin, G.; Xu, J.; Li, W.; Song, Z.; Jiang, C. A Novel True Triaxial Apparatus to Study the Geomechanical and Fluid Flow Aspects of Energy Exploitations in Geological Formations. Rock Mech. Rock Eng. 2016, 49, 4647–4659. [Google Scholar] [CrossRef]
  41. Xie, H.; Lu, J.; Li, C.; Li, M.; Gao, M. Experimental study on the mechanical and failure behaviours of deep rock subjected to true triaxial stress: A review. Int. J. Min. Sci. Technol. 2022. [Google Scholar] [CrossRef]
  42. Fan, Y.; Li, H.; Zhang, J.; Wang, Q.; Ren, T.; Zhang, M.; Huang, S.; Qin, X. Research on the in-situ stress state and the geothermal-controlling structure of the Huangshadong Geothermal Field in the Southeast Coast of China. Chin. J. Geophys. 2022, 65, 3944–3961. [Google Scholar]
  43. Zhuang, L.; Kim, K.Y.; Shin, H.S.; Jung, S.G.; Diaz, M. Experimental investigation of effects of borehole size and pressurization rate on hydraulic fracturing breakdown pressure of granite. In Proceedings of the ISRM International Symposium-10th Asian Rock Mechanics Symposium, Singapore, 29 October–3 November 2018. [Google Scholar]
  44. Tan, P.; Jin, Y.; Han, K.; Hou, B.; Chen, M.; Guo, X.; Gao, J.J.F. Analysis of hydraulic fracture initiation and vertical propagation behaviour in laminated shale formation. Fuel 2017, 206, 482–493. [Google Scholar] [CrossRef]
  45. Zoback, M.; Rummel, F.; Jung, R.; Raleigh, C. Laboratory hydraulic fracturing experiments in intact and pre-fractured rock. Int. J. Rock Mech. Min. Sci. Geomech. Abs. 1977, 14, 49–58. [Google Scholar] [CrossRef]
  46. Liu, Z.; Wang, S.; Ye, H.; Yang, L.; Feng, F.; Lian, H.; Yang, D. Experimental study on the effects of pre-cracks, fracturing fluid, and rock mechanical characteristics on directional hydraulic fracturing with axial pre-cracks. Geophys. Geo-Energy Geo-Resour. 2021, 7, 1–14. [Google Scholar] [CrossRef]
  47. Ma, W.; Wang, Y.; Wu, X.; Liu, G. Hot dry rock (HDR) hydraulic fracturing propagation and impact factors assessment via sensitivity indicator. Renew. Energy 2020, 146, 2716–2723. [Google Scholar] [CrossRef]
  48. Xi, X.; Yang, S.; McDermott, C.I.; Shipton, Z.K.; Fraser-Harris, A.; Edlmann, K. Modelling Rock Fracture Induced By Hydraulic Pulses. Rock Mech. Rock Eng. 2021, 54, 3977–3994. [Google Scholar] [CrossRef]
  49. Gao, Q.; Cheng, Y.; Han, S.; Yan, C.; Jiang, L. Numerical modeling of hydraulic fracture propagation behaviours influenced by pre-existing injection and production wells. J. Petrol. Sci. Eng. 2019, 172, 976–987. [Google Scholar] [CrossRef]
  50. Yang, L.; Sheng, X.; Li, W.; Mei, J.; Pei, Y.; Li, N. Effects of Temperature and Confining Stress on the Hydraulic Fracturing Behaviour of Granite: An Experimental and Numerical Study. Arab. J. Sci. Eng. 2021, 47, 4301–4311. [Google Scholar] [CrossRef]
  51. Xia, Y.; Tan, P.; Wang, X.; Ren, L. Differences of fracture propagation behaviour for two typical fractured formations. Nat. Gas Ind. B 2022, 9, 264–270. [Google Scholar] [CrossRef]
  52. Wan, L.; Hou, B.; Meng, H.; Chang, Z.; Muhadasi, Y.; Chen, M. Experimental investigation of fracture initiation position and fluid viscosity effect in multi-layered coal strata. J. Petrol. Sci. Eng. 2019, 182, 106310. [Google Scholar] [CrossRef]
  53. Lou, Y.; Zhang, G.Q. Experimental analysis of fracturing fluid viscosity on cyclic hydraulic fracturing. Rock Soil Mech. 2019, 40, 109–118. [Google Scholar]
  54. Hou, P.; Gao, F.; Ju, Y.; Yang, Y.; Gao, Y.; Liu, J. Effect of water and nitrogen fracturing fluids on initiation and extension of fracture in hydraulic fracturing of porous rock. J. Nat. Gas Sci. Eng. 2017, 45, 38–52. [Google Scholar] [CrossRef]
  55. Tian, F.; Jin, Y.; Jin, F.; Ma, X.; Shi, L.; Zhang, J.; Qiu, D.; Zhang, Z. Multi-Fracture Synchronous Propagation Mechanism of Multi-Clustered Fracturing in Interlayered Tight Sandstone Reservoir. Sustainability 2022, 14, 8768. [Google Scholar] [CrossRef]
Figure 1. Mineral composition of granite.
Sustainability 14 14593 g001
Figure 2. Granite specimen for HF in true triaxial tests.
Sustainability 14 14593 g002
Figure 3. True-triaxial fluid-solid coupling geomechanics experimental equipment [41].
Sustainability 14 14593 g003
Figure 4. Time-injection pressure curve with different IRs when the HSDs were (a) 0 MPa, (b) 3 MPa, (c) 6 MPa. The brown curve depicts the changing trend of fluid pressure in the fractured well when the IR is 10 mL/min. The green curve and blue curve depict the changing trend of fluid pressure in the fractured well when the IR is 60 mL/min and 100 mL/min, respectively.
Sustainability 14 14593 g004
Figure 5. The fracture morphology of HF when the HSD is 0/3/6 MPa and the IR is 10/60/100 mL/min. The orange shadow is formed after the tracer is oxidised, which can sign the position of the crack. The direction of the crack is marked in bold with a red solid line.
Sustainability 14 14593 g005
Figure 6. Diagram of cohesive element (a) and its constitutive model (b).
Sustainability 14 14593 g006
Figure 7. Globally embedded cohesive elements into the simulation model. The red line represents the global cohesive elements. The local mesh of fractures marked by the black dotted line has been enlarged to display.
Sustainability 14 14593 g007
Figure 8. Comparison of numerical simulation results and experimental results at the IR of 10 mL/min when the HSDs were (a) 0 MPa, (b) 3 MPa, (c) 6 MPa. The upper left corner of the numerical simulation figures represents the fracture width values, the same below.
Sustainability 14 14593 g008
Figure 9. Comparison of numerical simulation results and experimental results at the IR of 60 mL/min when the HSDs were (a) 0 MPa, (b) 3 MPa, (c) 6 MPa.
Sustainability 14 14593 g009aSustainability 14 14593 g009b
Figure 10. Numerical simulation results of GF at the IR of 10 mL/min when the HSDs were (a) 0 MPa, (b) 3 MPa, and (c) 6 MPa.
Sustainability 14 14593 g010
Figure 11. Numerical simulation results of GF at the IR of 60 mL/min when the HSDs were (a) 0 MPa, (b) 3 MPa, and (c) 6 MPa.
Sustainability 14 14593 g011
Figure 12. Mesh pattern with cohesive elements at the engineering scale.
Sustainability 14 14593 g012
Figure 13. The fracturing networks when the cluster spacing is (a) 18 m; (b) 14 m; (c) 10 m; (d) 6 m.
Sustainability 14 14593 g013
Figure 14. The fracturing networks when the IR is (a) 6 m3/min; (b) 12 m3/min; (c) 18 m3/min; (d) 24 m3/min.
Sustainability 14 14593 g014
Table 1. Basic mechanical parameters of granite.
Uniaxial Compressive Strength (MPa)Poisson’s RatioElastic Modulus (GPa)Tensile Strength (MPa)Fracture Toughness (MPa·m1/2)
145.780.1621.8213.342.26
132.960.2623.3111.791.96
148.620.1819.9811.892.04
Table 2. Experimental schemes of true triaxial hydraulic fracturing.
No.Triaxial Stress (MPa)HSD (MPa)IR (mL/min)BP (MPa)
HF 125/3/30106.66
HF 225/6/33108.85
HF 325/9/361012.75
HF 425/3/306012.22
HF 525/6/33608.64
HF 625/9/36609.54
HF 725/3/3010014.10
HF 825/6/3310011.43
HF 925/9/361005.79
Table 3. Numerical simulation parameters of HF and GF at laboratory scale.
Input ParameterValueInput ParameterValue
Model side length100 mmWater specific gravity1 × 10−9 t/mm3
Elastic modulus21.71 GPaHydrodynamic viscosity1 × 10−9 MPa·s
Poisson’s ratio0.20Cohesive elastic modulus28 GPa
Permeability coefficient5 × 10−5 mm/sCohesive maximum damage stress6 MPa
Pore ratio10%Cohesive failure displacement0.01 mm
Nitrogen specific gravity1.225 × 10−12 t/mm3Nitrogen dynamic viscosity1.75 × 10−11 MPa·s
Fluid loss coefficient1 × 10−11 m/sTemperature20 °C
Table 4. Numerical simulation parameters of GF and HF at the in-situ geothermal reservoir.
Input ParameterValueInput ParameterValue
Thickness of cap/bottom layer40 mViscosity of water-based fracturing fluid1 × 10−3 Pa·s
Elastic modulus of cap/bottom layer21.0 GPaSpecific gravity of water-based fracturing fluid9800 kg/m3
Poisson’s ratio of cap/bottom layer0.2Viscosity of nitrogen fracturing medium1 × 10−4 Pa·s
Reservoir thickness20 mSpecific weight of nitrogen fracturing medium1.225 kg/m3
The length of the reservoir240 mFluid loss coefficient1 × 10−14 m/s
Elastic modulus of reservoir20.8 GPaTensile strength of hot dry rock12 MPa
Poisson’s ratio of the reservoir0.22Failure displacement of cohesive element0.01 m
Porosity0.12Vertical geostress54 MPa
Pore pressure22 MPaMaximum horizontal geostress51 MPa
Permeability0.1 mDMinimum horizontal geostress47 MPa
Publisher’s Note: MDPI stays neutral with regard to jurisdictional claims in published maps and institutional affiliations.

