Article

Modification of Peck Formula to Predict Surface Settlement of Tunnel Construction in Water-Rich Sandy Cobble Strata and Its Program Implementation

1
School of Computer and Artificial Intelligence, Huaihua University, Huaihua 418000, China
2
Key Laboratory of Wuling-Mountain Health Big Data Intelligent Processing and Application in Hunan Province Universities, Huaihua 418000, China
3
Key Laboratory of Intelligent Control Technology for Wuling-Mountain Ecological Agriculture in Hunan Province, Huaihua 418000, China
*
Author to whom correspondence should be addressed.
Sustainability 2022, 14(21), 14545; https://doi.org/10.3390/su142114545
Submission received: 2 October 2022 / Revised: 30 October 2022 / Accepted: 3 November 2022 / Published: 5 November 2022
(This article belongs to the Special Issue The Development of Underground Projects in Urban Areas)

Abstract

:
There are few studies on the land subsidence induced by shield tunneling in the water-rich sandy gravel stratum, which is of high research value. Linear regression and measured data were employed in this study to investigate the land subsidence induced by shield tunneling when crossing the water-rich sandy gravel stratum from Mudan Dadao Station to Longmen Dadao station of Luoyang Metro Line 2. The maximum land subsidence correction coefficient, α, and the settlement trough width correction coefficient, β, were introduced to modify the peck formula to predict land subsidence induced by shield tunneling in Luoyang’s water-rich sandy gravel stratum. It was discovered that the original Peck formula needs to be modified because its prediction result was significantly larger than the actual value. When the value ranges of α and β in the modified Peck formula were 0.379~0.690 and 0.455~0.508, respectively, the modified Peck formula presented a minor error, in terms of the prediction curve, compared with the original formula, and the prediction result was more reliable. The best prediction result could be obtained when α = 0.535 and β = 0.482. In addition, Python could effectively improve the calculation efficiency of the Peck formula modification.

1. Introduction

Ground traffic congestion has increasingly worsened in recent years as a result of population growth and the acceleration of urban development. In order to solve this problem, China focused on the development of underground railway transportation, and the subway has played an indispensable role in urban transportation. The methods used to build subway segments typically include the open-cut method, cover excavation method, shielding method, etc. The shielding method has emerged as the preferred construction technique, due to its safety, dependability, efficiency, and other benefits. However, even if the shielding method is adopted, surrounding pipelines and surface buildings are undoubtedly affected, resulting in an increase in land subsidence. There are many methods to predict land subsidence and deformation, including the following: empirical formula method, analytical method, model test method, numerical simulation calculations, etc. The Peck formula, as one of these methods, is widely used because of its simplicity, reliability, and broad applicability [1].
Peck [2] proposed Peck’s formula to predict surface settlement after analyzing and summarizing a large amount of surface settlement data and related engineering information. Subsequently, Attewell [3], O’Reilly and New [4], and many other scholars, modified it on the basis of Peck’s theory. Since the shield construction process faces a variety of geological conditions and working conditions, in order to make the Peck formula better adapted to the influence of various complex geological conditions and working conditions, Hu et al. [5] studied the law of land subsidence induced by shield tunneling in the water-rich stratum. Zhang et al. [6] studied the influence of time and depth on land subsidence, and deduced formulae to predict the three-dimensional space–time subsidence of double-track tunnels during construction. Hence, the calculation method of ground settlement of single- and double-track tunnels was obtained. Hu et al. [7] studied the law of land subsidence induced by different construction sequences of multi-layer tunnels, and modified the Peck formula to predict land subsidence more accurately. Zhang et al. [8] studied the horizontal and vertical ground settlement induced by shield tunneling in the sandy compound stratum. Fang et al. [9] studied the vertical soil deformation characteristics caused by shield tunneling of fully overlapped tunnels, and modified the Peck formula to explore the influence of changes in tunnel axis depth and ground loss rate on land subsidence. Heng et al. [10] studied the characteristics of land subsidence induced by the construction of ultra-shallow buried twin tunnels with large sections. Zhang et al. [11] modified the settlement trough width coefficient in the Peck formula by analyzing a large amount of measured data. Zhou et al. [12] deduced the prediction formula of ground deformation induced by the construction of twin tunnels, based on the Peck formula, and analyzed the influence mechanism of twin tunnel excavation.
An analysis of relevant studies shows that current research, based on the Peck formula, has predicted and analyzed surface settlement caused by tunneling in a variety of complex strata and parameter conditions, but has ignored the effect of water-rich sandy cobble strata conditions on ground settlement. When shields are tunneled through water-rich sandy cobble strata, such as those crossing rivers and springs with richer groundwater, they are more likely to destabilize the excavation surface and cause large ground settlement. Many scholars have drawn attention to the surface settlement caused by shield construction in water-rich sandy cobble strata, but existing studies have mainly adopted the methods of model tests [13,14,15], numerical simulations [16,17] and analytical methods [18], while reliable and practical theoretical prediction methods are lacking.
Based on the field monitoring data of shield tunneling in water-rich sandy gravel stratum from Mudan Dadao Station to Longmen Dadao station of Luoyang Metro Line 2, this study modified the Peck formula through linear regression, and realized programming in computers, which greatly improved the calculation efficiency.

2. Modification of Peck Formula

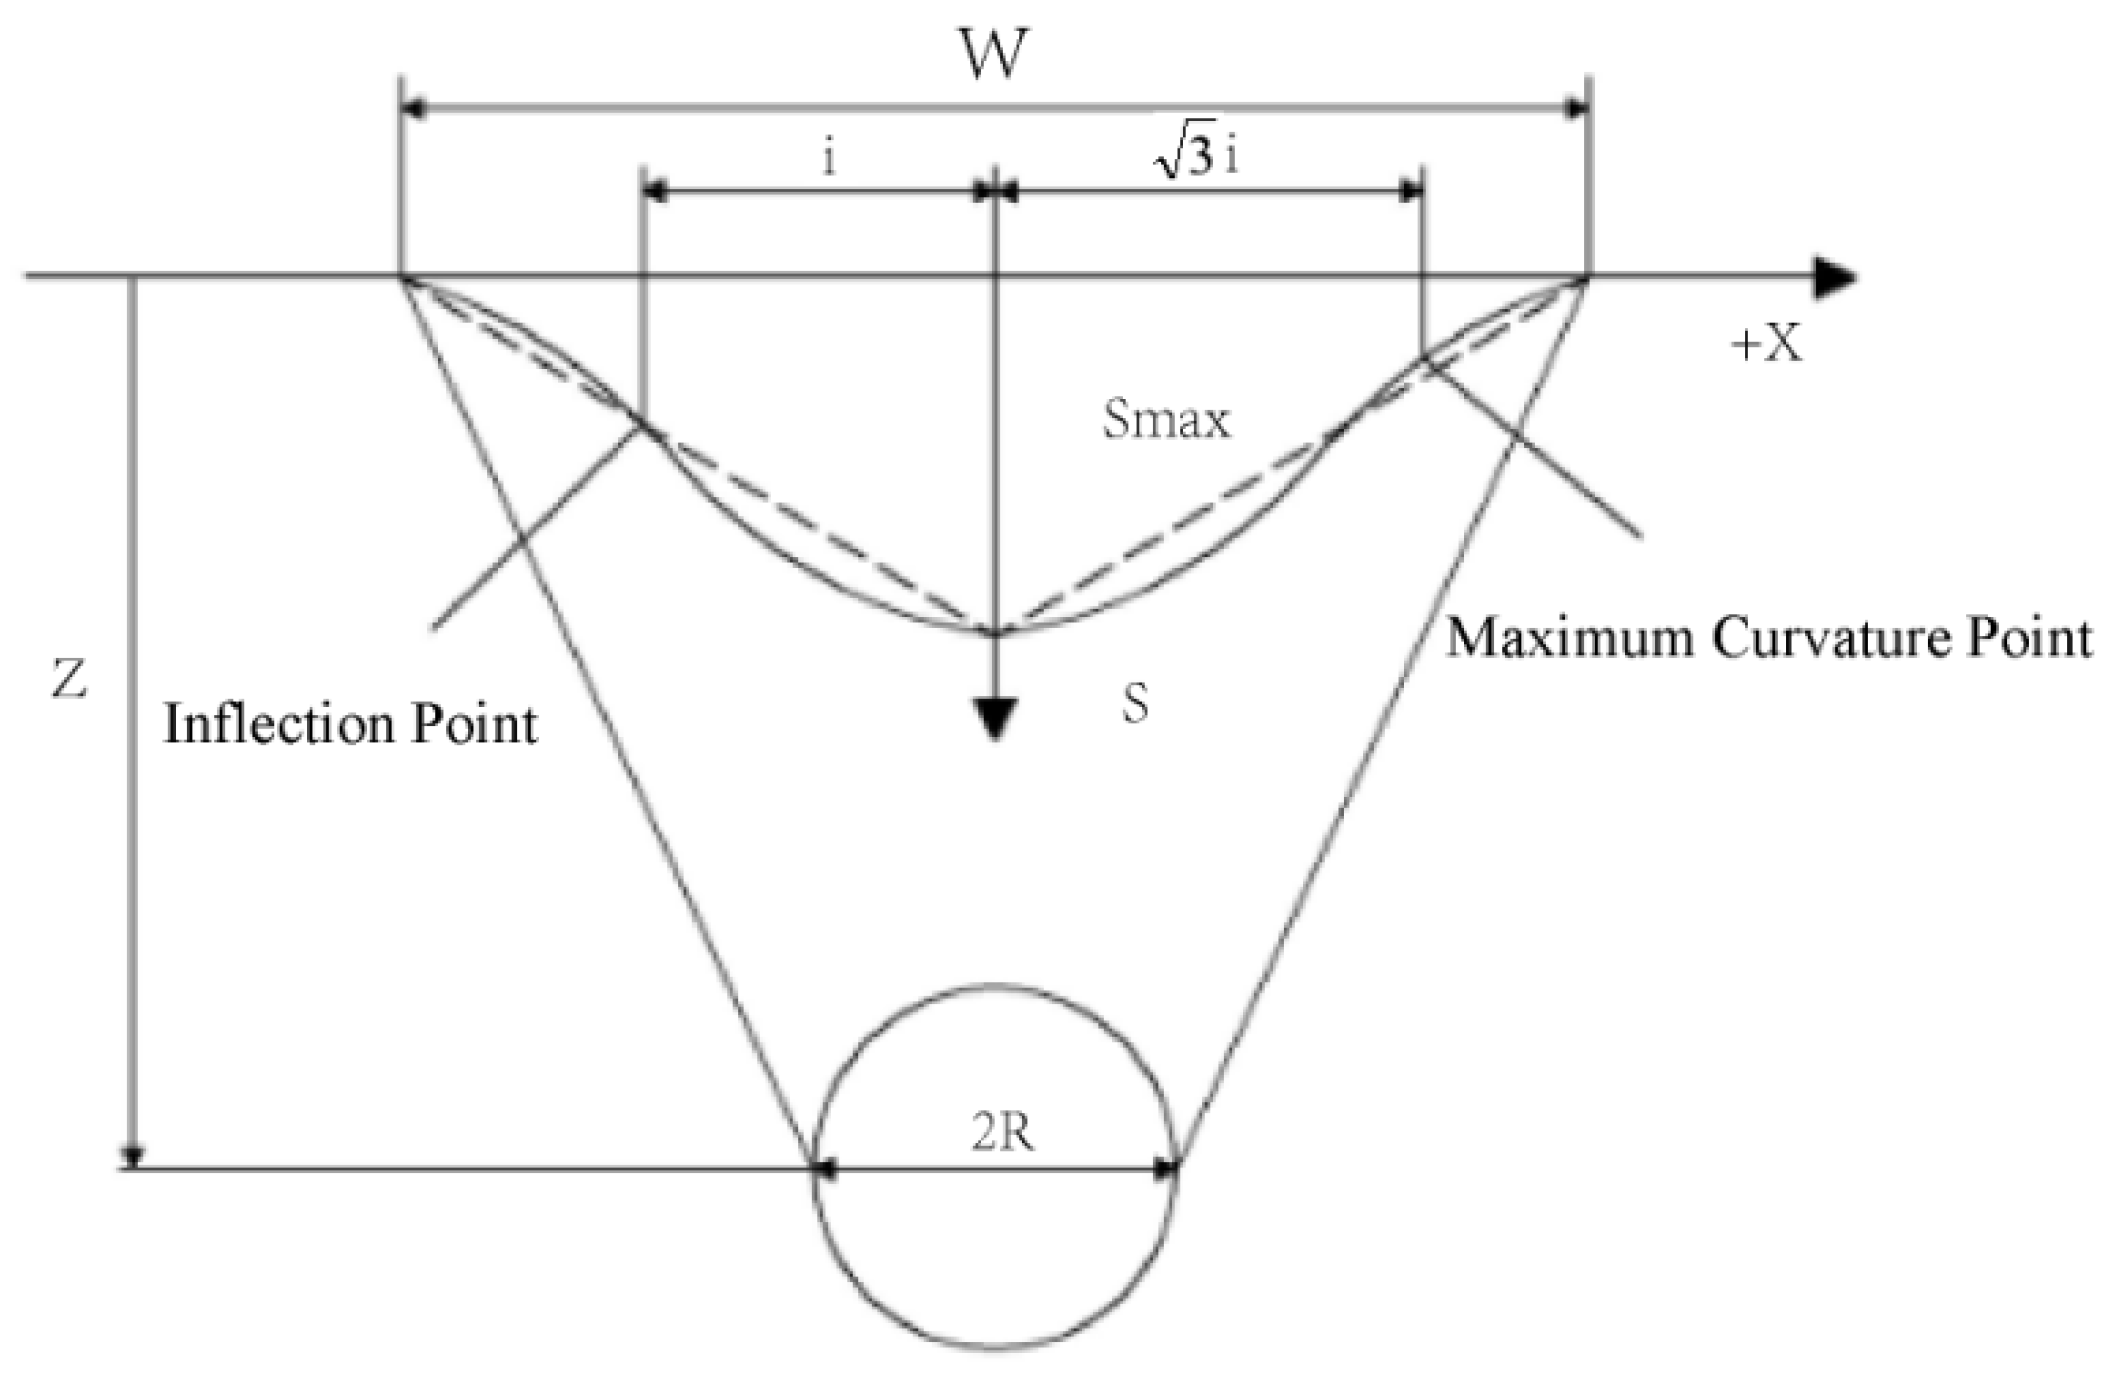
2.1. Peck Formula Theory

According to Peck formula theory, the curve of ground settlement in an undrained state induced by tunnel excavation conforms to the Gaussian distribution. The ground settlement curve is shown in Figure 1.
The calculation formula for ground settlement is:
S ( x ) = S max exp ( x 2 2 i 2 )
S max = V i i 2 π
i = Z 2 π tan ( 45 ϕ / 2 )
where,
  • S (x)—land subsidence at x from the center line of the tunnel, m.
  • Smax—land subsidence at the center line of the tunnel, m.
  • X—distance from tunnel center line, m.
  • i—settlement trough width coefficient, i.e., the abscissa of the inflection point of subsidence curve.
  • Vi—loss volume per unit length of tunnel induced by shield tunneling, m3.
  • φ—internal friction angle of stratum around tunnel.
  • Z—depth from ground surface to the tunnel center, m.

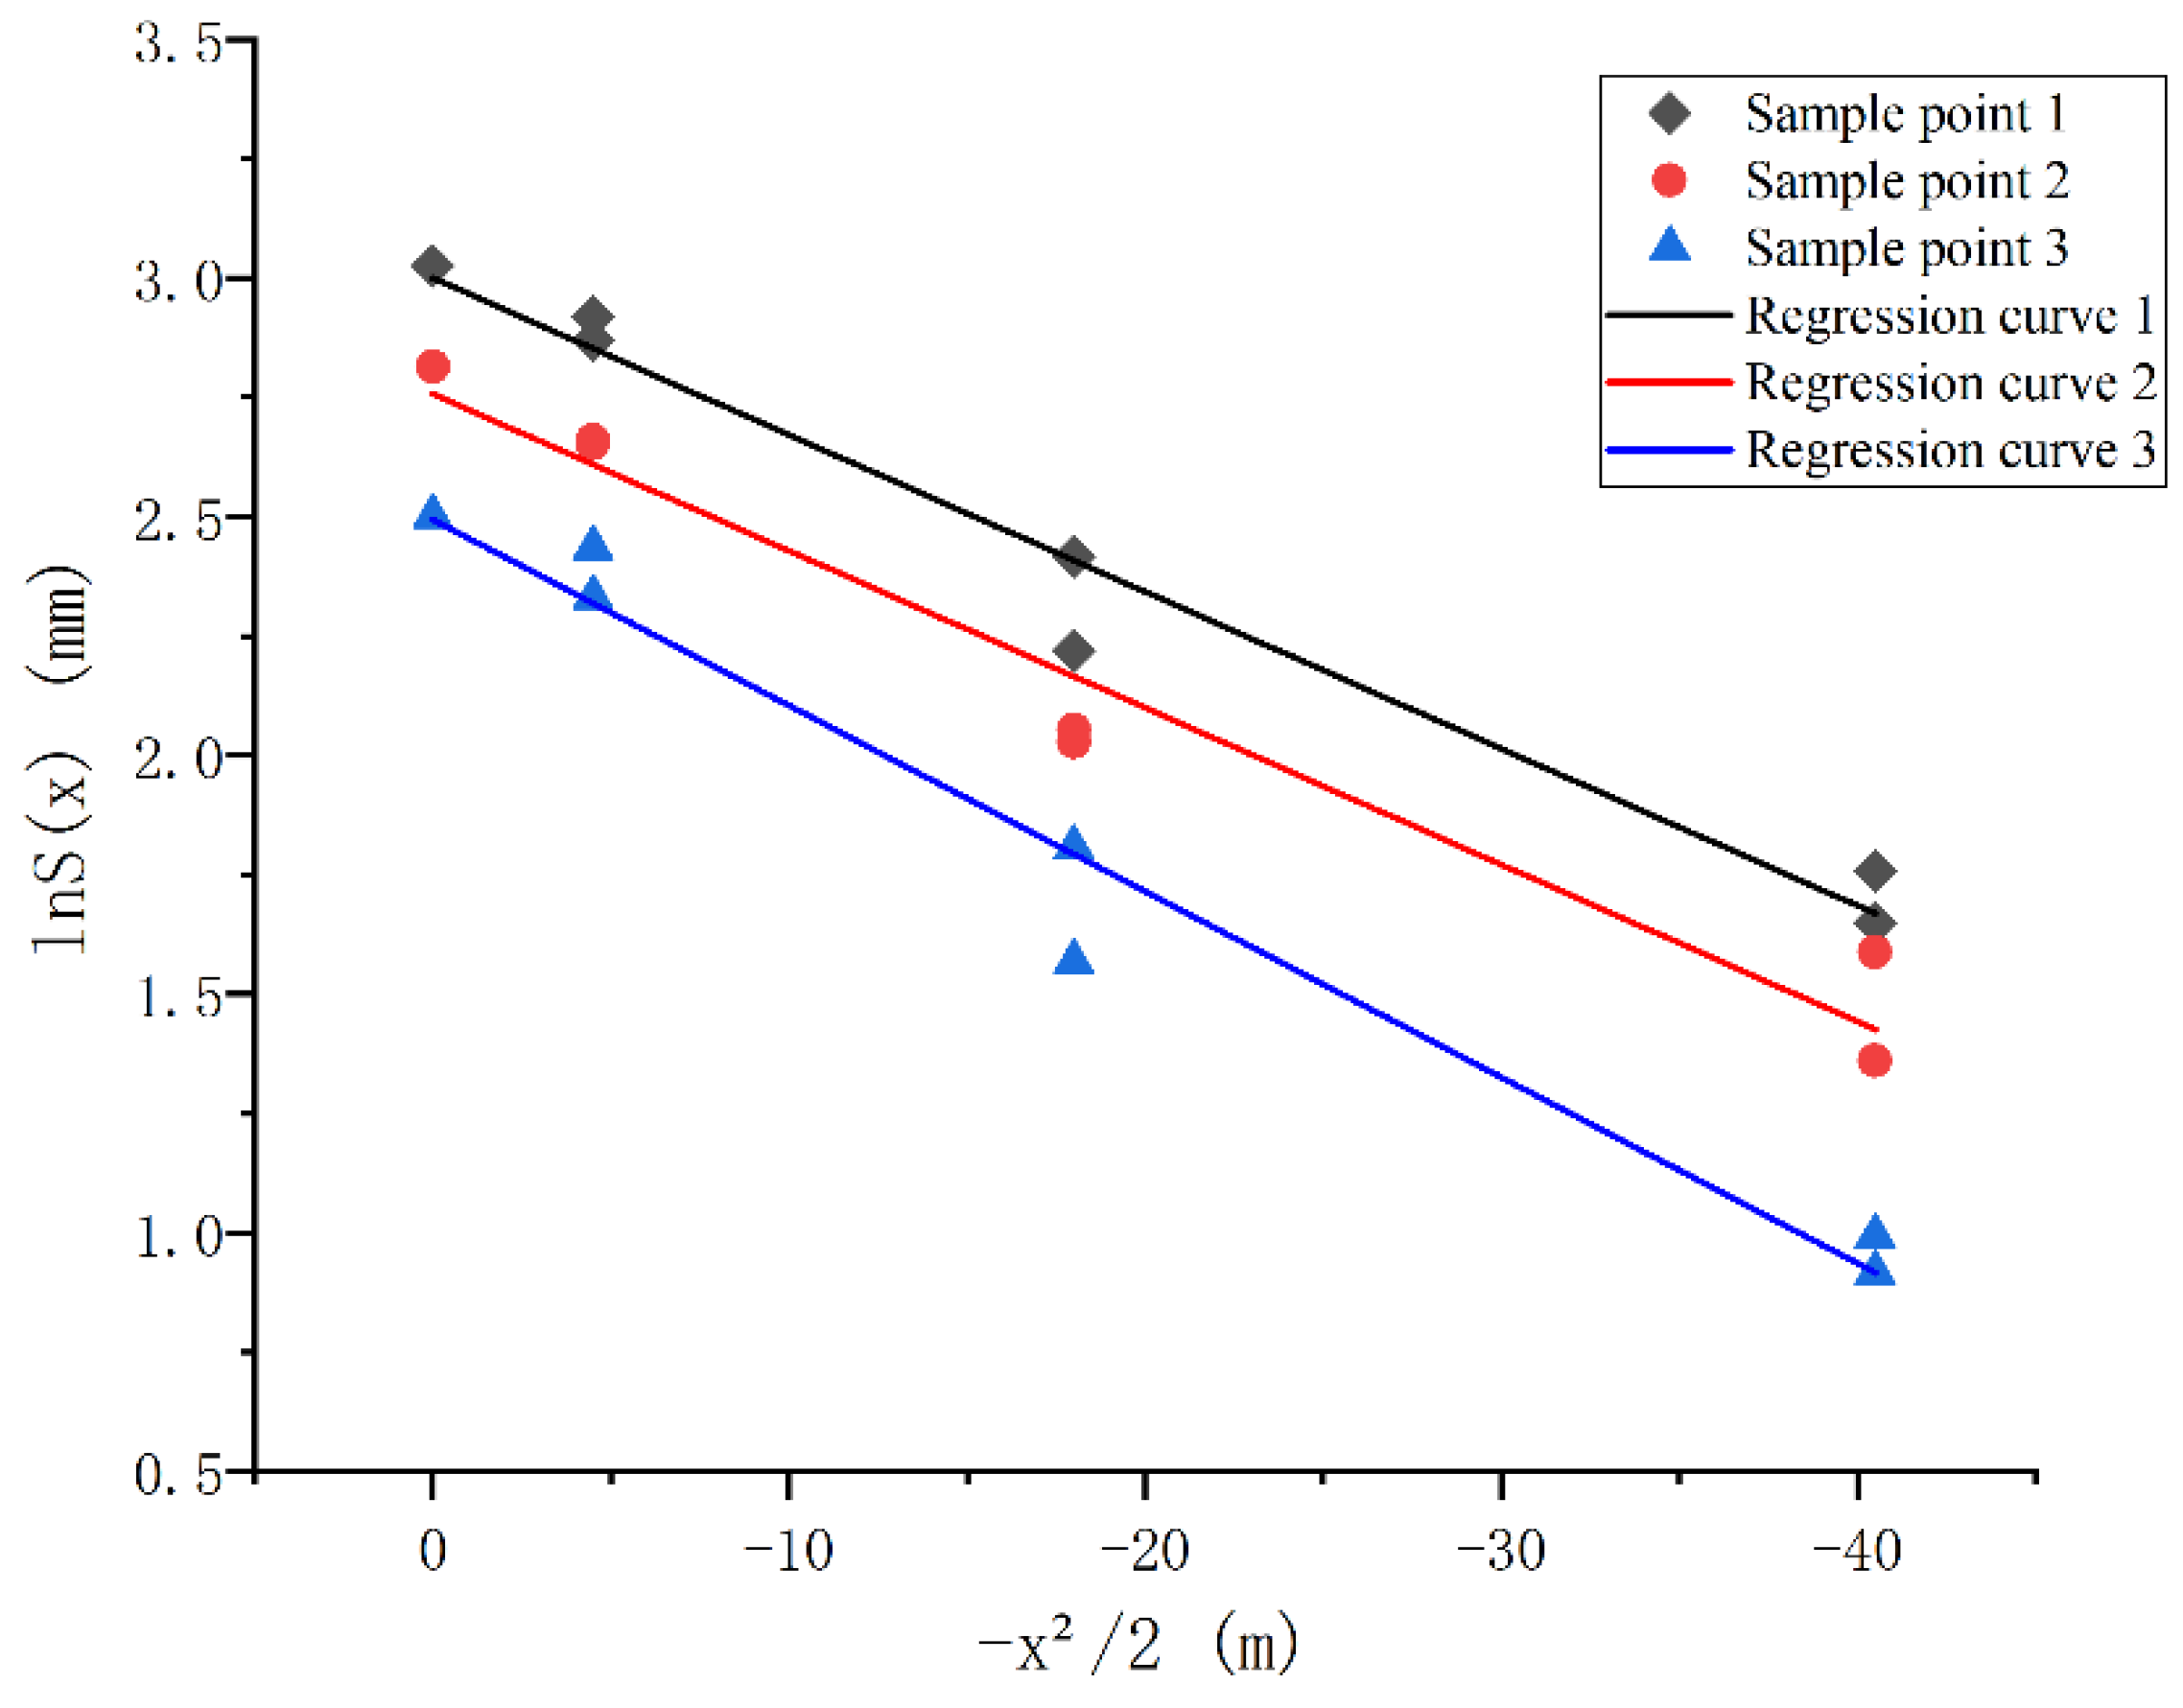
2.2. Regression and Analysis of Peck Formula

To enable the Peck formula to better predict surface settlement caused by shield construction under water-rich sand and pebble ground conditions, a linear regression analysis of the Peck formula is required [19], by means of logarithms on both sides of Equation (1):
L n S ( x ) = L n S max + 1 i 2 × ( x 2 2 )
Take L n S ( x ) and x 2 2 as regression variables, where L n S ( x ) is the constant term, and x 2 2 is the linear coefficient after the regression. The calculation process is as follows:
S x x = ( x i 2 2 ) 2 1 n ( x i 2 2 ) 2
S x y = [ ( x i 2 2 ) L n S ( x i ) ] 1 n ( x i 2 2 ) L n S ( x i )
S y y = L n 2 S ( x i ) 1 n [ L n S ( x i ) ] 2
b ^ = S x y S x x
a ^ = L n S i ( x ) ¯ b ^ × ( x 2 ) / 2 ¯
The linear regression equation is:
L n S ( x ) = a ^ + b ^ × ( x 2 2 )
where,
  • a ^ : constant term of the regression equation.
  • b ^ : linear coefficient of the regression equation.
  • x i : distance from the settlement monitoring point to the center line of the tunnel, m.
After the above regression calculation, the following results can be obtained:
S max = exp ( a ^ )
i = 1 / b ^
The equation of the regression curve is:
S = exp ( a ^ ) exp ( b ^ x 2 2 )
R testing for linear correlation:
R = S x y S x x × S y y
When the conditions of r 0.01 ( n 2 ) > R > r 0.05 ( n 2 ) are satisfied, the linear relationship of the regression function is significant.

2.3. Regression Analysis of Typical Interval Examples

The section project of Metro Line 2 in Luoyang, Henan Province, starts from Mudan Dadao station, passes Guanlin Dadao station, and Luoyanglongmen station, and ends at Longmen Dadao station. The whole interval includes a total of 4 stations and 3 intervals.
According to the stratum parameters of the shield tunneling project, the monitoring data of three typical sections were selected for regression analysis, and the settlement curve was fitted. The results are shown in Table 1, Table 2 and Table 3.
Regarding Section 1, the results, according to Formulae (5)–(7) are as follows:
S x x = 11656.556 , S x y = 243.432 , S y y = 5.392
According to Formulae (8) and (9):
a ^ = 3.002 , b ^ = 0.0329
The linear function of Section 1 after regression is:
ln S ( x ) = 3.002 + 0.0329 × ( x 2 2 )
Similarly, the linear function of Sections 2 and 3 are as follows:
ln S ( x ) = 2.758 + 0.0329 × ( x 2 2 )
ln S ( x ) = 2.495 + 0.0390 × ( x 2 2 )
The monitoring data of Sections 1 to 3 were compared with their regression function, and the results are shown in Figure 2.
Figure 2 demonstrates that the linear function after regression fits well with the measured data, which is evenly distributed around the linear function curve. Smax and i after regression can be calculated using a ^ , b ^ . Comparing the fitting curves of the three sections, the measured settlement curve and the curve of predicted value, based on the Peck formula, is shown in Figure 3.

2.4. Form of the Modification of the Peck Formula

Figure 3 demonstrates that the prediction result of the original Peck formula is significantly larger than the actual value. It is necessary to modify the Peck formula to make it suitable for predicting the ground settlement induced by shield tunneling in water-rich sandy gravel stratum. The modified Peck formula is:
S ( x ) = α S max exp ( x 2 2 ( β i ) 2 )
where,
  • α—correction coefficient of maximum land subsidence.
  • β—correction coefficient of settlement trough width.
  • Smax—maximum land subsidence of Peck formula, m.
  • i—coefficient of settlement trough width of Peck formula.
After linear transformation, the above formula is converted to:
ln S ( x ) = ln α S max + ( x 2 2 ( β i ) 2 )
Take ln α S max as a constant term, and 1 / ( β i ) 2 as a linear coefficient, and substitute a ^ and b ^ obtained in the previous section into Equation (16). The results are as follows:
α = exp ( a ^ ) S max
β = 1 i ( b ^ ) 0.5

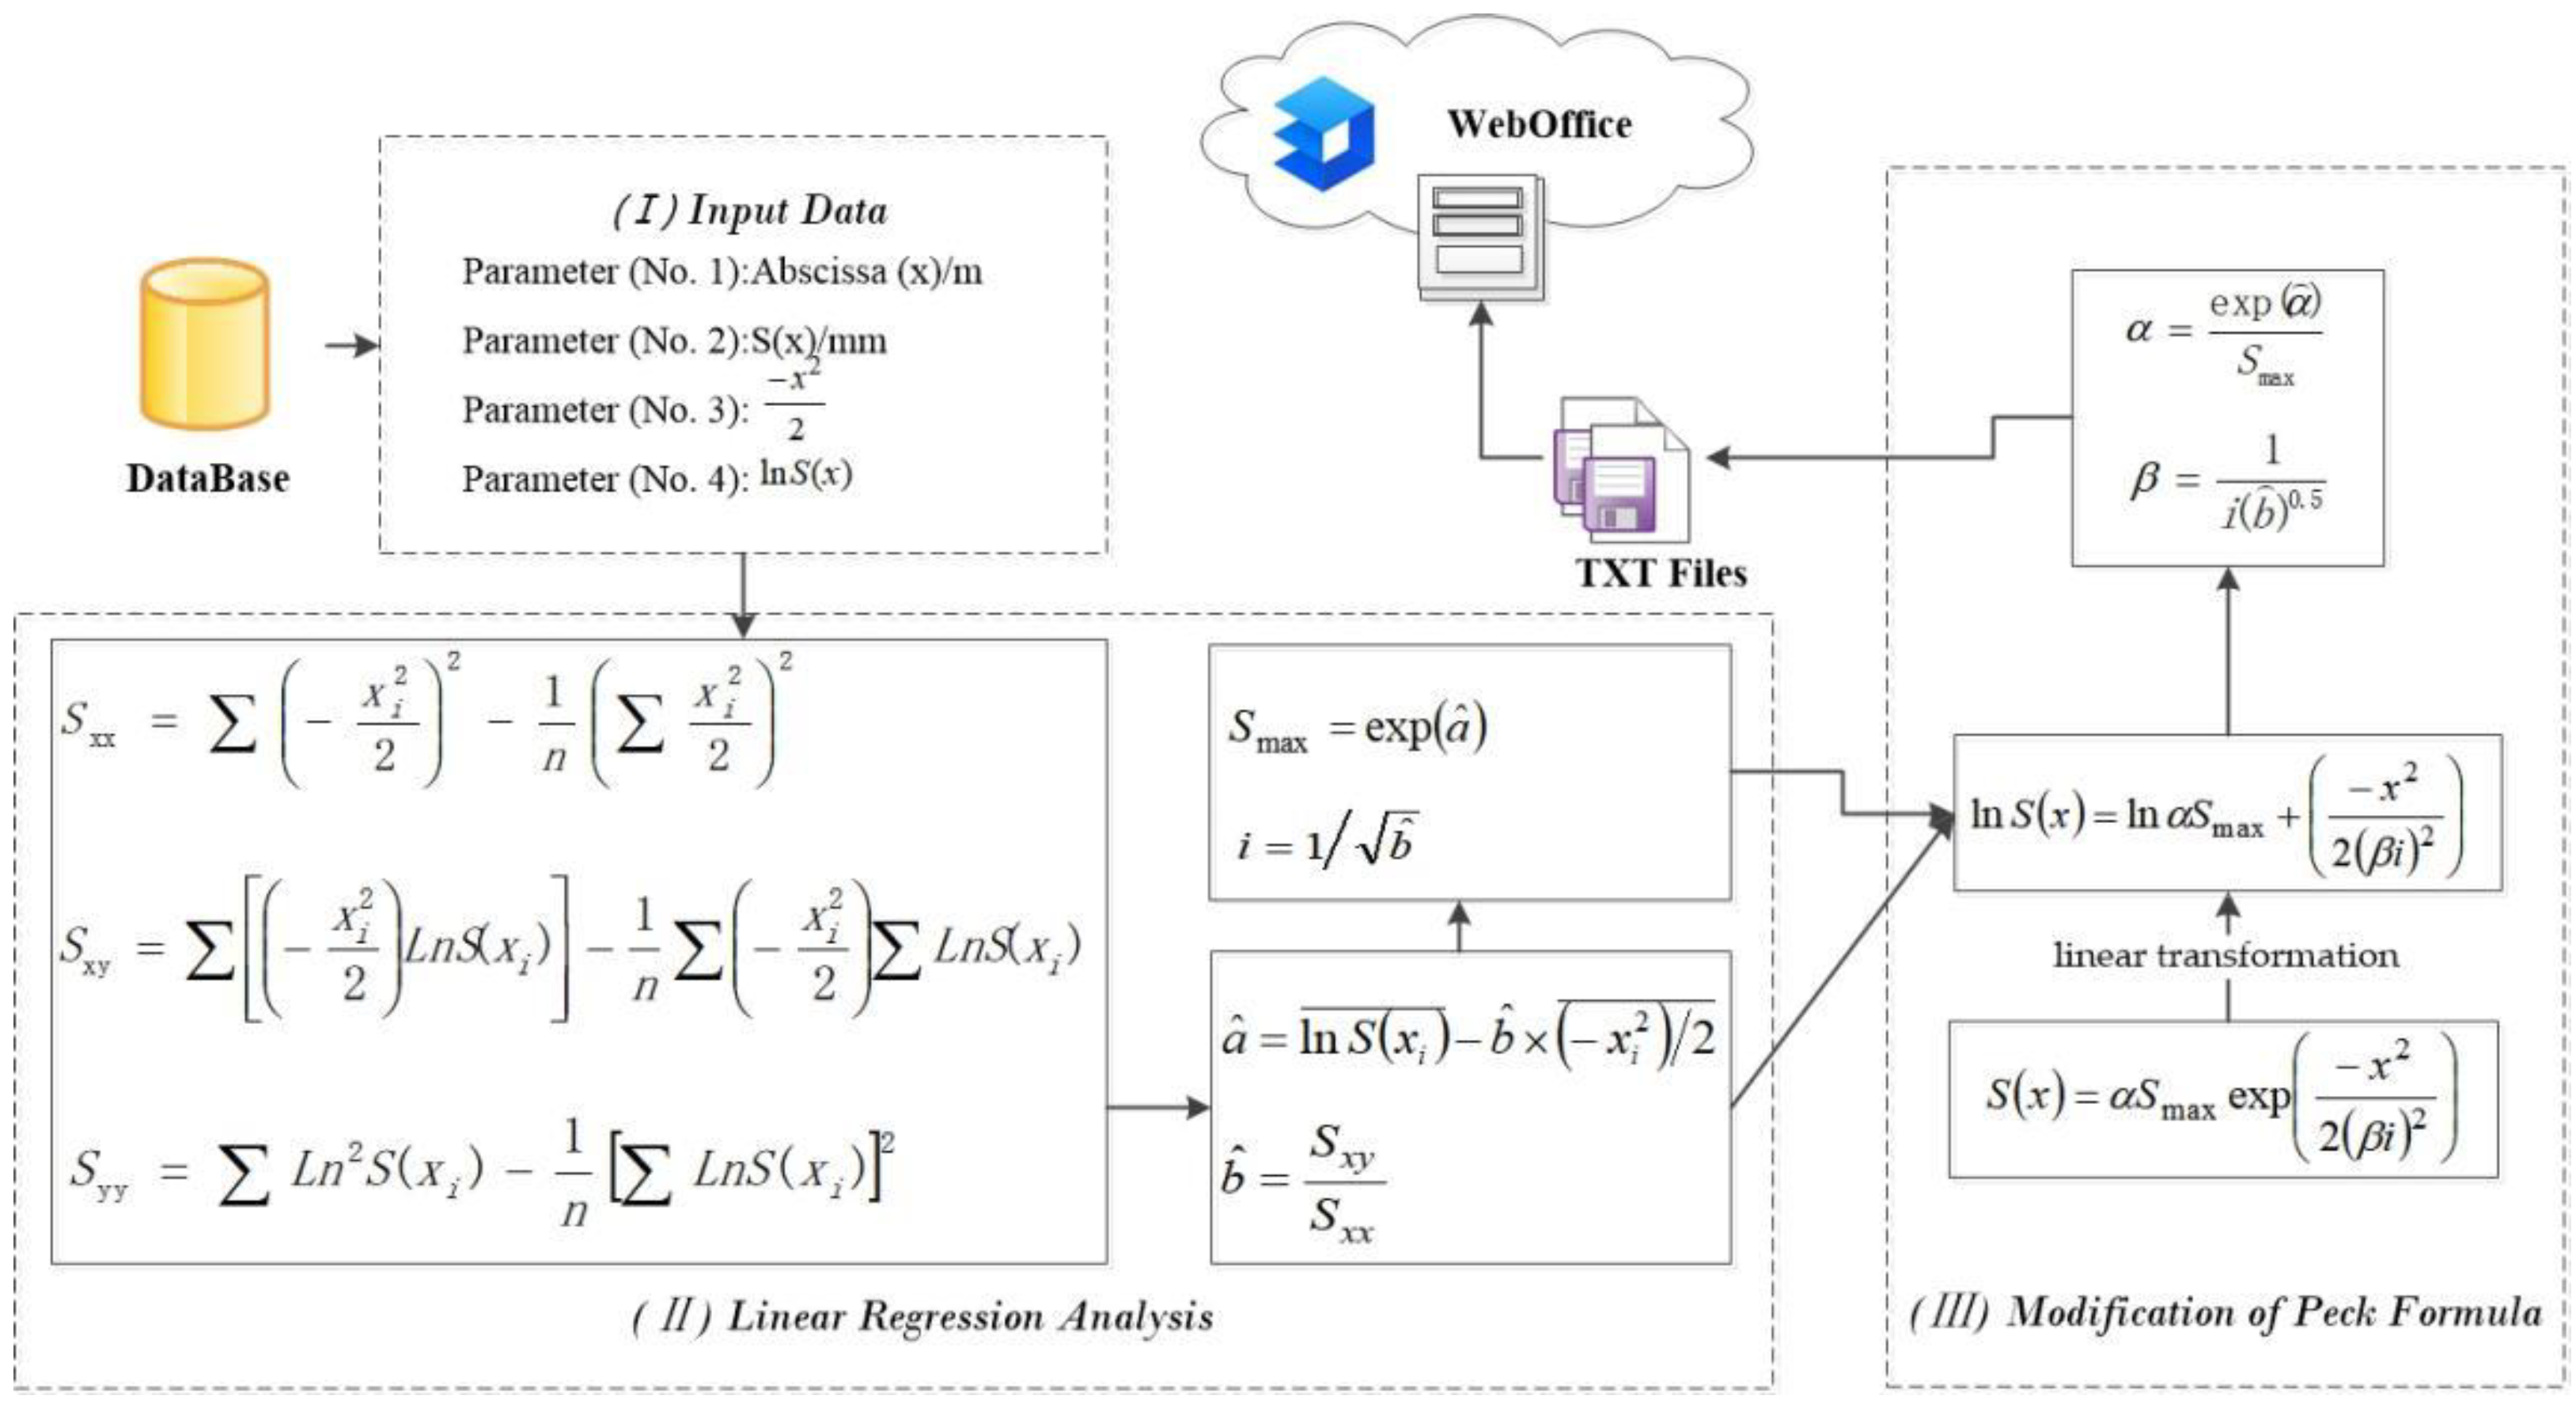
3. Program Implementation and Parameter Optimization of Peck Formula Modification

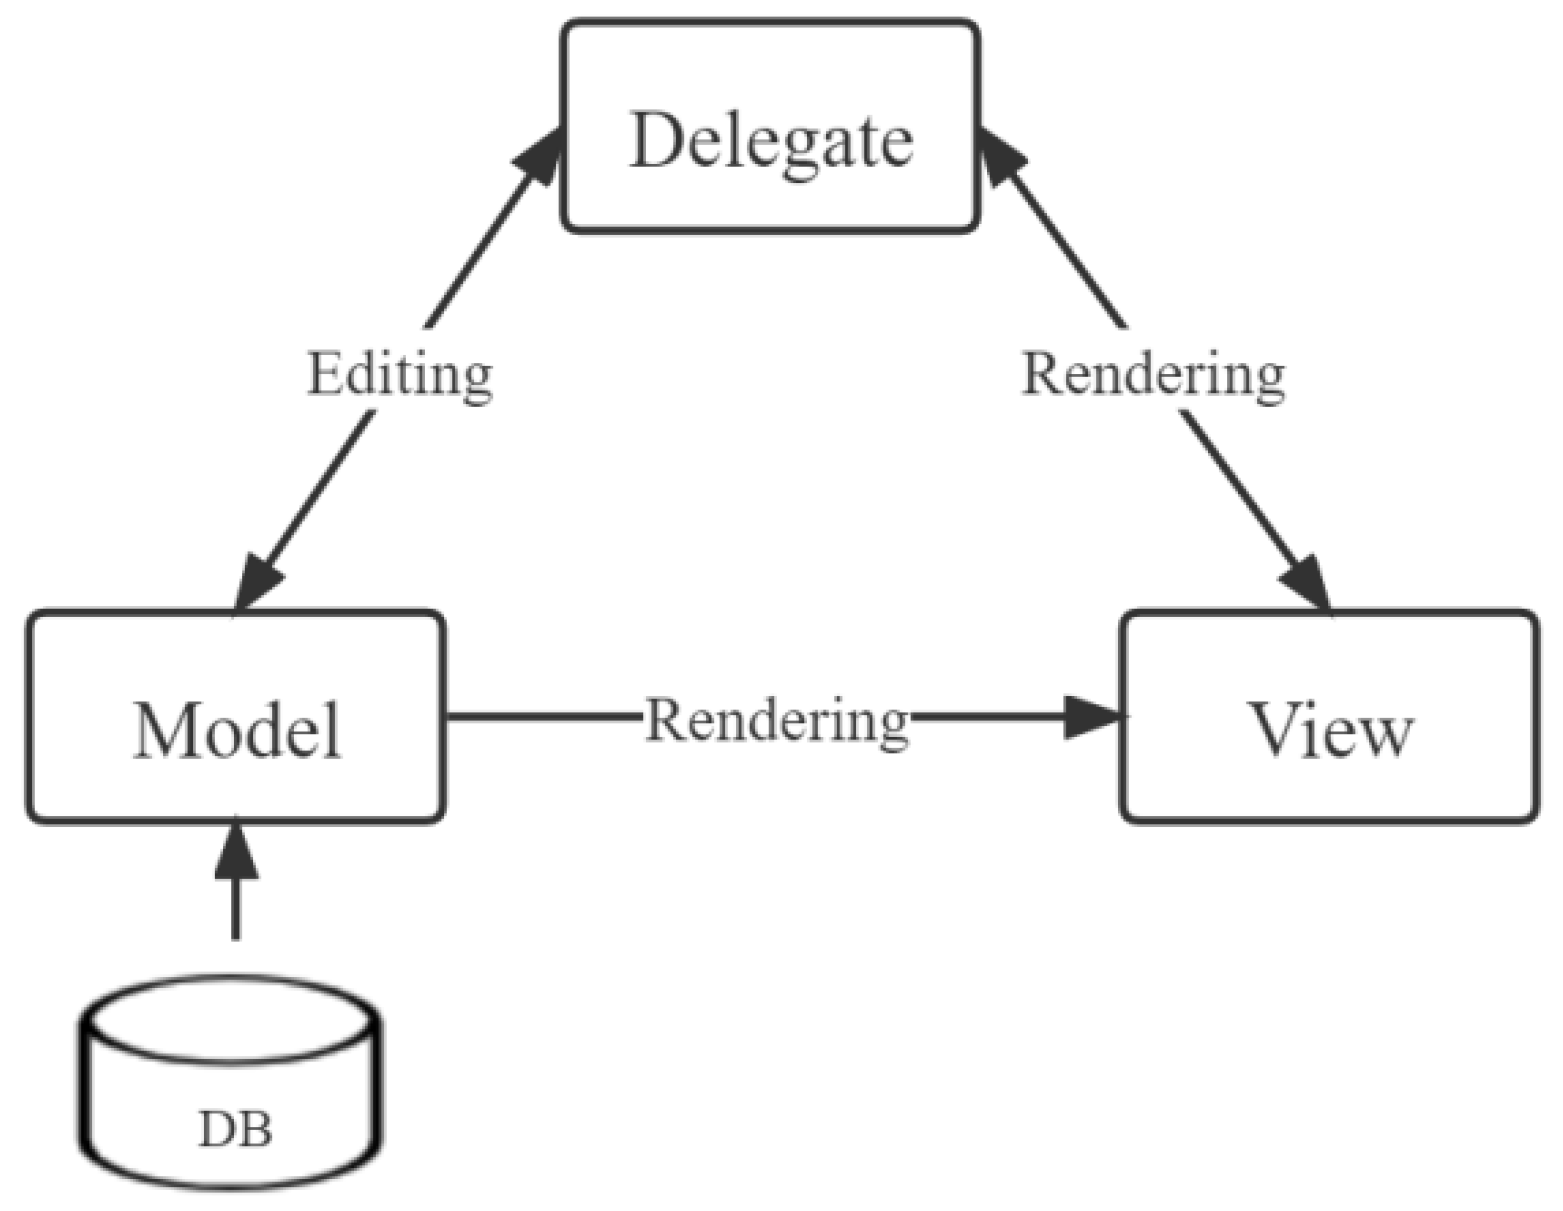
3.1. Development Environment

The ground settlement prediction system of shield tunneling runs on Windows 10 64-bit operating system and comprehensively utilizes Anaconda 3-2021.11-Windows-x86_64, Python3.7, Pycharm-professional-2021, and PyQt5.15.4. The primary steps to building a development environment in a Windows system are as follows:
  • Install Anaconda open-source package.
  • Set up the Pycharm development environment. The specific operation methods include: creating a new project and then changing the “project interpreter” to “python.exe” in the Anaconda file directory.
  • Install the PyQt graphics toolkit. Since Anaconda is a collection of Python-based scientific and technological packages, PyQt is already installed by default when Anaconda is set up. Therefore, the configuration is finished when QtDesigner is added in Pycharm as an external tool.

3.2. Procedure Flowchart

According to the flowchart in Figure 4, the procedure is divided into three parts: Input Data, Linear Regression Analysis, and Modification of Peck Formula. The above-mentioned formulae serve as the foundation for the computation, which combines Python modules, standard libraries, and multiple open-source libraries for mathematical and numerical calculations, including NumPy, SciPy, FiPy, and matplotlib, etc., for implementation [20].

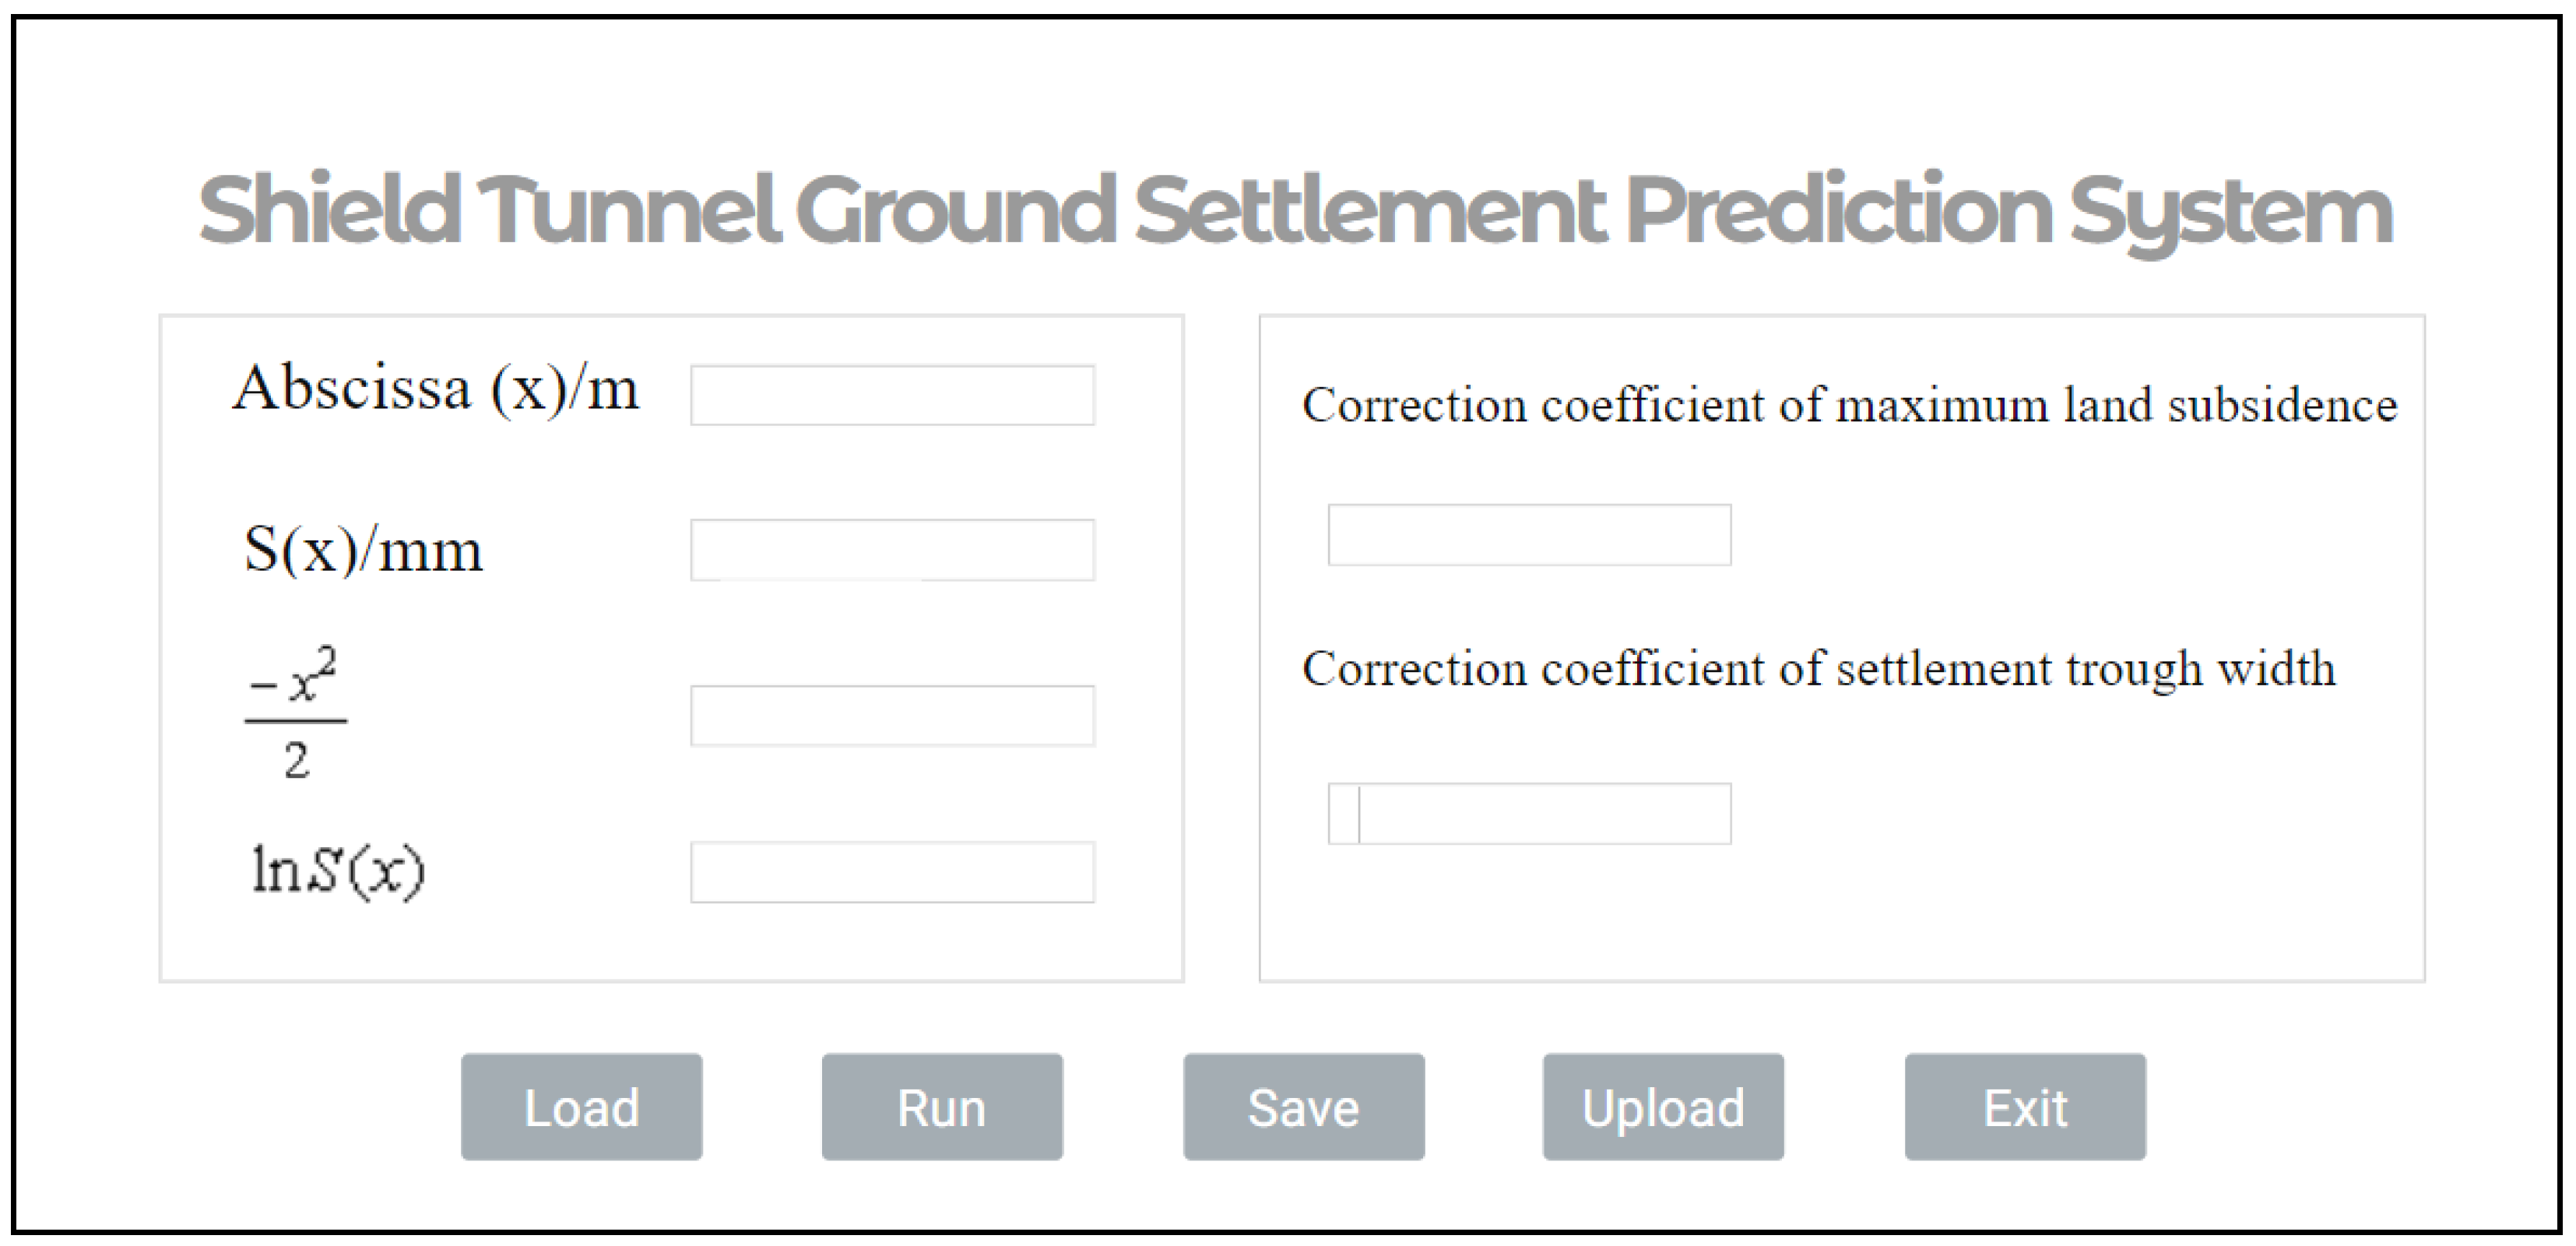
3.3. Program Operation Interface

The program employs QtDesigner to realize the visual interface of the prediction system of ground settlement induced by shield tunneling. QT introduces the InterView framework (MVD), which effectively separates data and user interface. M (Model) represents the model of data. V (View) represents the view of the user interface. D (Delegate) defines the user’s operation control on the interface. The overall structure is shown in Figure 5.
The program uses Qt Designer (QtDesigner) to implement a visual interface for the shield tunnel ground settlement prediction system, as shown in Figure 6, which mainly includes components such as system parameter input and correction coefficient output. First, the user clicks on the “Load” button to read the txt file from the database and enters the parameters in bulk, or manually. The user then clicks on the “Run” button to run the program to obtain the values of the Peck formula for maximum surface settlement correction parameter α and the settlement trough width. The data can then be saved in txt format by clicking on the “Save” button. The α and β values from the inversion analysis of the actual monitoring data from different areas can be summarized in a WPS cloud file to create a cloud database of Peck’s formula parameters.

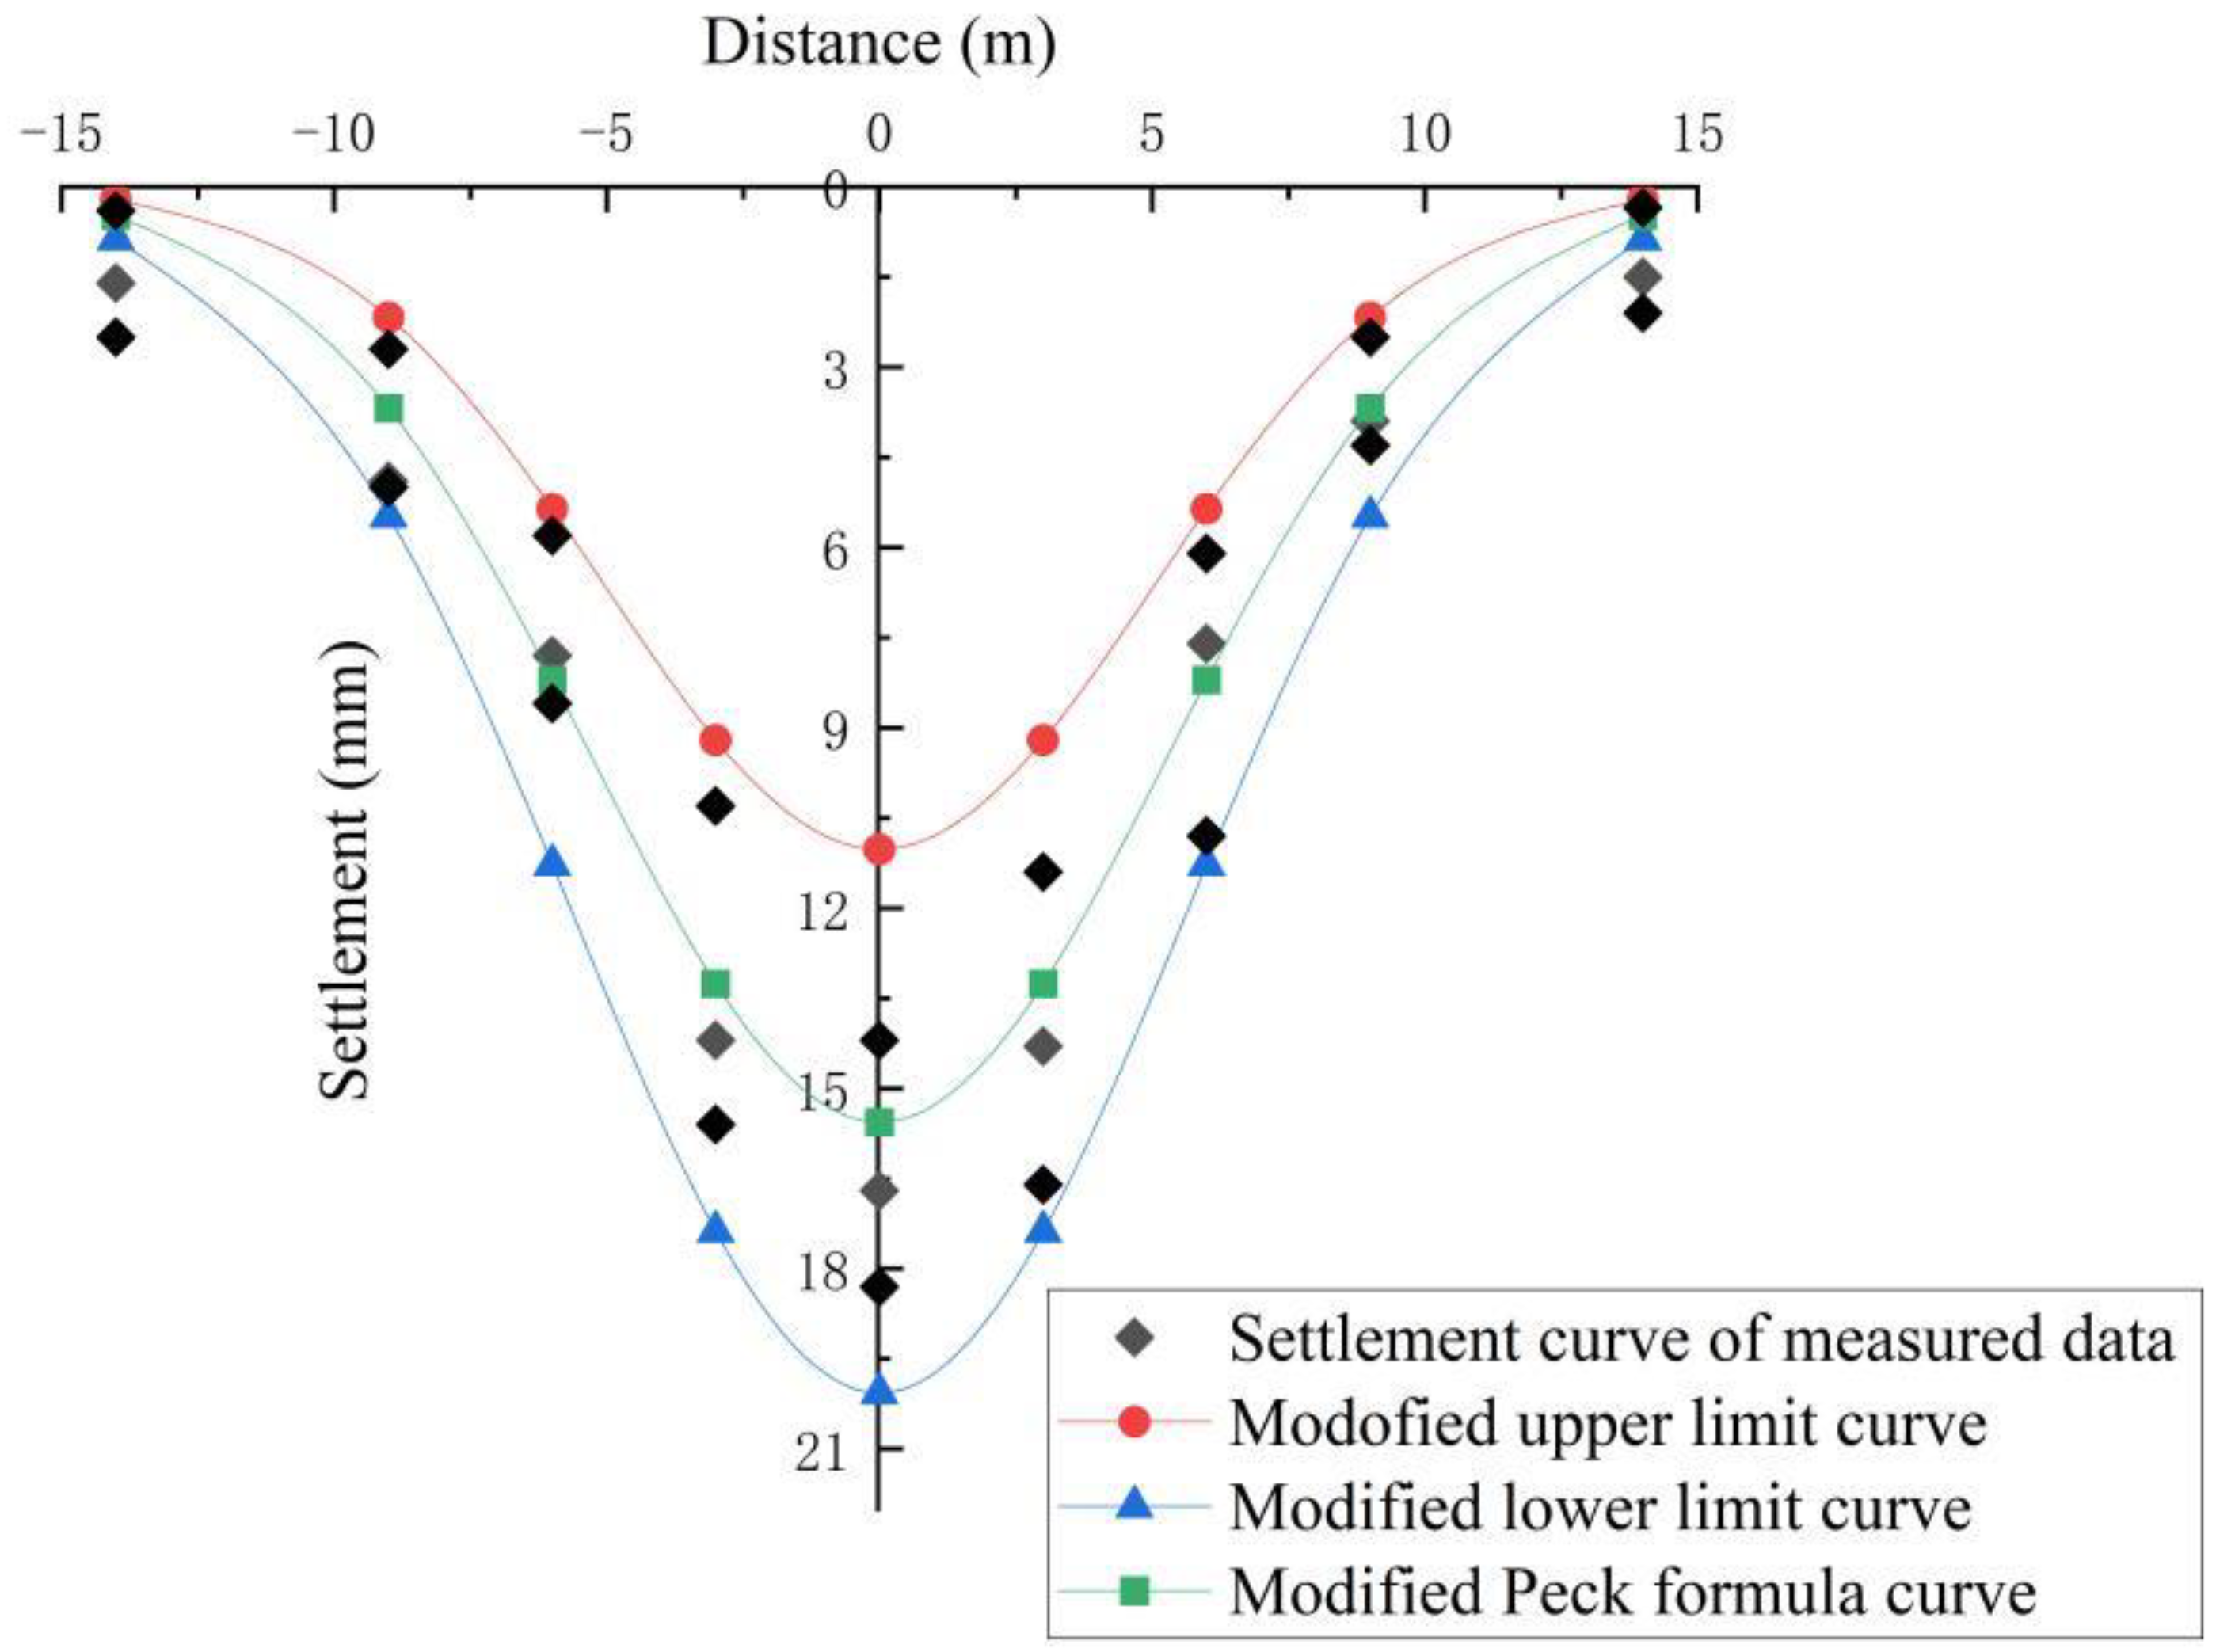
3.4. Parameter Optimization of Peck Formula

In this study, 138 groups of measured data of land subsidence between Mudan Dadao station and Longmen Dadao station of Metro Line 2 were analyzed by means of the calculation program outlined above. The distribution of a ^ and b ^ is shown in Table 4 and Table 5.
Table 4 and Table 5 demonstrate that a ^ between 2.4 and 3.0 accounts for 85.51% of the total statistical results, and b ^ between 0.032 and 0.040 accounts for 88.41% of the total, indicating that a ^ and b ^ within this variation range could better modify the maximum land subsidence value predicted by the Peck formula. By substituting the value range of a ^ and b ^ into Equations (17) and (18), the value ranges of α and β could be obtained, which were 0.379~0.690 and 0.455~0.508, respectively.
When α = 0.379 and β = 0.454, the upper limit curve of the modified Peck formula could be obtained. When α = 0.690 and β = 0.508, the lower limit curve could be obtained. When the correction coefficients were α = 0.535 and β = 0.482, the curve of the modified Peck formula could be obtained. The comparison of the upper limit curve, lower limit curve, prediction curve of the modified Peck formula, and curve of measured data is shown in Figure 7. It can be seen that there was little variation between the measured data curve and the prediction curve, both being between the upper and lower limit curves, indicating an ideal modified result.

4. Conclusions

In this paper, the following preliminary conclusions are drawn from the analysis of the actual measured surface settlement data of Luoyang Metro Line 2.
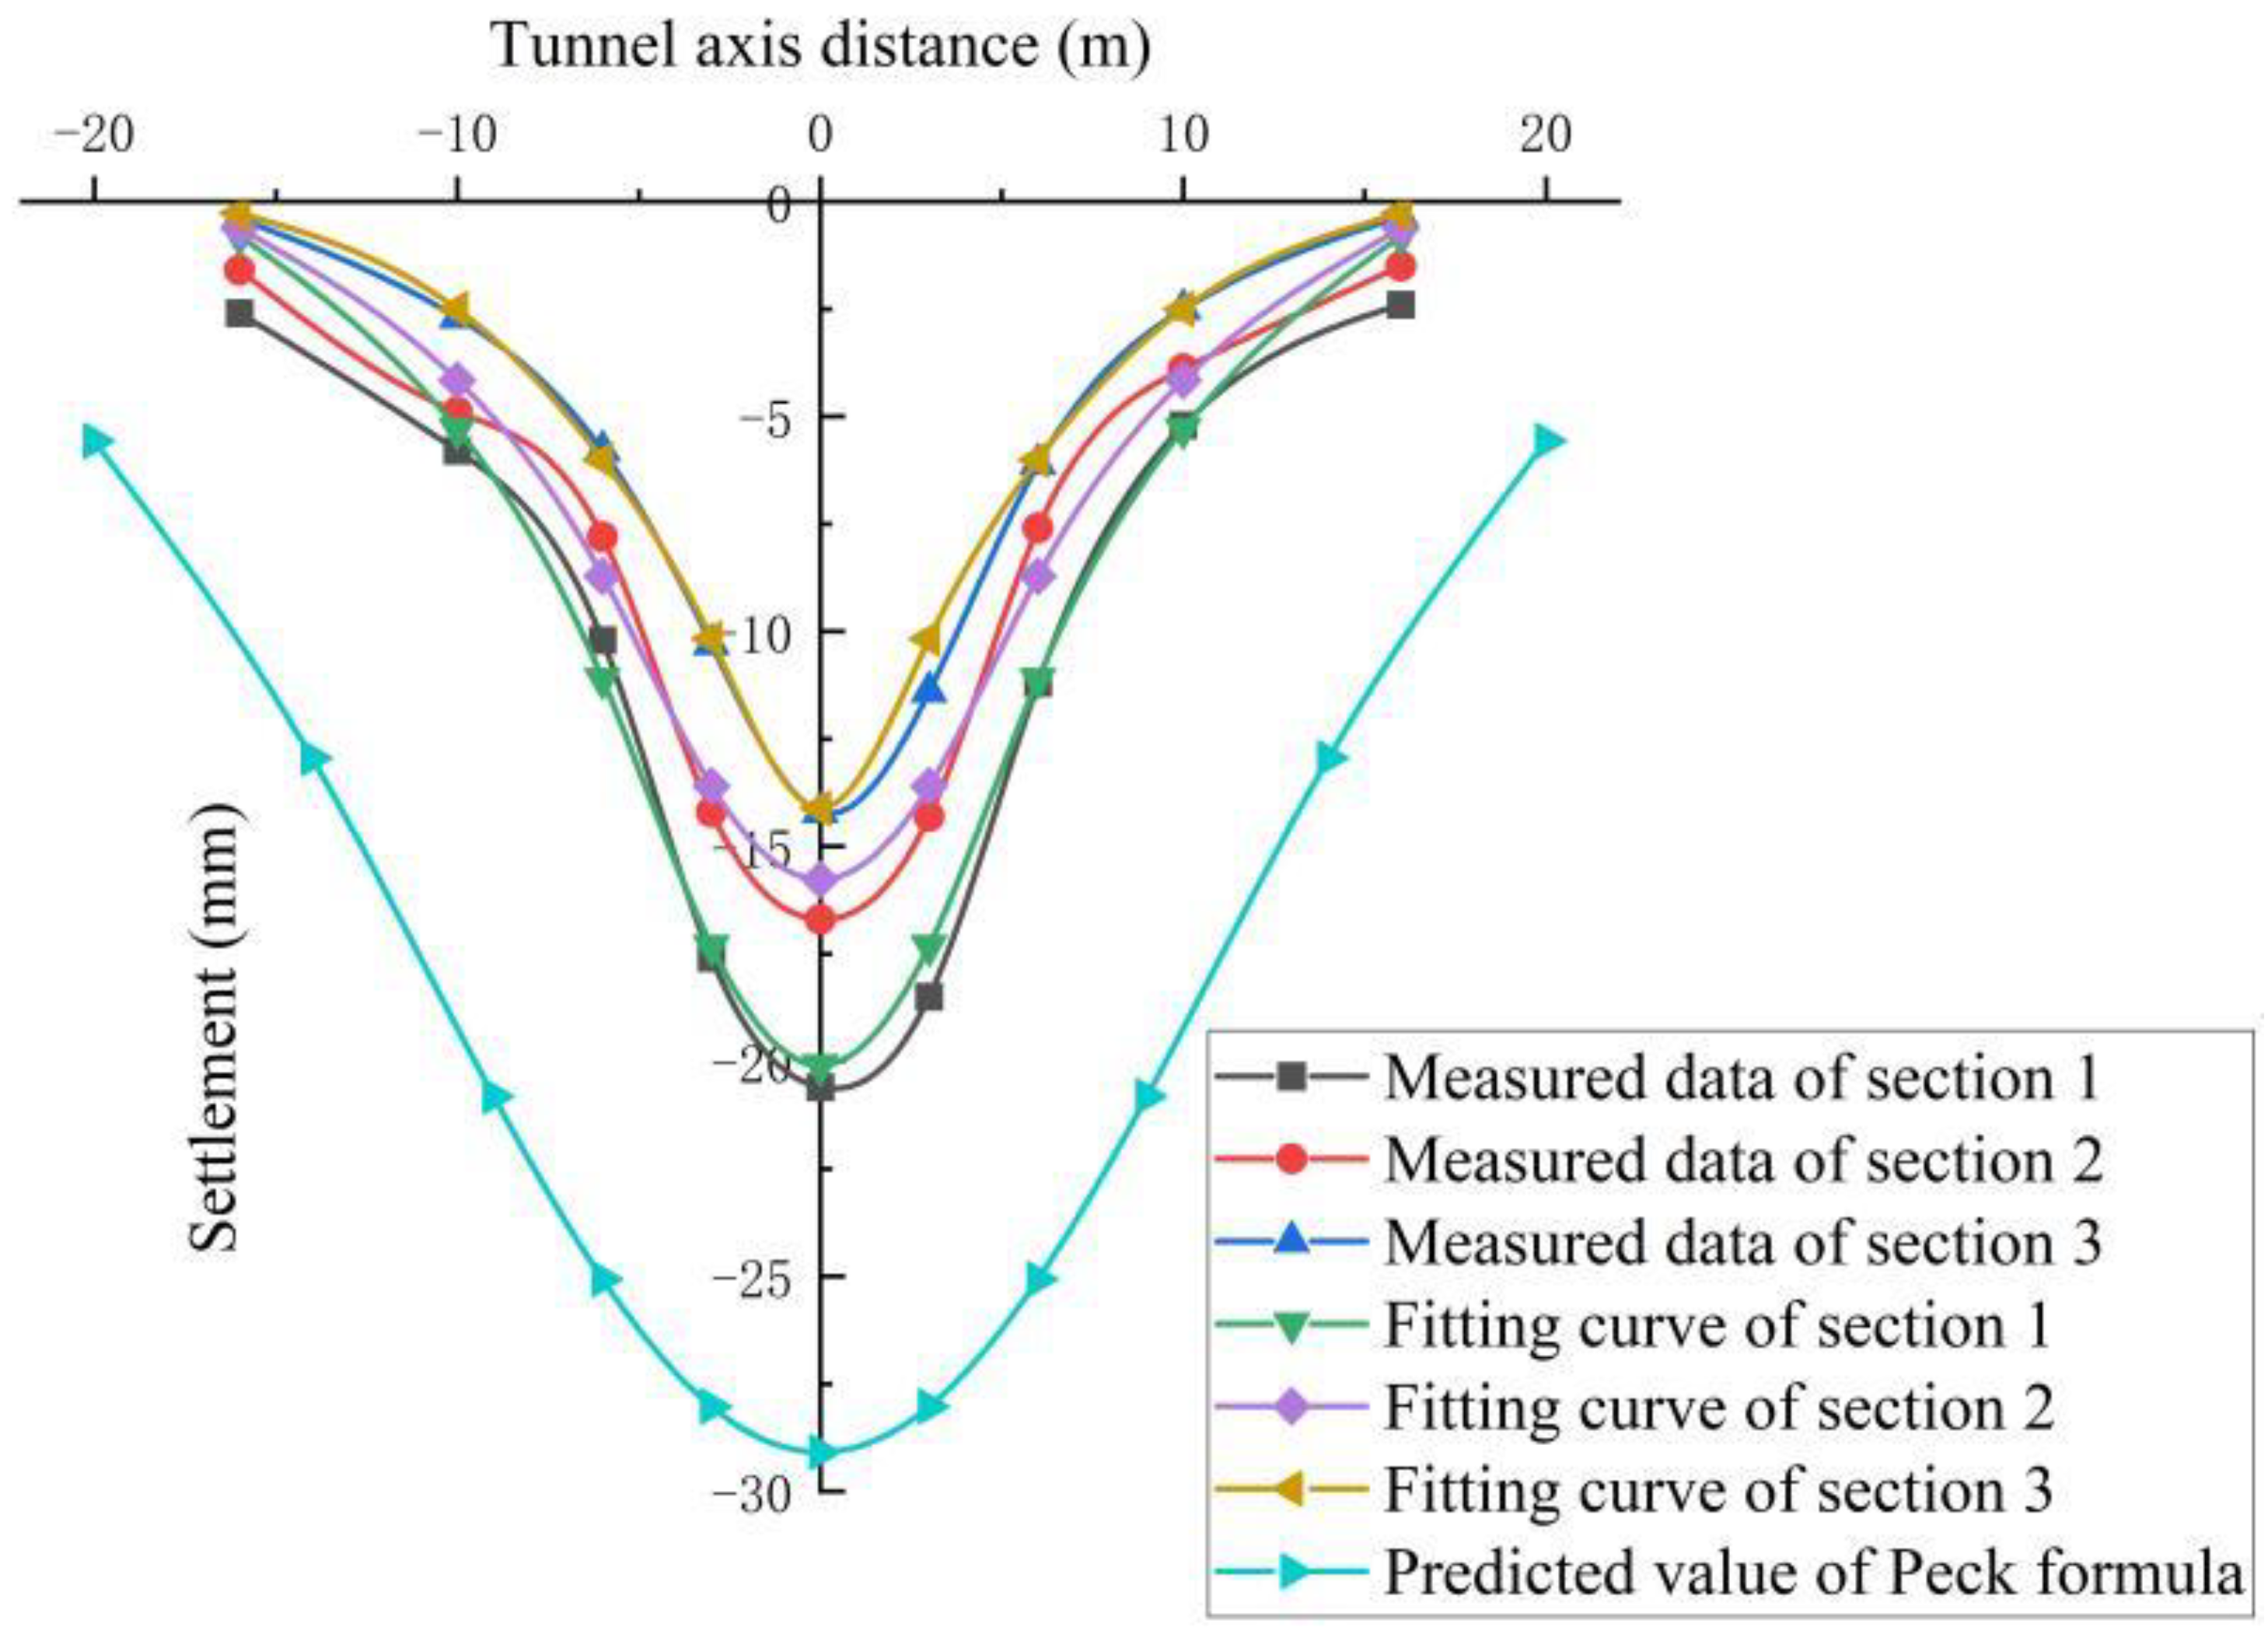
  • In the process of shield tunneling in the water-rich sandy gravel stratum in Luoyang, it was found that the prediction result of the original Peck formula was significantly larger than the measured data, indicating that the Peck formula needed to be modified.
  • Based on the special geological conditions of the water-rich sandy cobble strata, two correction parameters, α and β, were introduced into the original Peck formula to correct for the maximum surface settlement and the width of the settlement trough, respectively.
  • By means of linear regression methods, and in combination with on-site settlement monitoring data, it was determined that when the range values of α and β were 0.379–0.690 and 0.455–0.508, respectively, there was smaller error and more accurate prediction results. The modified Peck formula was especially suitable for tunnels in water-rich sandy cobble strata layers.
  • The current construction of tunnels inevitably causes ground settlement, which impacts the ground and can even cause damage to surrounding buildings, so it is of practical importance to make timely and accurate predictions of ground settlement. In the process of predicting surface settlement, there is a need to collate and process large amounts of predicted data and tedious calculations. The use of a computer programming language to program the calculation of the modified Peck formula can greatly improve the efficiency of the calculation. Under the usual methods, it may take several days to determine α and β, but the application of a batch calculation program mode means that determination of α and β can be completed in just a few minutes. The correction parameters can then be quickly optimized during the subsequent construction process, greatly improving the efficiency and accuracy of the prediction, compared to ordinary manual calculations or semi-automatic modes.

Author Contributions

Conceptualization, Y.G. and Y.L.; methodology, Y.G. and Y.L.; software, Y.G. and C.M.; validation, Y.G. and C.M.; investigation, Y.G. and Y.L. and P.T.; data curation, Y.G. and C.M.; writing—original draft preparation, Y.G.; writing—review and editing, C.M. and Y.L.; project administration, Y.G. and C.M. All authors have read and agreed to the published version of the manuscript.

Funding

This work was supported, in part, by the Scientific research projects funded by the Department of education of Hunan Province (No. 21C0628 and No. 19B447), the National Natural Science Foundation of China (No. 62172182), the Hunan Provincial Natural Science Foundation of China (No. 2020JJ4490), and, in part, by the Philosophy and Social Science Achievement Evaluation Committee of Huaihua (No. HSP2022YB40).

Institutional Review Board Statement

Not applicable.

Informed Consent Statement

Not applicable.

Data Availability Statement

The data used to support the findings of this study are included within the article.

Acknowledgments

The authors thank the anonymous reviewers for their valuable comments.

Conflicts of Interest

The authors declare no conflict of interest.

References

  1. Song, K.Z.; Wang, M.S.; Sun, M. Reliability Analysis of Ground Settlement with Shield Tunnel Construction Based on Peck Formula. J. North. Jiaotong Univ. 2004, 28, 30–33. [Google Scholar]
  2. Peck, R.B. Deep Excavations and Tunneling in Soft Ground. In Proceedings of the 7th International Conference on Soil Mechanics and Foundation Engineering, Mexico City, Mexico, 29 August 1969; Volume 7, pp. 225–290. Available online: https://www.issmge.org/publications/publication/deep-excavations-and-tunneling-in-soft-ground (accessed on 4 November 2022).
  3. Attewell, P.B.; Selby, A.R. Tunnelling in Compressible Soils: Large Ground Movements and Structural Implications. Tunn. Undergr. Space Technol. 1989, 4, 481–487. [Google Scholar]
  4. New, B.M.; O’reilly, M.P. Settlements above Tunnels in the United Kingdom—Their Magnitude and Prediction; Institution of Mining & Metallurgy: London, UK, 1982; pp. 173–181. [Google Scholar]
  5. Hu, C.; Chao, F.; Yuan, M.; Yuan, Y. Modifying of Peck’s Settlement Calculation Formula Related to Metro Tunnel Construction in Xi’an Water-rich Sand. Chin. J. Undergr. Space Eng. 2018, 14, 176–181. [Google Scholar]
  6. Zhang, Q.; Wu, K.; Cui, S.; Yu, Y.; Zhang, Z.; Zhao, J. Surface Settlement Induced by Subway Tunnel Construction Based on Modified Peck Formula. Geotech. Geol. Eng. 2019, 37, 2823–2835. [Google Scholar] [CrossRef]
  7. Hu, Y.; Lei, H.; Zheng, G. Ground movement induced by triple stacked tunneling with different construction sequences. J. Rock Mech. Geotech. Eng. 2022, 14, 1433–1446. [Google Scholar] [CrossRef]
  8. Zhang, P.; Pan, Y.; Yu, Z.; Guan, X.; Wang, G.; An, J.; Lei, H. Ground subsidence characteristics caused by construction of shallow-buried tunnel in a sandy soil composite formation. Arab. J. Geosci. 2020, 13, 901. [Google Scholar] [CrossRef]
  9. Fang, K.; Yang, Z.; Jiang, Y.; Sun, Z.; Wang, Z. Surface subsidence characteristics of fully overlapping tunnels constructed using tunnel boring machine in a clay stratum. Comput. Geotech. 2020, 125, 103679. [Google Scholar] [CrossRef]
  10. Heng, C.; Sun, S.; Zhou, Z.; Zhang, J. Prediction of Surface Settlement with Ultra-shallow-burial and Large Rectangular Cross-section Urban Underpass. KSCE J. Civ. Eng. 2019, 23, 4641–4650. [Google Scholar] [CrossRef]
  11. Zhang, Z.; Chen, J.; Zhang, M.; Yang, X. Modified Peck method of evaluating tunnelling-induced ground movements based on measured data. Arab. J. Geosci. 2022, 15, 862. [Google Scholar] [CrossRef]
  12. Zhou, Z.; Hao, H.D.; Lin, W.M.; Chen, J.; Gong, C. Predictive model for the surface settlement caused by the excavation of twin tunnels. Tunn. Undergr. Space Technol. 2021, 114, 104014. [Google Scholar] [CrossRef]
  13. Luo, W.; Yuan, D.; Jin, D.; Lu, P.; Chen, J. Optimal Control of Slurry Pressure during Shield Tunnelling Based on Random Forest and Particle Swarm Optimization. Comput. Model. Eng. Sci. 2021, 128, 109–127. [Google Scholar] [CrossRef]
  14. Mei, Y.; Zhang, X.; Zhang, S.; Wang, R.; Yang, T.; Zhang, Y. Experimental Study on Shield Tunneling Control in Full Section Water-Rich Sand Layer of Collapsible Loess. Geofluids 2022, 2022, 1–17. [Google Scholar] [CrossRef]
  15. Zhao, J.; Tan, Z.; Yu, R.; Jia, A.; Qu, C. Study on the Mix of Slurry Membrane for Soil Conditioning of EPB Shield and Its Application Effect in Water-Rich Gravel Strata. Adv. Civ. Eng. 2022, 2022, 7751053. [Google Scholar] [CrossRef]
  16. Wang, J.; Zhao, J.P.; Tan, Z.S.; Fu, S.Y. Comparative study on prediction models of EPB shield tunnelling parameters in the water-rich round-gravel formation. In Proceedings of the 2022 5th International Conference on Civil Architecture, Hydropower and Engineering Management, Quanzhou, China, 23–25 September 2022. [Google Scholar]
  17. Li, X.; Zhang, D.; Hou, Y. Analysis of Shield Tunnel Ground Deformation Characteristics and Affecting Factors in Water-Rich Soft Stratum: A Case Study on the Section Tunnel of Tianjin Metro Line 6. Appl. Sci. 2022, 12, 6208. [Google Scholar] [CrossRef]
  18. Yang, Y.; Li, X.; Jin, D.; Jiang, X.; Li, H. Prediction of Ground Surface Settlements Induced by EPB Shield Tunneling in Water-Rich Soft Strata. Appl. Sci. 2022, 12, 4665. [Google Scholar] [CrossRef]
  19. Zhang, Y.Q.; Cao, W.G.; Zhou, S.H. Prediction of three-dimensional subface and subsurface settlement caused by shield tunnelling based on Peck formula. J. Railw. Sci. Eng. 2021, 18, 153–161. [Google Scholar] [CrossRef]
  20. Johansson, R. Numerical Python: Scientific Computing and Data Science Applications with Numpy, SciPy and Matplotlib, 2nd ed.; Tsinghua University Press: Beijing, China, 2019; pp. 56–100. [Google Scholar] [CrossRef]
Figure 1. Ground Settlement Curve.
Sustainability 14 14545 g001
Figure 2. Regression of each section.
Sustainability 14 14545 g002
Figure 3. Comparison between the fitting curve of each section and the Peck formula curve.
Sustainability 14 14545 g003
Figure 4. Procedure Flowchart.
Sustainability 14 14545 g004
Figure 5. MVD Model Structure.
Sustainability 14 14545 g005
Figure 6. Application programming interface.
Sustainability 14 14545 g006
Figure 7. Comparison between curves of modified Peck formula and measured data.
Sustainability 14 14545 g007
Table 1. Regression Analysis of the Monitoring Data in Section 1.
Sample PointAbscissa (x)/mS(x)/mm x 2 2 ln S ( x )
1−142.6−980.956
2−95.8−40.51.758
3−610.2 −182.322
4−317.6−4.52.868
5020.603.025
6318.5−4.52.918
7611.2−182.416
895.2−40.51.649
9142.4−980.875
Table 2. Regression Analysis of the Monitoring Data in Section 2.
Sample PointAbscissa (x)/mS(x)/mm x 2 2 ln S ( x )
1−141.6−980.470
2−94.9−40.51.589
3−67.8−182.054
4−314.2−4.52.653
5016.702.815
6314.3−4.52.660
767.6−182.028
893.9−40.51.361
9141.5−980.405
Table 3. Regression Analysis of the Monitoring Data in Section 3.
Sample PointAbscissa (x)/mS(x)/mm x 2 2 ln S ( x )
1−140.4−98−0.916
2−92.7−40.50.993
3−65.8−181.758
4−310.3−4.52.332
5014.202.501
6311.4−4.52.434
766.1−181.808
892.5−40.50.916
9140.35−98−1.050
Table 4. Probability distribution of a ^ .
Distribution IntervalDistribution ProportionQuantity
2.0~2.21.45%2
2.2~2.46.52%9
2.4~2.618.84%26
2.6~2.845.65%63
2.8~3.021.01%29
3.0~3.25.80%8
3.2~3.40.72%1
2.2~2.46.52%9
Table 5. Probability distribution of b ^ .
Distribution IntervalDistribution ProportionQuantity
0.028~0.0301.45 2
0.030~0.0327.97 11
0.032~0.03425.36 35
0.034~0.03633.33 46
0.036~0.03818.84 26
0.038~0.04010.87 15
0.040~0.0422.17 3
Publisher’s Note: MDPI stays neutral with regard to jurisdictional claims in published maps and institutional affiliations.

