Article

The Effects and Vertical Bearing Capacity of Two Jacked Model Piles in Sand

1
College of Civil Engineering, Henan University of Technology, Zhengzhou 450001, China
2
China Construction Seventh Engineering Division Co., Ltd., Zhengzhou 450004, China
3
College of Civil Engineering, Zhengzhou University of Science and Technology, Zhengzhou 450064, China
4
Geotechnical Engineering Department, Nanjing Hydraulic Research Institute, Nanjing 210024, China
5
College of Civil and Transportation Engineering, Hohai University, Nanjing 210024, China
*
Authors to whom correspondence should be addressed.
Sustainability 2022, 14(21), 14493; https://doi.org/10.3390/su142114493
Submission received: 2 October 2022 / Revised: 25 October 2022 / Accepted: 2 November 2022 / Published: 4 November 2022
(This article belongs to the Section Sustainable Engineering and Science)

Abstract

:
The effects and vertical bearing capacity of two jacked piles in sand are still not well understood, and the mechanism of the adjacent pile’s uplift caused by the jacking pile in a double pile system is especially unclear, but these facets are important to the stability of the jacked pile. In this paper, a series of tests is performed on jacked model piles in sand, where in the influences of the pile length and the driving pile’s speed on the effects and vertical bearing capacity of two jacked piles were studied. The results revealed that the effects and vertical bearing capacity of the two jacked piles were mainly in relation to pile length and influenced by the driving speed. The horizontal displacement of the top of the first jacking pile during the installation of the post-jacking pile was caused by the difference in the stress state of the first jacking pile between the side of the pile’s face and its back side, in which the uplift displacement of the first jacking pile was also involved. The radial stress of the pile increased nonlinearly with the depth under different pile lengths and gradually converged to the passive earth pressure. The ultimate capacity of the double pile is approximately twice that of a single pile, and the ratio of the ultimate capacity of a single pile to the final jacking pressure was approximately 1.04.

1. Introduction

With the widespread application of jacked piles, the research on jacked piles has gradually become a research hotspot in the field of pile foundation engineering. A great deal of research had been carried out around the issues of jacking piles’ effects and bearing capacity characteristics. Regarding the sinking effect of a jacked pile, the main problems include the compression force, the pile end’s resistance during the installation of the pile, the pile’s perimeter soil displacement, the radial stress of the pile, and pile rebound. Most studies show that the jacking pile’s pressure increases nonlinearly with the increasing depth [1,2]. The pile end resistance’s change with the depth is similar to that of jacking pile pressure, and the pile end’s resistance accounts for a large proportion of the pile’s force [3,4]. There is a critical depth such that the pile end’s resistance reaches a critical value [5]. The densification of the soil surrounding piles during the piles’ installation, and the additional stress of the soil surrounding them, increased with depth [1]. Due to the crowding effect of jacking piles, the radial stress of the pile increases nonlinearly alongside the depth, and gradually converges to passive earth pressure [6]; the continuous disturbance of the soil around the pile during the jacking pile process leads to the “degradation phenomenon” of the radial stress of the pile, which is usually considered to be due to the “friction fatigue effect” at the pile–soil interface [7,8,9,10,11,12]. Meanwhile, there is a tendency for the loosening of shallow soil, and the densification of the deep soil surrounding the pile, during the piles’ installation [13,14], which is due to pile rebound. Pile rebound leads to the release of the soil stress around the pile, which causes a significant reduction in the pile sides’ friction resistance [15]. As we all know, the loosening of soil is a benefit to the installation of piles, while the densification of soil is detrimental to the installation of piles, but the tendency for the densification of soil is an advantage to the ultimate capacity of the piles during their installation [16,17,18,19,20,21]. In addition, the relationship between pile rebound and pile length is linear, and the ratio between pile rebound and pile length is constant [6,14]. With respect to the vertical bearing capacity characteristics of a jacked pile, some researchers believed that the ultimate bearing capacity of a jacked pile is correlated with the final pressure of the sunken pile, and the ultimate bearing capacity of a monopile increases nonlinearly with the increase in the pile length [22,23,24,25,26,27,28,29,30,31]; to improve the calculation accuracy of the bearing capacity of a hydrostatic pile, some scholars have also carried out theoretical research on the calculation of the monopile-bearing capacity of hydrostatic piles [32,33,34].
As discussed in the literature, the existing research has mainly focused on the effects and bearing capacity characteristics of a jacked single pile, and it is not clear whether the relevant conclusions obtained are applicable to a group pile foundation. Furthermore, the jacked pile’s foundation is mainly based on a group pile’s foundation, and the influence of the pile-sinking effect and bearing capacity characteristics not only need to be considered in the jacking pile process but also in the pile–pile interaction; in particular, more attention must be paid to the pile uplift phenomenon in the group pile system of jacked piles. Hence, to clarify the pile-sinking effect and bearing capacity characteristics of jacked piles, and to reveal the mechanism of the neighboring pile’s uplift caused by a sinking pile in the double pile system, in this paper, a model test of two jacked piles was carried out by using the self-developed jacking equipment, focused on the influences of the pile length and driving speed on the effects and bearing capacity characteristics of two jacked piles. The changes in the jacking piles’ pressure, the pile end’s resistance, pile rebound, pile uplift, and the horizontal displacement of the top of the pile during the installation of pile were clarified. The radial stress distribution of the surrounding piles along the depth after the jacked piles sunk, the relationship between the pile that sunk first and the bearing capacity of the single pile in the two jacked pile system, and the relationship between the bearing capacity of the double pile and the single pile were determined. The uplift mechanism of the pile that sunk first in the two jacked pile system was revealed.

2. Materials and Methods

2.1. Test Sand

The test sand was Yantai Laizhou sand, which is a richly graded silica sand (SiO2 = 99.9%). The sand had a mean particle size d50 = 0.16 mm, coefficient of curvature Cc of 1.04, and coefficient of uniformity Cu of 1.45. The bulk density ρs of the sand was 1.45 g/cm3, and the gravity γ of sand was 14.22 kN/m3. The maximum dry density ρdmax and minimum dry density ρdmin of the sand were 1.53 g/cm3 and 1.25 g/cm3, respectively. The maximum void ratios emax and minimum void ratios emin of sand were 0.86 and 0.53, respectively. The sand particle size distribution is shown in Figure 1. The sample was prepared by layer installation of the chamber. The total number of layers was 4, the total height of sand was 1 m, and every layer of installation sand weighed 362.5 kg. After the sample was aged for 15 days, the two model piles were installed by an experimental program. The relative density of the prepared sample was approximately 0.75. Each test used fresh sand, and the analysis data consisted of the average of three parallel trials.

2.2. Model Piles

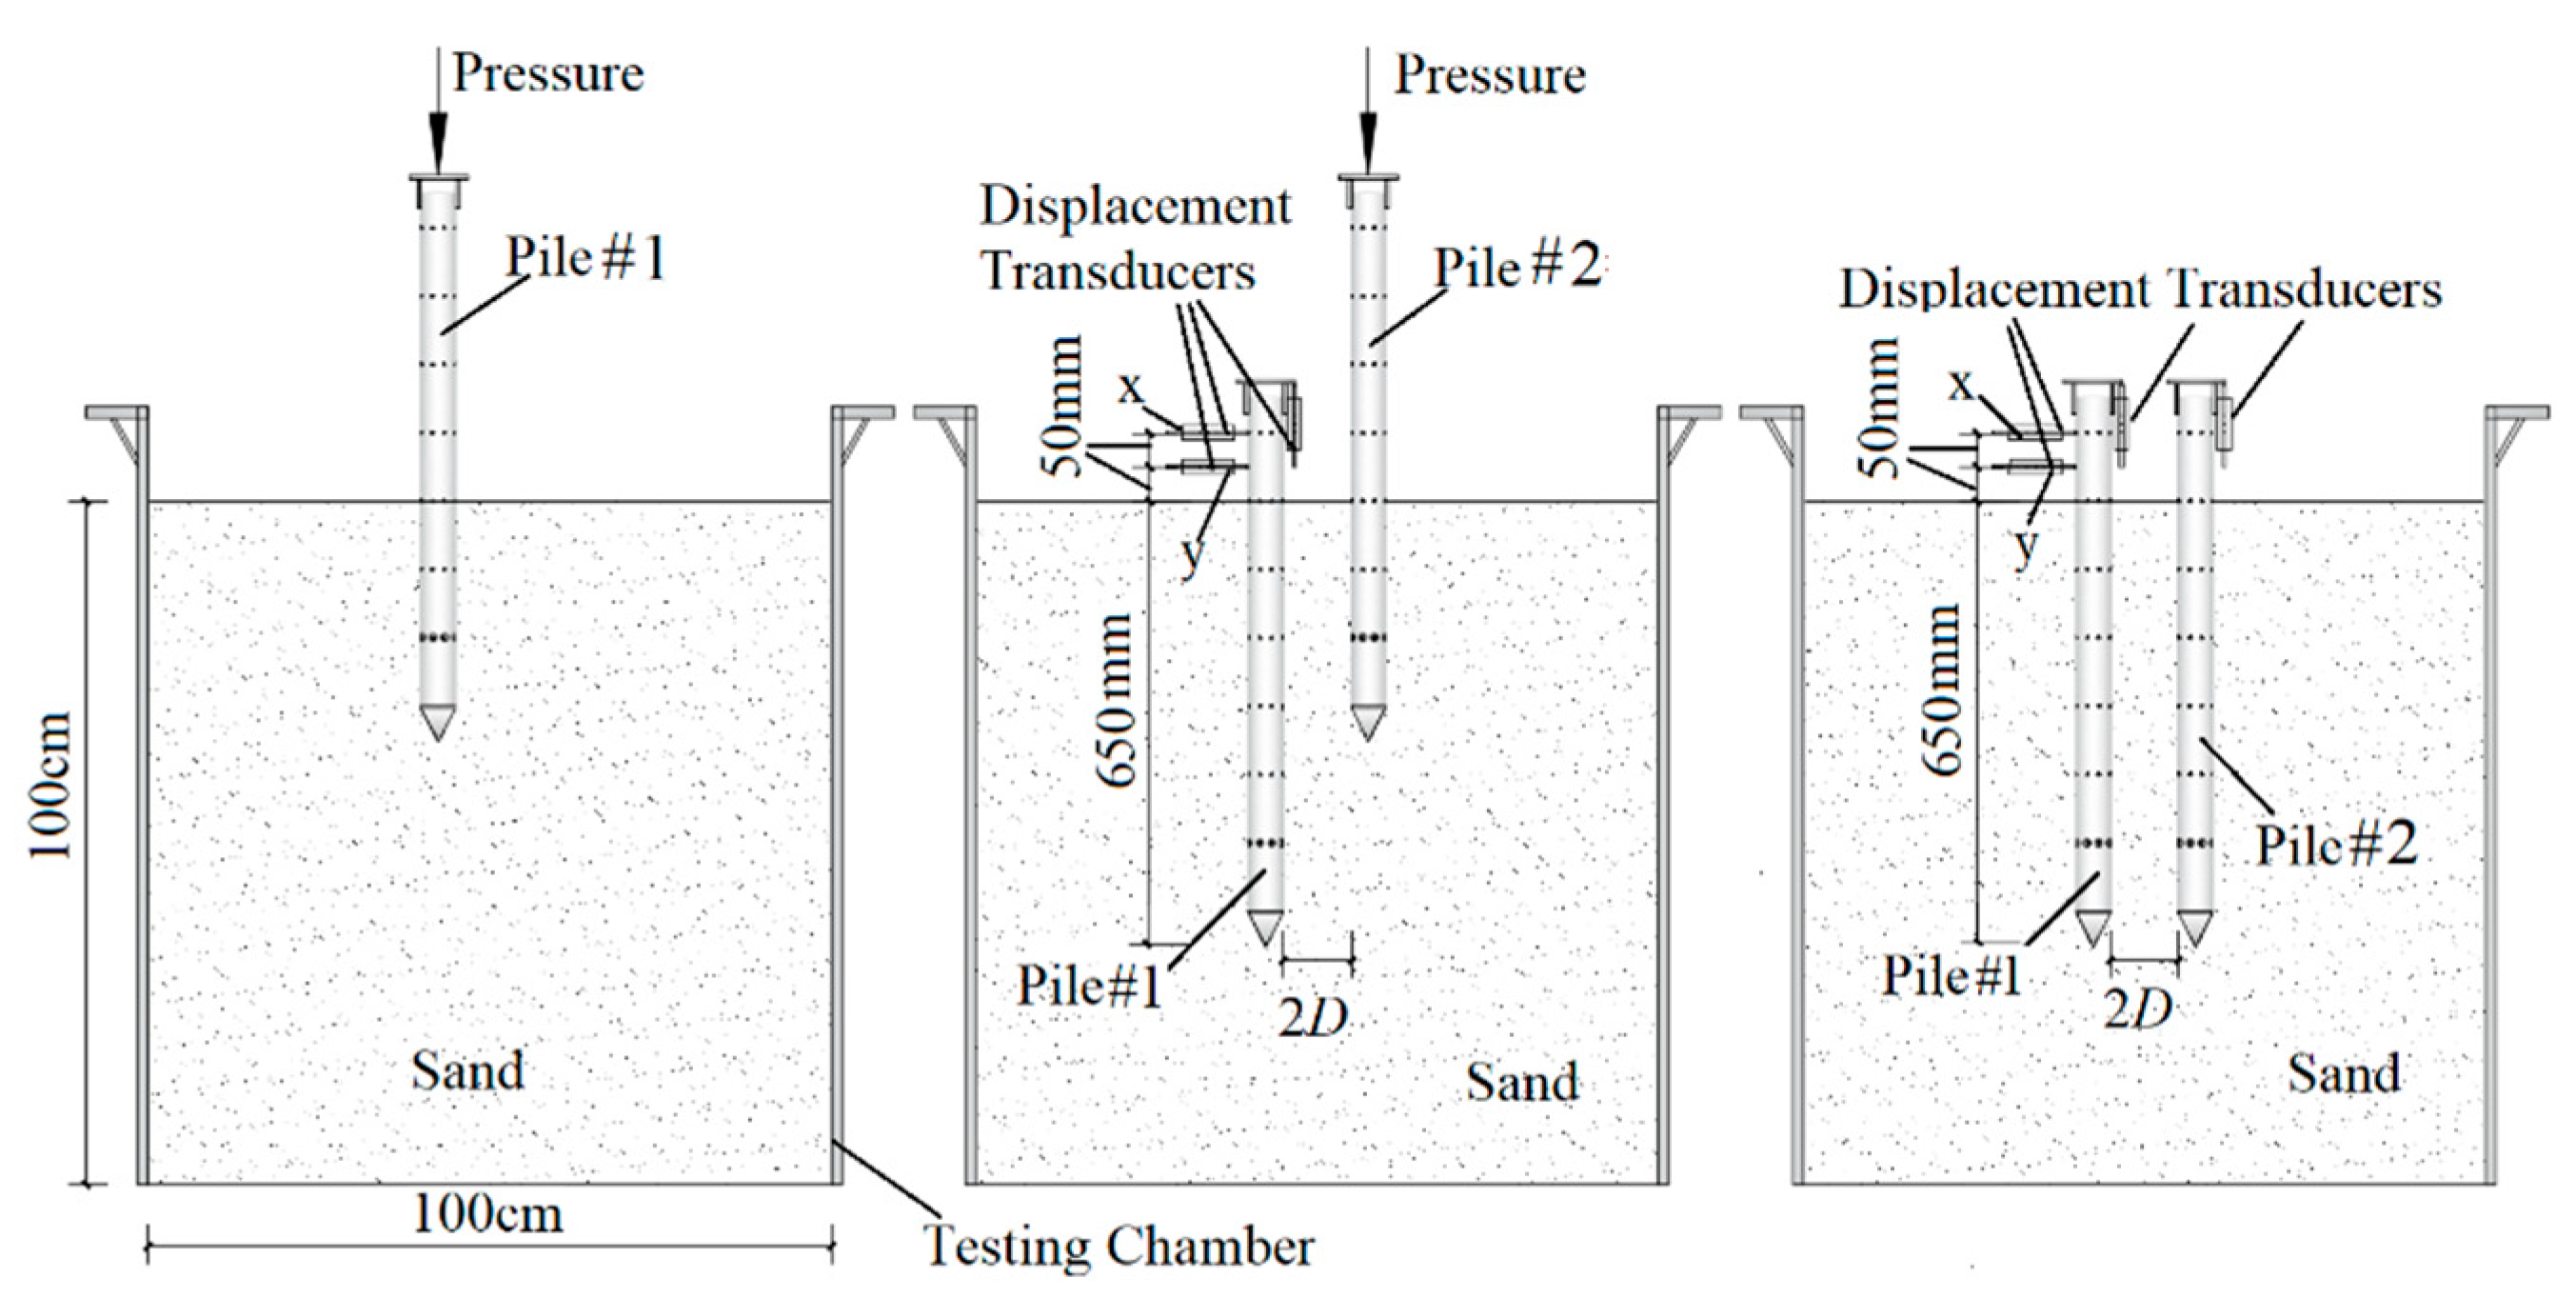
The two model piles used in the tests were tubes constructed from aluminum alloy with diameter D = 5 cm, a length of 75 cm, a wall thickness of 0.5 cm, and conical tips with a 45° apex angle (refer to Figure 2). The two model piles have an elastic modulus of 6.5 GPa and a Poisson’s modulus of 0.33. The locations of the end pressure cells for both piles are indicated in Figure 2. The capacity of the end pressure transducers for both piles is 20 kN. Type BW-3 pressure transducers with a diameter of 1.1 cm, thickness of 0.48 cm, and capacity of 200 kPa~400 kPa were used. The locations and capacity of the pressure transducers for both piles are indicated in Figure 2 (the pressure transducers are arranged in 7 sections from A to G and 8 pressure transducers are arranged in every section). The locations of the displacement transducers for both piles are indicated in Figure 2. The displacement transducers are characterized as type YHD-50 with a capacity of 5 cm. The Donghua DH3816N static stress and strain acquisition system was selected to collect data on pressure and displacement. The boundary ratio between the width (the minimum net spacing between model pile and the sides of chamber) and the model pile’s diameter was 8, which was much larger than the theoretical boundary requirement of approximately 3, and could effectively eliminate the boundary effect in the model test. Model piles and sand particle sizes were scaled down based on the full-size pile and road foundation, and the model’s scale was 1:25.

2.3. Test Equipment

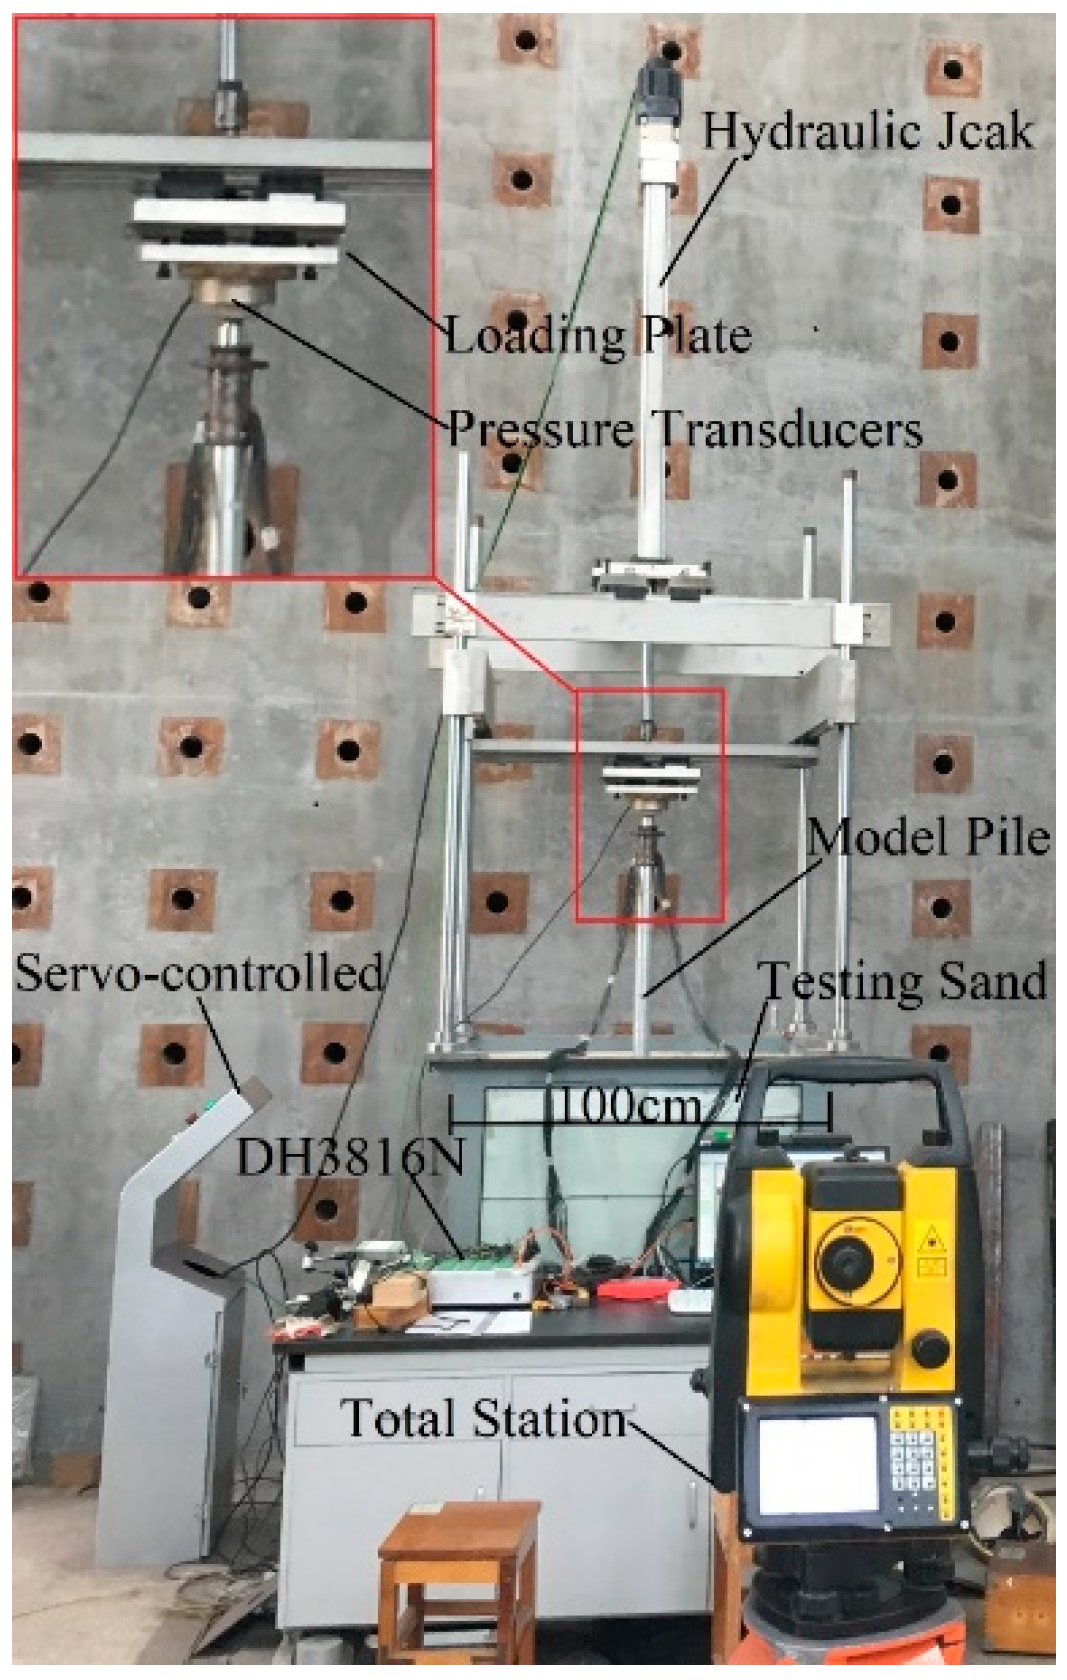
The model-testing equipment was developed by the College of Civil Engineering and Architecture, Henan University of Technology. The components of the system used to perform the tests comprised a hydraulic jack, a servo-controlled system, a square chamber, instrumented model piles, static stress and strain acquisition systems, and four displacement transducers. The sides of square chamber consisted of a steel plate and three tempered glass square chamber sides. The internal sizes of square chamber were 1 m × 1 m × 1.35 m. Installation of the end load plate pressure transducers between the frame rail plates and hydraulic jack is indicated in Figure 3. The hydraulic jack-based installation of the frame rail plates is indicated in Figure 3. The hydraulic jack was operated by a servo-controlled system controlled with respect to load (monotonic or cyclic), driving speed, or displacement. The capacity of the hydraulic jack is 30 kN. The maximum driving speed vmax and minimum driving speed vmin of the hydraulic jack are 10 mm/s and 0.01 mm/s, respectively. The hydraulic jack’s stroke was 1 m, and the valid stroke was 0.55 m.

2.4. Test Program

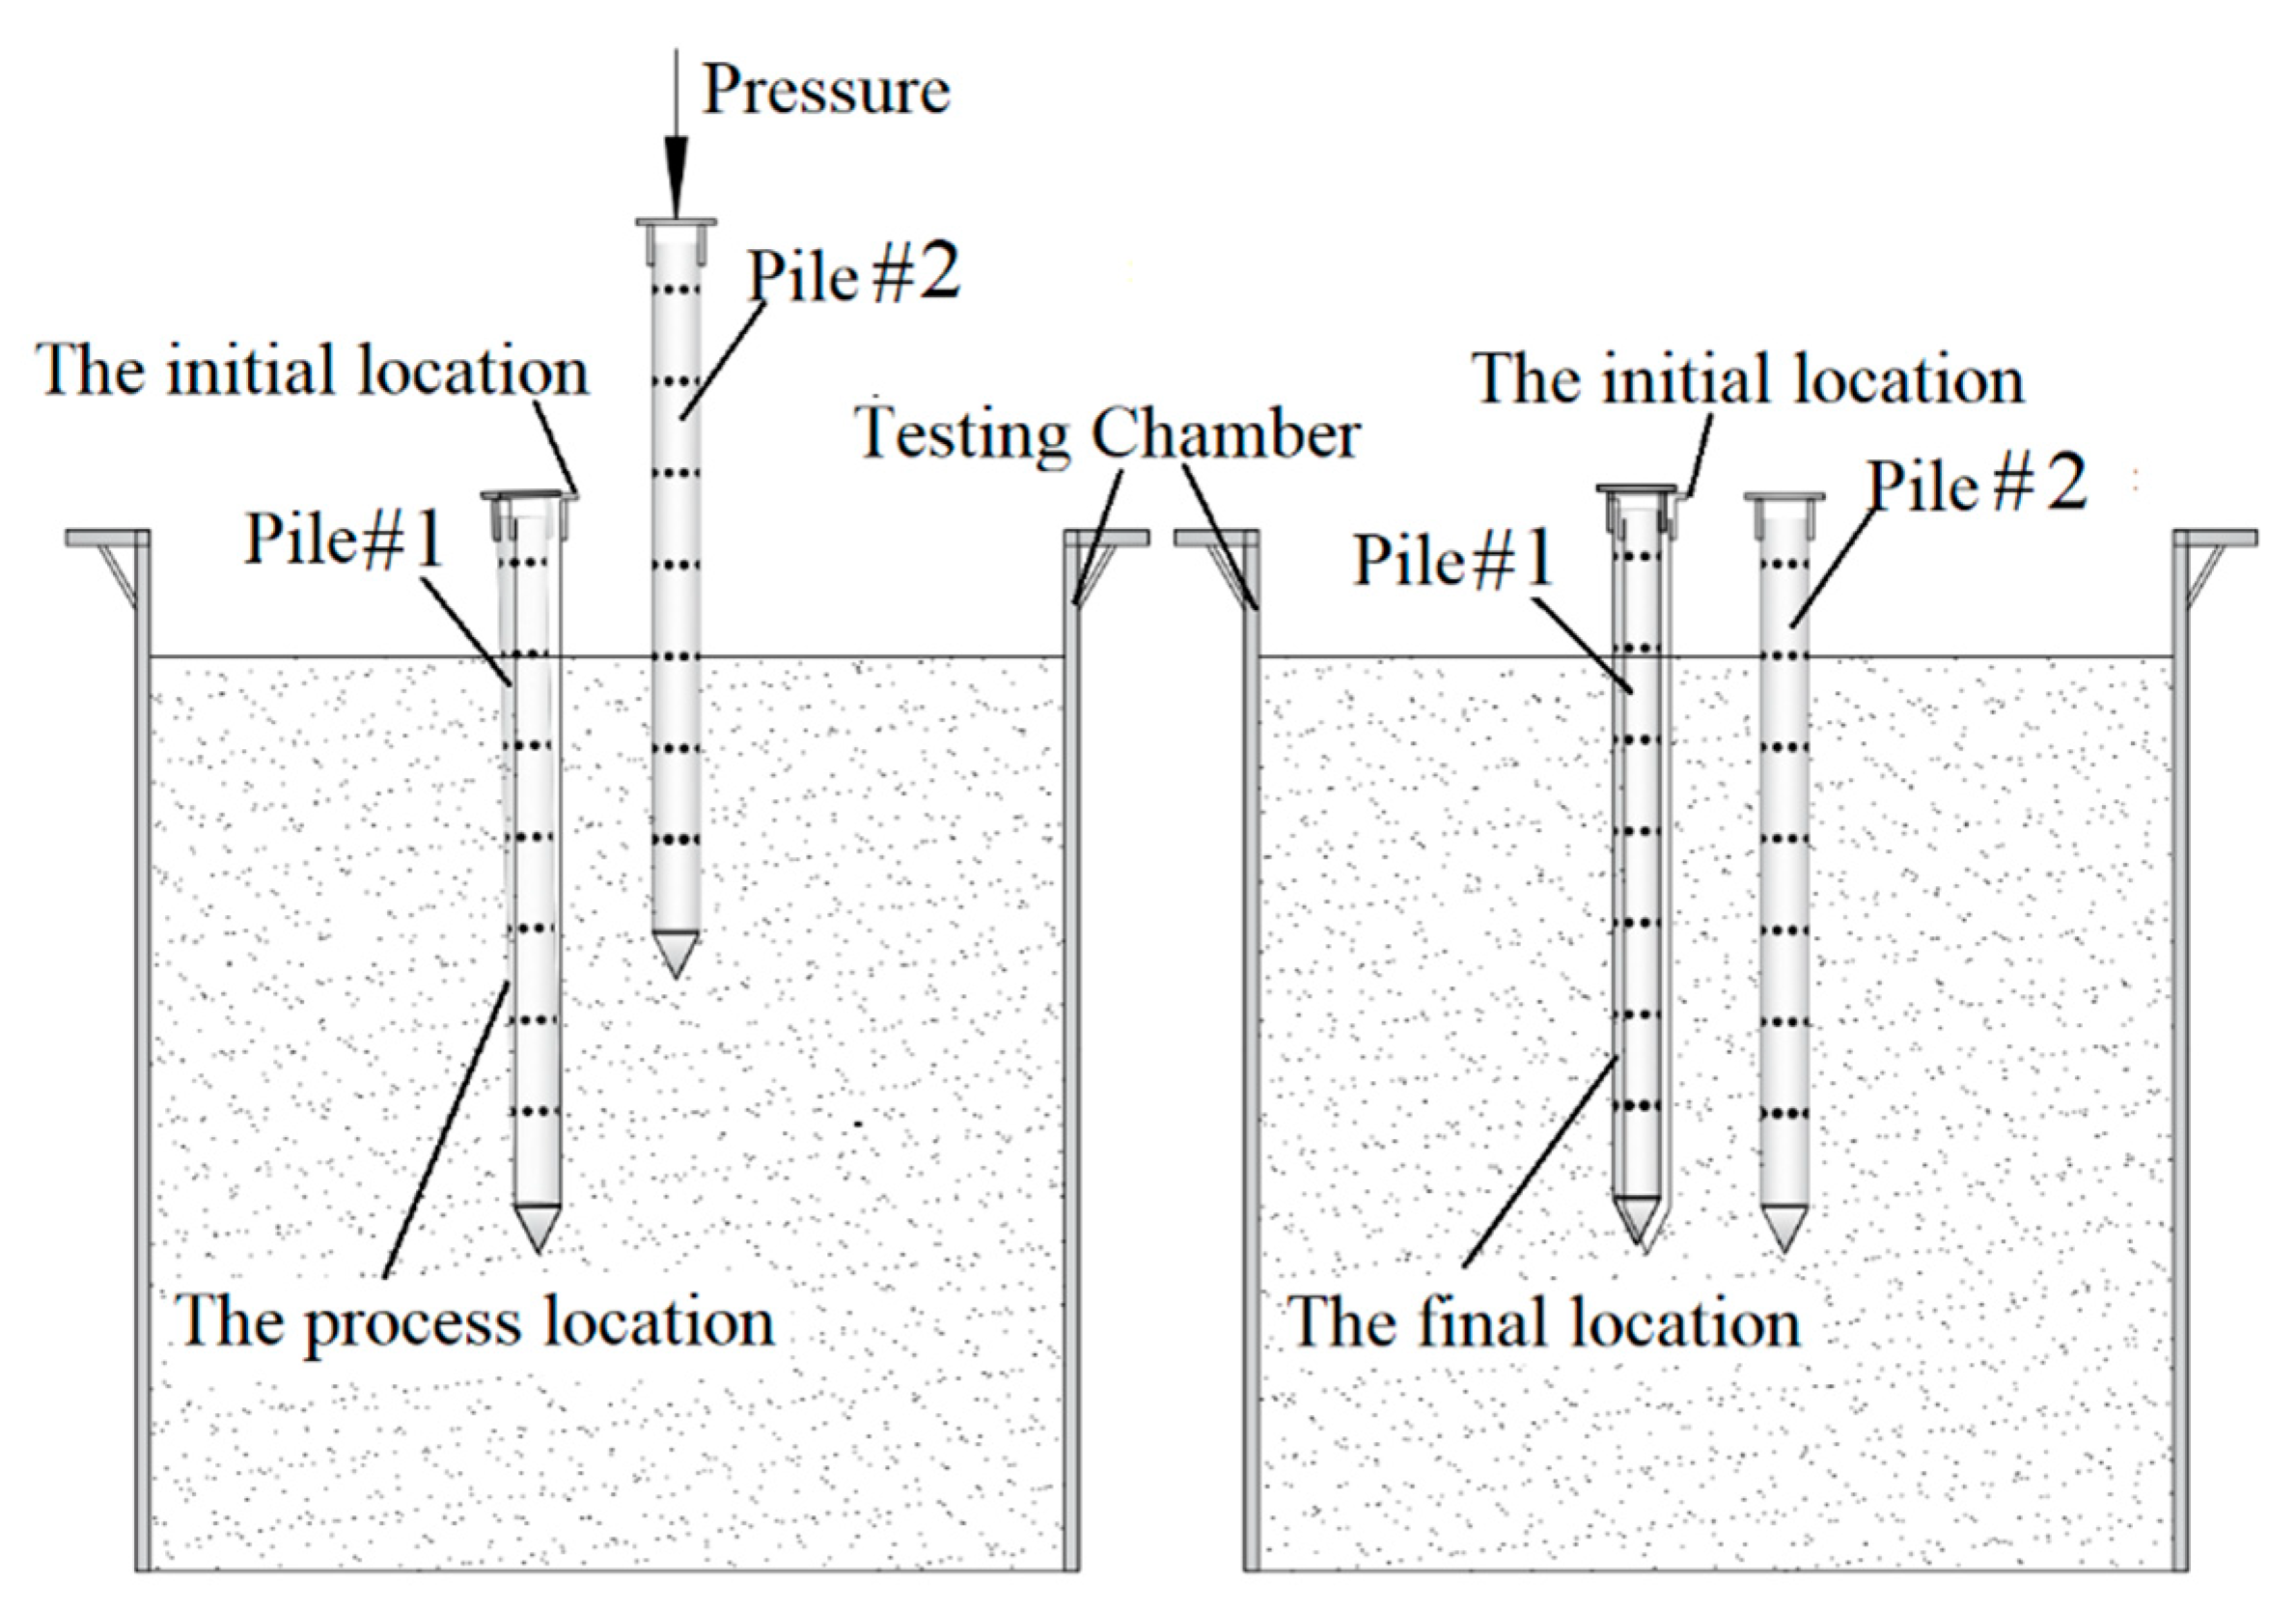
According to the continuous pile-sinking and segmented pile-sinking procedures commonly used in practical engineering, in this test, the continuous pile-sinking procedure was adopted for the pile with a length less than 12 D, and the segmented pile-sinking procedure was used on the pile with a length greater than 12 D. In the segmented pile-sinking process, the pile was first sunk into 50% of the pile length and then the remaining 50%, which was divided into two sections. In the meantime, the method of pile sinking in practical engineering was adopted for the model test. After the model pile was installed, the speed of the loading plate boosts was set to 0.01 mm/s. The loading plate speed was controlled by the servo-controlled system. The experimental program is listed in Table 1, and the installation processes of the two model piles are indicated in Figure 4.

3. Results and Discussion

3.1. The Effects of Jacked Piles

3.1.1. Jacking Pile Pressure

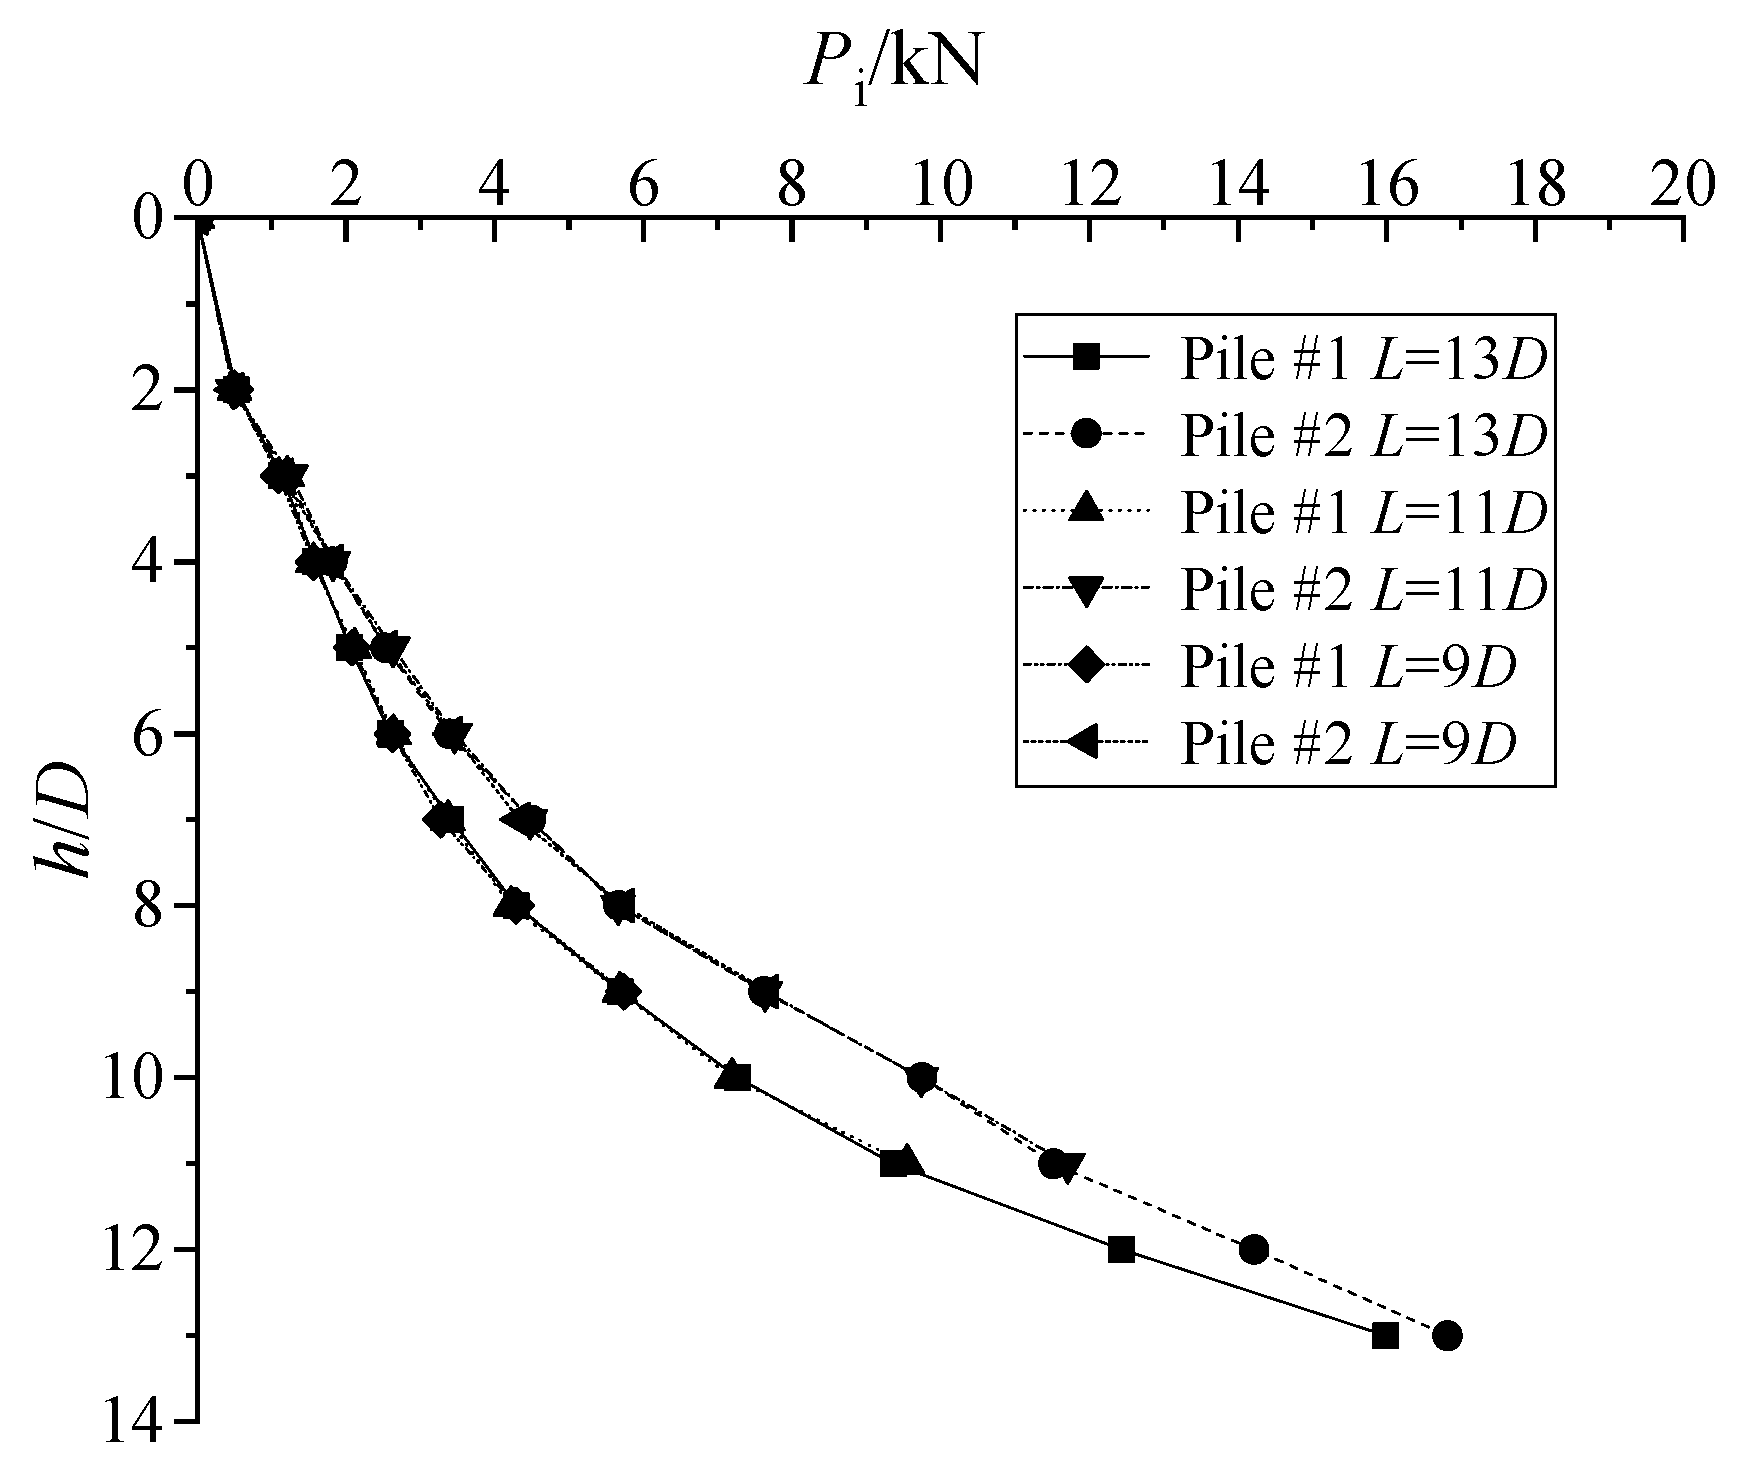
The jacking pile pressure at different pile lengths is shown in Figure 5. Pile #1 is the first jacking pile, and Pile #2 is the post-jacking pile. As shown in Figure 5, the jacking pile pressure increases nonlinearly with the pile’s length. For Pile #1, as the pile length increased from 9 to 11 and 13 D, the jacking pile pressure increased by 67% and 179%, respectively. At the same depth, the jacking pile pressure is the same for different pile lengths, and the jacking pile pressure of Pile #2 is significantly higher than that of Pile #1. This is because the initial conditions for the installation of the piles under different pile lengths were the same, and the densification of the surrounding soil during the installation of Pile #1 influenced the installation of Pile #2. Meanwhile, at the depths of 9, 11, and 13 D, the jacking pile pressure of Pile #2 increased by 34%, 23%, and 5%, respectively, compared with that of Pile #1; this means that the difference in the jacking pile pressure between Pile #1 and Pile #2 decreased with the increasing pile length, which was due to the densification of the soil surrounding the pile having reached the critical state with the increasing pile length during the pile-jacking process.
The jacking pile pressures for different driving speed conditions with the same model pile are shown in Figure 6. Figure 6 shows that the jacking pile pressure increases nonlinearly with depth for different driving speeds and increases with an increasing driving speed for the same depth. In the case of Pile #1, at the depth of 13 D, the driving speed increases from 0.1 to 0.25, 0.5, 0.75 and 1 mm/s, while the jacking pile pressure increases by 4%, 6%, 8%, and 10%, respectively. As we all know, the disturbed soil area increases with the increasing driving speed during installation of pile. Hence, the jacking pile pressure is lager at a high driving speed for the installation of the pile.

3.1.2. Pile End’s Resistance during Installation of Pile

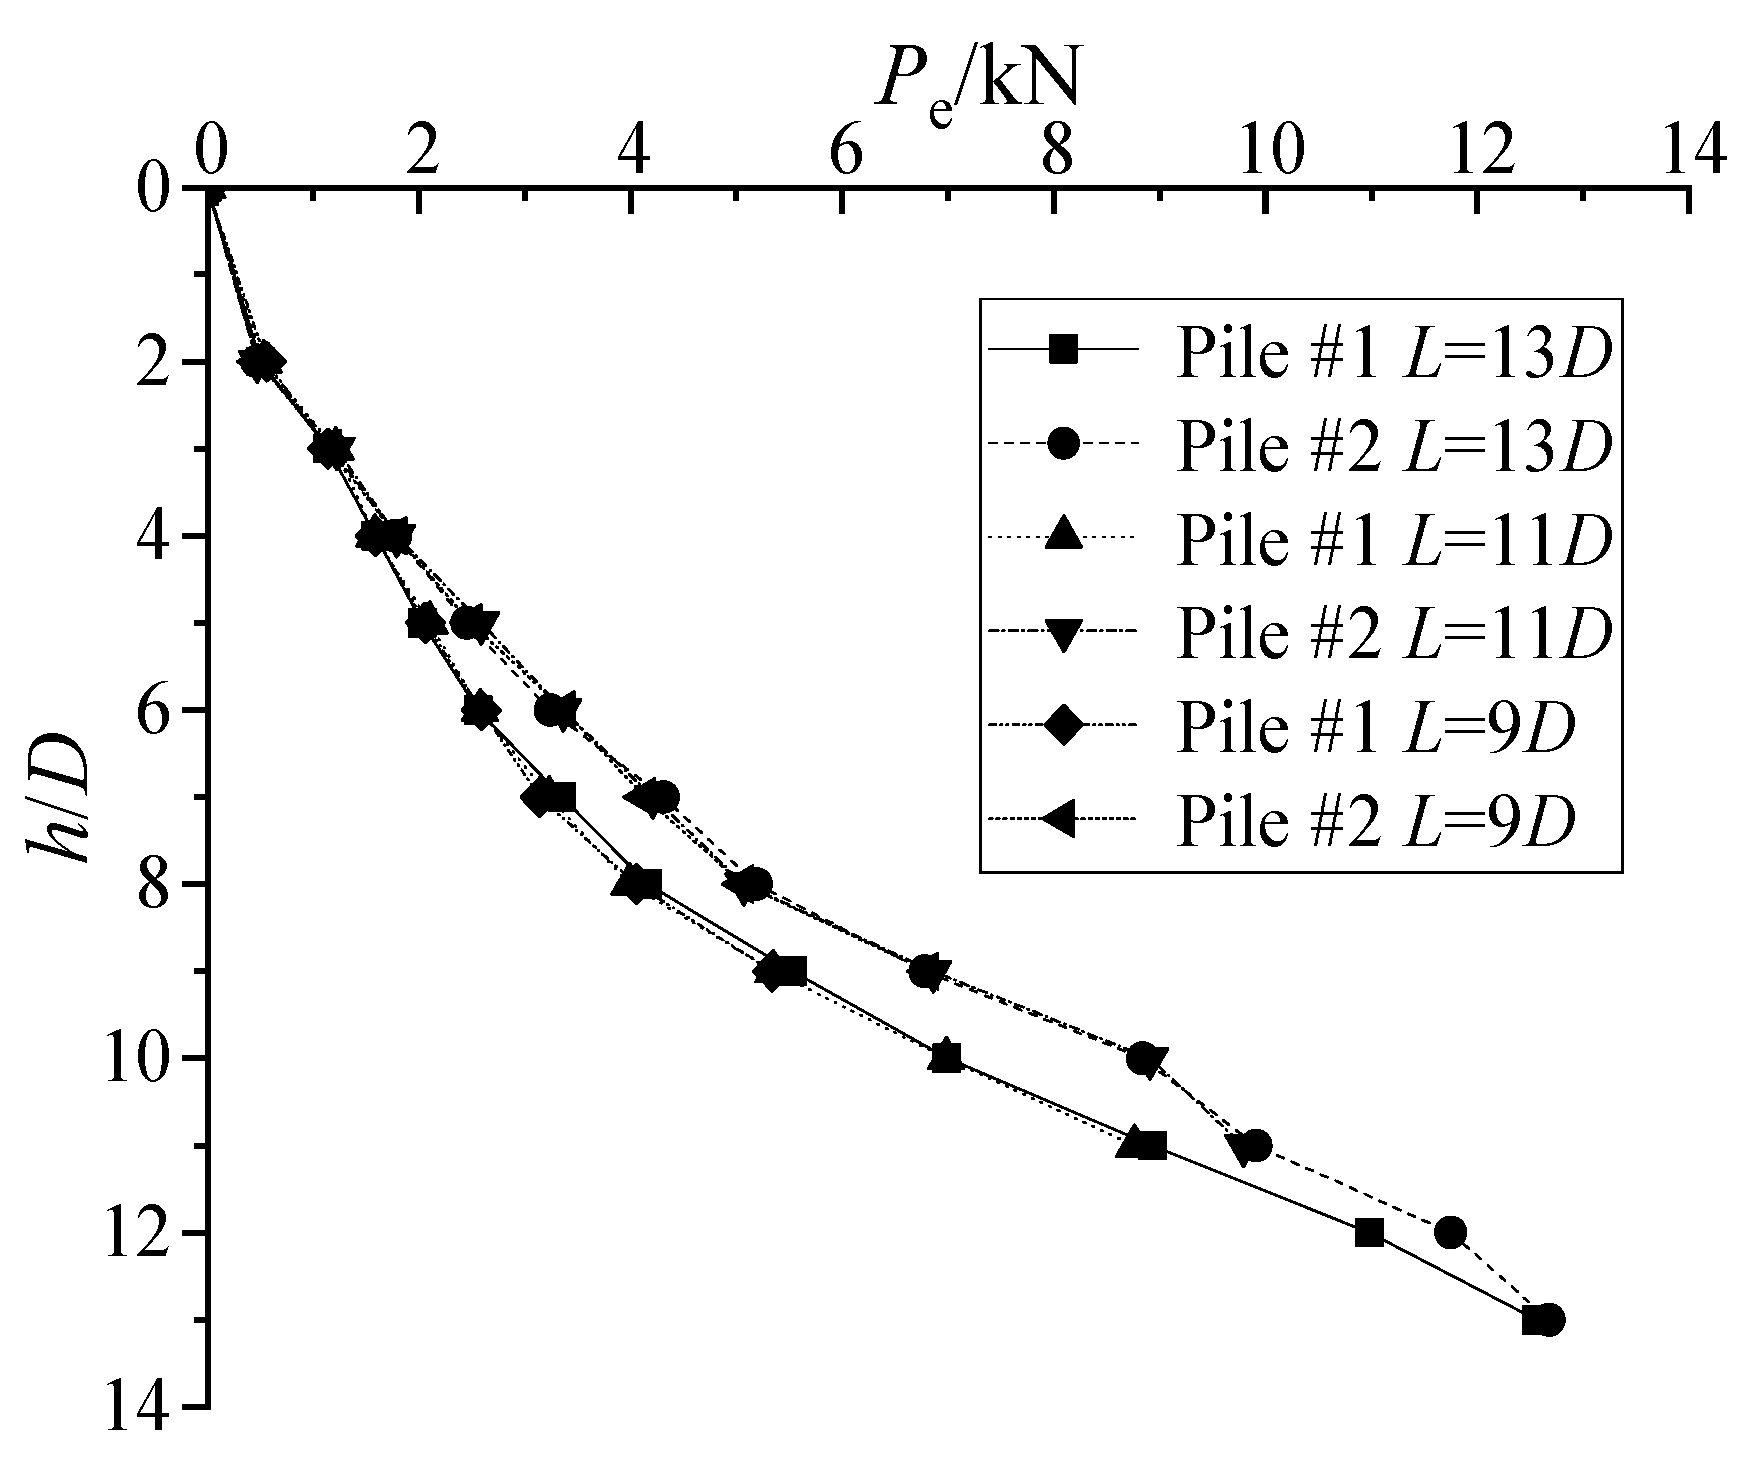
Figure 7 shows the pile end’s resistance at different pile lengths. As shown in Figure 7, the pile end’s resistance grows nonlinearly with the depth and increases with the increasing pile length. Taking Pile #1 as an example, the pile end’s resistance increases by 64% and 135%, respectively, when the pile length increases from 9 to 11 and 13 D, which was due to the overburden of the pressure on the soil at the pile end that gradually increased with the increasing pile length, while the failure resistance of the soil at the tip of the pile increased. Meanwhile, at the same depth, the pile end’s resistance is the same for different pile lengths, and the pile end resistance of Pile #2 is significantly higher than that of Pile #1. At the depths of 9, 11, and 13 D, compared with Pile #1, the pile end’s resistance of Pile #2 increases by 28%, 12%, and 1%, respectively, which is similar to the change rule regarding the jacking pile pressure. In addition, the ratio between the pile end’s resistance and the jacking pile pressure decreased with the increasing pile length. For Pile #1, at the pile lengths of 9, 11, and 13 D, the ratios between the pile end’s resistance and the jacking pile pressure is 0.93, 0.92, and 0.75, respectively. This is because the pile end’s resistance reached the critical state with the increasing pile length, and the pile’s skin friction resistance gradually increased.
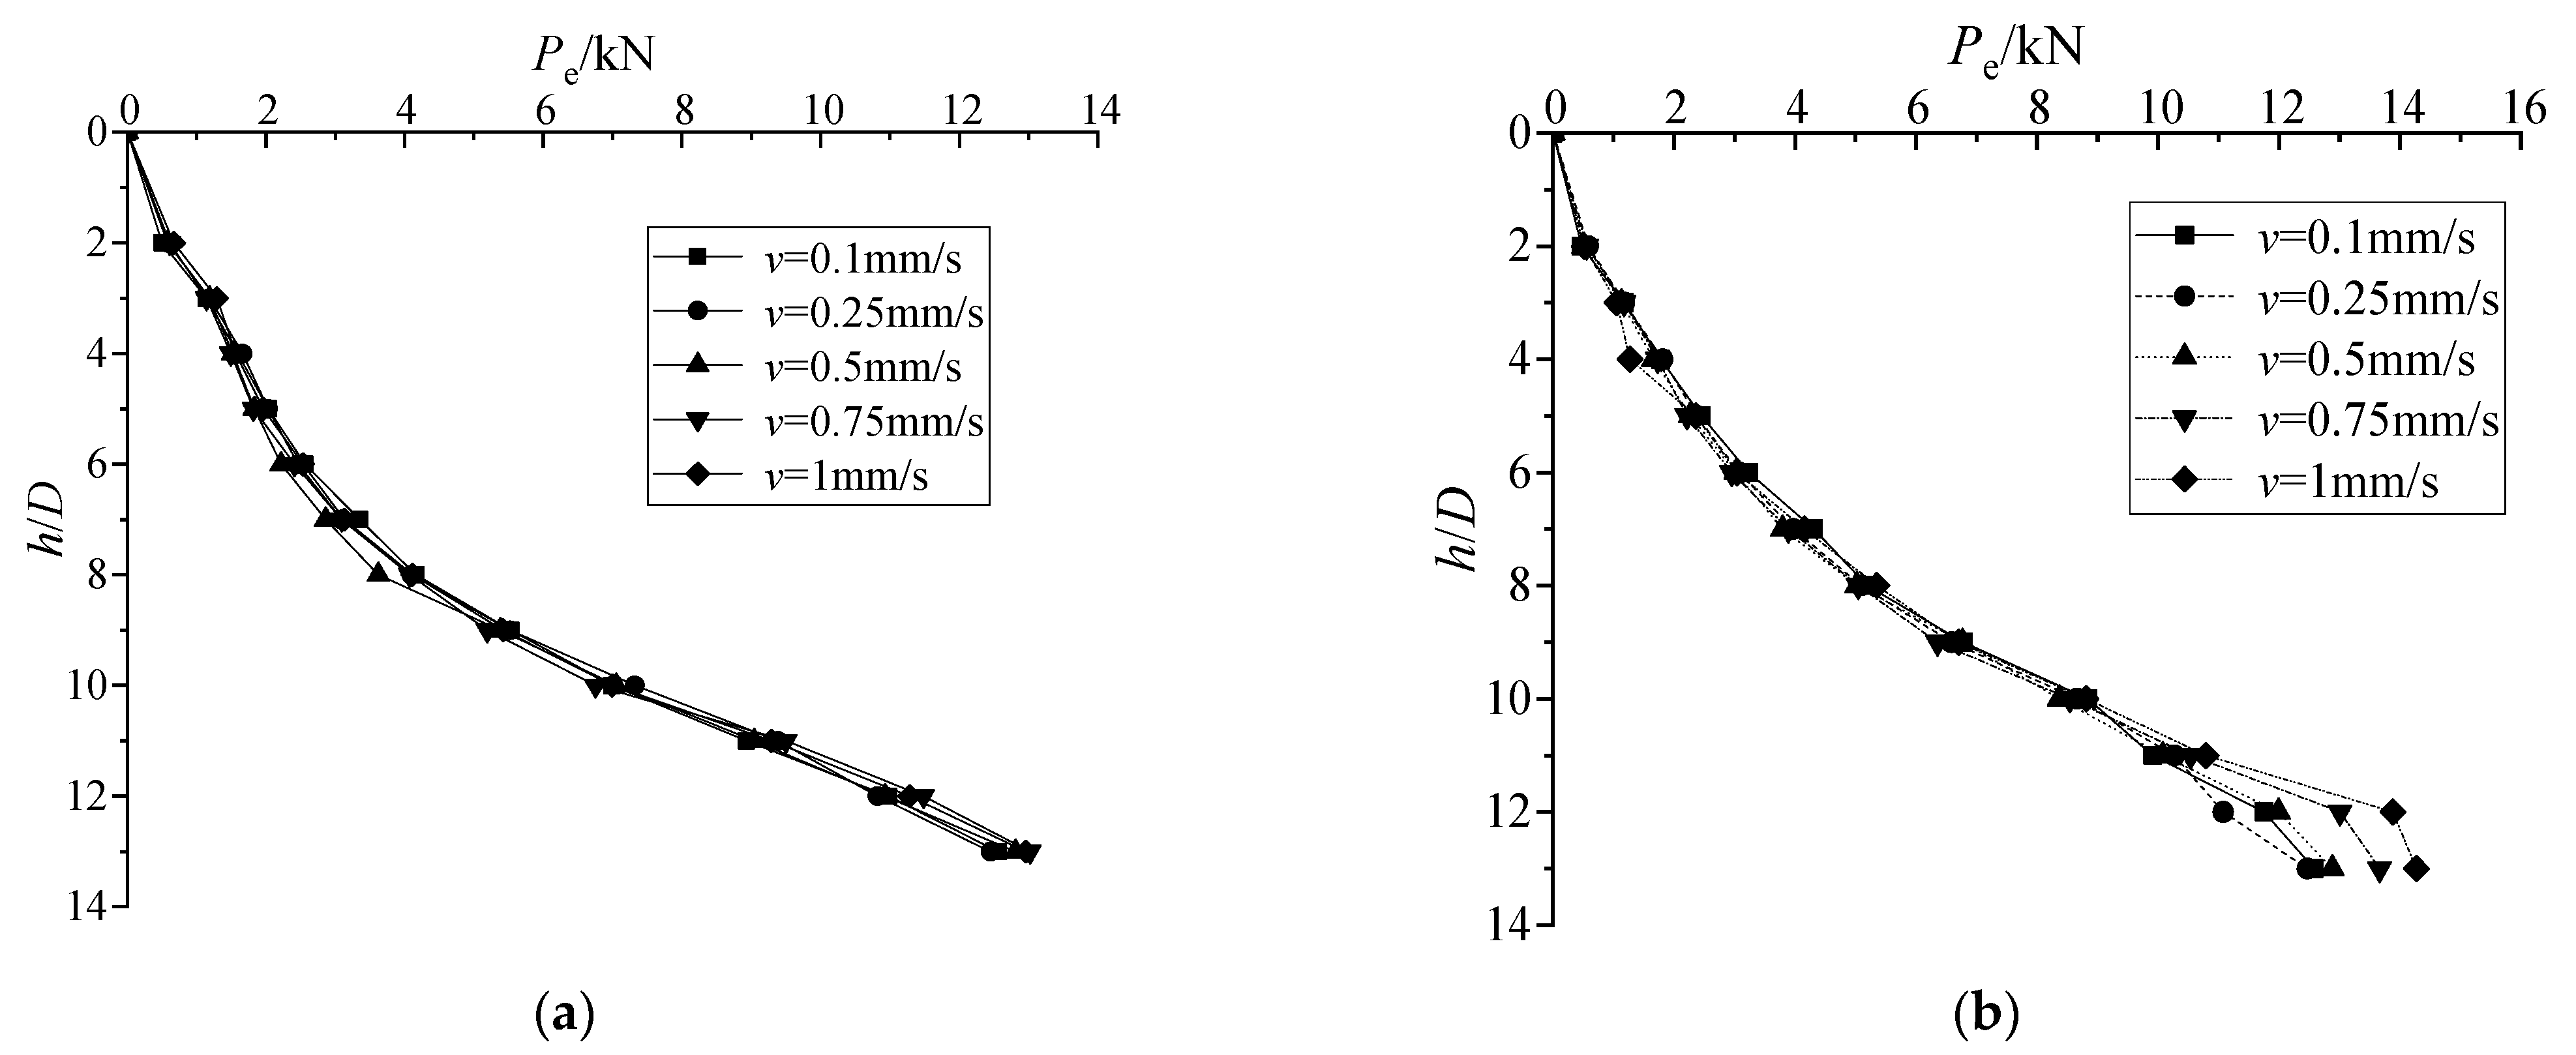
The pile end resistance for different driving speed conditions with the same model pile are shown in Figure 8. According to Figure 8, the pile end’s resistance increased with the depth under different driving speeds and decreased and then increased with the increasing driving speed at the same depth. Therefore, a suitable driving speed exists, which is conducive to reducing the pile end’s resistance. In the case of Pile #1, the driving speed increased from 0.1 to 0.25, 0.5, 0.75, and 1 mm/s, while the pile end’s resistance of Pile #1 increased by −1%, 2%, 4%, and 3%, respectively, which means that the driving speed of 0.25 mm/s is the suitable driving speed. Moreover, the ratio between the pile end’s resistance and the jacking pile pressure decreased with the increasing driving speed.

3.1.3. Pile Rebound Displacement

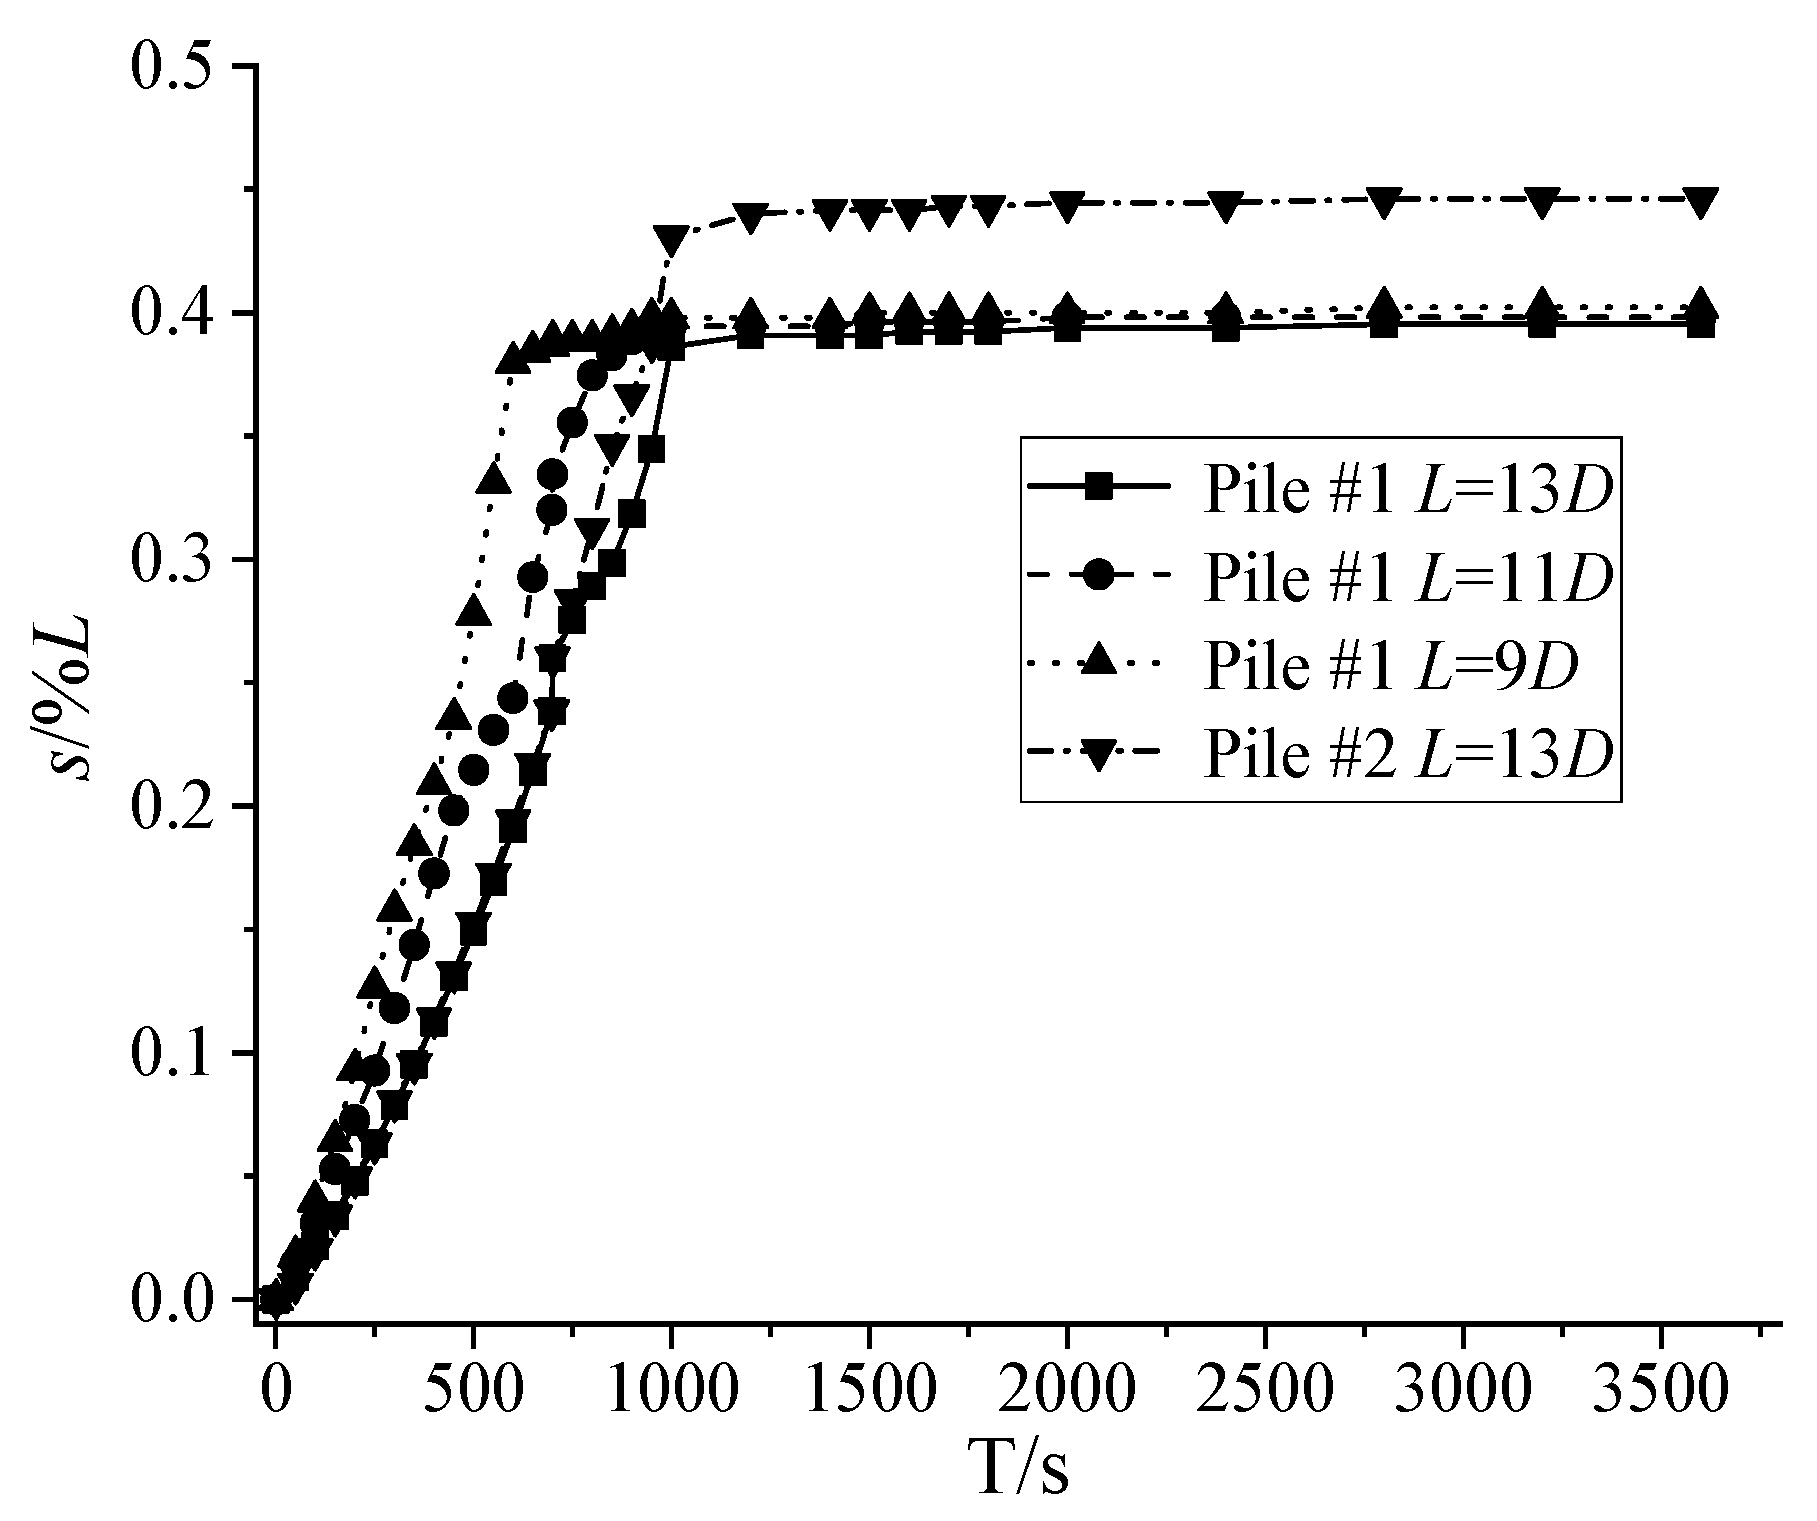
The pile rebound displacement over time at different pile lengths is shown in Figure 9. It defines the ratio between the pile rebound displacement s and the pile length L as the pile rebound ratio η (see Equation (1)). Figure 10 reveals that the pile rebound ratio was the same at different pile lengths, and the pile rebound ratio of Pile #2 is greater than Pile #1, which is because the pile rebounds in relation to the stress relief of the soil surrounding the end pile during the unloading of the top of the pile. Meanwhile, for Pile #1, at the pile lengths of 9, 11, and 13 D, the pile rebound ratios was approximately 0.4%; the pile rebound ratio of Pile #2 was 0.45%. In addition, the pile rebound displacement accounts for up to 85% of the total rebound displacement in the process of unloading. Therefore, the methodology may be effective in controlled pile rebound displacement, which controls the process of unloading in practical engineering.
η = s L
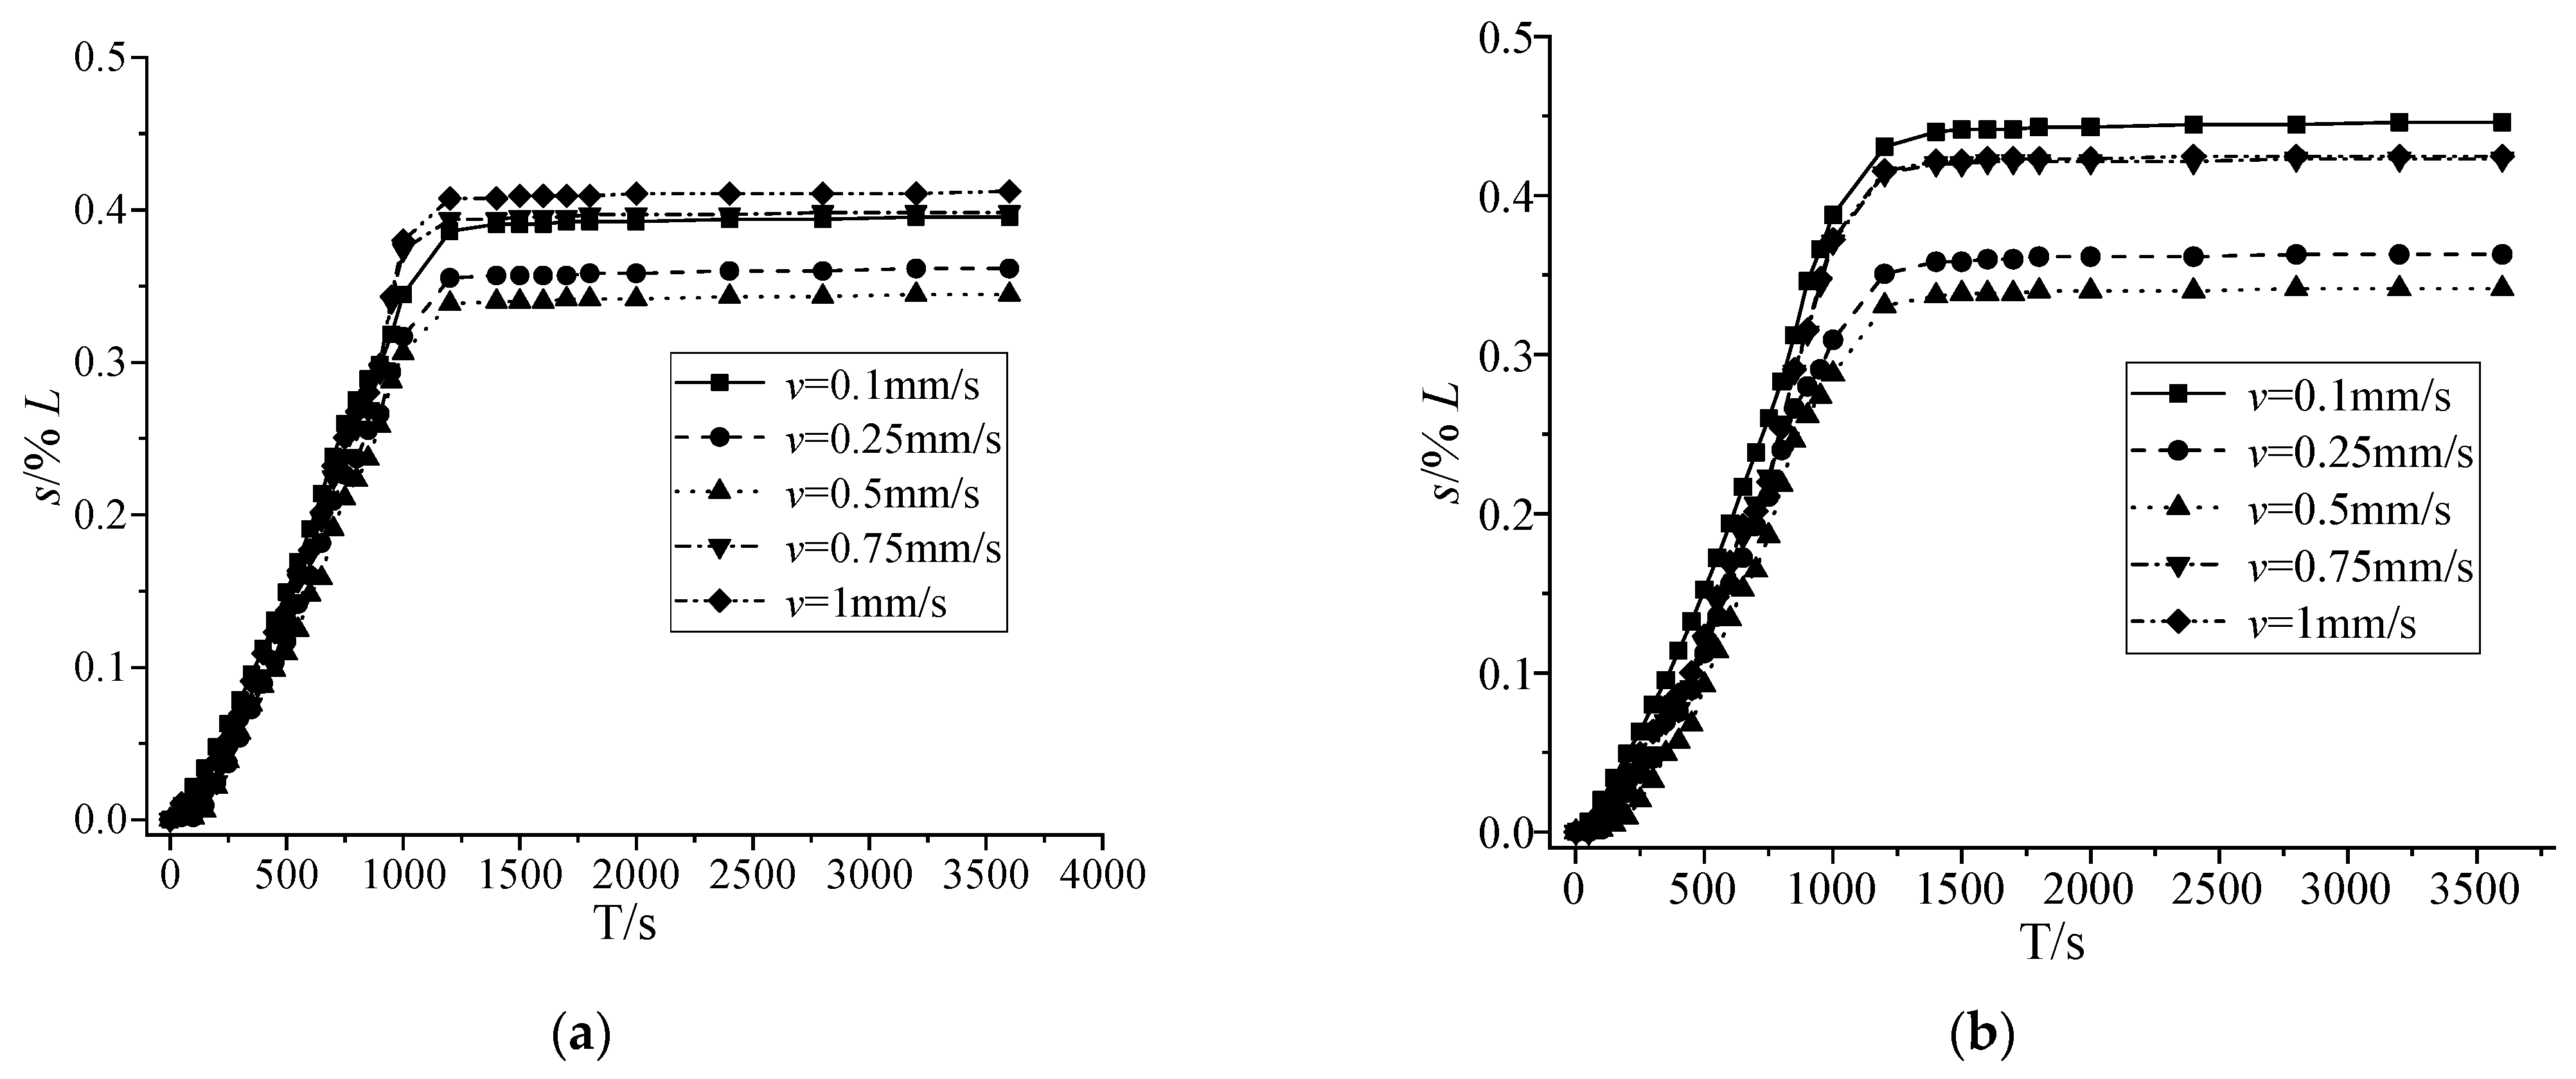
The pile rebound displacements for different driving speed conditions with the same model pile are shown in Figure 10. Figure 10 shows that the rebound displacement decreased then increased with the increasing driving speed. Taking Pile #1 as an example, the driving speed increased from 0.1 to 0.25, 0.5, 0.75, and 1 mm/s, while the rebound displacement of Pile #1 decreased by 8%, 13%, −1%, and −4%, respectively, which was related to the disturbed soil area during the pile’s installation and the pile end’s resistance.
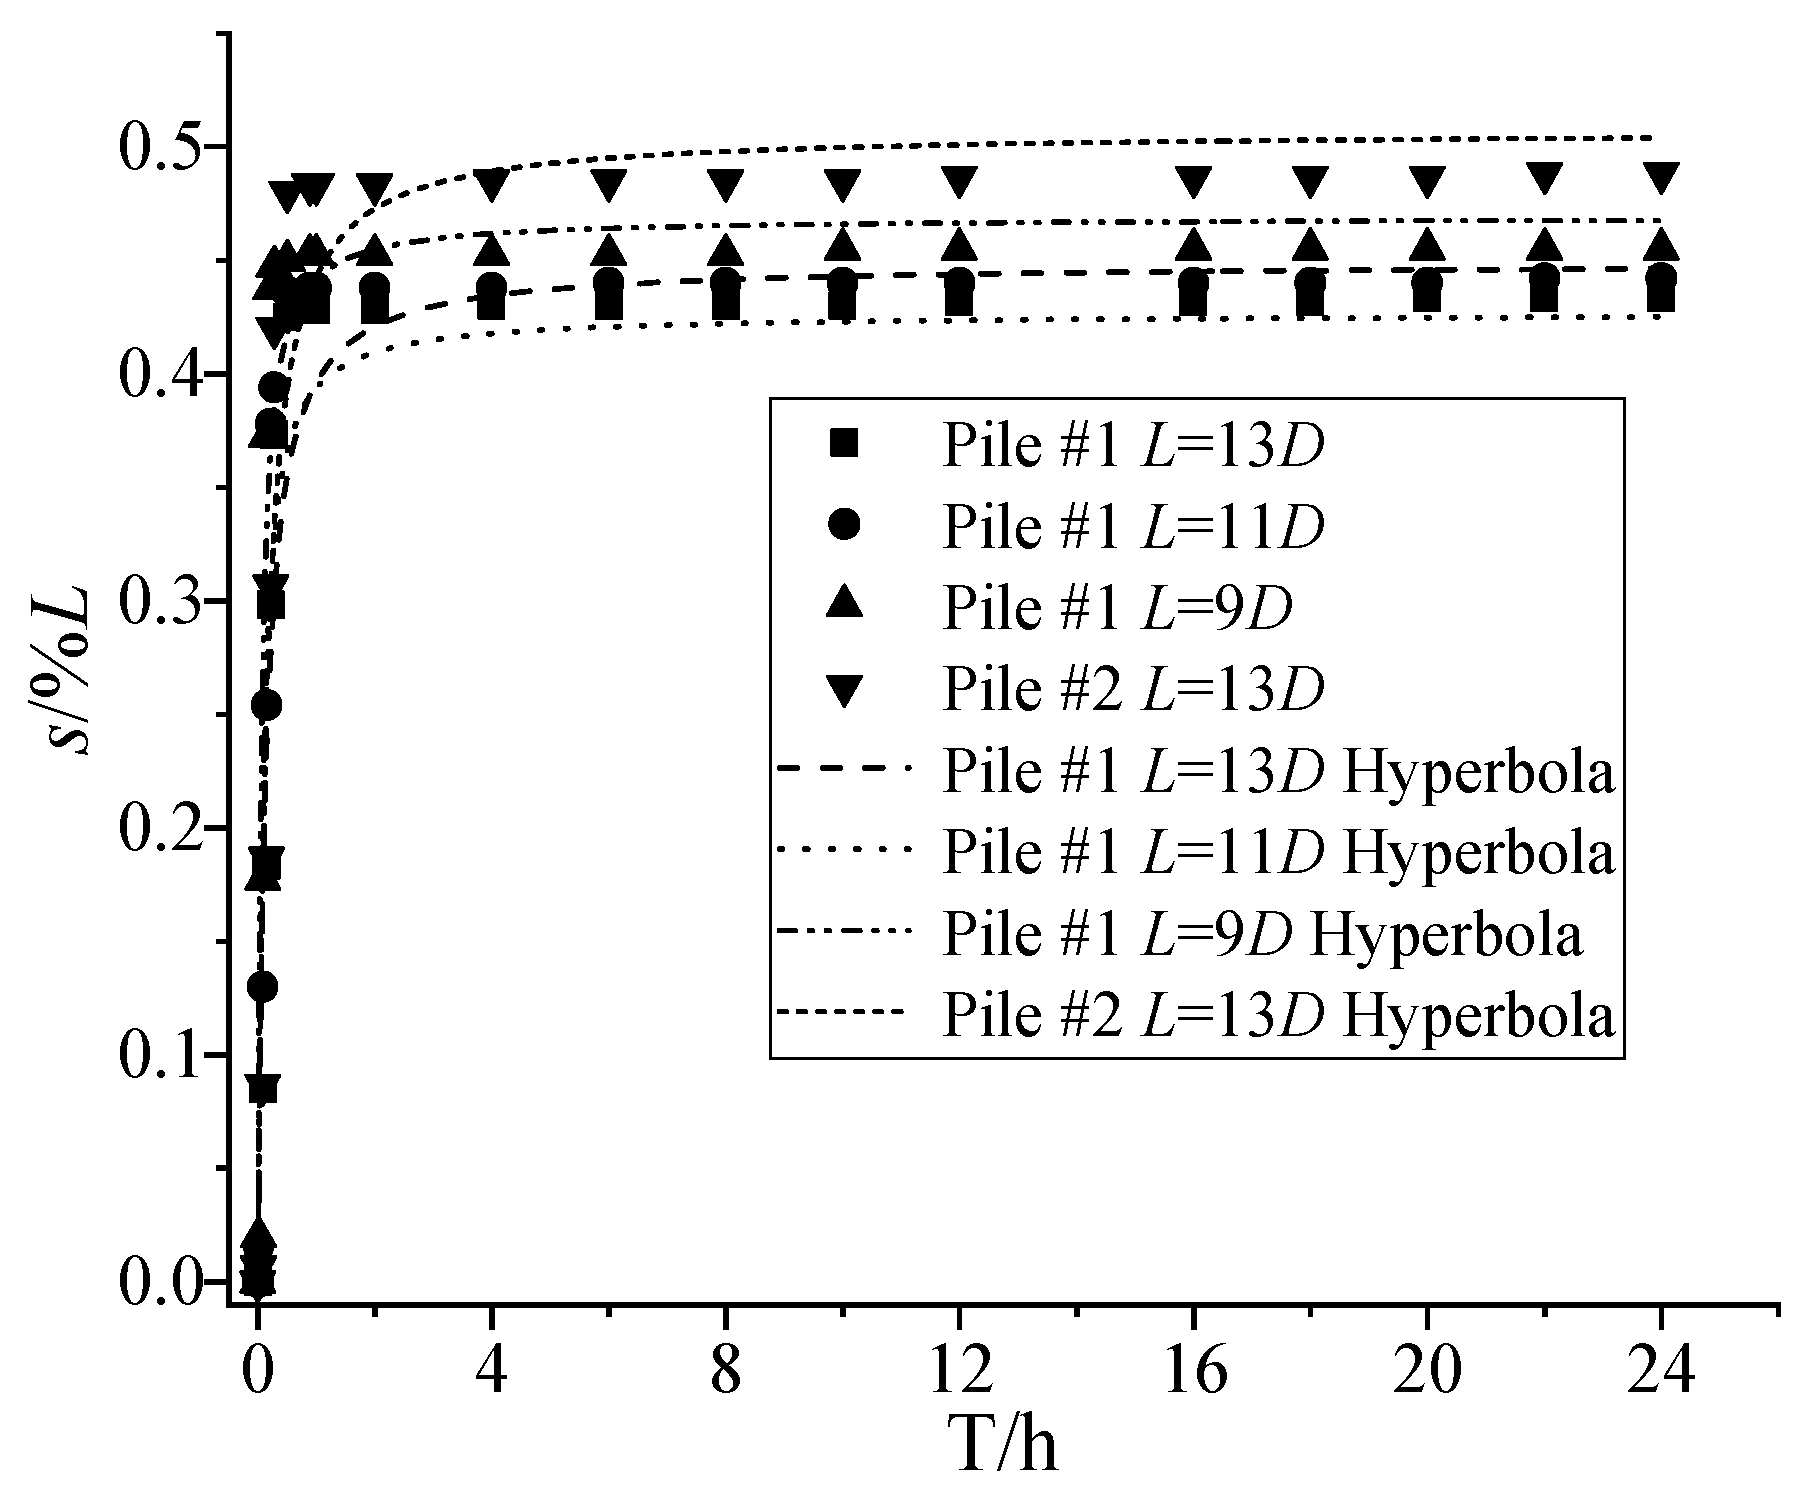
Figure 11 shows the relationship between the estimated pile rebound displacement and the test value, the regression parameters as shown in Table 2. According to Figure 11, the estimation of the hyperbolic model of pile rebound displacement was basically the same as the test value. This means that the pile rebound displacement over time satisfied the hyperbolic model.
η = a T b + T

3.1.4. Uplift Displacement of the Top of Pile #1

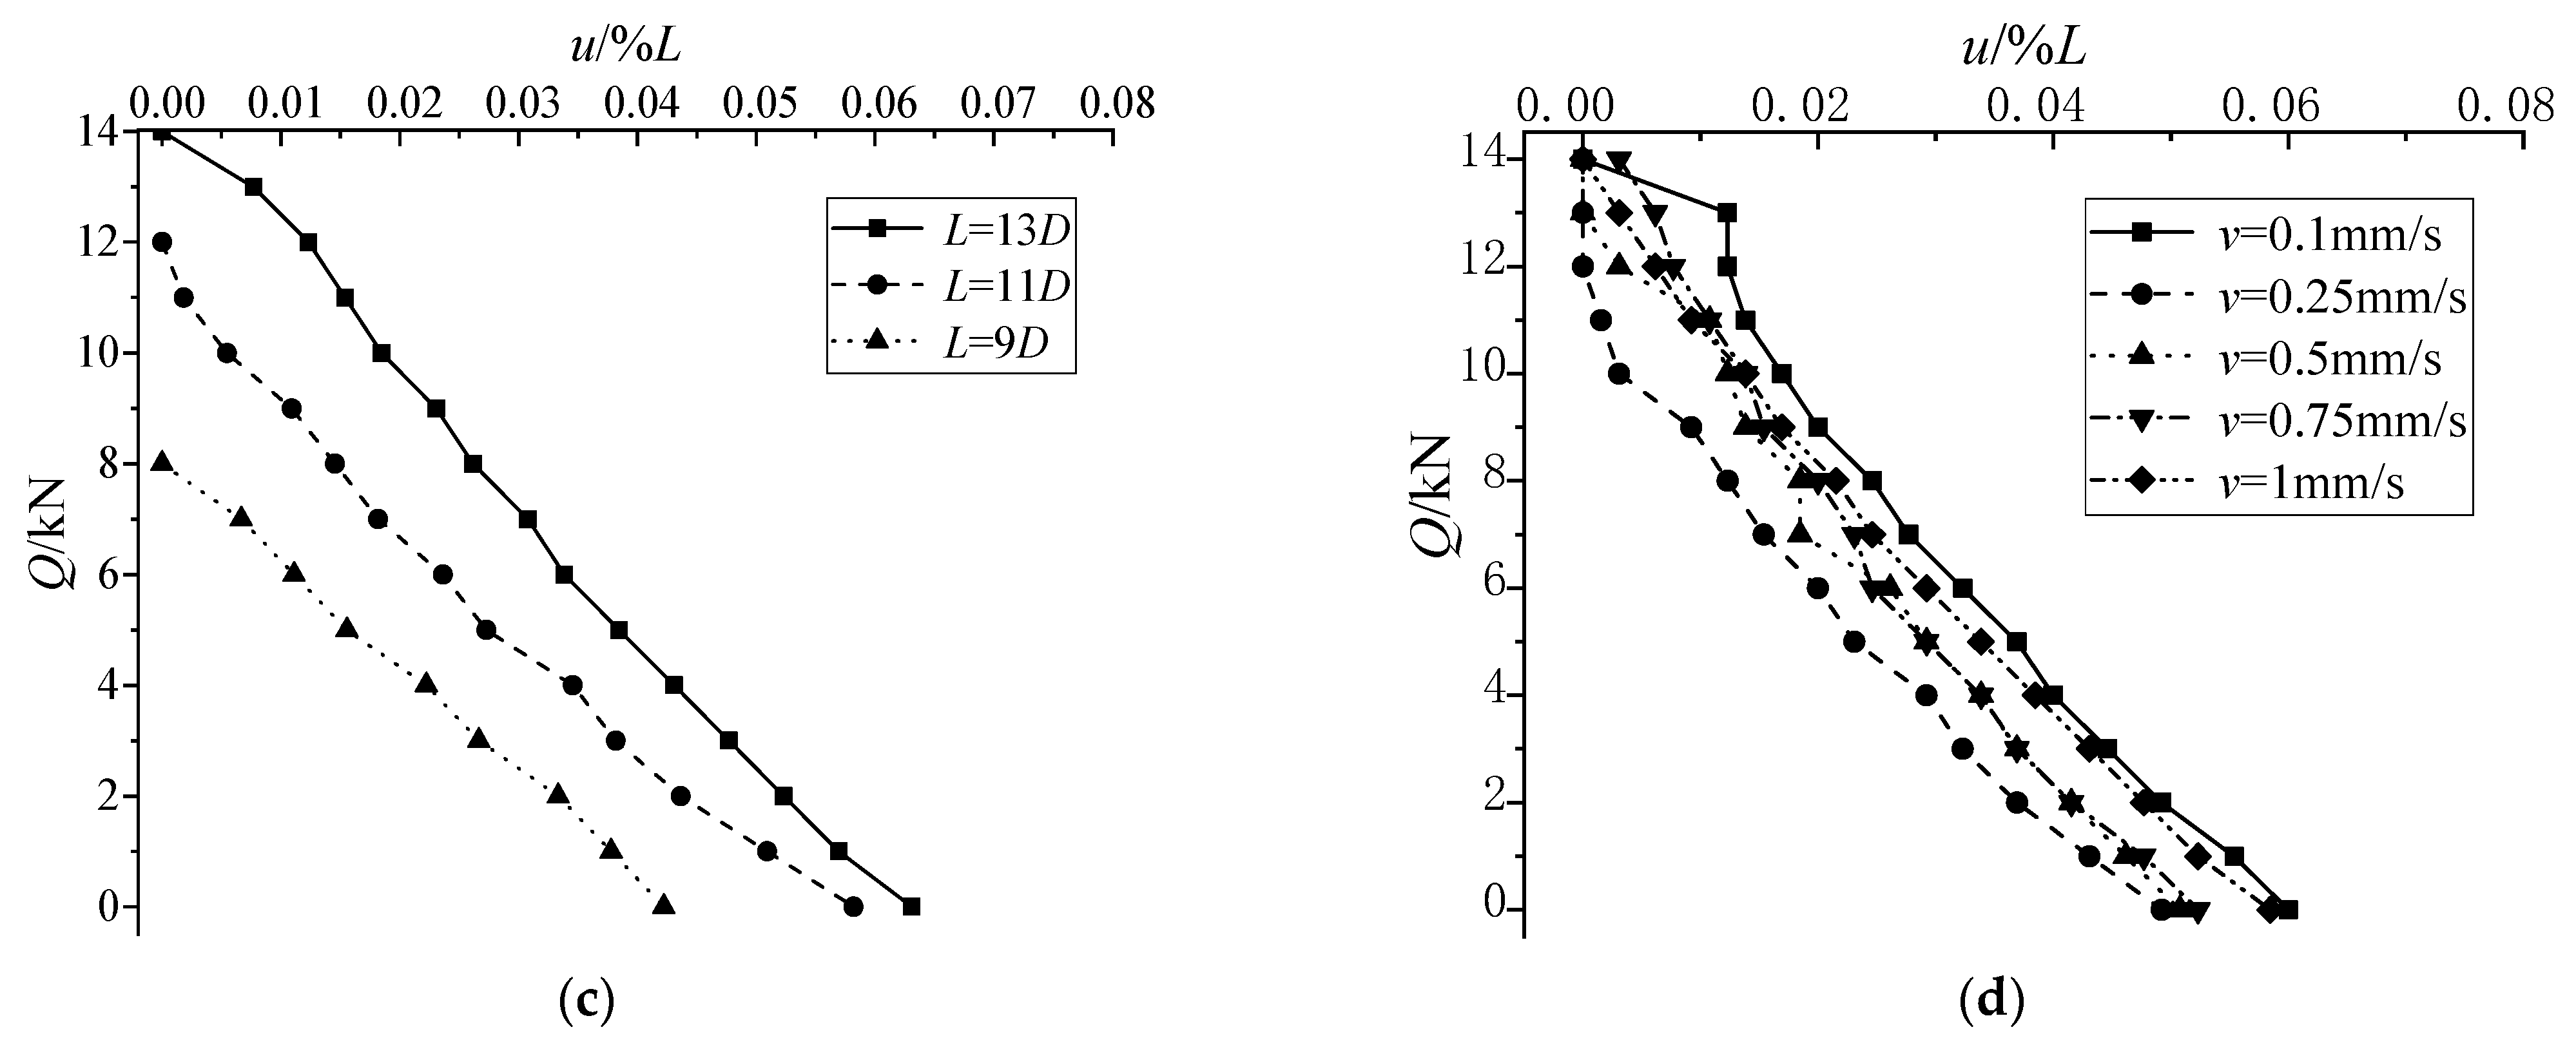
Figure 12 shows the uplift displacement of the top of Pile #1 caused by the installation and rebound of Pile #2. The locations of the displacement transducers are shown in Figure 4. As shown in Figure 12, the uplift displacement of Pile #1 during the installation of Pile #2 decreased with the increasing pile length and decreased and then increased with the increasing driving speed. At the pile lengths of 9, 11, and 13D, the uplift displacements of the top of Pile #1 were approximately 0.60%, 0.47%, and 0.36% L, respectively; this is because the uplift bearing capacity increased with the increasing pile length. The uplift displacement of the top of Pile #1 was approximately 0.36%, 0.34%, 0.31%, 0.29%, and 0.35% L when the driving speeds were 0.1, 0.25, 0.5, 0.75, and 1 mm/s, respectively, which was related to the disturbed soil area during the installation of Pile #2. In addition, during the process of the rebound of Pile #2, the uplift displacement of the top of Pile #1 increased with the increasing pile length and decreased and then increased with the increasing driving speed. However, in the period of rebound for Pile #2, the uplift displacement of the top of Pile #1 was small to negligible.

3.1.5. Horizontal Displacement of the Top of Pile #1

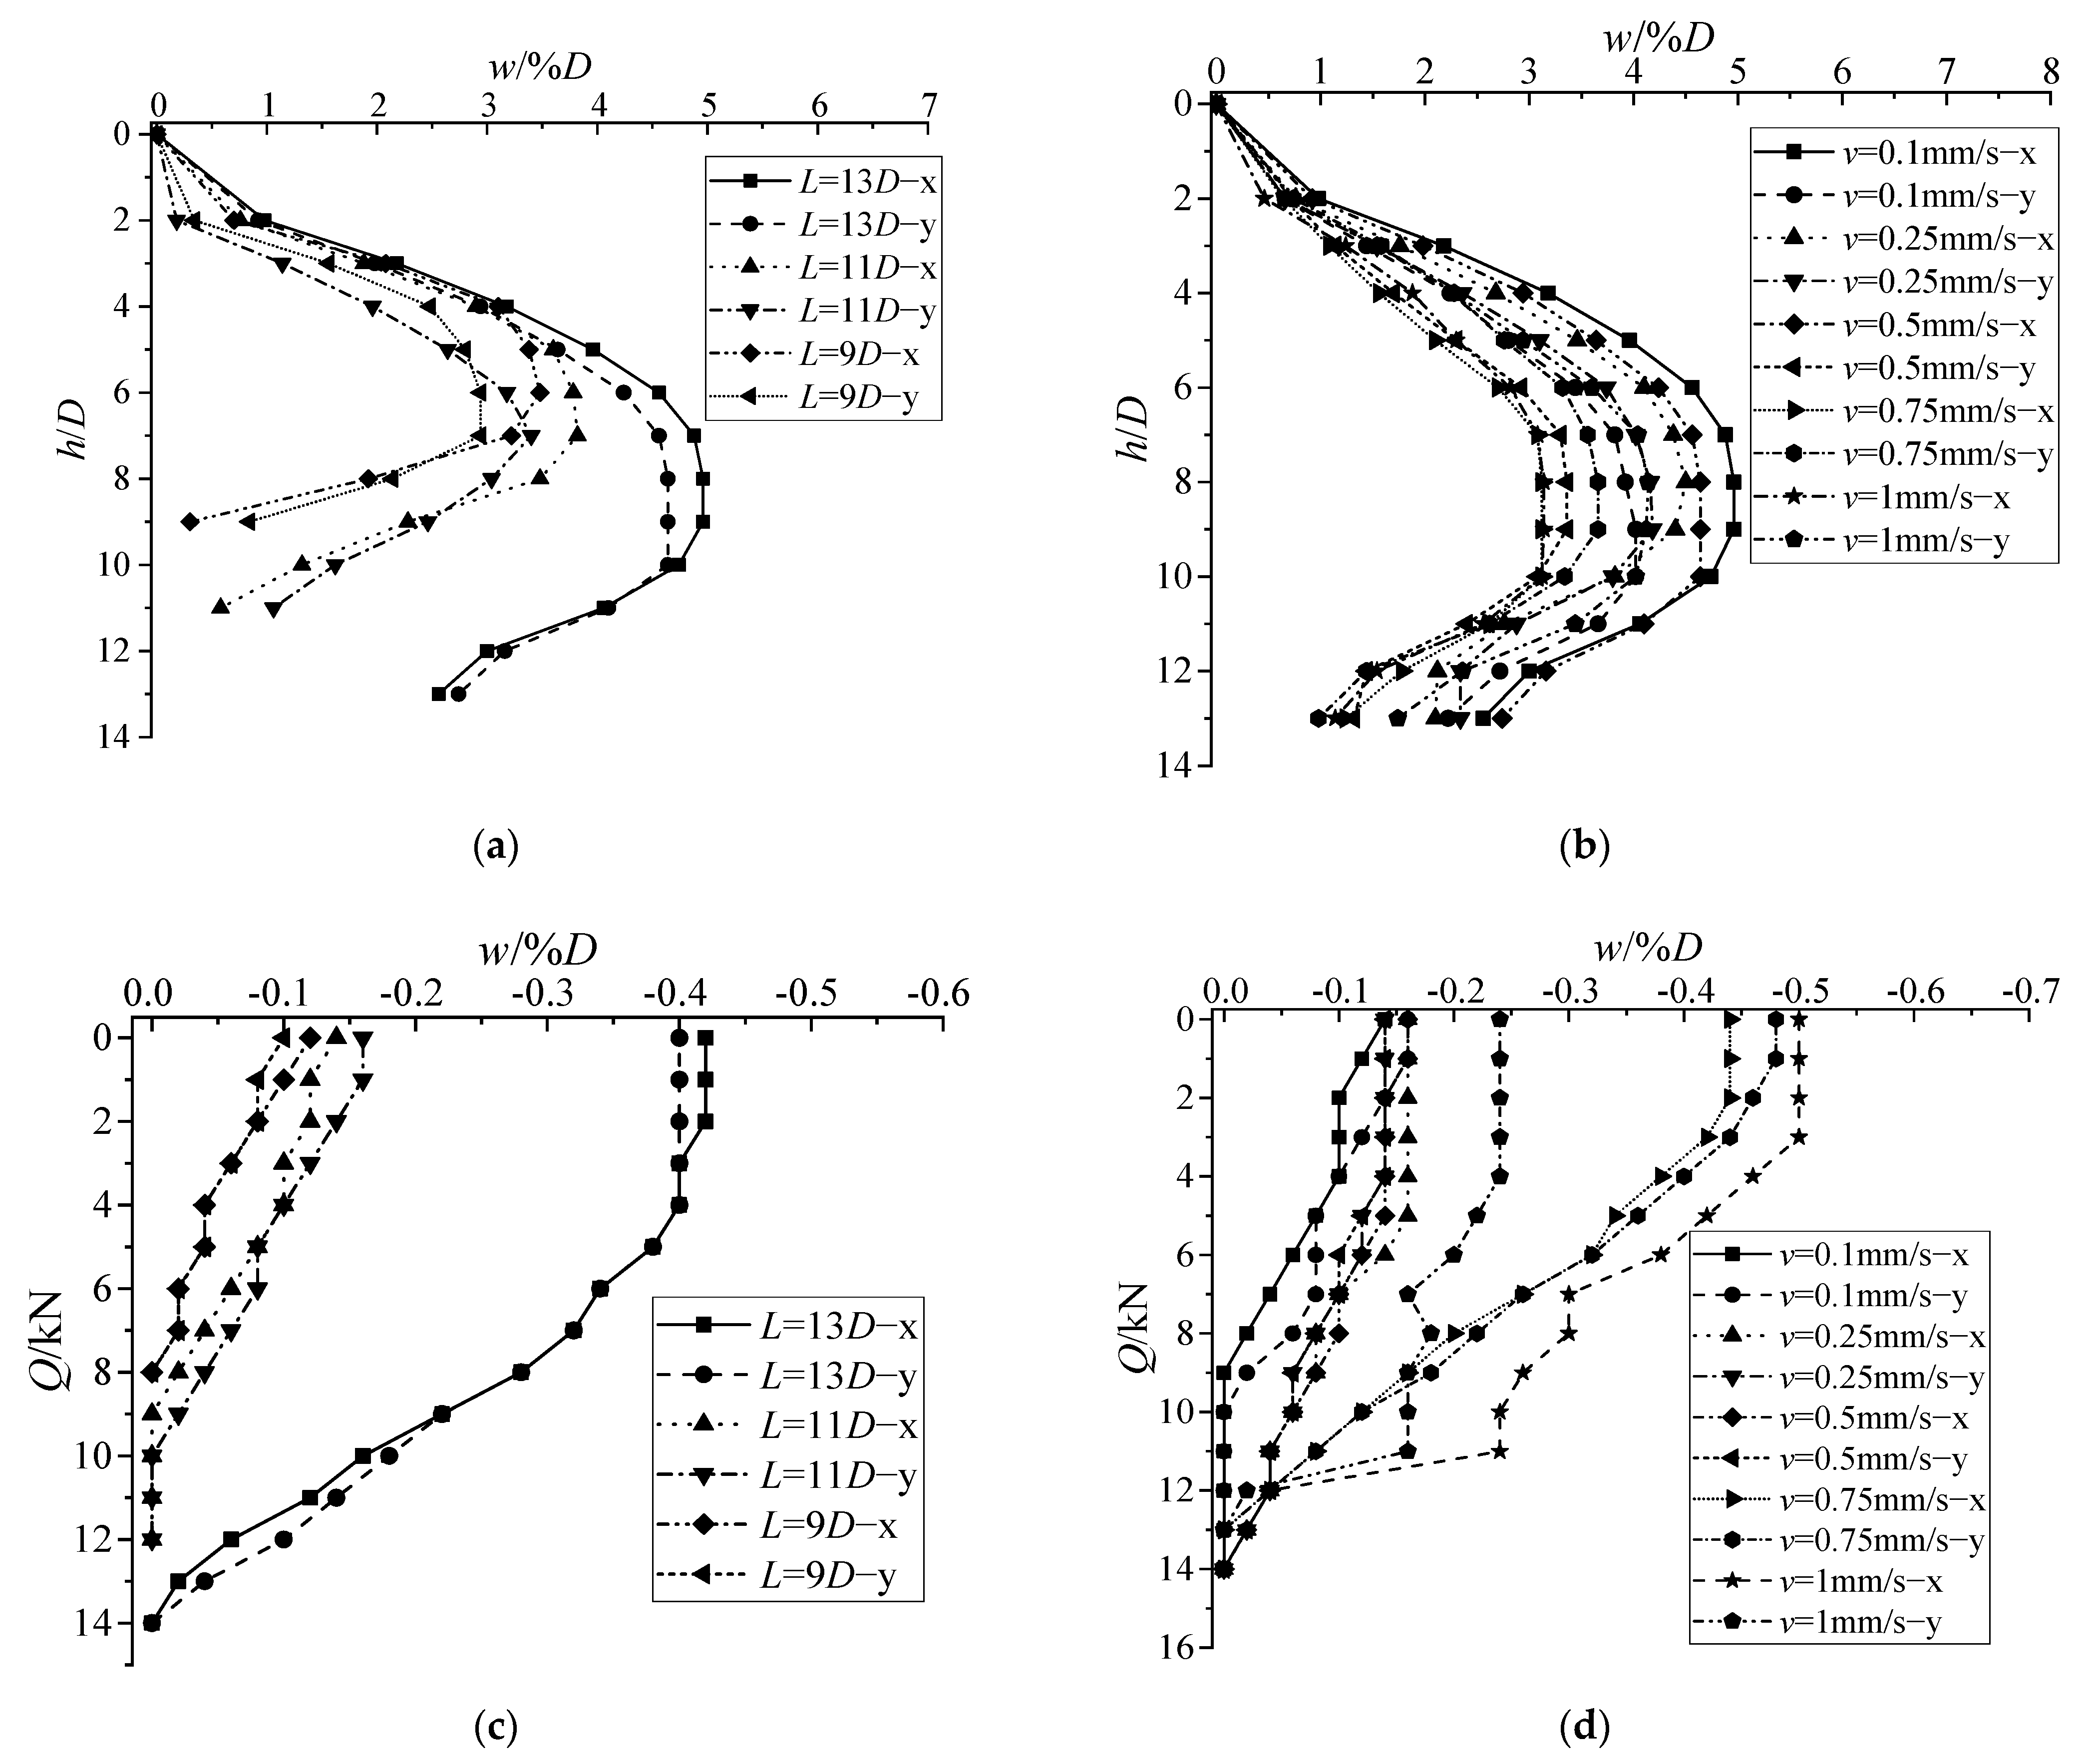
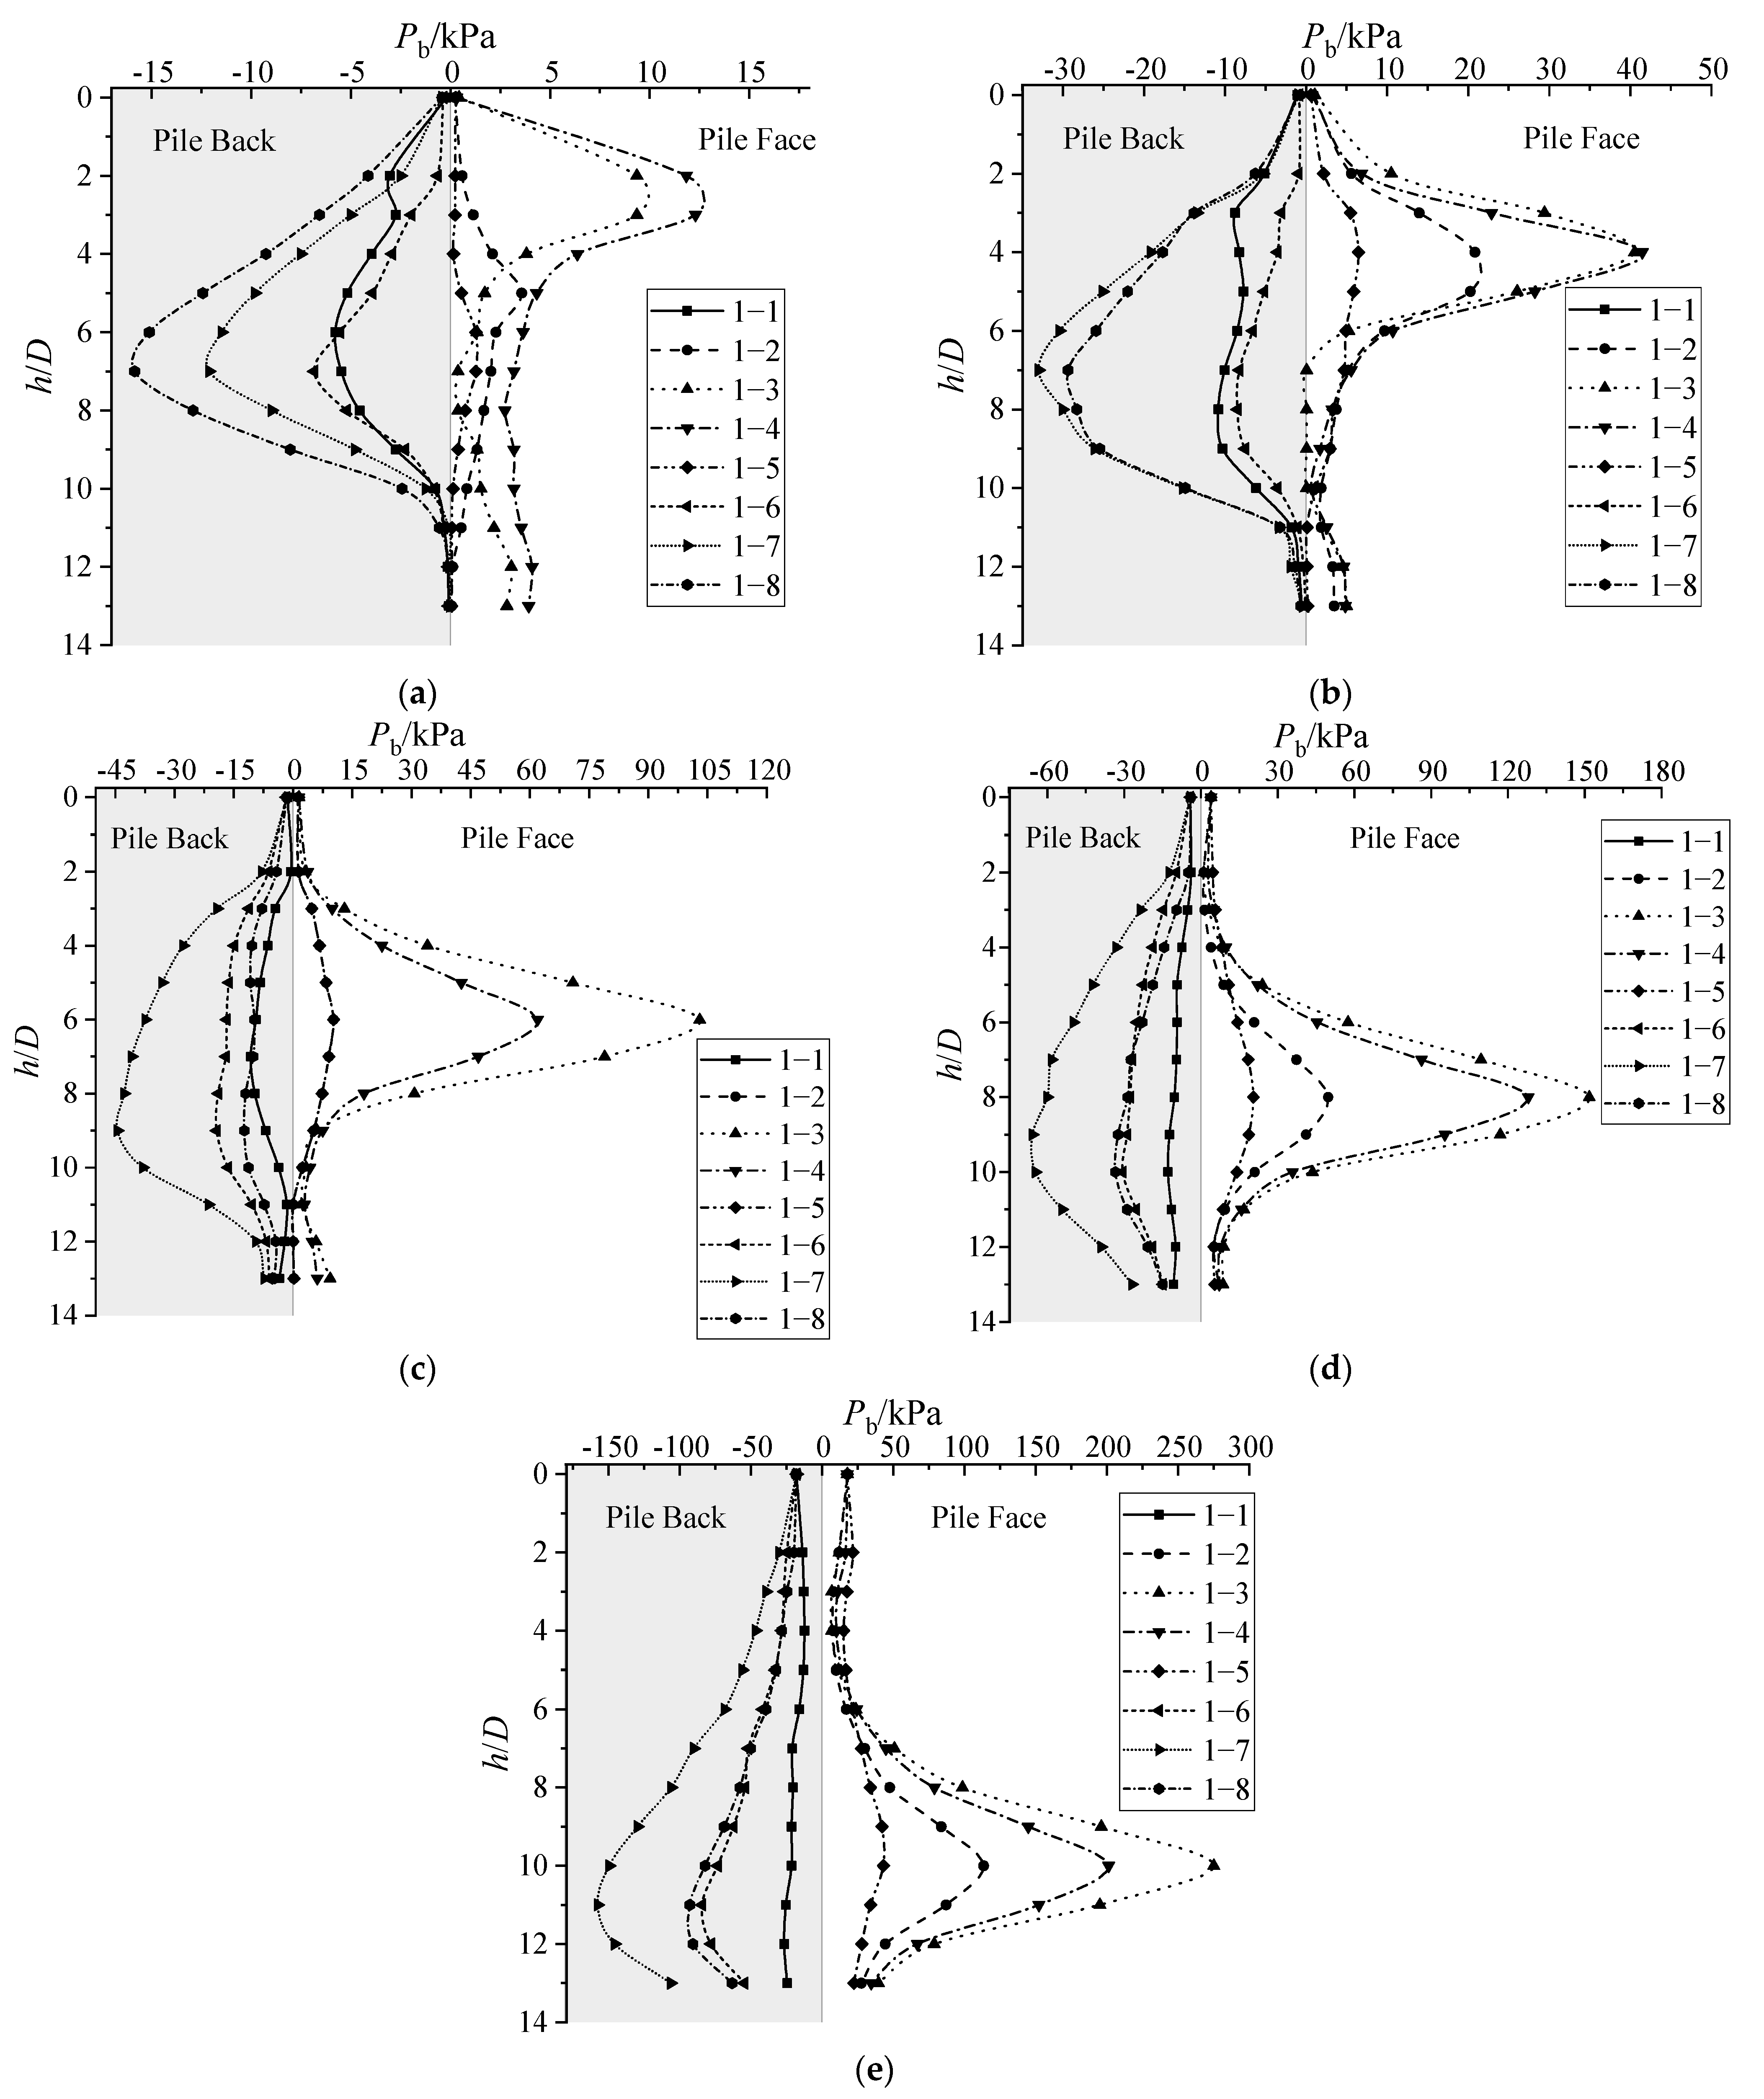
The horizontal displacement of the top of Pile #1 during the installation of Pile #2 and rebound of Pile #2 are shown in Figure 13. The locations of the displacement transducers are shown in Figure 4. Figure 13 shows that the horizontal displacement of the top of Pile #1 increased then decreased with the depth of the installation of Pile #2 and increased with the increasing pile length. As the pile length increased from 9 to 11 and 13 D, the horizontal displacement of the top of Pile #1 increased to 44% and 365%, respectively. At the depth of 2/3 L during the installation of Pile #2, the horizontal displacement of the top of Pile #1 reached its maximum. This is due to the higher stiffness of the model pile, resulting in the inclination of Pile #1 during the installation of Pile #2. In addition, the analysis of the stress of the soil surrounding Pile #1 during the installation of Pile #2 (the locations of the two model piles and the sections of the layout of the earth pressure transducers are shown in Figure 14, while the changes in the stress of the soil surrounding Pile #1 during the installation of Pile #2 are shown in Figure 15) shows that the stress of the soil surrounding Pile #1 increased and then decreased with the depth of the installation of Pile #2, and the stress of Pile #1 between the side of the pile’s face and the back of the pile varies during the installation of Pile #2. The locations of the maximum stress on the side of Pile #1 face is similar to the location of the end of Pile #2, and the side of the back of Pile #1 is slightly different from the location of the end of Pile #2, which was because the existing pile has a barrier effect on the stress of the soil during the jacked pile’s installation. Meanwhile, the maximum stress on the side of the pile’s face is significantly higher than the back of the pile (except the E-E section). This was precisely because of the difference in the stress of Pile #1 between the side of the pile’s face and the back of the pile during the installation of Pile #2 corresponding to Pile #1’s inclination and uplift. Hence, the horizontal displacement of the top of Pile #1 during the installation of Pile #2 was caused by the difference in the stress state of Pile #1 between the side of the pile’s face and the back of the pile, and the uplift displacement of Pile #1 was also related. The changes in the location of Pile #1 during the installation of Pile #2 and the rebound of Pile #2 are shown in Figure 16.
Figure 13 also reveals that the horizontal displacement of the top of Pile #1 decreased then increased with the increasing driving speed during Pile #2’s installation. The horizontal displacements of the top of Pile #1 were approximately 2.39%, 2.22%, 2.03%, 1.11%, and 1.44% D when the driving speeds were 0.1, 0.25, 0.5, 0.75, and 1 mm/s, respectively. Meanwhile, in the rebound process of Pile #2, the horizontal displacement of the top of Pile #1 increased with the increasing pile length, and decreased then increased with the increasing driving speed during Pile #2’s installation. However, the horizontal displacement of the top of Pile #1 during the rebound process of Pile #2 was small to negligible.

3.2. Vertical Bearing Capacity of Jacked Piles

3.2.1. Radial Stress of the Soil Surrounding the Pile

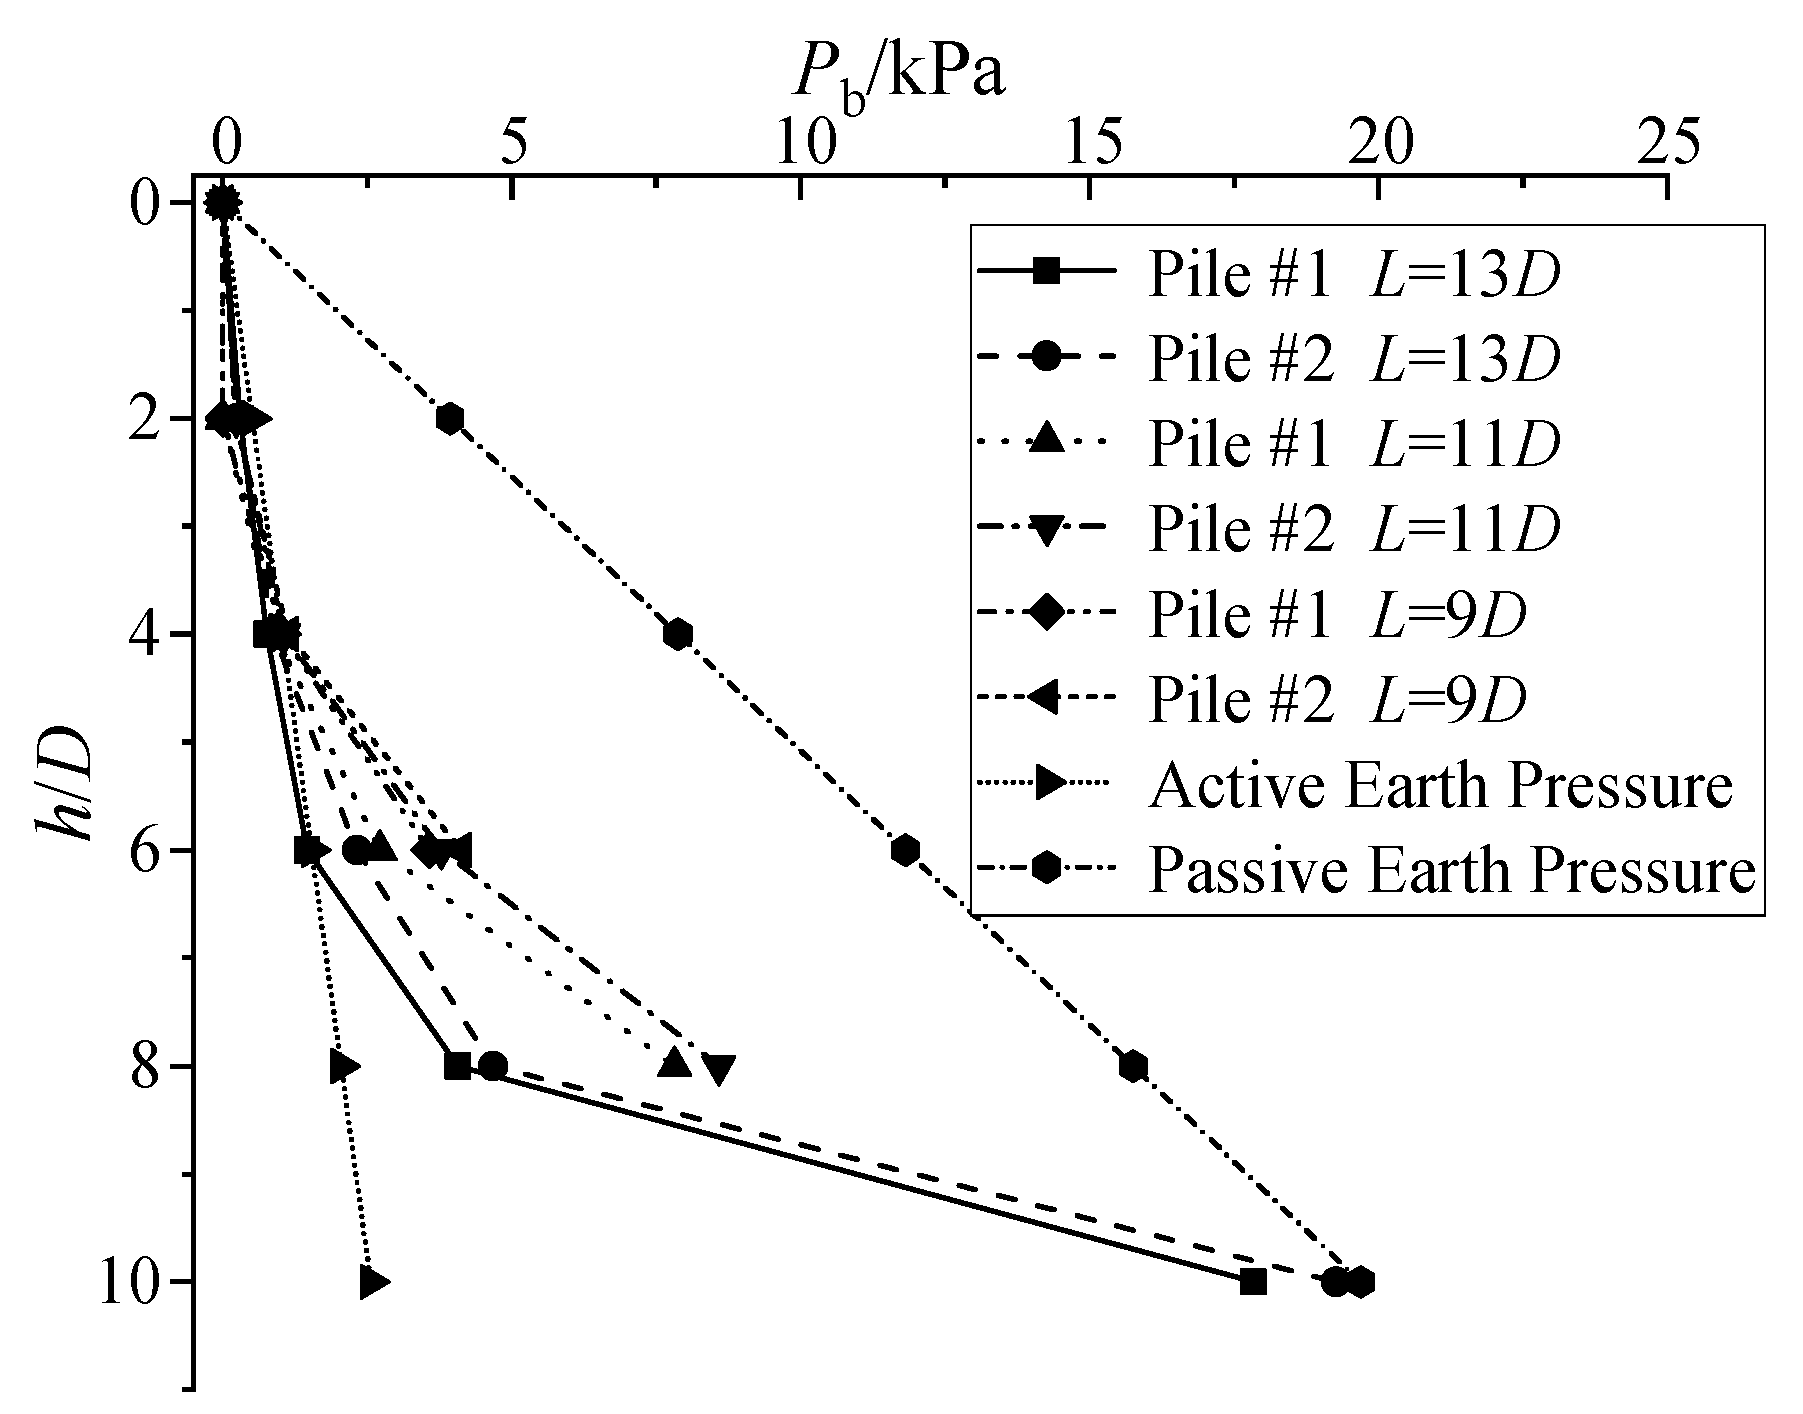
One hour after unloading, the radial stress distributions of the soil surrounding Pile #1 and Pile #2 are shown in Figure 17 and Figure 18. The radial stress around the pile is the average value of each section (the eight earth pressure transducers measuring the soil surrounding the pile). The active earth pressure, earth pressure at rest, and passive earth pressure were calculated as shown in Equations (3)–(8). Figure 18 shows that the radial stress of the pile increased nonlinearly with the depth at different pile lengths, and gradually converged to the passive earth pressure. Meanwhile, the radial stress of Pile #1 was lower than that of Pile #2, and the radial stress of the pile was mainly affected by the pile’s length or depth. In the case of Pile #1, the radial stress of the pile increased by 35% (the depth of 11 D) and 270% (the depth of 13 D) for every 2 D increase after the depth of 9 D; however, at the same depth, the radial stress of the pile decreased with the increasing pile length—[4] suggests that this was due to the “friction fatigue effect” between the pile and soil during the installation of the pile; the continuous penetration process of the pile caused continuous disturbance of the soil around the pile, resulting in the release of the soil stress around the pile and causing the relaxation of the soil around the pile, so the pile–soil friction during the pile-sinking process is one of the factors causing the reduction in the radial stress of the pile. Meanwhile, the radial stress of the pile decreased slightly and was only 26% at the depth of 0~4 D, while the decrease was larger with a maximum of 59% at the depth of 4~8 D, which was due to the relatively small value of the radial stress of the pile that leads to the inconspicuous decrease, and the difference is gradually highlighted as the value of the radial stress of the pile increased. In addition, combined with the previous analysis of the pile end’s resistance, the pile’s end and perimeter soil stress release during the unloading process, it has been revealed that the greater the pile length, the greater the pile end and perimeter soil stress, and the residual stress at the pile end is about 5% of the pile end’s resistance after the completion of unloading; this means the greater the pile length, the greater the stress release during the unloading process, resulting in the greater the radial stress of the pile loss. Hence, the reduction in the radial stress of the pile at the same depth was not only related to the frictional effect between the pile and soil during the installation of the pile, but was also related to the stress release at the pile’s end and the soil around the pile during the unloading process.
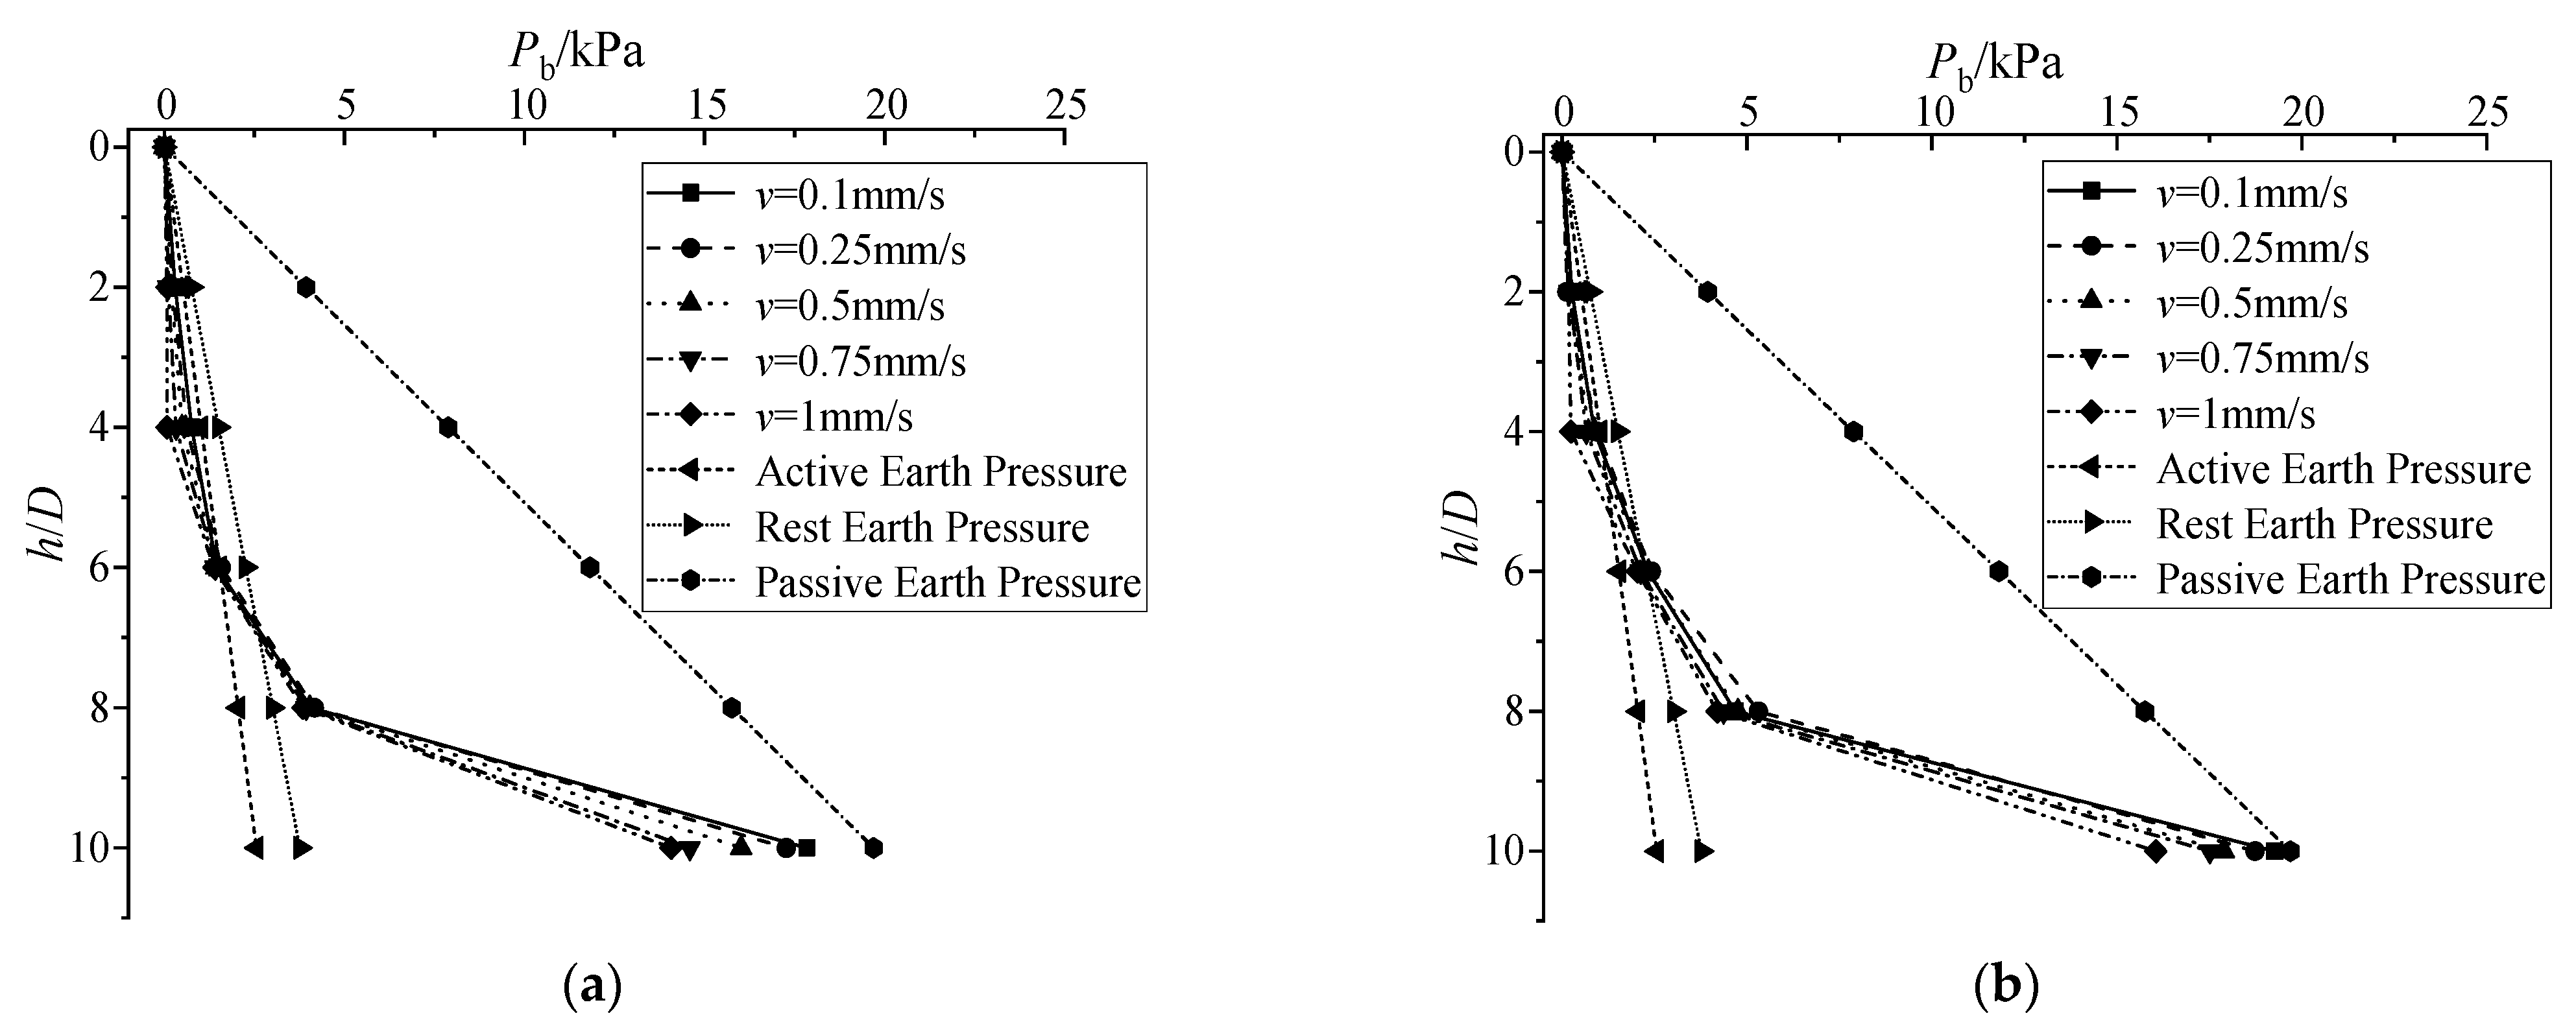
Figure 18 shows that the radial stress of the pile gradually converges to the passive earth pressure, which increased with depth at the different driving speeds and decreased with the increasing driving speed at the same depth. Taking Pile #1 as an example, the influence of the driving speed on the radial stress of the pile was related to the depth; at the depths of 0~4 D and 8~10 D, the radial stress of the pile affected by the driving speed was relatively large, but relatively small when the depth was 4~8 D. This indicated that the existence of a suitable depth could weaken the influence of the driving speed on the radial stress of the pile. Meanwhile, the radial stress of the pile gradually converges to the active earth pressure at the depth of 0~6 D, while the radial stress of the pile clearly converges to the passive earth pressure when the depth of 6~10 D; this was due to the pile rebound action causing stress release in the soil around the pile, with the shallow soil layer occurring due to the active earth pressure, while the deep soil layer was not fully released under the pile rebound action, so the radial stress of the pile clearly converges with the passive earth pressure.
σ a = K a γ h
σ 0 = K 0 γ h
σ p = K p γ h
K a = tan 2 ( 45 φ 2 )
K 0 = 0.95 sin φ
K p = tan 2 ( 45 + φ 2 )

3.2.2. Ultimate Capacity of Pile

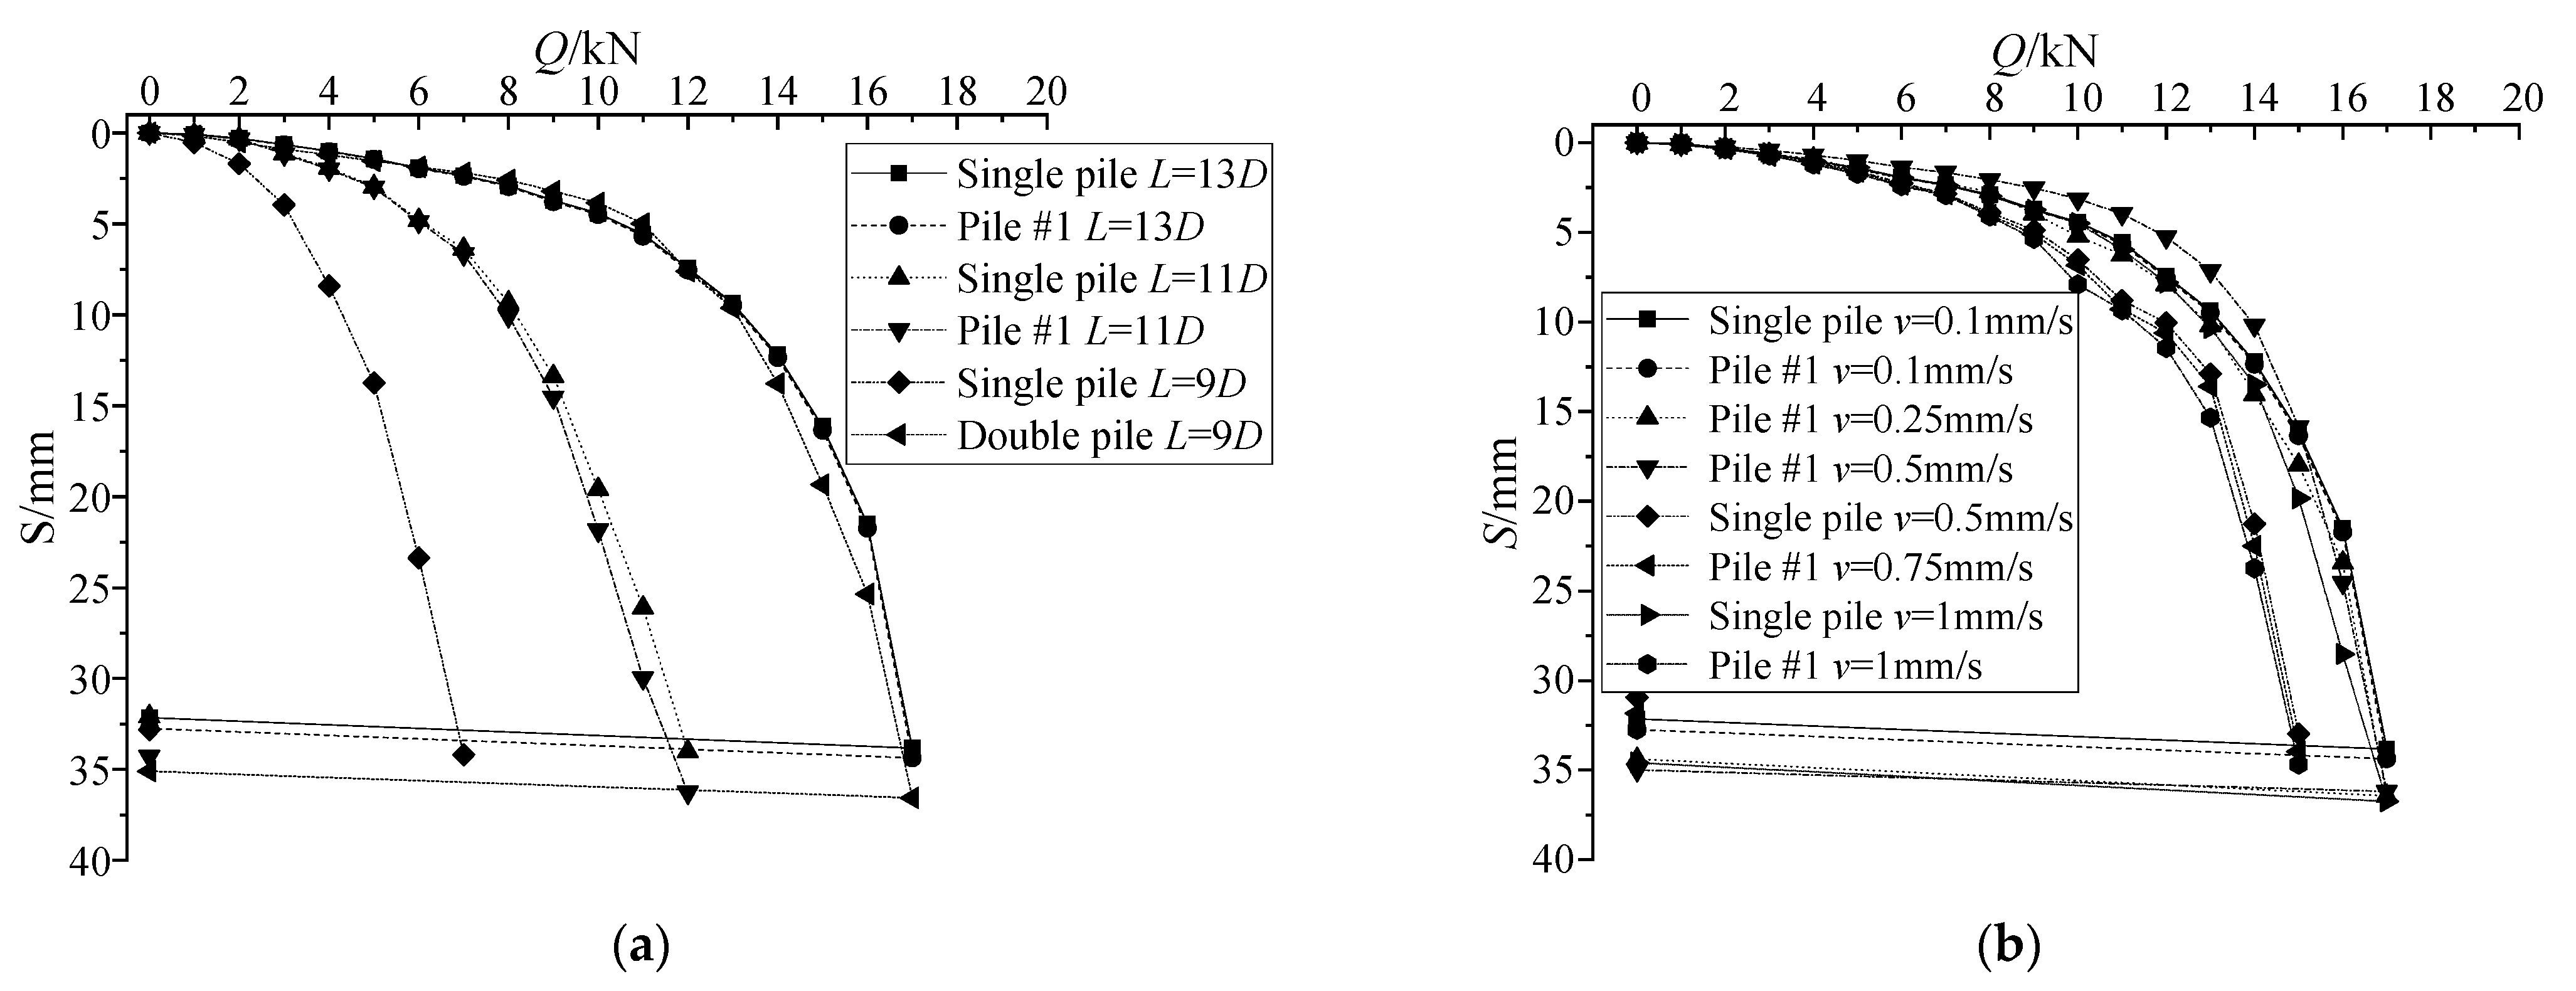
The load was applied in increments of 1 kN and held for 15 min creep periods for the static load tests, and the load test failure criterion was set to a displacement of 25 mm, as shown in Figure 19. Note that the single pile is only one jacked pile in sand, and Pile #1 is the first pile of the two jacked piles. As shown in Figure 19, the ultimate capacity of the single pile and Pile #1 increased with the increasing pile length. For the single pile, the pile length increases from 9 to 11 and 13 D, and the ultimate capacity of pile increases by 60% and 140%, respectively. Meanwhile, at the same pile length, the ultimate capacity of Pile #1 is the same as that of a single pile. This means that the ultimate capacity of the pile grows nonlinearly with the pile length and increasing the pile length has obvious effects on improving the ultimate capacity of the pile. In addition, at the pile lengths of 9, 11, and 13D, the ultimate capacity of the pile for the final jacking pressure is approximately 107%, 105%, and 104%, respectively. The ultimate capacity of the double pile is approximately twice that of the single pile when the pile length is 9D. Hence, the ultimate capacity of the pile is related to the final jacking pressure [28,29], and the ratio of the ultimate capacity to the final jacking pressure was approximately 1.04.
Figure 19 also reveals that the ultimate capacity of the single pile and Pile #1 decreased with the increasing driving speed. In the case of Pile #1, the ultimate capacity decreases by 1%, 2%, 11%, and 13% when the driving speed increases from 0.1 to 0.25, 0.5, 0.75, and 1 mm/s, respectively. Meanwhile, at the same driving speed, the ultimate capacity of Pile #1 is equivalent to the single pile.

4. Conclusions

This paper investigated the driving speeds and pile lengths with respect to the effects and vertical bearing capacity of jacked model piles. The changes in the jacking pile pressure, the pile end’s resistance, the pile rebound displacement, the uplift displacement on the top of the pile, the horizontal displacement on the top of the pile, the radial stress of the soil surrounding the pile, and the ultimate capacity of the pile were analyzed. The major conclusions are listed as follows:
  • The jacking pile pressure grows nonlinearly with the pile length and increase with the increasing driving speed. The pile end’s resistance increased with the increasing pile length and decreased then increased with the increasing driving speed. Meanwhile, the ratio between the pile end’s resistance and the jacking pile pressure decreased with the increasing pile length.
  • For a short pile, the pile rebound is primarily associated with the pile length while the ratio was fixed at about 0.4%, and the ratio of the pile rebound to the total pile rebound during the unloading process or initial unloading was up to 85%. Meanwhile, the hyperbolic model can be used to evaluate pile rebound over time.
  • The horizontal displacement of the top of the first jacking pile increased then decreased with the depth of installation of the post-jacking pile and increased with the increasing pile length. At the depth of 2/3 L of the installation of the post-jacking pile, the horizontal displacement of the top of the first jacking pile reached its maximum. Meanwhile, the horizontal displacement of the first jacking pile top decreased then increased with the increasing driving speed of the installation of the post-jacking pile. The horizontal displacement of the top of the first jacking pile during the installation of the post-jacking pile was caused by the difference in the stress state of the first jacking pile between the side of the pile’s face and the back of the pile, and the uplift displacement of the first jacking pile was also related.
  • The radial stress of the pile increased nonlinearly with depth at different pile lengths, and gradually converged to the passive earth pressure. The reduction in the radial stress of the pile at the same depth was not only related to the frictional effect between the pile and soil during the installation of the pile, but was also related to the stress release at the pile end and the soil around the pile during the unloading process. The radial stress of the pile decreased with the increasing driving speed at the same depth.
  • At the same pile length, the ultimate capacity of the first jacking pile is the same as that of a single pile. Meanwhile, the ultimate capacity of a single pile and the first jacking pile decreased with the increasing driving speed. The ultimate capacity of the double pile is approximately twice that of the single pile, and the ratio of the ultimate capacity to the final jacking pressure was approximately 1.04.
This paper only considers the effects and vertical bearing capacity of two jacked model piles. The effects and vertical bearing capacity of more jacked pile groups need to be further studied.

Author Contributions

Methodology, X.Z.; validation, X.Z., Z.X. and Q.W.; formal analysis, X.Z.; investigation, Q.W.; resources, Z.X.; data curation, X.Z. and Q.W.; writing—original draft preparation, X.Z.; writing—review and editing, Q.W.; Z.X. and D.F.; visualization, Z.X. and Q.W.; supervision, Z.X.; funding acquisition, Z.X. and D.F. All authors have read and agreed to the published version of the manuscript.

Funding

This research was funded by National Natural Science Foundation of China, grant Number [52079126 and 51178165], and the Tiptop Young Talent Program of Central Plains grant Number [ZYQR201912156].

Data Availability Statement

All data, models, and code generated or used during the study appear in the submitted article.

Acknowledgments

In particular, the author would like to thank the editor for the careful editing and layout of this article, as well as the reviewer for their valuable comments and suggestions for this article. The authors are very grateful for the support provided by the National Natural Science Foundation of China (grant No. 52079126 and 51178165) and the Tiptop Young Talent Program of Central Plains (grant No. ZYQR201912156).

Conflicts of Interest

The authors declare no conflict of interest.

Nomenclature

aFit parameters.
bFit parameters.
hThe depth of soil or the depth of jacking piles.
sPile rebound displacements.
uPile uplift displacements.
vThe driving speeds.
wHorizontal displacement of pile head.
DModel pile diameter.
KaCoefficient of active earth pressure.
K0Coefficient of earth pressure at rest.
KpCoefficient of passive earth pressure.
LModel pile length.
PeInstallation resistance of pile end.
PiJacked pile pressure.
PbThe radial stress of the soil surrounding the pile.
QThe load of pile head.
SSettlement.
TTime.
σaActive earth pressure.
σ0Earth pressure at rest.
σpPassive earth pressure.
γUnit weight of soil.
φInternal friction angle of soil of soil.
ƞThe ratio of between the pile rebound displacements and the pile length.

References

  1. Xiao, Z.R.; Wang, Y.L.; Zhao, X.Q.; Jiang, M.M.; Zhao, W.C. Experimental Investigation on Resistance and Response of Jacked Model Piles in Sand. J. Build. Struct. 2022, 43, 294–302. [Google Scholar]
  2. Wang, Y.H.; Sang, S.K.; Liu, X.Y.; Zhang, M.Y.; Bai, X.Y. Numerical Simulation of Particle Flow Characteristics of Jacked Pile Penetration in Laminated Clay Soil. J. Southwest Jiao Tong Univ. 2021, 56, 1250–1259. [Google Scholar]
  3. Liu, X.Y.; Wang, Y.H.; Zhang, M.Y. Application of Miniature FBG-MEMS Pressure Sensor in Penetration Process of Jacked Pile. Micromachines 2020, 11, 876. [Google Scholar] [CrossRef] [PubMed]
  4. Sang, S.K.; Wang, Y.H.; Ma, J.X.; Zhang, M.Y. Experimental Research Based on the Optical Fiber Sensing Technology for a Jacked PHC Pipe Pile Penetration Process. Adv. Civ. Eng. 2020, 2020, 8873308. [Google Scholar] [CrossRef]
  5. Li, J.P.; Li, L.; Sun, D.A.; Tang, J.H. Theoretical Study on Sinking Resistance of Jacked Piles in Saturated Soft Clay. Chin. J. Geotech. Eng. 2015, 37, 1454–1461. [Google Scholar]
  6. Liu, Y.; Xiao, Z.R.; Jiang, M.M. Model Test on Influence of Pile Length on Pile Resistance and Bearing Capacity Characteristics. Sci. Technol. Eng. 2019, 19, 215–219. [Google Scholar]
  7. Arezzo, F.B.; Haigh, S.; Talesnick, M.; Ishihara, Y. Measuring Horizontal Stresses during Jacked Pile Installation. Proc. Inst. Civ. Eng. Geotech. Eng. 2015, 168, 306–318. [Google Scholar] [CrossRef] [Green Version]
  8. Chin, J.T.; Poulos, H.G. Tests on Model Jacked Piles in Calcareous Sand. Geotech. Test. J. 1996, 19, 164–180. [Google Scholar]
  9. Lim, J.K.; Lehane, B. Shearing Resistance during Pile Installation in Sand. Proc. Inst. Civ. Eng. Geo. Eng. 2015, 168, 227–235. [Google Scholar] [CrossRef] [Green Version]
  10. Lim, J.K.; Lehane, B. Time Effects on Shaft Capacity of Jacked Piles in Sand. Can. Geotech. J. 2015, 52, 1830–1838. [Google Scholar] [CrossRef]
  11. Prezzi, M.; Salgado, R.; Basu, P.; Loukidis, D. The Mechanics of Friction Fatigue in Jacked Piles Installed in Sand. Soil Behav. Fundam. Innov. Geotech. Eng. 2014, 2, 546–557. [Google Scholar] [CrossRef]
  12. Zhou, J.; Deng, Y.B.; Ye, J.Z.; Jia, M.C. Experimental and Numerical Analysis of Jacked Piles during Installation in Sand. Chin. J. Geotech. Eng. 2009, 31, 501–507. [Google Scholar] [CrossRef] [Green Version]
  13. Ye, J.Z.; Zhou, J.; Han, B. Numerical Simulation of Punching Processes by Particle Flow Code Based on Discrete Element Method. Chin. J. Rock Mech. Eng. 2007, S1, 3058–3064. [Google Scholar]
  14. Luo, Z.Y.; Tao, Y.L.; Gong, X.N.; Zou, B.P. Soil Compacting Displacements for Two Jacked Piles Considering Shielding Effects. Acta Geotech. 2020, 15, 2367–2377. [Google Scholar] [CrossRef]
  15. Liu, H.J.; Xiao, Z.R.; Zhao, X.Q.; Zhao, W.C.; Lv, Q.X. Analysis of Rebound and Recompression Characteristics of Jacked Piles in a Sand Foundation. J. Build. Struct. 2022, 43, 301–310. [Google Scholar]
  16. Anusic, I.; Lehane, B.M.; Eiksund, G.R.; Liingaard, M.A. Influence of Installation Method on Static Lateral Response of DisPlacement Piles in Sand. Geotech. Lett. 2019, 9, 193–197. [Google Scholar] [CrossRef]
  17. Basu, P.; Prezzi, M.; Salgado, R.; Chakraborty, T. Shaft Resistance and Setup Factors for Piles Jacked in Clay. J. Geotech. Geoenviron. 2014, 140, 04013026. [Google Scholar] [CrossRef]
  18. Lehane, B.M.; Gavin, K.G. Base Resistance of Jacked Pipe Piles in Sand. J. Geotech. Geoenviron. 2001, 127, 473–480. [Google Scholar] [CrossRef]
  19. Lorenzo, R.; Dacunha, R.P.; CordãoNeto, M.P.; Nairn, J.A. Numerical Simulation of Installation of Jacked Piles in Sand using Material Point Method. Can. Geotech. J. 2018, 55, 131–146. [Google Scholar] [CrossRef] [Green Version]
  20. Liu, J.W.; Zhang, Z.M.; Yu, F.; Xie, Z.Z. Case history of Installing Instrumented Jacked Open-ended Piles. J. Geotech. Geoenviron. 2012, 138, 810–820. [Google Scholar] [CrossRef]
  21. Kou, H.L.; Zhang, M.Y.; Yu, F. Shear Zone around Jacked Piles in Clay. J. Perform. Constr. Facil. 2015, 29, 4014169. [Google Scholar] [CrossRef]
  22. Gavin, K.G.; Lehane, B.M. The Shaft Capacity of Pipe Piles in Sand. Can. Geotech. J. 2003, 40, 36–45. [Google Scholar] [CrossRef]
  23. Gavin, K.G.; O’Kelly, B.C. Effect of Friction Fatigue on Pile Capacity in Densen Sand. J. Geotech. Geoenviron. 2007, 133, 63–71. [Google Scholar] [CrossRef] [Green Version]
  24. Li, L.; Li, J.P.; Sun, D.A.; Gong, W.B. A Feasible Approach to Predicting Time-dependent Bearing Performance of Jacked Piles from CPTu Measurements. Acta Geotech. 2020, 15, 1935–1952. [Google Scholar] [CrossRef]
  25. Niazi, F.S.; Mayne, P.W. CPTu-based Enhanced Unicone Method for Pile Capacity. Eng. Geol. 2016, 212, 21–34. [Google Scholar] [CrossRef]
  26. Lee, J.; Prezzi, M.; Salgado, R. Experimental Investigation of the Combined Load Response of Model Piles Driven in Sand. Geotech. Test. J. 2011, 34, 653–667. [Google Scholar] [CrossRef]
  27. Liu, J.W.; Duan, N.; Cui, L.; Zhu, N. DEM Investigation of Installation Responses of Jacked Open-ended Piles. Acta Geotech. 2019, 14, 1805–1819. [Google Scholar] [CrossRef]
  28. Wang, J.L.; Wang, Z.K.; Ma, Y. Relationship between Ultimate Bearing Capacity of Single Pile and Final Pressure of Static Pressure Pipe Pile. Rock Soil Mech. 2008, 29, 631–634. [Google Scholar]
  29. Zhang, Z.M.; Liu, J.W.; Yu, F.; Zhang, Q.Q.; Zhang, M.Y. Relationship between Terminative Jacking Force and Ultimate Bearing Capacity of Jacked Pipe Piles. Chin. J. Geotech. Eng. 2010, 32, 1207–1213. [Google Scholar]
  30. Wang, J.T.; Zhang, M.Y. Computation of side resistance of jacked pipe piles based on time effect. Chin. J. Geotech. Eng. 2011, 33, 287–290. [Google Scholar] [CrossRef]
  31. Yu, F.; Tham, L.G.; Yang, J.; Li, Q.G. Observed Long-term Behavior of Residual Stress in Jacked Pile. Rock Soil Mech. 2011, 32, 2318–2324. [Google Scholar]
  32. Yang, Z.X.; Jardine, R.J.; Guo, W.B.; Chow, F. A new and Openly Accessible Database of Tests on Piles Driven in Sands. Geotech. Lett. 2015, 5, 12–20. [Google Scholar] [CrossRef] [Green Version]
  33. Li, J.P.; Li, L.; Sun, D.A.; Rao, P.P. Analysis of Undrained Cylindrical Cavity Expansion Considering Three-Dimensional Strength of Soils. Int. J. Geomech. 2016, 16, 04016017. [Google Scholar] [CrossRef]
  34. Li, L.; Li, J.P.; Gong, W.B.; Zhang, L.X. Elasto-plastic Solution to Expansion of a Cylindrical Cavity in K0-consolidated Natural Saturated Clay. J. Harbin Inst. Technol. 2017, 49, 90–95. [Google Scholar] [CrossRef]
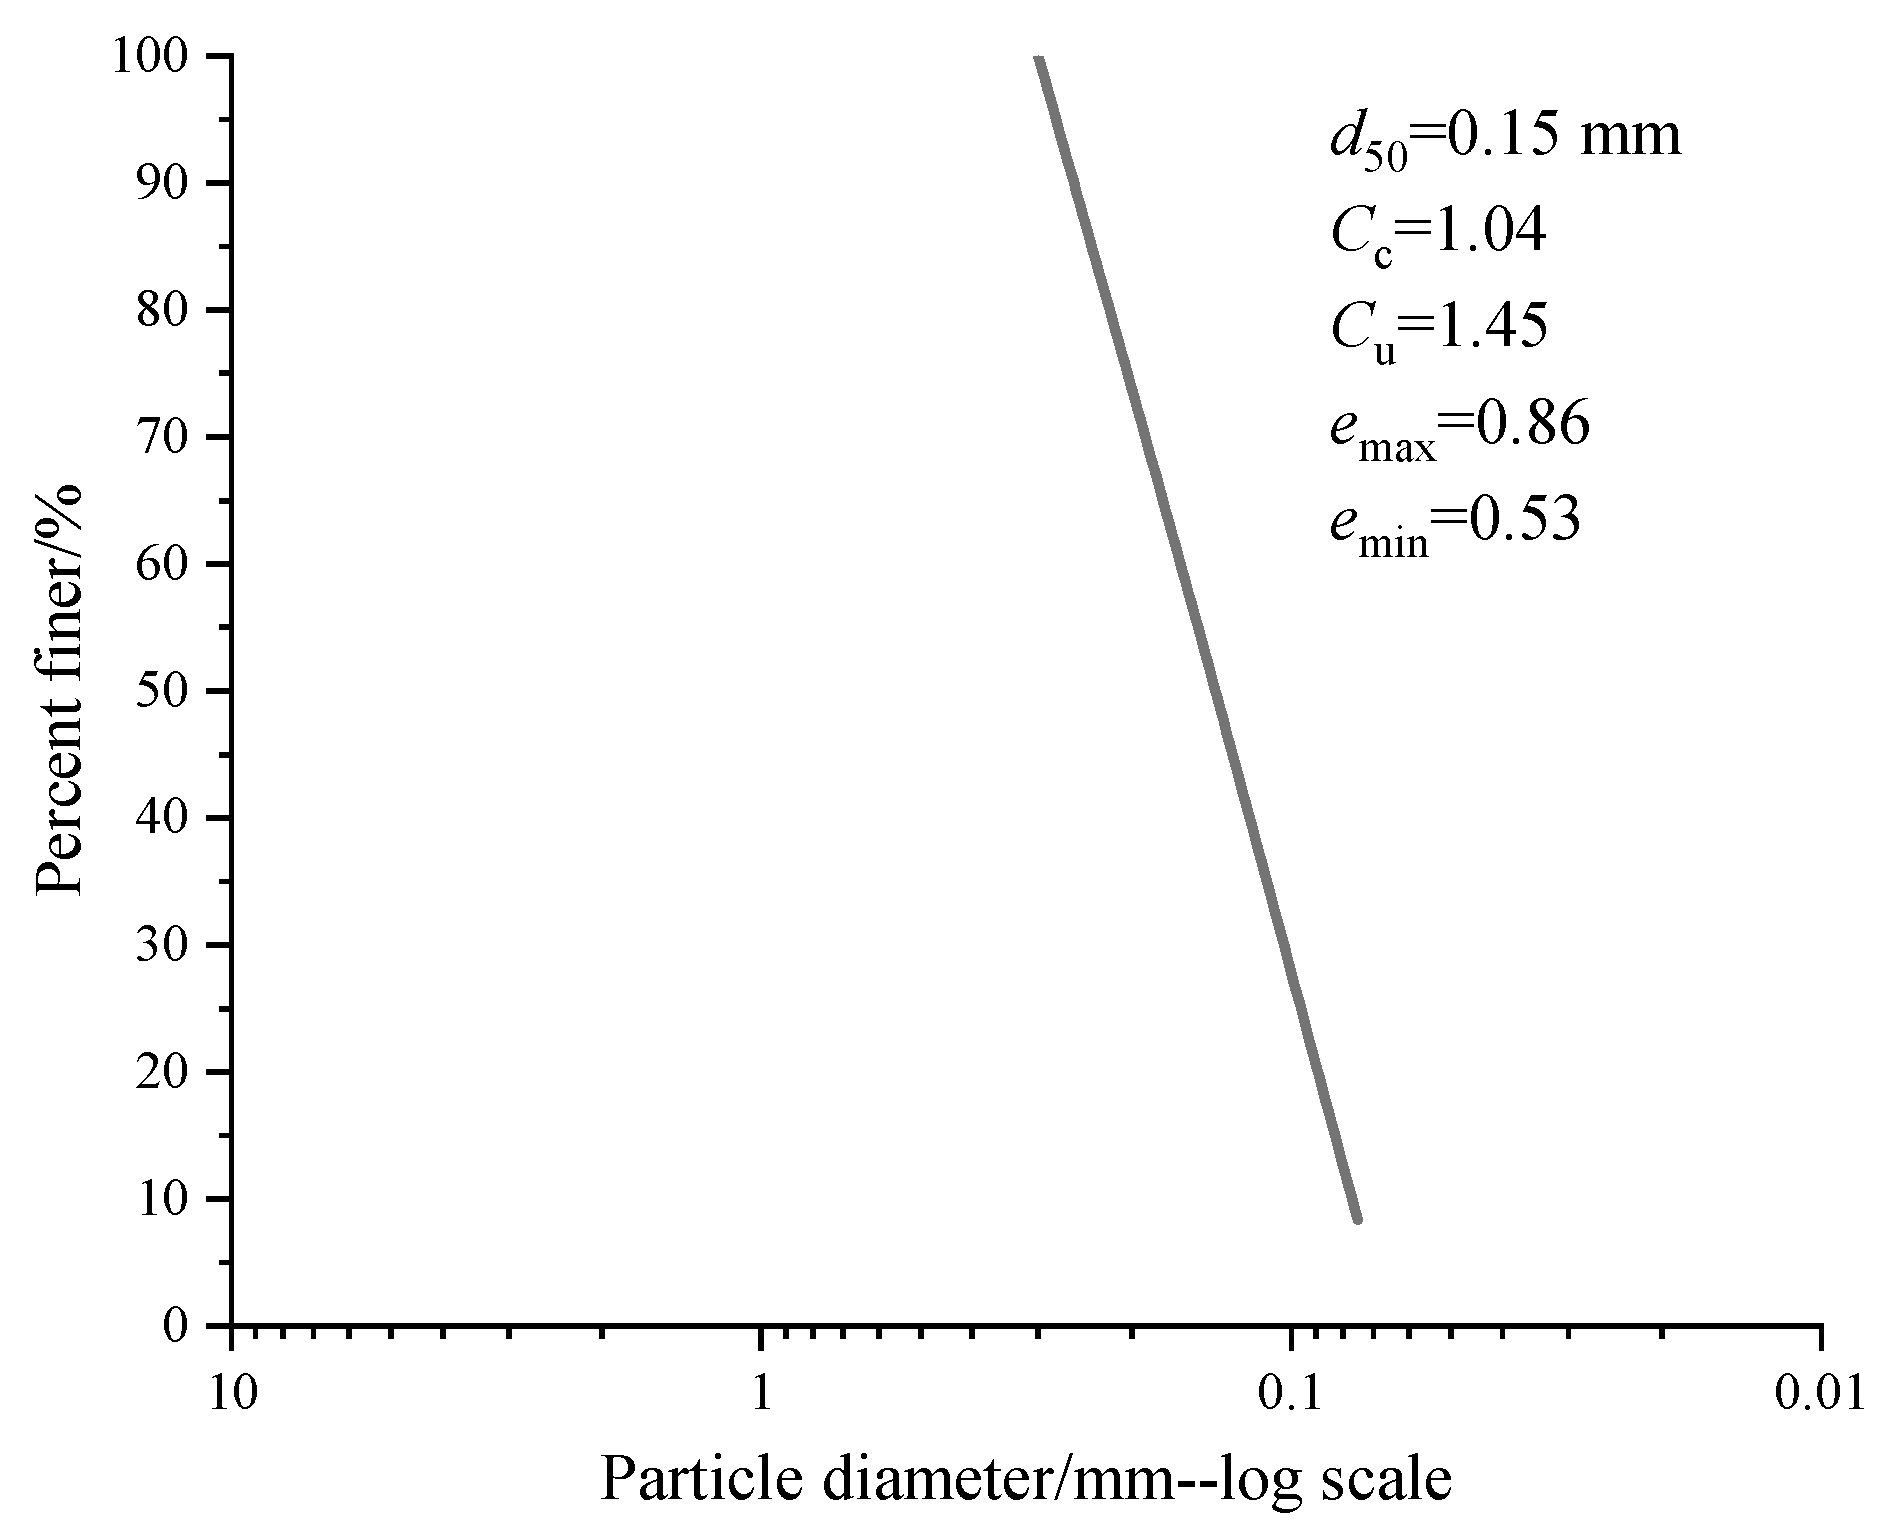
Figure 1. Sand particle size distribution curve.
Sustainability 14 14493 g001
Figure 2. Pressure transducers with the model pile.
Sustainability 14 14493 g002
Figure 3. Jacking equipment.
Sustainability 14 14493 g003
Figure 4. Jacking process.
Sustainability 14 14493 g004
Figure 5. Jacking pile pressure at different pile lengths.
Sustainability 14 14493 g005
Figure 6. Jacking pile pressure at different driving speeds. (a) Jacking pile pressure of Pile #1; (b) Jacking pile pressure of Pile #2.
Sustainability 14 14493 g006
Figure 7. Pile end’s resistance during installation of pile at different pile lengths.
Sustainability 14 14493 g007
Figure 8. Pile end’s resistance at different driving speeds. (a) Pile end’s resistance of Pile #1; (b) pile end’s resistance of Pile #2.
Sustainability 14 14493 g008
Figure 9. Pile rebound displacement at different pile lengths.
Sustainability 14 14493 g009
Figure 10. Pile rebound displacement at different driving speeds. (a) Pile rebound displacement of Pile #1; (b) pile rebound displacement of Pile #2.
Sustainability 14 14493 g010
Figure 11. The relationship between estimated pile rebound displacement and test value.
Sustainability 14 14493 g011
Figure 12. Uplift displacement of the top of Pile #1. (a) The uplift displacement with pile length during the installation of Pile #2; (b) the uplift displacement with driving speeds during the installation of Pile #2; (c) the uplift displacement with pile length during rebound of Pile #2; (d) the uplift displacement with driving speeds during rebound of Pile #2.
Sustainability 14 14493 g012aSustainability 14 14493 g012b
Figure 13. The horizontal displacement of the top of Pile #1during installation of Pile #2 and rebound of Pile #2. (a) The horizontal displacement during the installation of Pile #2; (b) the horizontal displacement during the installation of Pile #2; (c) the horizontal displacement during rebound of Pile #2; (d) the horizontal displacement during rebound of Pile #2.
Sustainability 14 14493 g013
Figure 14. The locations of the model pile and the section diagram. (a) The locations of the model pile; (b) ta section of the pile diagram.
Sustainability 14 14493 g014
Figure 15. The stress of the soil surrounding pile #1. (a) E-E section; (b) D-D section; (c) C-C section; (d) B-B section; (e) A-A section.
Sustainability 14 14493 g015
Figure 16. The changes in location of Pile #1 during installation of Pile #2 and rebound of Pile #2.
Sustainability 14 14493 g016
Figure 17. The changes in the radial stress of the soil surrounding the pile at different pile lengths.
Sustainability 14 14493 g017
Figure 18. The changes in the radial stress of the soil surrounding the pile at different driving speeds. (a) The changes in the radial stress of Pile #1; (b) the changes in the radial stress of Pile #2.
Sustainability 14 14493 g018
Figure 19. Load–Settlement curve. (a) Load–settlement relationship with pile length; (b) load–settlement relationship with driving speeds.
Sustainability 14 14493 g019
Table 1. Experimental program.
Experiment TypeDriving speed v (mm/s)Pile Length L (D)Pile Diameter D (mm)
Type 10.19, 11, 1350
Type 20.1, 0.25, 0.5, 0.75, 11350
Table 2. Regression parameters.
Regression
Parameters
Pile #1 L = 13 DPile #1 L = 11 DPile #1 L = 9 DPile #2 L = 13 D
a2.72.11.883.04
b0.130.080.060.15
Publisher’s Note: MDPI stays neutral with regard to jurisdictional claims in published maps and institutional affiliations.