Article

Dynamic Pricing Strategy of Charging Station Based on Traffic Assignment Simulation

1
Beijing Key Lab of Urban Intelligent Traffic Control Technology, North China University of Technology, Beijing 100144, China
2
School of Management Science and Engineering, Central University of Finance and Economics, Beijing 100081, China
*
Authors to whom correspondence should be addressed.
Sustainability 2022, 14(21), 14476; https://doi.org/10.3390/su142114476
Submission received: 10 October 2022 / Revised: 28 October 2022 / Accepted: 2 November 2022 / Published: 4 November 2022
(This article belongs to the Special Issue Dynamic Traffic Assignment and Sustainable Transport Systems)

Abstract

:
The number of electric vehicles is increasing rapidly worldwide, leading to increasing demand for charging. This will negatively impact the grid. Therefore, it is essential to relieve the power grid operation pressure by changing the charging behaviour of users. In this paper, the charging behaviour of electric vehicles was guided by price instruments to maintain grid balance This paper uses travel simulation to establish the relationship between travel demand and electricity prices. The results were evaluated through the amount of grid voltage drop and network loss. Furthermore, we used the differential evolutionary algorithm to calculate the optimal operation status of the grid, which contains the minimal network loss and maximal voltage drop at different charging stations and the charging price. Finally, the effectiveness of the mechanism proposed in this paper was compared with other simulation examples. The results showed that the pricing strategy could guide users’ charging choices and maintain the grid load balancing. The simulation results show that the average bus voltage increases by 1.26% and 6.59%, respectively, under different requirements.

1. Introduction

The world’s energy mix is undergoing a third transformation [1]. Since the world entered the industrial age, the impact of traditional fossil energy on the environment has become increasingly evident and has resulted in a crisis of energy depletion. The development of electric vehicles (EVs) has become a global consensus to solve this problem. In the last decade, electric vehicles have achieved explosive growth under the vigorous promotion of governments. Global sales of electric vehicles were around 6.75 million in 2021, an increase of 108% over 2020 [2]. As the number of EVs increases, the EV charging load on the grid will also change considerably, resulting in a negative impact on the grid’s reliability caused by the rushing occurrence of EV charging demand [3,4]. Therefore, it is essential to guide users to distribute charging locations and time to reduce the negative impact on the grid.
Traffic distribution is the basis of the transportation system. Today, with the continuous development of EVs, traffic distribution is of great significance to the logical planning of charging facilities and promotion of the purchase of EVs. With the help of traffic assignment models, we can explore users’ charging demands and charging preferences during travel. Moreover, it is helpful to develop EV research. As EVs take longer to replenish energy compared to conventional fuel vehicles, they tend to induce queues at charging stations, as well as traffic jams [5]. EVs tend to generate longer queues at charging stations and traffic jams [5]. The technical advancement in charging speed aims to increase the satisfaction of EV users. However, it poses a harsher challenge to the grid. A large number of time–space random charging loads impact the grid, and can seriously affect the power system [6]. Taking East China as an example, it is estimated that the scale of electric vehicles will grow to 24.77 million by around 2030, and the power demand will reach 132 twh, accounting for 8–12% of the traditional load [7]. In addition, under the premise of residential base electric use, electric vehicle loads often overlap with peak electric loads, leading to the emergence of higher peak-to-valley differences [8,9]. This will further reduce the operational efficiency of the power system. For this reason, existing studies reduce the impact of charging loads on the grid by changing the charging behaviour of EV users. Existing research includes reducing peak-to-valley differences by directing users’ charging periods [10]; reducing system load by giving control of charging during idle periods to the system for coordination through smart grids, as vehicles are generally idle for longer than they are charged [11]; and also balancing the load by means of directing or excluding EVs to specific charging stations [12]. At the same time, different regions in the city have different power consumption characteristics; that is, different regions have different power consumption peaks and valleys in time. The margin generated by these peaks and valleys provides the possibility for EV users to coordinate grid operation. At the same time, today’s charging stations have the time-sharing pricing function. Due to the current Internet technology, people can easily get the electricity price information and usage of the surrounding charging stations through APP. The research has proved that EV users are price sensitive, and people will choose charging stations that are farther away from the current area for the price of electricity [13,14]. Therefore, the power grid quality can be improved through the regional charging station dynamic pricing, which can bring benefits to users.
In summary, this paper guides the space–time distribution of EV charging demand by optimizing the time-of-use price of charging stations in a region. The popularity of different charging stations can be dynamically adjusted in combination with the primary power consumption in the region by employing dynamic pricing for different charging stations. Thus, it will improve the power grid’s operation quality by reducing its voltage drop and network loss.
Many studies have shown that electricity price is the critical factor affecting the charging behaviour of users [13,14]. Therefore, it is necessary to describe the operation state of the power grid in time and space and use the demand grid simulation model to calculate the state of the power grid. This paper aims to reduce the impact of EV users’ charging on the power grid when the number of EV users increases, and to improve the quality and security of the power grid. It adopted a dynamic pricing method to guide users in different periods, because users have different demands for different charging stations at different times of the day. Since the problem was described as the coordination problem of different charging stations’ electricity prices in the region, the grid simulation model for travel demand was established to solve the cooperative electricity price of charging stations. Based on the simulation, the price of electricity in different periods was solved. Thus, dynamic pricing coordinated among different charging stations can be obtained. The organizational structure of this paper is as follows: in the second part, the current work was summarized. In the third part, problem analysis and assumptions, system framework, traffic simulation and solution logic were proposed. Starting from Section 4, as shown in Figure 1, each model in the traffic simulation and the solution process was described in detail. The effectiveness of the proposed method was verified by a simulation case in Section 6. Finally, see Section 7 for conclusions.

2. Literature Review

Along with the development of EVs, supporting charging infrastructure is being popularised and built on a large scale to enhance the experience of EV users. Researchers have noticed that the increase in charging demand has caused an increase in the peak load on the grid [15].
As for the electricity load generated by EV charging demand, in general, users charge in a disorderly manner according to their travel needs, and due to people’s general travel pattern, their charging needs often overlap in terms of time and space options, which results in a pile-up of charging load. Thankfully, because EVs are the same as fuel vehicles, users can charge selectively in both time and space, and the EV charging load has both temporal and spatial flexibility, which can be described in terms of charging behaviour. Certain factors can be used to influence the charging behaviour of the user, thus changing the distribution of the charging load in time and space, improving the quality of the grid and enhancing the user experience.
Current researchers have focused on the factor of tariffs at charging stations, while a large number of studies have demonstrated that tariffs are an effective tool to guide users’ charging behaviour [12,16]. Researchers modelling the impact of tariffs on users’ charging behaviour have described them as game models [17,18,19] and decision models [20], respectively. After using the model of the effect of tariff on behaviour, for the time flexibility aspect, researchers have influenced the charging behaviour of users through Time-of-Use (TOU) tariffs to direct the charging load from peak hours to other hours, serving the purpose of peak shaving and valley balancing on the grid. The TOU shifts the charging demand of EV customers over time, preventing the charging load of EVs from overlapping with traditional base electricity consumption and avoiding transformer overload. A similar effect can be achieved through smart grids. This type of research tends to direct users to recharge at off-peak times, but after prolonged periods of intensity, new peaks in grid load can easily occur. For this reason, there is research using smart grid technology to coordinate EV charging via vehicle to grid (V2G) in [21] with EV charging and discharging coordination used for grid-to-vehicle (G2V) and V2G operations with a predefined State of Charge (SOC) for EV users. Charging times are scheduled based on customer demand for the day ahead through the proposed approach. The user participation scheme improves the performance of the control algorithm in peak load shifting. As for spatial flexibility, the main objective is to weaken the charging load in hotspots by directing users to different charging locations to achieve spatial load balancing. The literature [22] balances the load between charging stations and reduces queuing times by adjusting pricing to discourage the arrival of EV users based on their own load level. However, this is only a discussion of the profitability of a single charging station and does not consider regional coordination between charging stations.
For the research on regional dynamic pricing, a large number of researchers have conducted a lot of research. Literature [23] considers that electricity price is an effective way to stimulate users, and develops an optimization method based on electricity price incentive. The two-level optimization strategy is adopted for optimization. However, it does not take into account that people’s traffic behavior will lead to different use of different charging stations in a day, which requires multiple price adjustments in a day. Another document [12] also studied regional pricing, which linked the price of electricity with the use of charging stations by building regression equations, and used an example to show that the charging load can be reduced by 28.02%. However, the impact on the power grid shall not be considered. Literature [24] adopts the design TOU mechanism and adds the adjustment sheet of peak price, which only considers the situation of one charging station, and does not involve the coordination and adjustment between charging stations.
In summary, although existing research efforts are challenging, existing research has generally focused on the TOU pricing process. Even when smart grids are used for dispatch optimisation, they are more often focused on shifting the total load or regional load over time. The mapping of load from the road network to the grid is also worthy of attention for future increases in charging demand, increased density of charging station deployment, and direct regional station-to-station coordinated pricing. The grid is not just a temporal load. It is also spatially differentiated. Users’ travel behaviour is accompanied by charging behaviour, which is influenced by the tariff, and ultimately creates a spatial and temporal load on the grid. In this paper, different TOU pricing strategies are used for charging stations under different grid nodes by developing a week’s worth of different charging station tariffs in advance. A charging choice model is developed to simulate the user’s choice psychology between different charging stations. Grid optimisation is carried out in the form of guiding EV users to make spatial shifts.

3. Framework for Pricing Strategy

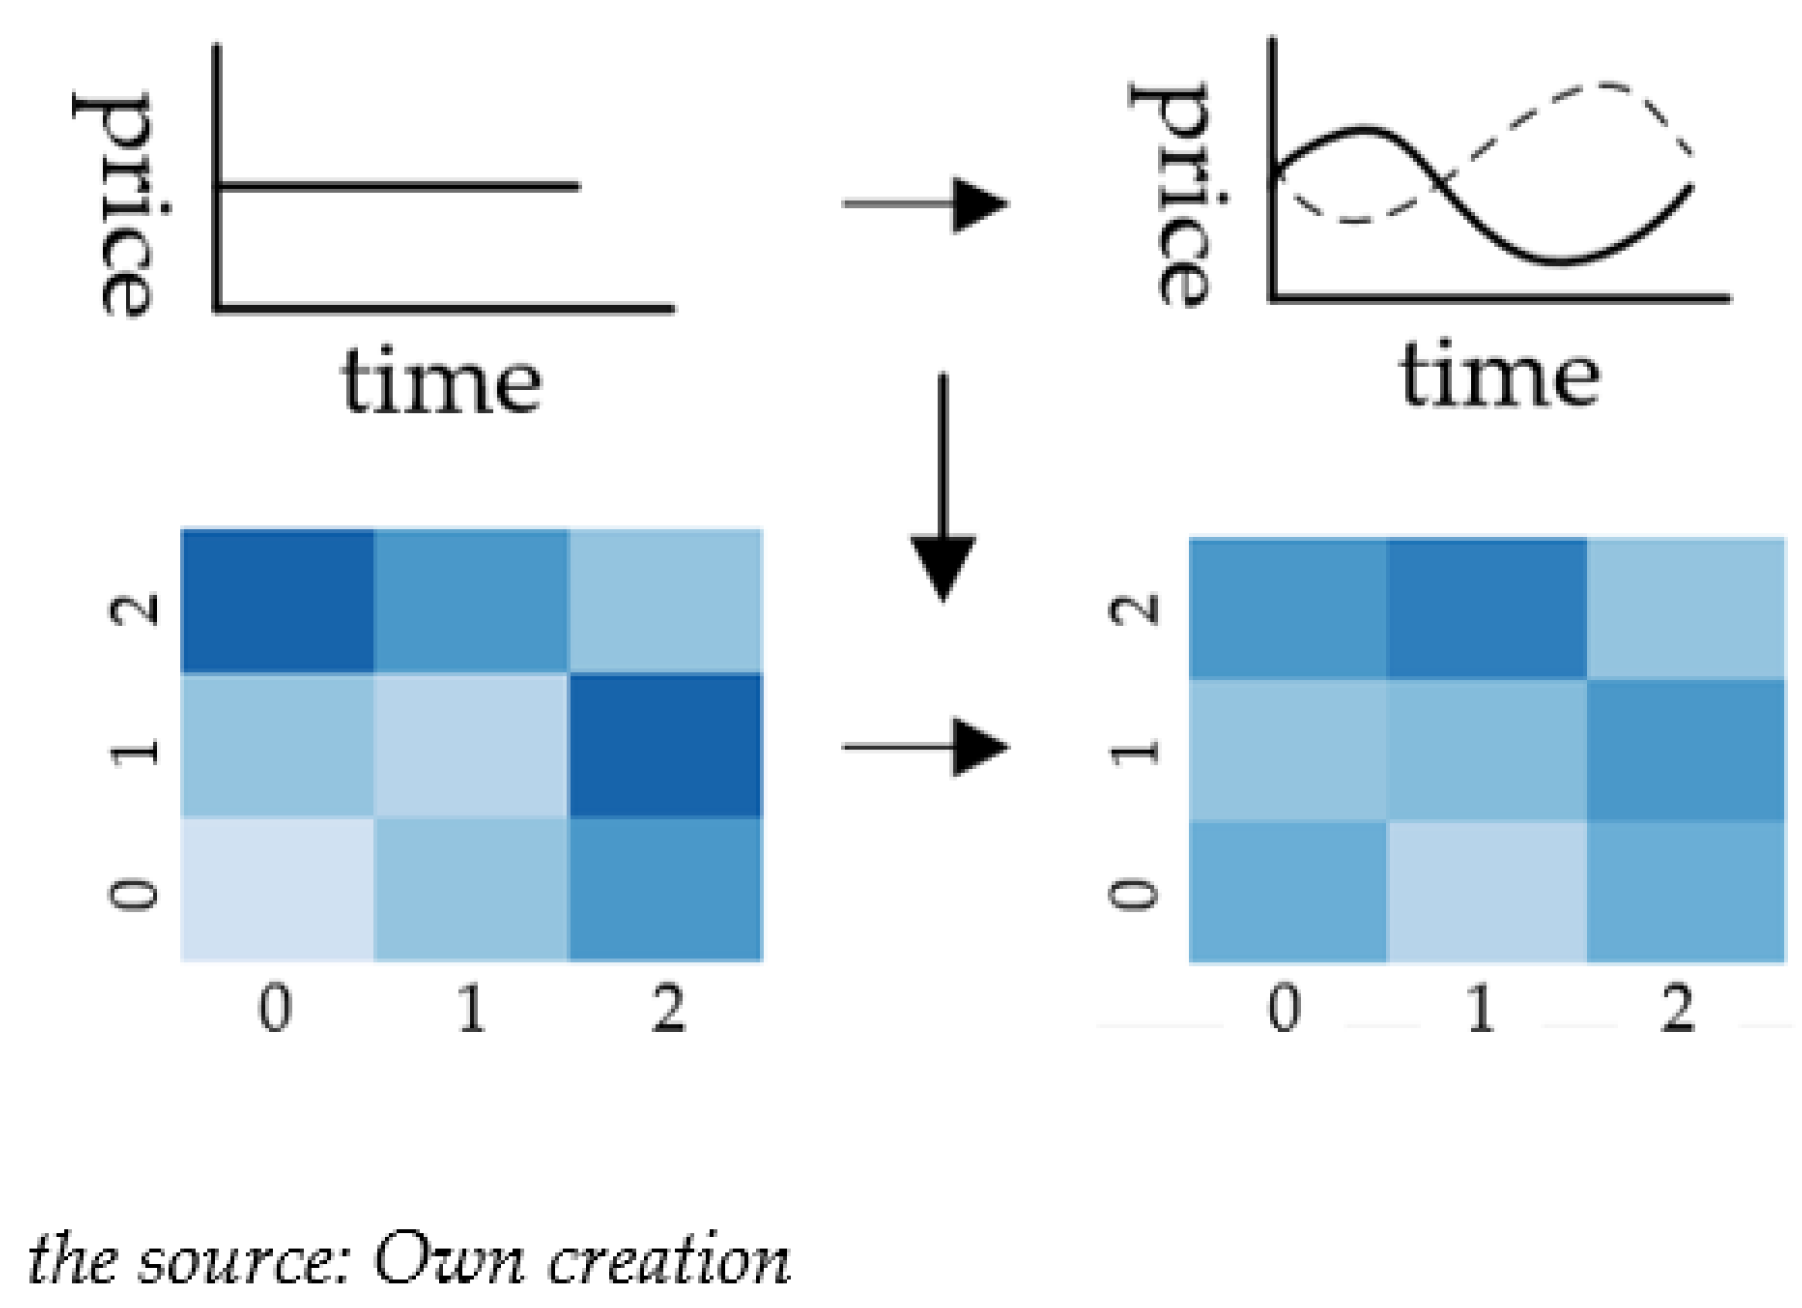
The enactment logic of the pricing algorithm shown in Figure 2, where the control centre announces the time-of-use tariff for each charging station for the next cycle one week in advance, assumes that the user captures this information with full tariff information and with a correct perception of the surroundings. This assumption is acceptable in today’s information age, in which it is easy for people with smartphones to access such information through navigation software and charging station operators’ apps. The guidance results are shown in Figure 3. Through the influence of electricity prices at different charging stations in different periods, charging users are guided to different charging stations for charging to balance the grid load.
In order to solve the price of electricity to improve the quality of the power grid, it is first necessary to establish the process of the impact of the price change on the power grid under the specific demand. Because this paper considers the evaluation of the entire regional power grid and the coordinated electricity prices of charging stations in different regions, a dual network collaborative simulation of traffic demand and power grid is adopted, which contains the charging selection model of people’s response to the electricity price. Based on the simulation, the operation of the power grid can be obtained in the case of specific demand and electricity price. As shown in Figure 4, the whole simulation consists of two parts. The first part is called charging station load simulation: it simulates the use of charging stations through the user’s travel demand and people’s feedback on electricity prices. The second part is the power flow calculation of the power grid: the power of the power grid is converted according to the usage of the charging station, and the basic power load generated by residents and factories is added. The evaluation indexes of power grid are calculated: power grid voltage drop and power grid loss.
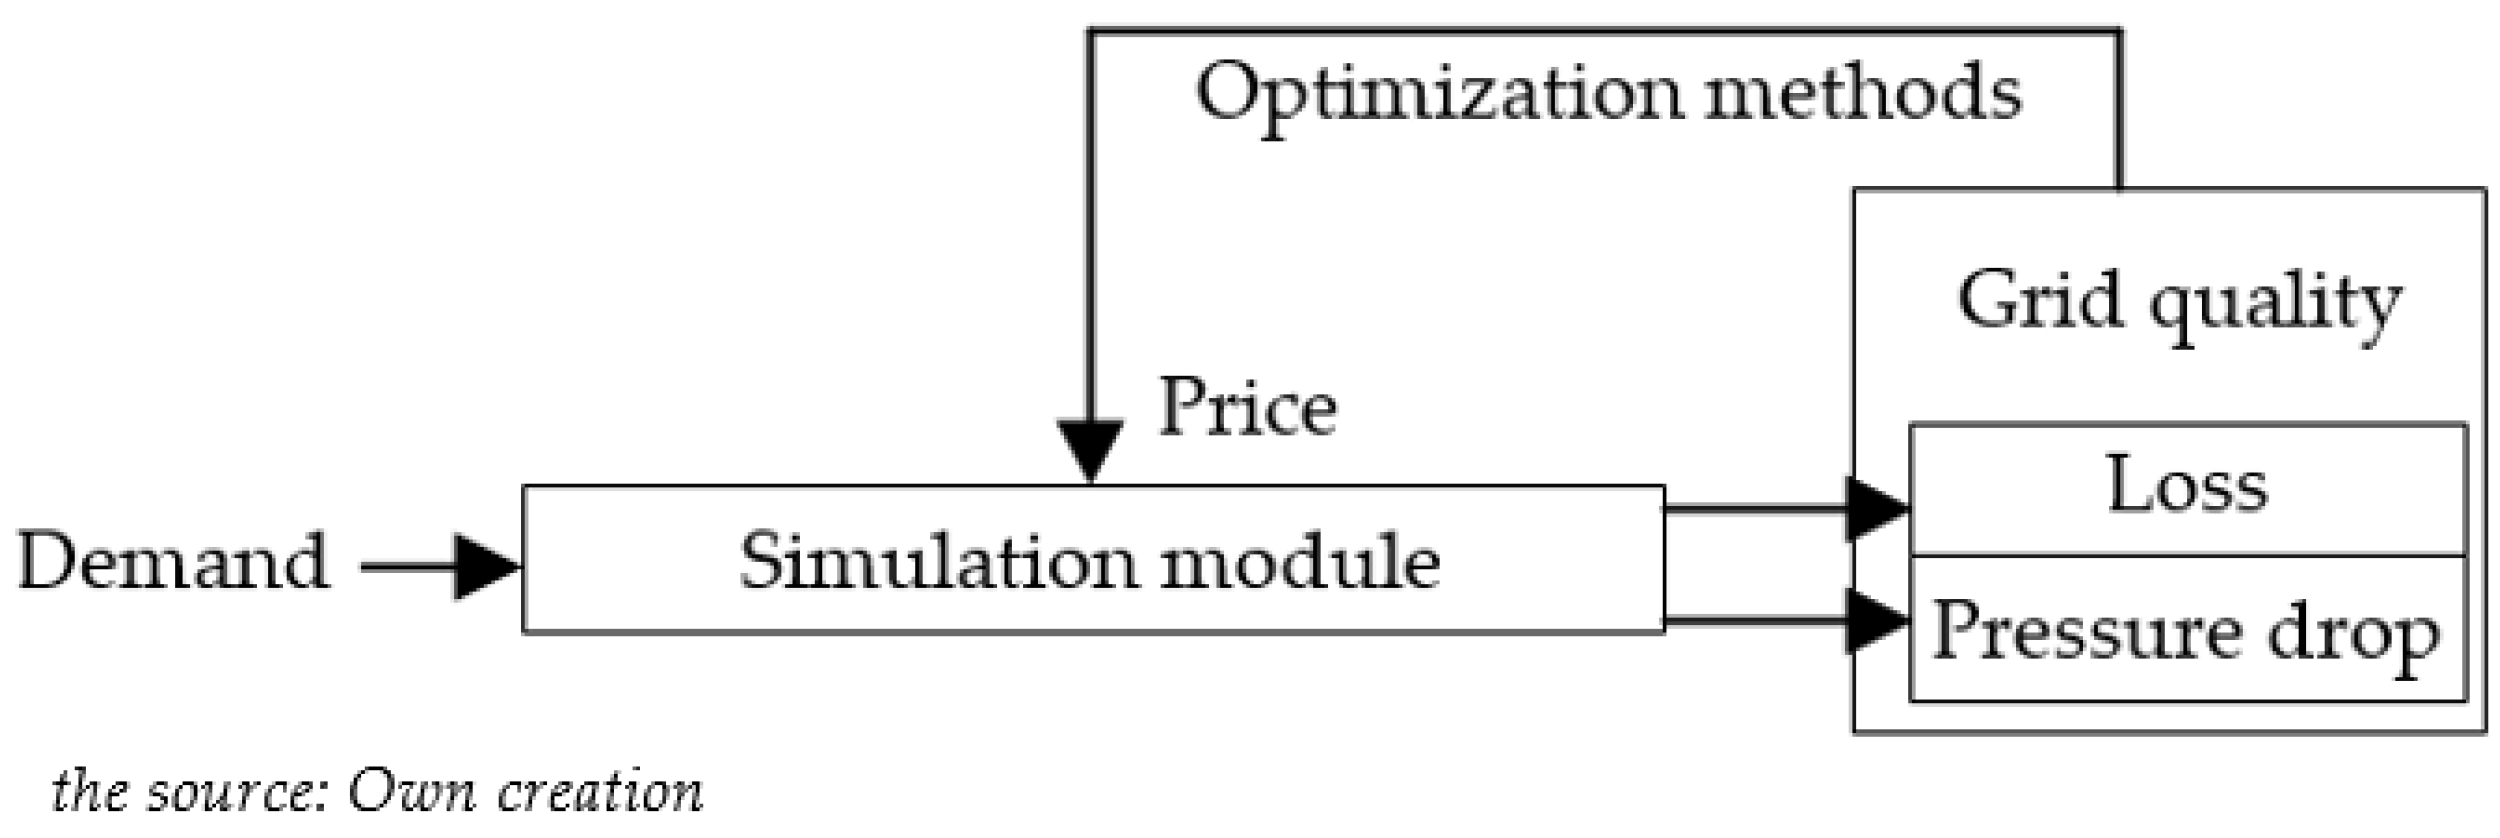
After the electricity price has been assessed for the power grid, the electricity prices of different charging stations can be solved through this simulation by configuring different electricity prices. The input and output of the simulation can be represented by P L , l , V = G ( u , p ) , P L , l represents the grid loss and V is the grid voltage drop. These are parameters used for grid evaluation; u is the traffic demand is the input parameter of the simulation; p indicates that the charging station price is a decision variable to be solved. Figure 5 shows the optimization process. The simulation module is used to establish the relationship between travel demand, electricity price and power grid quality. Through this simulation module, the electricity price solution is established as an optimization problem. The differential evolution algorithm is used to optimize and solve the optimal price of different charging stations, and the cooperative price of charging stations in the following week is calculated.

4. Dual Network Collaborative Simulation of Traffic Demand and Power Grid

Figure 6 shows the detailed module relationships in the simulation. The influence of tariff factors in the charging choice phase of the user is considered. The charging demand is translated into charging loads on the charging stations by describing the travel-to-charge behaviour of a single EV user. A user’s travel demand is first labelled by OD demand. The travel time, and energy consumption during the trip are calculated, and then the user is evaluated by the charging probability as to whether or not to charge in that state, and when the user decides to charge, the charging choice model is used to make the choice of charging station in combination with the tariff. Finally, the end-of-charging basis is combined with the load occupation situation. The behaviour of multiple users is superimposed in time and space to obtain the operating conditions of the different charging stations, and finally, the results of the grid operation are calculated by means of tidal calculations.

4.1. Demand Allocation

For the initial traffic assignment process. The road network topology is provided by G ( N , V ) , which is a directed graph consisting of vertices and edges; N denotes the key traffic nodes that can be reached and and charging stations established; V denotes the main roads and the direction of circulation that links N through V. In this paper a simple form of traffic assignment is used, based on the travel demand Origin–Destination (OD) information based on the shortest path on the road network for the assignment of trips. The OD matrix is scaled to a matrix that determines the user’s departure time and the termination point.

4.2. Calculation of Variables during Travel

4.2.1. Calculation of Travel Time

The simulation requires the calculation of the travel time of the user in the course of the trip. For different areas, the congestion level of the road network is not the same at different times of the day, and thus, the time spent by the user on a particular road is also different. In this paper, the traffic index is interpreted according to the Table 1 literature [25], and the congestion index is used to correct the time spent by vehicles on the road section in the simulation. The traffic index is defined for different road sections at different times of the day, and when it is necessary to calculate the travel time of the vehicle to reach its destination, the road section through which the vehicle passes is traversed, and the time consumed during the trip through the different road sections is obtained by multiplying the corresponding traffic index by the travel time multiplier and adding up the time taken to reach the destination.
According to the actual situation, the road congestion index at different time periods in the simulation road is marked, and the driving time is calculated as:
T l = L l v ¯ l
T l , t = T l ( 1 + δ l t )
where T l is the time required to pass section l in the clear state; L l is the length of the section l; v ¯ l is the average speed through the section l, which can be taken according to different road registration; T l , t is the actual time required to pass through section l at time t; δ l t is the time consumption coefficient of the section l at time t.

4.2.2. Energy Consumption Model

Electricity consumption is calculated by simulating the amount of electricity change after the electric vehicle drives in the road network for a certain time or reaches the destination, which is an important basis for the user to judge whether the vehicle needs to be charged in the simulation environment and affects the generation of charging demand. The power consumption of electric vehicles is directly related to the driving course, but due to the influence of the road environment, the process of driving in the congested road section is often accompanied by frequent starts and stops, which causes additional loss of electric power. In this paper, assuming the traffic index as the loss coefficient of a vehicle driving over a certain road section at a certain time, the remaining S O C at the end of a certain journey is:
S O C e = S O C c L l ( 1 + δ t , l ) L max
where S O C e is the remaining power after this trip; S O C c is the remaining power at the beginning of this trip; L l indicates the distance of the road section to be passed; L max is the maximum vehicle range; δ t , l denotes the road loss index of section l at time t.

4.2.3. Charging Decision Model

The charging decision model is used to describe the user’s judgment of charging before and after the trip, and the description of the charging destination. Due to the characteristics of electric vehicles that have a long time to replenish energy, the charging behavior of users mostly focuses on the beginning of a trip or the end of a journey. Therefore, at this stage, the user can be divided into two parts from the end of the journey to the charging station. The first part is the charging probability model; the second part is the charge selection model. The charging probability model is used to describe whether users decide to supplement energy according to the current state. The charging selection model is the selection of candidate charging stations after the user decides to charge.
  • Charging probability model;
Electric vehicle user charging behavior occurs before the user departs and after the user’s trip. In these two states, users evaluate whether they need to recharge or not based on the current moment, combined with the remaining power situation, and future travel planning. In this paper, it is determined that when the remaining power is below 20% [26], the EV user will engage in charging behavior after reaching the destination due to the mileage anxiety problem of the EV user. Additionally, whether users decide to recharge or not is related to the remaining battery range and the amount of power needed for the destination they are going to. Generally speaking, the lower the remaining power, the more power is needed for the next journey, and the more likely the user is to charge.
p n = 1 , S O C e SO C o d , S O C e < 20 % exp a p S O C e S O C o d S O C e 1 , S O C e > S O C o d
where p n denotes the charging probability of the nth user in the current state, which will be determined by drawing a random number in the simulation; S O C e the remaining S O C when making charging decisions; S O C o d denotes the S O C required for the next trip; a p denotes the charging probability coefficient for different types of users.
  • Charging selection model considering electricity price:
EV users have time flexibility and spatial flexibility. Their spatial flexibility is mainly manifested in that when the demand for charging arises at a certain place, they will evaluate the surrounding charging stations with the surrounding road information, electricity price and other factors, and finally choose a suitable charging station for energy replenishment. Charging station selection is the key to charging demand distribution, which is a description of EV users’ charging behavior.
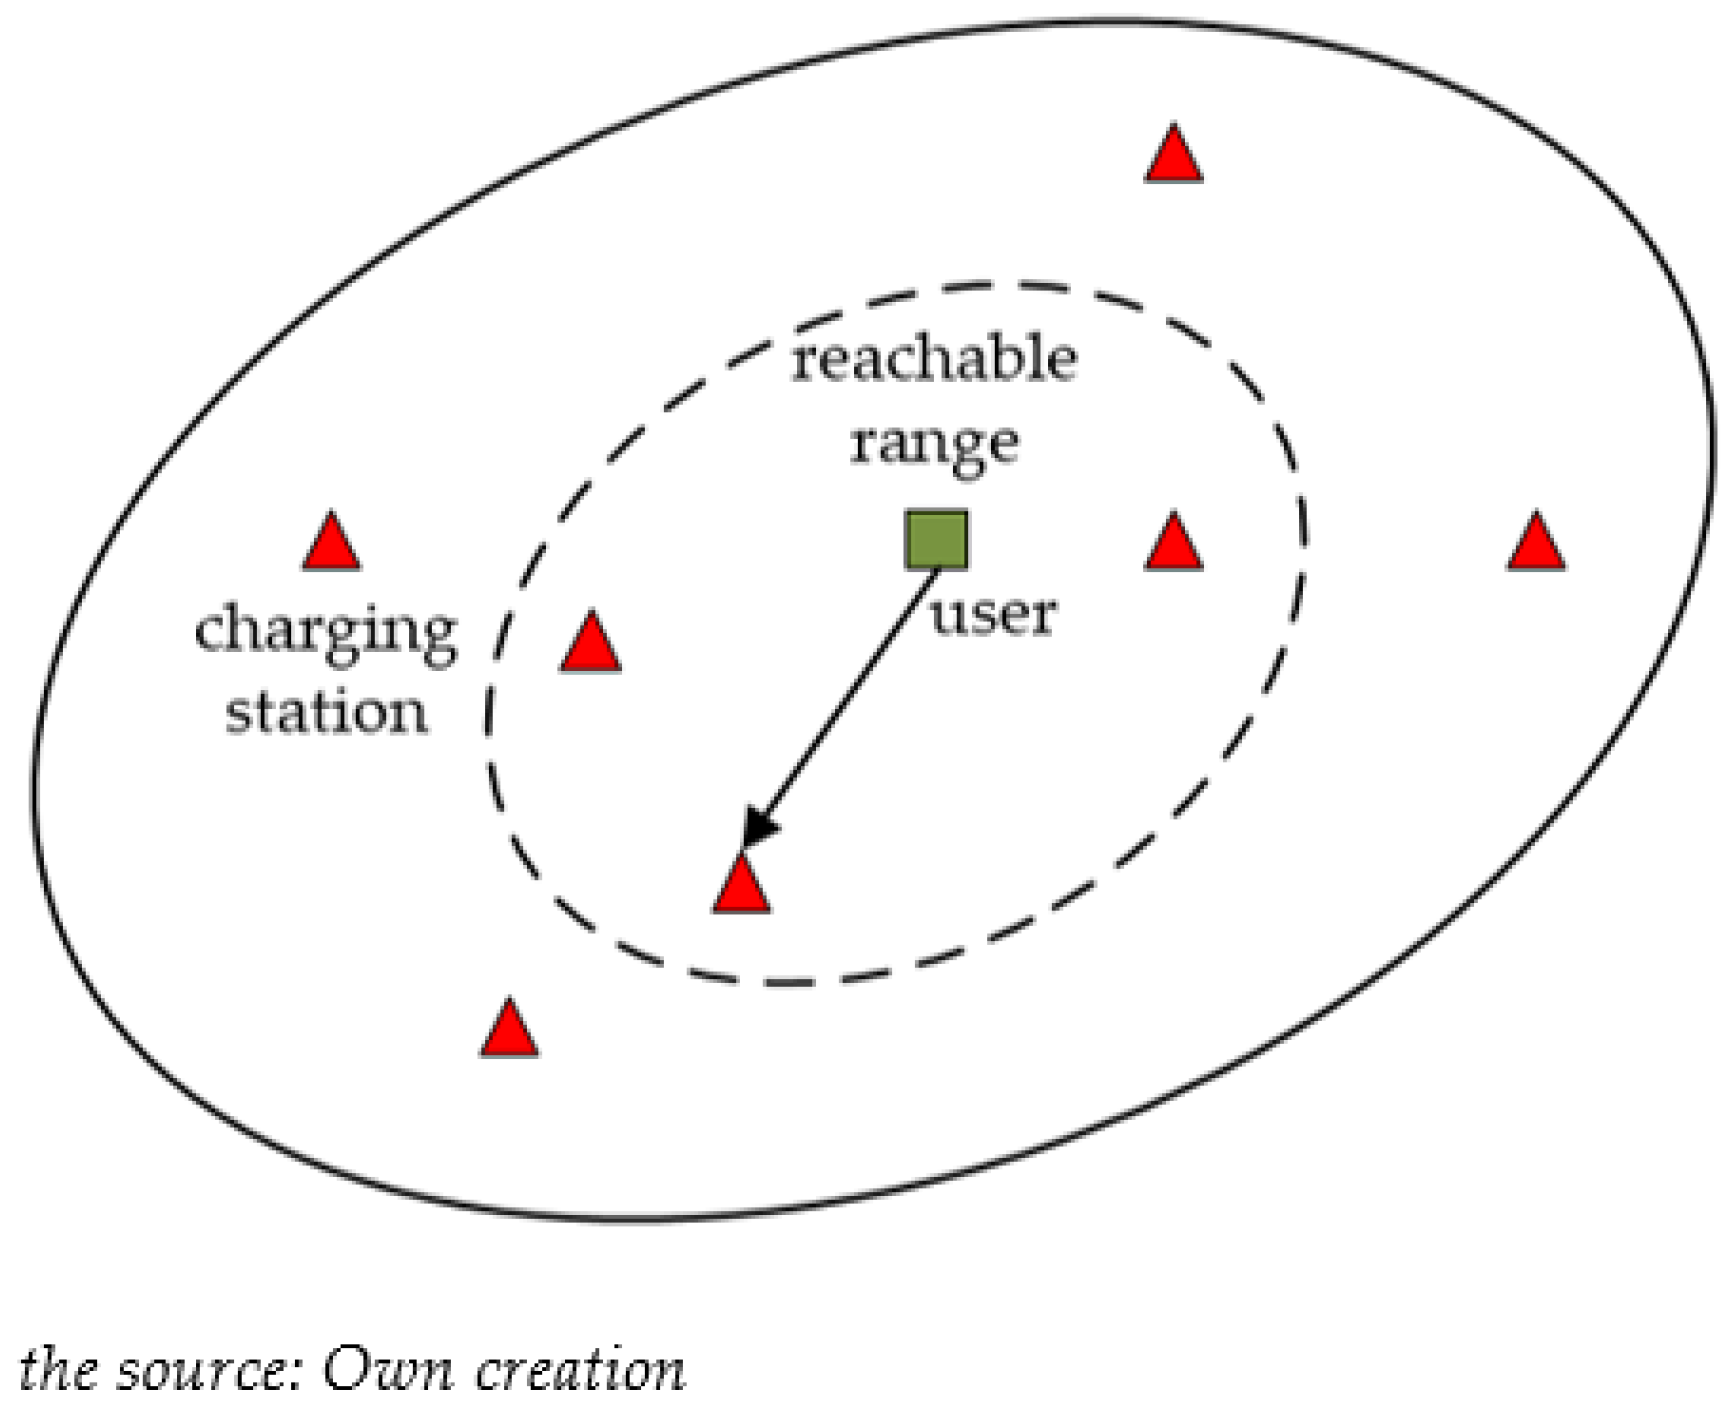
As shown in Figure 7, users will first determine the range of charging stations that can be reached and form a collection of charging stations to be selected ( s 1 , s 2 , s n ) due to the limitation of their residual charge after generating a charging demand. The charging stations that can be reached nearby shall be selected according to the electricity price, road conditions, the time consumed to reach the destination, and the degree of the next journey. This paper mainly focuses on three factors: the charge point price, the time to reach the charging station, and the queuing situation in the charging station.
Since users tend to have a certain subjective intention when perceiving charging solutions, this is in line with the perception of prospect theory. Prospect theory [27] assumes that people focus more on gains and losses when making decisions, and that the values of gains and losses are not linear with respect to the original attributes. In this paper, prospect theory is applied to calculate the prospect value and determine the final solution by weighting. The decision variables of each charging station are composed of the charging station price, the distance from the charging station, and the queuing situation in the charging station, which are represented by s i = ( p , d , q ) . Convert s i to ± r i = ( p , d , q ) according to the reference point. The decision variables are transformed into prospect values according to prospect theory, and calculated as follows.
E ( r i ) = r i α λ r i β , r i 0 , r i < 0
where r i = ( p , d , q ) denotes the degree of deviation of the decision variables from the reference point, including electricity price p , distance d , and queuing condition q i in the station; α and β reflects the loss and attitude of the decision maker towards the gain and denotes the degree of convexity of the value function [28]; 0 α 1 , 0 β 1 , λ denotes the diminishing explicit sensibility; and is the degree of loss aversion. Usually, the decision maker is averse to loss; therefore, generally, λ 1 it is appropriate to explain the value of electric vehicle users by prospect theory due to the presence of decision time constraints.
Decision weighting formula:
π p + = p θ p θ + 1 p θ 1 / θ π p = p θ p μ + 1 p μ 1 / μ
where π denotes the positive and negative decision weights; p denotes the weight vector of attributes; θ and μ indicates the degree of income preference and risk aversion of decision makers. Then, the final combined prospect value is:
V r i = π + E i + + π E i
where V r i denotes the comprehensive prospect value; π + denotes positive weight coefficient; π denotes negative weight coefficient; E i + denotes the value of positive foreground value; E i + denotes negative foreground value.
Finally, the multiattribute foreground values of the alternative charging stations are ranked, and the final charging station is obtained as the user’s final charging station choice.

4.2.4. Charging Time Model

The end-of-charge S O C setting involves the user’s occupancy of the charging pile and the impact on the grid load. Generally, the user’s end-of-charge S O C is between the amount of power to satisfy the next trip and the maximum S O C . The factors that affect the amount of electricity they charge include the dwell time and the charging tariff. To simplify the study while making the simulation more stochastic, charging time can be expressed as [29]:
T charge = E S O C e S O C c η P k
where T charge denotes the charging time; E denotes the battery capacity of the electric vehicle; S O C e denotes the end-of-charge power, S O C e U ( 0.8 , 1 ) according to [30]; S O C c denotes the S O C at the beginning of charging; η denotes charging efficiency, taken as 0.9; P k denote the charging power of a class k charger.

4.3. Grid Load Simulation

The access of electric vehicle load superimposed on the base load will have some impact on the grid. In this paper, we evaluate the grid load, voltage, and loss by simulating the spatial and temporal operation of the charging station obtained from the simulation. First of all, the total grid load comes from the superposition of charging station load and residential load. In real life, different plots are supplied by different grid nodes. Charging stations are built in different plots corresponding to different grid nodes. In order to simulate the operation of the grid, the total load is used and the grid loss and voltage drop are calculated by means of tidal wave calculation. The total load equation is as follows.
P g t = f g P b f t + P E V f t
where P g t denotes the total load of grid node g at time t; f g denotes the plot of data grid supply node g of plot f; P b f t denotes the base electricity consumption of plot f at time t; P E V f t denotes the electricity consumption of electric vehicles of plot f.
Tide calculation is the main process of determining operational parameters in a power system by solving node voltages, losses, and other parameters for any network topology with known grid network parameters and operational parameters. While the grid has more nonlinear parameters, they are generally not solved using the analytical method. In this paper, the traditional Newton–Raphson algorithm is used for the solution of grid parameters.

5. Optimization Model and Solution

In [20,31] it was discussed that electricity price is a moderate factor in people’s choice of charging stations. The literature [32] illustrates that when the tariff benefit is large enough, people can accept a set detour, and people are willing to detour to charge for a more favorable tariff both on and off weekdays. Therefore, by tailoring the tariff to different time periods, EV users are redirected in the charging station selection phase to make the load more balanced to reduce the impact of EV load on the grid. In this paper, two grid indicators—grid voltage drop and grid loss—are selected to evaluate the grid quality, and an optimization model is established to minimize the impact of grid quality. The tariff of different charging stations in different time periods is solved by the differential evolutionary algorithm “DE/best/1/L”.

5.1. Objective Function and Constraint Conditions

A nodal voltage cheapness is established, considering the safe operation of the grid and reducing the nodal voltage brought by electric vehicles to the grid nodes to which they belong. Considering the impact of EVs on the grid, the minimization of voltage offset and network loss is adopted as the objective function, and the objective function is as follows. It should also be considered that the electricity price determines the interests of the grid operator, charging station side and user side, and a reasonable fluctuation in electricity price can bring different aspects of benefits to all three. The following constraints are placed on the electricity price.
P L , l , V = G u , p
where P L , l is grid loss; V is grid voltage drop; u is travel demand; p indicates charging station price; G is the entire simulation process. The optimization model is established with the optimization objectives of grid loss and voltage drop in mind.
Min β l L P L , l + n N V 0 V n N
s . t . p ̲ < p r i c e t , k < p ¯ k K , t T 0 f g P b f t + P EV f t < P max , k k K , t T , f g S j S max j j J
where, p ̲ , p ¯ denotes the upper and lower limits of the tariff; P max , k denotes the upper limit of the total power at each node; K denotes grid node set; T denotes time set; S max j denotes the maximum number of charging stations available; j denotes charge sataion set.

5.2. Solution Method

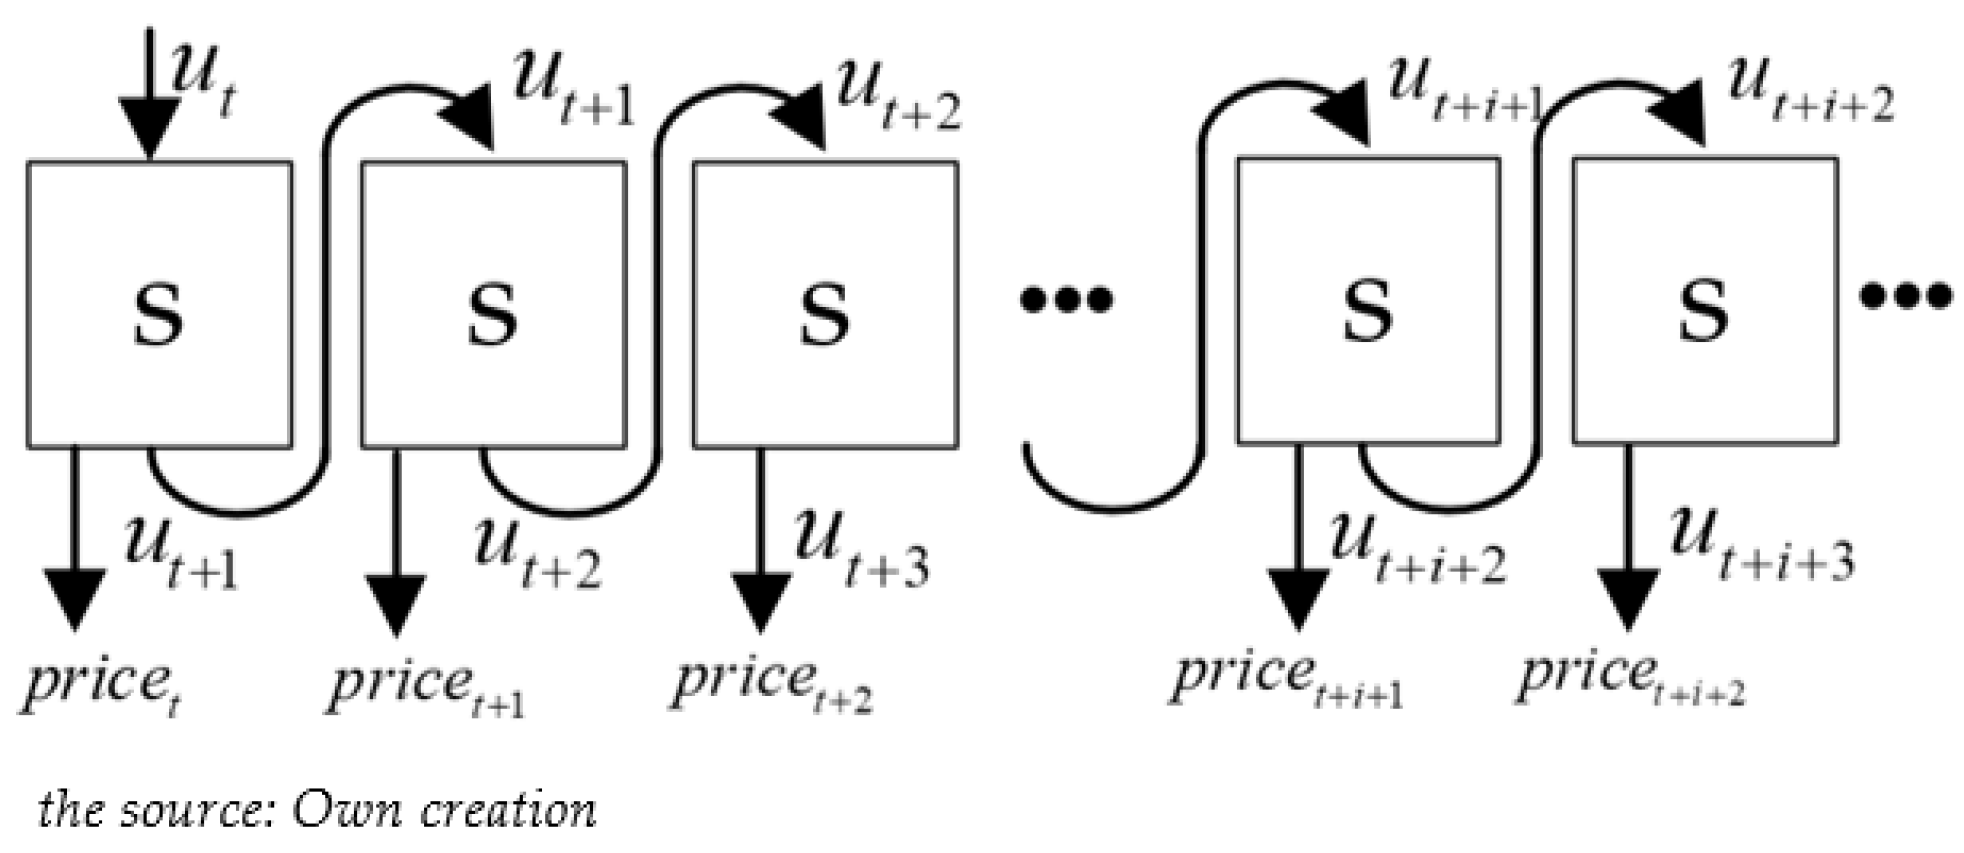
According to the problem described is a single-objective optimization problem with constraints, the differential evolution algorithm “DE/best/1/L” [33] is used to solve the problem. The differential evolution algorithm is a heuristic random search method based on population differences, which is used to solve optimization problems in continuous space. It has the characteristics of simple principles, less controlled parameters and strong robustness. Since the variable of demand solution is the TOU price of different charging stations in different periods, there are too many variables to solve, so the sliding window method is adopted. The optimal variables are solved according to the objective function in each period. At the same time, since the charging behavior and state of people have changed after the optimal price in the current period is solved, as shown in Figure 8, the travel state in the road network in the previous period is solved sequentially as the initial value of the next period. At the same time, Particle Swarm Optimization (PSO) is used for comparison.
Algorithm calculation process
(1)
Initialize road network information, travel information, electric vehicle status, algorithm initialization price.
(2)
Simulate the unit time of operation and get the power grid state under different electricity prices.
(3)
Adjust the electricity price solution through heuristic search, and return (2) to (3) until the condition of falling is met.
(4)
Get the solution through (3) as the initial state of the next period and jump to (2). If it is greater than the simulation time, jump to (5).
(5)
Solve all time periods.

6. Numerical Studies

6.1. Electric Vehicle Operation Simulation

To verify the feasibility of the simulation method proposed in this paper and the effectiveness of the optimization method, a simulated road network is used to validate the method.

6.1.1. Parameter Settings

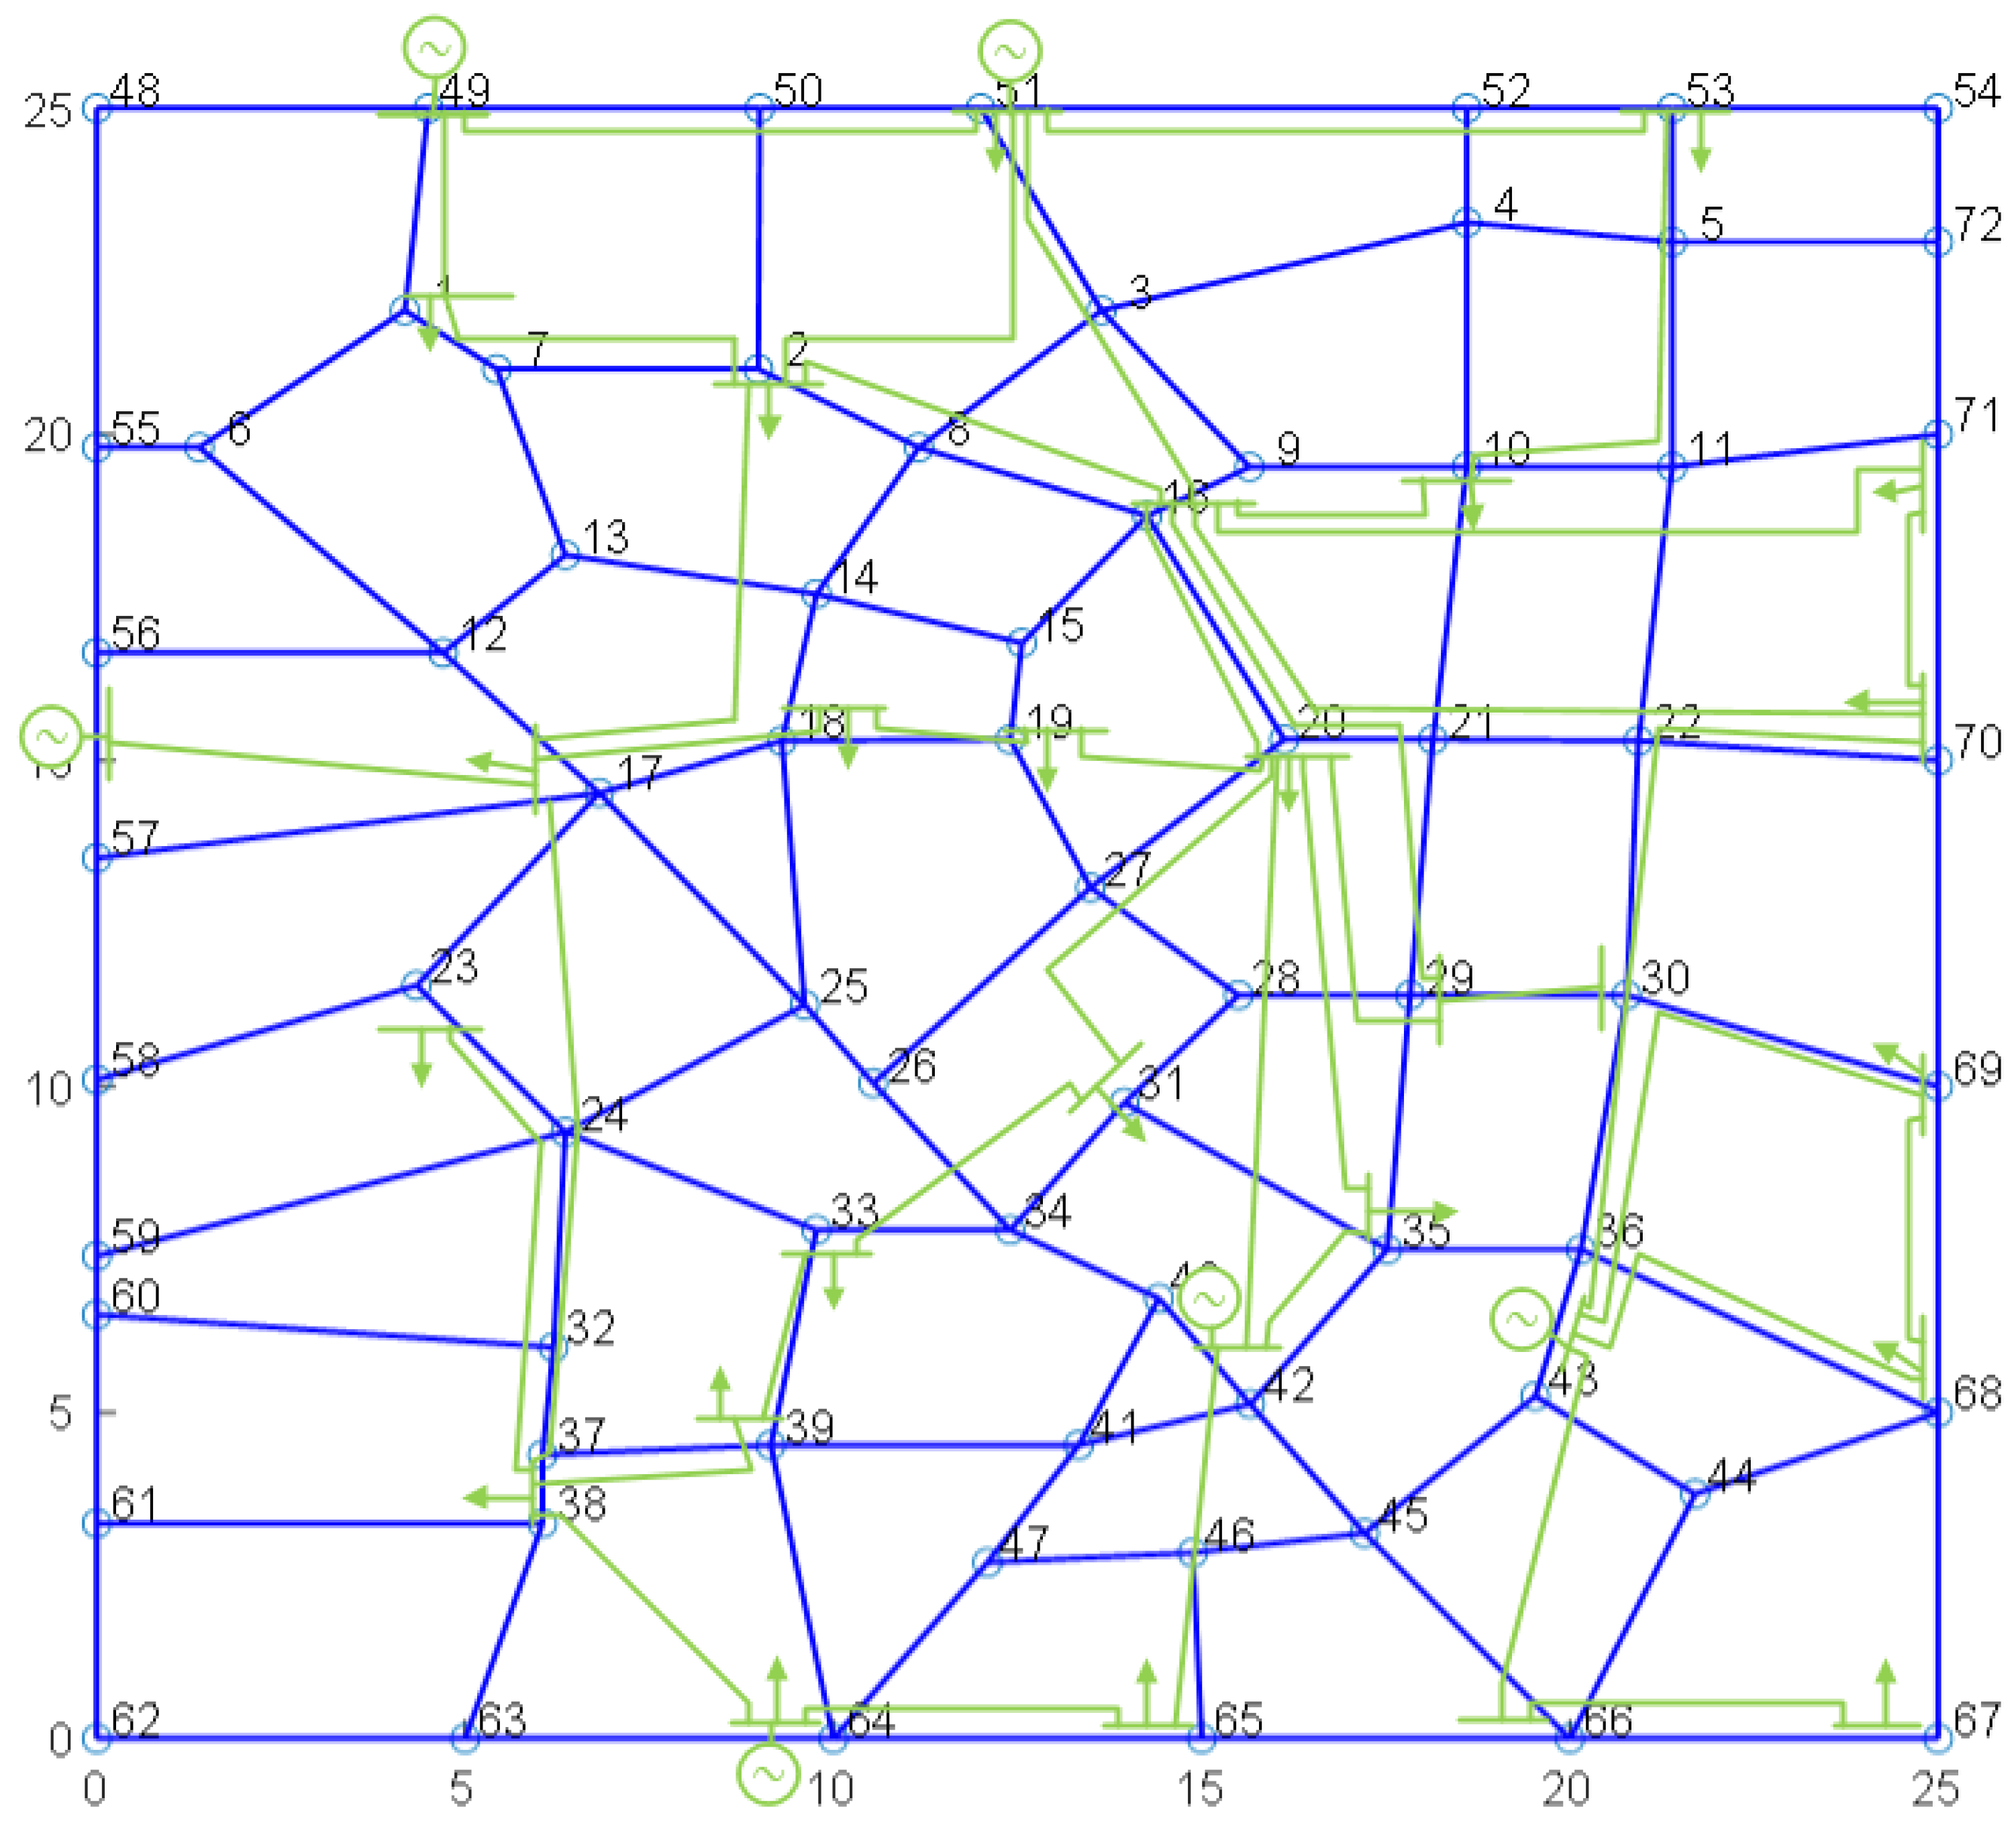
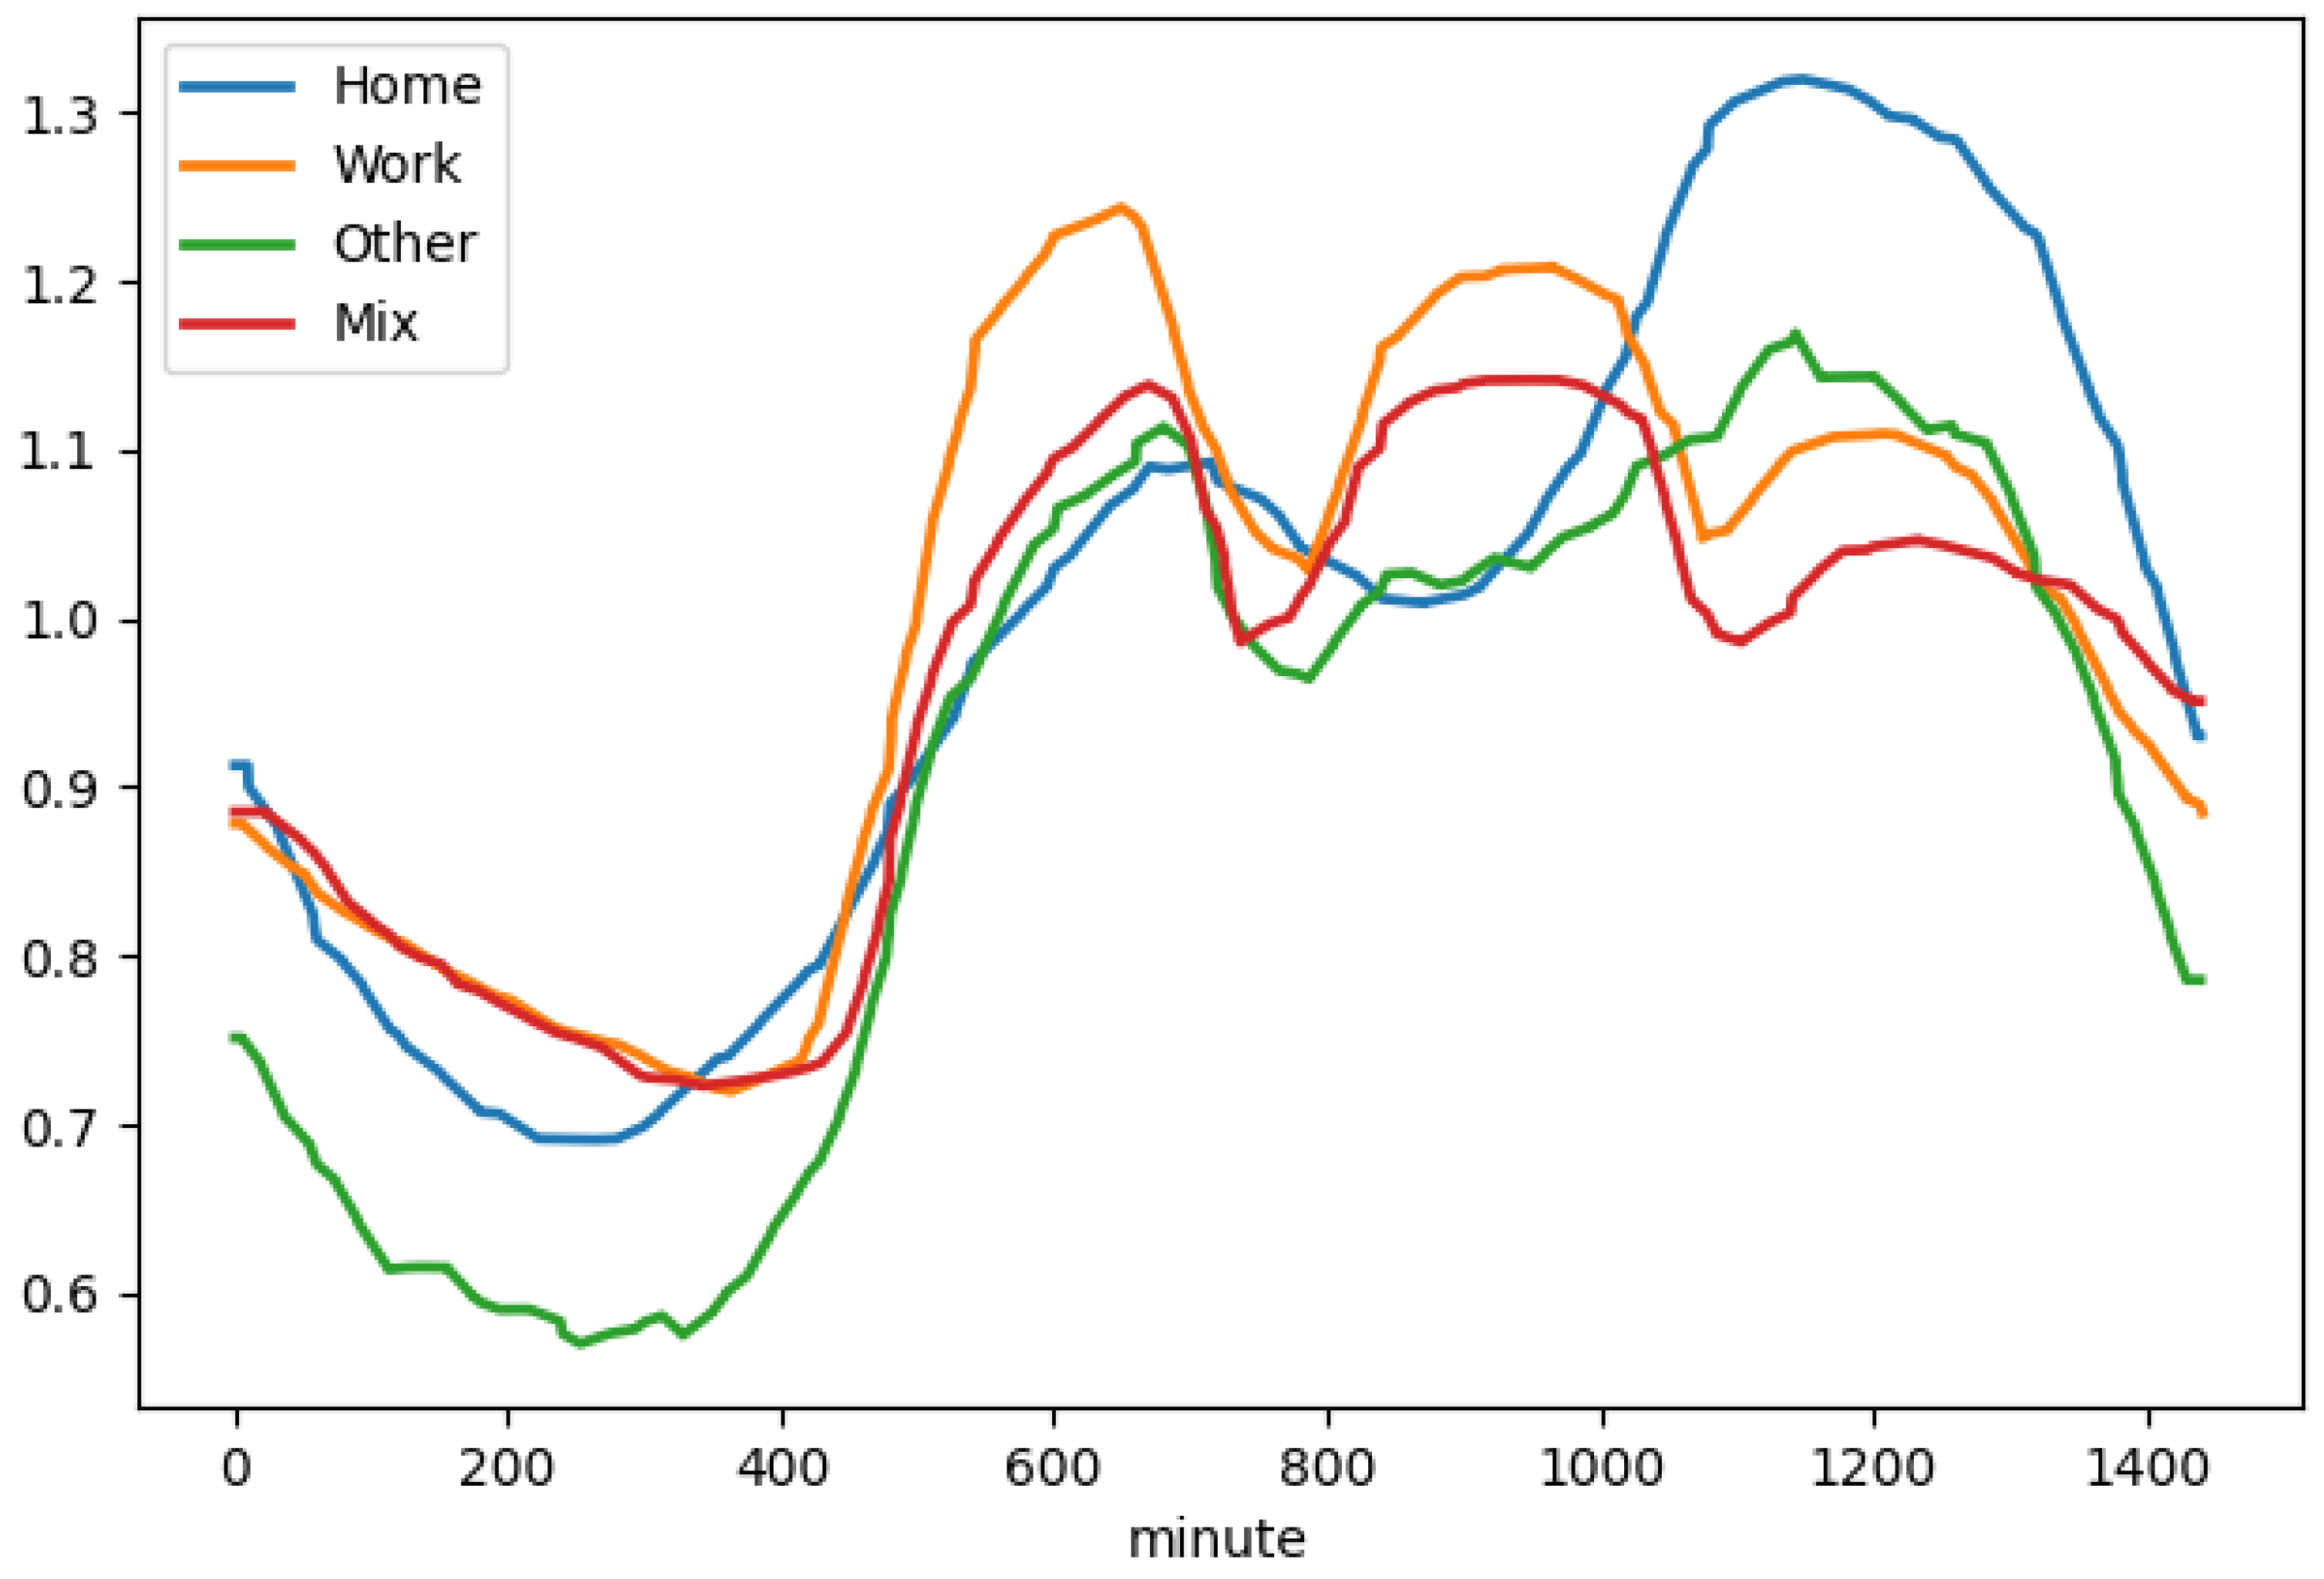
The area shown in Figure A1 (Appendix A) is used as the simulated road network area. The area is 25 km in the east–west direction and 25 km in the north–south direction. There are 72 road nodes and 50 areas distributed on the main network. Different land blocks are divided into different functions from [34]; IEEE30 node is used to supply power to the selected network; Figure A2 shows the power load patterns of different areas [34]; The electric vehicle assumes that there are inputs (10,000, OD1), (20,000, OD1) and (20,000, OD2), respectively, in this area to conduct simulation under different conditions and verify the effectiveness of electricity price optimization. The travel OD matrix is obtained from the mobile phone signalling data processing of China Unicom. The data are originally traffic data, which are converted into traffic data according to the mobile phone signalling data processing method [35].
The electric quantity before the first trip is set to S O C = 100%, which is because the simulation method is continuous. Therefore, the simulation can be realized for a period of time, regardless of whether the initial parameters can meet the user’s trip.

6.1.2. Continuous Simulation and Comparison Results of Charging Station and Power Grid

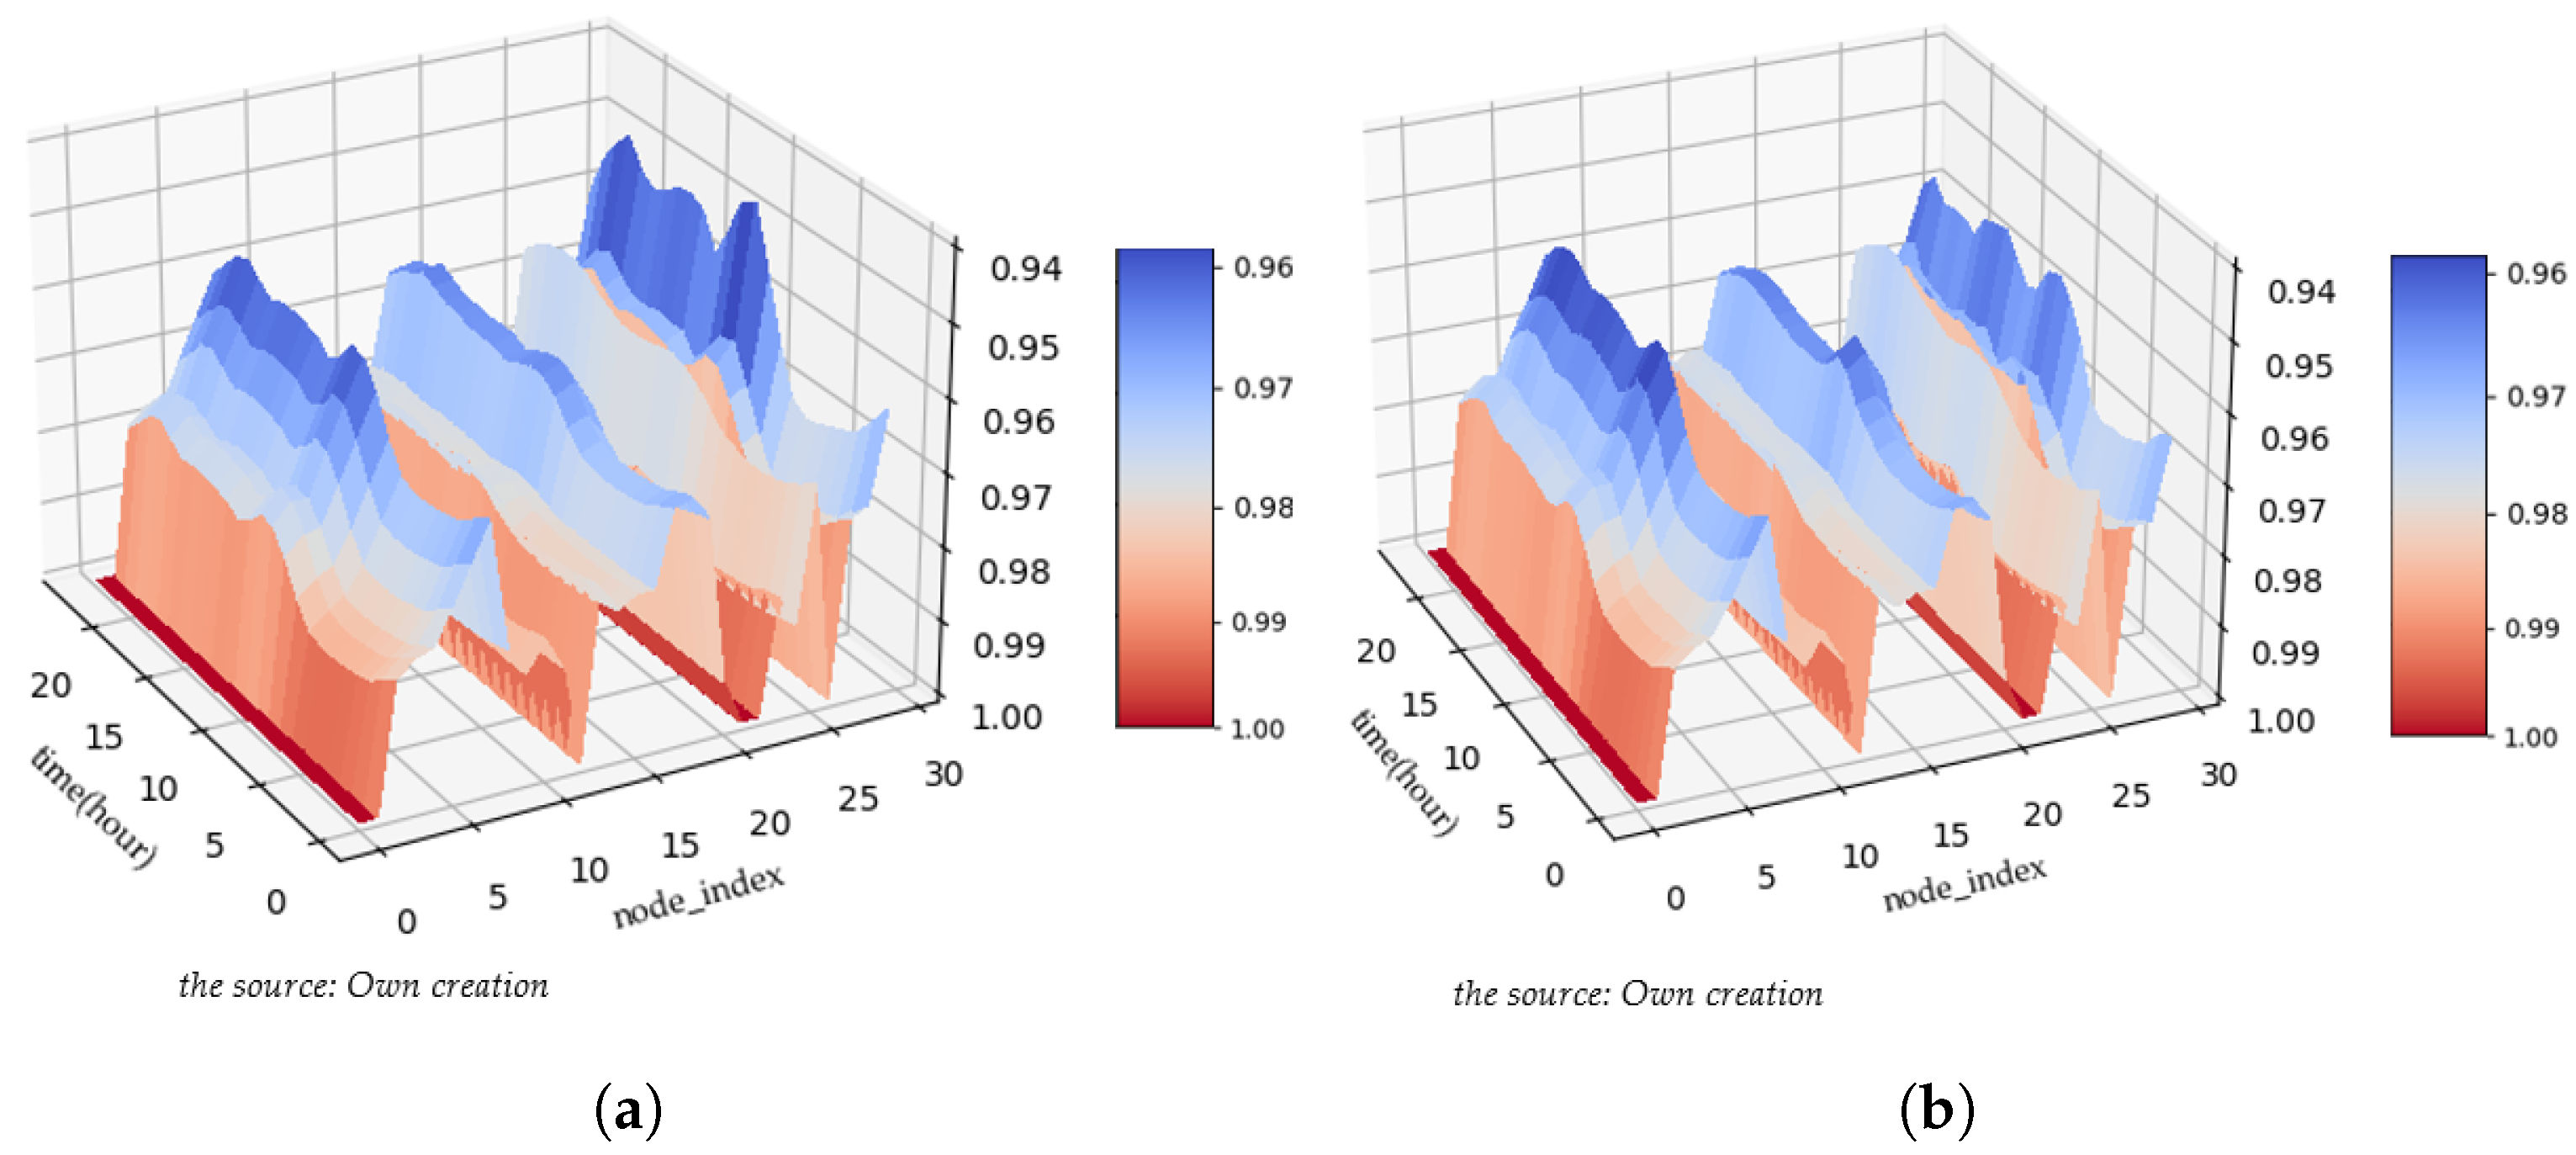
Figure 9a shows the voltage situation of grid nodes without EV load at each node in each time period of the grid, and it can be seen that the moment when the node voltage price is maximum in the case of base load only overlaps with the moment when the high score of EV electricity consumption appears, and from Figure 9b after adding EV load, it can be seen that the voltage drop at each grid node has a supplementary degree of landing. Stable operation of the safety grid is unfavorable. The pressure at node 29 is the largest, landing below 0.95 units without electricity guidance, which is already within the range of unsafe operation.

6.2. Electricity Price Optimization Results of Electricity Price

Figure 10a,b shows the tariff optimization results for one of the charging stations, where the default tariff of 0.8 is maintained due to the low demand and base load between 0 a.m. and 7 a.m., and then the tariff adjustment phase, where the tariffs are adjusted in the same direction. Figure 10 shows that the optimized tariffs for charging stations in the same geographical location, even at different demand scales, tend to be in the same direction due to the base load of the grid and their geographical attractiveness. For this optimization result, it tends to lower the charging station tariff in order to improve the arrival rate of electric vehicles and to enhance the utilization rate of charging stations. It can be seen from Figure 10c that different algorithms tend to be the same for the same charging station in the solution process. It can be seen from the comparison of different algorithms in Figure 10e that different heuristic algorithms have similar solving ability for this problem, so the modified model has strong universality in solving.

6.3. Comparison of Power Grid with Different Input Requirements

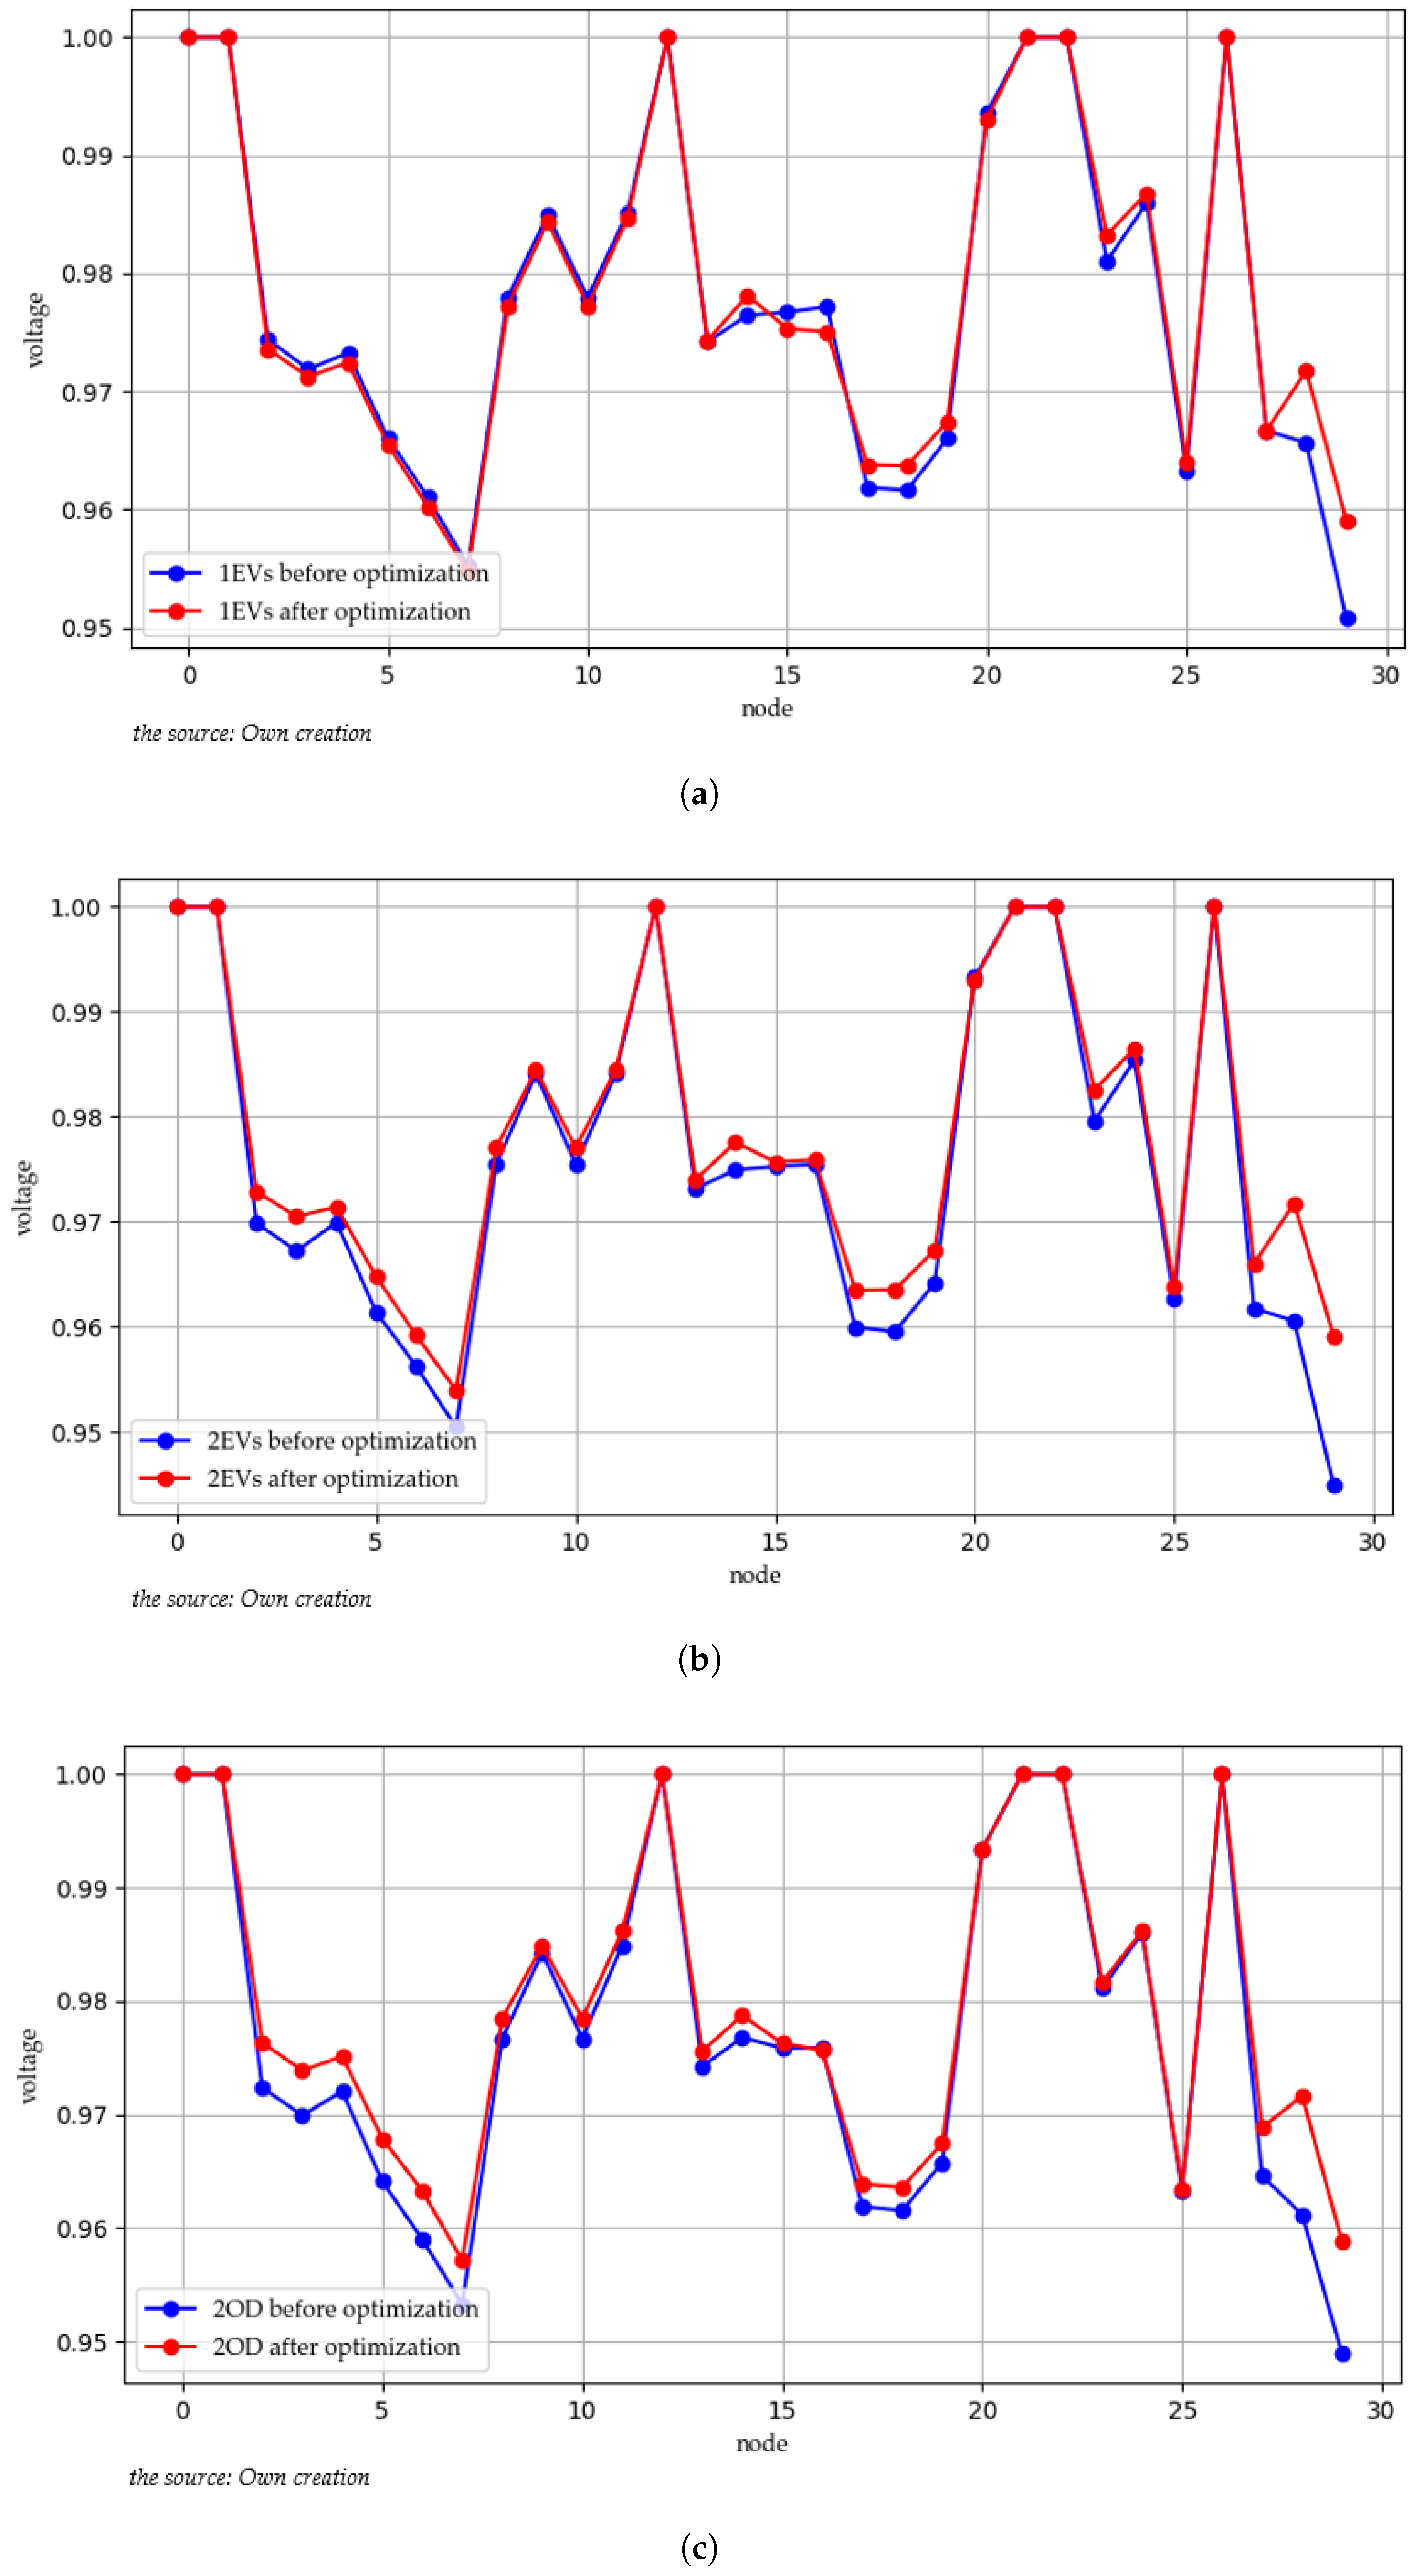
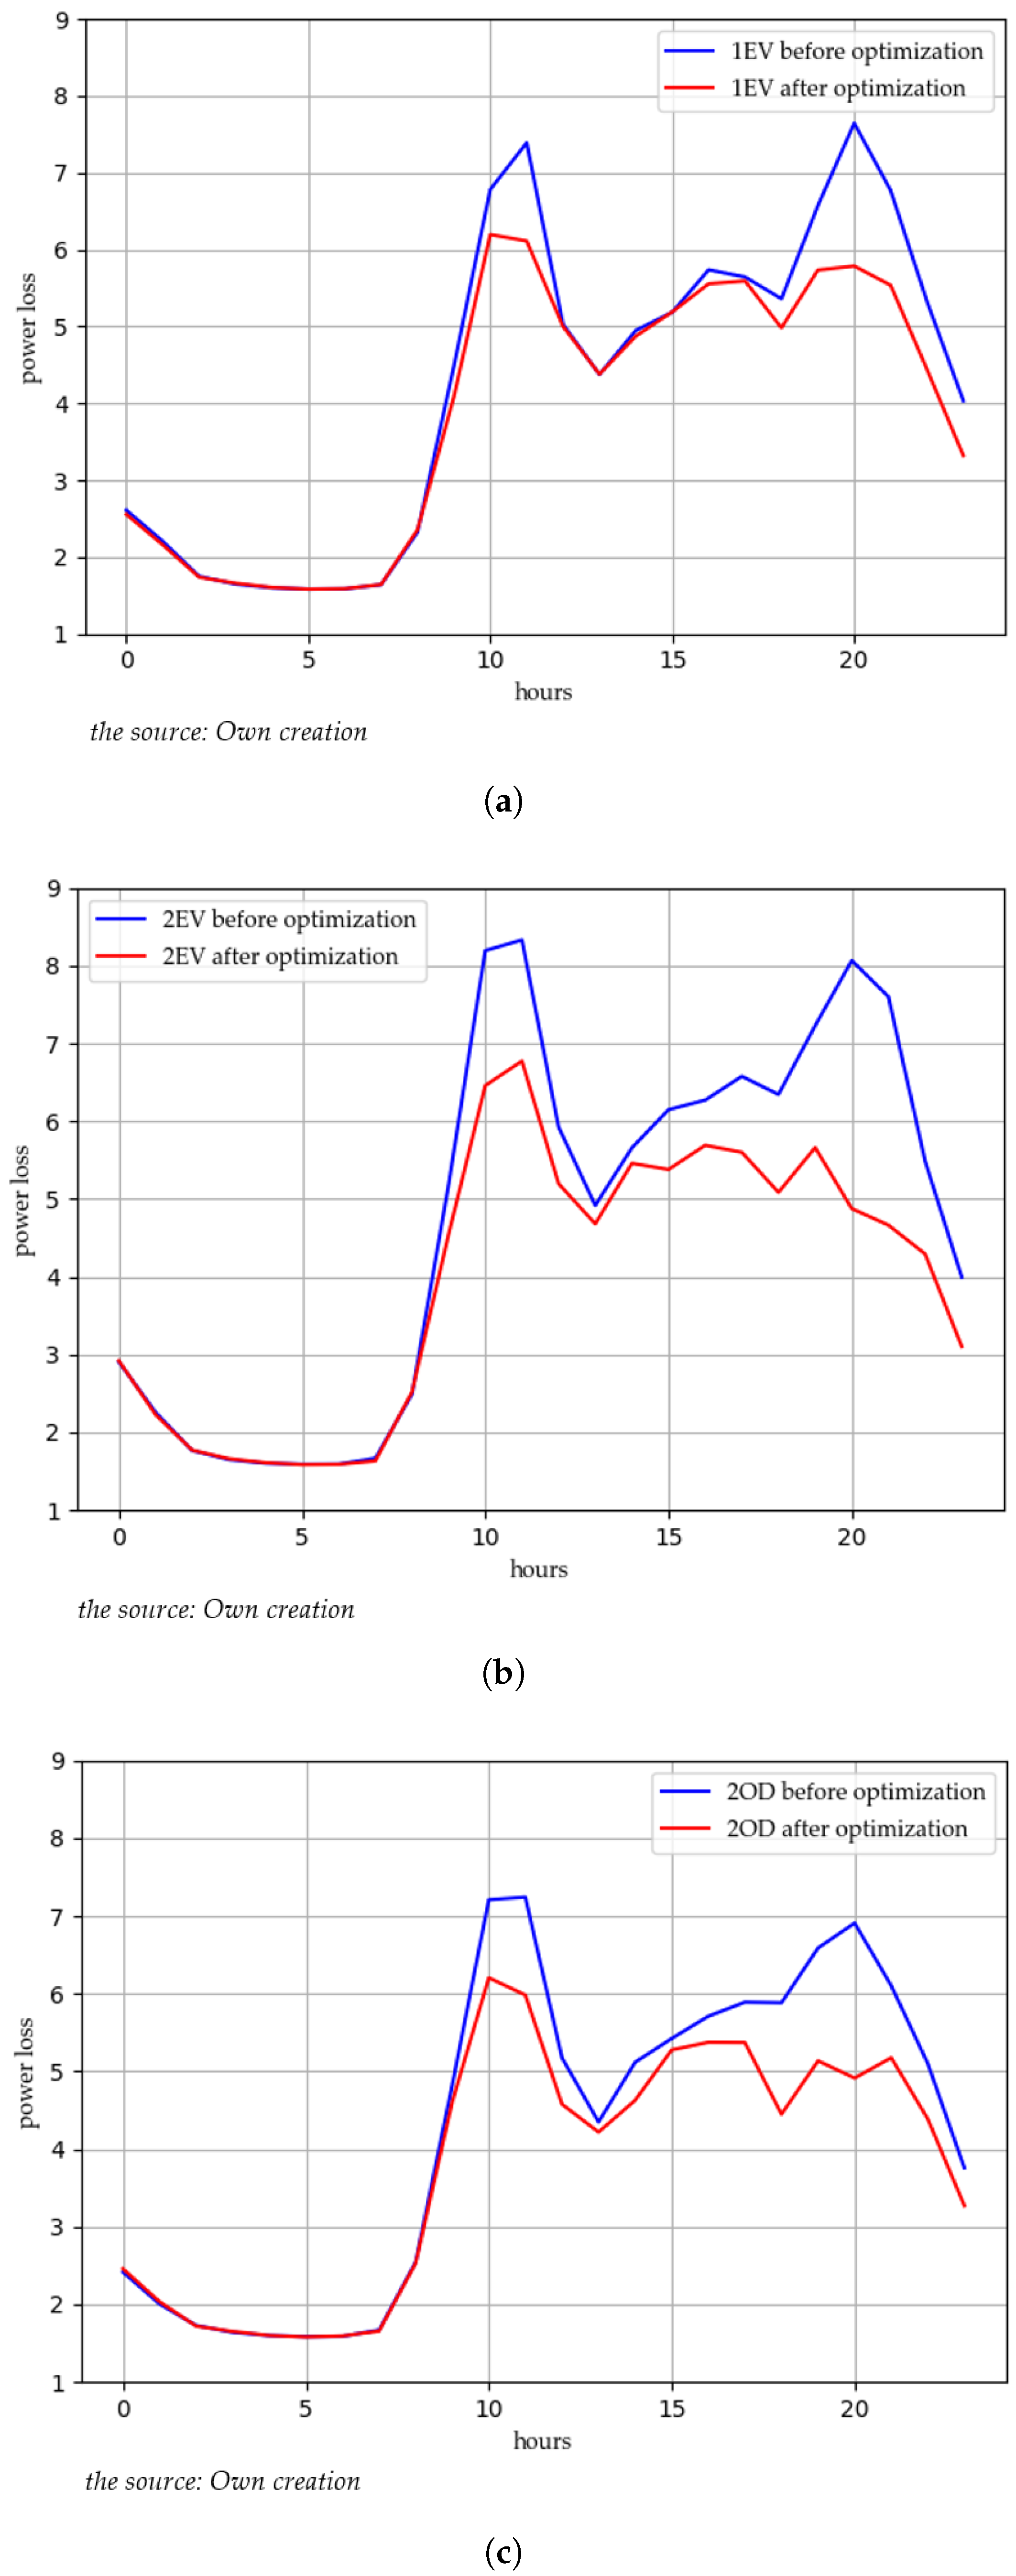
Since different grid nodes are located at different distances from generators or substations, in different network locations, and with different load profiles, the voltage drops of different nodes are sensitive to the load in different ways. In the simultaneous node voltage in Figure 11, the 29, 17, and 18 nodes have the most significant optimization effect, which has been adjusted to limit the 29 node from the unsafe node voltage situation to the safe operation of the range. The figure compares the before and after optimization for different sizes of initial EV users. It is clear that the impact on the grid caused by the 20,000 EV users is huge compared to the blue line shown with the red line. Through the tariff optimization, it can be seen that the red line overall floats above the blue line, the grid load is more balanced, and the voltage drop at each node of the grid is improved to varying degrees, with the average node voltage increasing by 1.26% and 6.59%, respectively. We verified the simultaneous grid node voltages for different OD forms. Still, it can be seen that although there is a difference in the initial load, the effect on grid optimization is still realized. Additionally, from Figure 12, the network loss in different OD cases shows a large difference in the regional original network loss in the face of different OD input cases. The main reason is that people travel with different ODs, which gives the charging stations different heat and different load balances, so even if they are both facing 20,000 vehicles travel demand, the network loss will be different. However, the optimization by the proposed method in this paper shows that the predefined optimization still performs better in the face of different ODs.
For EV charging demand, different researchers have different perspectives on power grid optimization. Ref. [36] guide users to migrate their charging needs to the night by means of price incentives, reducing the overlap of residential power load and EV charging load so as to improve the stable operation of the power grid. The author’s simulation results show that the power load at night can be effectively increased by 67.2%, and the waiting time can be reduced. The researcher [12] uses a NSGA-II multi-objective optimization algorithm to establish a regional electricity price model, which aims to reduce peak load. The maximum load was reduced by 92 MW; the percentage was 4.054%. The minimum load increased by 34 MW; the percentage was 2.082%. The peak–valley difference decreased by 26 MW; the percentage was 18.811%. The peak–valley difference rate decreased by 4.93%, and the load rate increased by 3.65%. The benefits of the charge station increased by 0.18%. Most authors cut the peak load. In this paper, the use of grid node voltage and loss focuses on the overall operation of the grid state of the embodiment; thus, the embodiment is more complete.

7. Conclusions

In the process of rapid development of electric vehicles, the power grid and EV users are full of challenges and opportunities. In this paper, we build a dual network collaborative simulation of traffic demand and power grid to solve the problem of time and space demand from charging behavior to power grid. At the same time, through the coordinated dynamic pricing solution for different charging stations, it matches the characteristics of traffic behavior and space-time operation. The electricity price is solved by simulation. The main results are as follows.
1. We established a dual network collaborative simulation from travel demand to power grid, described EV charging behavior completely, and established energy consumption, charging probability, and charging selection models. The simulation can be based on obtaining trip OD data, and simulates the space-time operation state of charging station and power grid. It can be used to simulate the time–space distribution from traffic to power grid.
2. The optimization model based on simulation is solved through the “DE/best/1/L” optimization algorithm, fully considering the interaction between the road network and the power grid. The simulation results show that the average bus voltage increases by 1.26% and 6.59%, respectively, under different requirements.

Author Contributions

Conceptualization, J.T., N.X. and W.G.; Investigation, N.X.; Methodology, J.T., F.L., W.G. and W.W.; Software, F.L.; Writing—original draft, F.L.; Writing—review & editing, J.T., F.L. and W.W. All authors have read and agreed to the published version of the manuscript.

Funding

This research was supported by the National Key Research and Development Program of China (2018YFB1601100), the Youth Top Talent Training Program of Beijing (CIT&TCD201904013), and the General Program of Science and Technology Plan of Beijing Municipal Education Commission (KM202010009007).

Institutional Review Board Statement

Not applicable.

Informed Consent Statement

Not applicable.

Data Availability Statement

The data used in this article are from the Ji Smart Platform, which is an online data platform that cannot be shared, and we currently do not have login access.

Acknowledgments

We thank J.T., W.G. and N.X. for their ideas and corrections on the structure of the paper, F.L. for programming and data analysis, W.W. suggestions for the paper and the authors listed in the references for the important research content and conclusions.

Conflicts of Interest

We declare that we have no financial and personal relationships with other people or organizations that can inappropriately influence our work; there is no professional or other personal interest of any nature or kind in any product, service, and/or company that could be construed as influencing the position presented in this manuscript or in its review.

Appendix A

Figure A1. Topology structure of road network and power grid (the source: reference [34]).
Sustainability 14 14476 g0a1
Figure A2. Coefficient of each load curve type (the source: reference [34]).
Sustainability 14 14476 g0a2

References

  1. Zou, C.; Xiong, B.; Xue, H. The role of new energy in carbon neutral. Pet. Explor. Dev. 2021, 48, 480–491. [Google Scholar] [CrossRef]
  2. EV-Volumes—The Electric Vehicle World Sales Database. Available online: https://www.ev-volumes.com/ (accessed on 22 July 2022).
  3. Tan, K.M.; Ramachandaramurthy, V.K.; Yong, J.Y. Integration of electric vehicles in smart grid: A review on vehicle to grid technologies and optimization techniques. Renew. Sustain. Energy Rev. 2016, 53, 720–732. [Google Scholar] [CrossRef]
  4. Rubino, L.; Capasso, C.; Veneri, O. Review on plug-in electric vehicle charging architectures integrated with distributed energy sources for sustainable mobility—ScienceDirect. Appl. Energey 2017, 207, 438–464. [Google Scholar] [CrossRef]
  5. Xu, P.; Zhang, J.; Gao, T.; Chen, S.; Wang, X.; Jiang, H.; Gao, W. Real-time fast charging station recommendation for electric vehicles in coupled power-transportation networks: A graph reinforcement learning method. Int. J. Electr. Power Energy Syst. 2022, 141, 108030. [Google Scholar] [CrossRef]
  6. Basta, B.; Morsi, W.G. Low and high order harmonic distortion in the presence of fast charging stations. Int. J. Electr. Power Energy Syst. 2021, 126, 106557. [Google Scholar] [CrossRef]
  7. Yao, Y.; Lu, J.; Fu, Y.; Xue, J.; Zhu, B. Electric vehicle development trends and electricity demand forecast in East China. Power Syst. Prot. Control. 2021, 49, 141–145. [Google Scholar]
  8. Amjad, M.; Ahmad, A.; Rehmani, M.H.; Umer, T. A review of EVs charging: From the perspective of energy optimization, optimization approaches, and charging techniques. Transp. Res. Part D Transp. Environ. 2018, 62, 386–417. [Google Scholar] [CrossRef]
  9. Leou, R.C.; Su, C.L.; Lu, C.N. Stochastic Analyses of Electric Vehicle Charging Impacts on Distribution Network. IEEE Trans. Power Syst. 2014, 29, 1055–1063. [Google Scholar] [CrossRef]
  10. Liu, A.; Yuan, X.; Jing, L.I. Research on Orderly Charging Strategy of Residential Electric Vehicle Based on Time-of-use Electricity Price. J. Guizhou Univ. (Nat. Sci.) 2017, 34, 54–58. [Google Scholar]
  11. Tucker, N.; Alizadeh, M. An Online Admission Control Mechanism for Electric Vehicles at Public Parking Infrastructures. IEEE Trans. Smart Grid 2020, 11, 161–170. [Google Scholar] [CrossRef] [Green Version]
  12. Wang, R.; Mu, J.; Sun, Z.; Wang, J.; Hu, A. NSGA-II multi-objective optimization regional electricity price model for electric vehicle charging based on travel law. Energy Rep. 2021, 7, 1495–1503. [Google Scholar] [CrossRef]
  13. Cui, Y.; Hu, Z.; Duan, X. Review on the Electric Vehicles Operation Optimization Considering the Spatial Flexibility of Electric Vehicles Charging Demands. Power Syst. Technol. 2021, 46, 981–994. [Google Scholar]
  14. McCafferty, D.; Hall, F.L. The Use of Multinomial Logit Analysis to Model the Choice of Time to Travel. Econ. Geogr. 1982, 58, 236–246. [Google Scholar] [CrossRef]
  15. Li, Y.; Zhan, C.; De Jong, M.; Lukszo, Z. Business innovation and government regulation for the promotion of electric vehicle use: Lessons from Shenzhen, China. J. Clean. Prod. 2016, 134, 371–383. [Google Scholar] [CrossRef]
  16. Turker, H.; Bacha, S. BachaOptimal Minimization of Plug-In Electric Vehicle Charging Cost With Vehicle-to-Home and Vehicle-to-Grid Concepts. IEEE Trans. Veh. Technol. 2018, 67, 10281–10292. [Google Scholar] [CrossRef]
  17. AHuang, J.; Wang, X.; Shao, C.; Song, Z.; Wang, Y.; Shuai, X. An Improved Charging Navigation Strategy of Electric Vehicles via Optimal Time-of-Use Pricing. Electr. Power Syst. Res. 2022, 210, 108077. [Google Scholar]
  18. Tan, J.; Wang, L. Real-Time Charging Navigation of Electric Vehicles to Fast Charging Stations: A Hierarchical Game Approach. IEEE Trans. Smart Grid 2017, 8, 846–856. [Google Scholar] [CrossRef]
  19. Lee, W.; Xiang, L.; Schober, R.; Wong, V. Electric vehicle charging stations with renewable power generators: A game theoretical analysis. IEEE Trans. Smart Grid 2015, 6, 608–617. [Google Scholar] [CrossRef]
  20. Yang, D.; Sarma, N.; Hyland, M.; Jayakrishnan, R. Dynamic Modeling and Real-time Management of a System of EV Fast-charging Stations. Transp. Res. Part C Emerg. Technol. 2020, 128, 103186. [Google Scholar] [CrossRef]
  21. Nguyen, H.; Zhang, C.; Mahmud, M.A. Optimal coordination of G2V and V2G to support power grids with high penetration of renewable energy. IEEE Trans. Transp. Electrif. 2015, 1, 188–195. [Google Scholar] [CrossRef]
  22. Xu, P.; Li, J.; Sun, X.; Zheng, W.; Liu, H. Dynamic Pricing at Electric Vehicle Charging Stations for Queueing Delay Reduction. In Proceedings of the 2017 IEEE 37th International Conference on Distributed Computing Systems (ICDCS), Atlanta, GA, USA, 5–8 June 2017; pp. 2565–2566. [Google Scholar]
  23. Dong, X.; Mu, Y.; Xu, X.; Jia, H.; Wu, J.; Yu, X.; Qi, Y. A charging pricing strategy of electric vehicle fast charging stations for the voltage control of electricity distribution networks. Appl. Energy 2018, 225, 857–868. [Google Scholar] [CrossRef]
  24. Gong, L.; Cao, W.; Liu, K.; Zhao, J. Optimal charging strategy for electric vehicles in residential charging station under dynamic spike pricing policy. Sustain. Cities Soc. 2020, 63, 102474. [Google Scholar] [CrossRef]
  25. Guo, J.; Li, X. Annual Report on Development of Beijing Transportation (2016); Beijing Transport Institute: Beijing, China, 2016. [Google Scholar]
  26. Huang, J.; Wang, X.; Wang, Y.; Ma, Z.; Zhang, H. Charging Navigation Strategy of Electric Vehicles Considering Time-of-Use Pricing. In Proceedings of the 2021 6th Asia Conference on Power and Electrical Engineering, Chongqing, China, 8–11 April 2021. [Google Scholar]
  27. Kai, D. Prospect Theory: An Analysis of Decision under Risk. Econom. Soc. 1979, 47, 263–291. [Google Scholar]
  28. Zhang, H.; Wen, F.; Zhang, C.; Tian, C. Prospect Theory Based Multiple-attribute Decision-making Method for Determining Portfolio of Construction Projects in Power Systems. Autom. Electr. Power Syst. 2016, 40, 8–14. [Google Scholar]
  29. Hang, L.; Xu, C.; Wang, L.; Li, J.L.; Chen, X.; Yang, X.; Shi, Y. OD matrix based spatiotemporal distribution of EV charging load prediction. Power Syst. Prot. Control. 2021, 49, 82–91. [Google Scholar]
  30. Cao, F.; Li, S.; Zhang, Y. Emporal and Spatial Distribution Simulation of EV Charging Load Considering emporal and Spatial Distribution Simulation of EV Charging Load Considering Temporal and Spatial Distribution Simulation of EV Charging Load Considering Charging Station Attactrveness. Power Syst. Technol. 2021, 45, 11. [Google Scholar]
  31. Davis, B.M.; Bradley, T.H. The Efficacy of Electric Vehicle Time-of-Use Rates in Guiding Plug-in Hybrid Electric Vehicle Charging Behavior. IEEE Trans. Smart Grid 2012, 3, 1679–1686. [Google Scholar] [CrossRef]
  32. Sun, X.H.; Yamamoto, T.; Morikawa, T. Fast-charging station choice behavior among battery elec-tric vehicle users. Transp. Res. Part D 2016, 46, 26–39. [Google Scholar] [CrossRef]
  33. Storn, R.; Price, K. DE-a simple and efficient heuristic for global optimization over continuous space. J. Glob. Optim. 1997, 114, 341–359. [Google Scholar] [CrossRef]
  34. Chen, L.; Zhang, Y.; Figueiredo, A. Charging load forecasting of electric vehicles based on multi-source information fusion and its influence on distribution network. Electr. Power Autom. Equip. 2018, 38, 1–10. [Google Scholar]
  35. Li, Z.; Yu, L.; Gao, Y.; Wu, Y.; Song, G.; Gong, D. Identifying Temporal and Spatial Characteristics of Residents’ Trips from Cellular Signaling Data: Case Study of Beijing. Transp. Res. Rec. 2018, 2672, 81–90. [Google Scholar] [CrossRef]
  36. Zeinab, M.; Iftekhar, A.; Daryoush, H. A Coordinated Dynamic Pricing Model for Electric Vehicle Charging Stations. IEEE Trans. Trans. Electrif. 2019, 5, 226–238. [Google Scholar]
Figure 1. Article structure Diagram.
Sustainability 14 14476 g001
Figure 2. Electricity Price Guidance Strategy Diagram.
Sustainability 14 14476 g002
Figure 3. Schematic diagram of load intensity adjustment results in different areas.
Sustainability 14 14476 g003
Figure 4. Structural diagram.
Sustainability 14 14476 g004
Figure 5. The composition relationship of each module is simulated.
Sustainability 14 14476 g005
Figure 6. The composition relationship of each module is simulated.
Sustainability 14 14476 g006
Figure 7. Schematic diagram of charging selection.
Sustainability 14 14476 g007
Figure 8. Schematic diagram of sliding window solution.
Sustainability 14 14476 g008
Figure 9. Comparison diagram of power grid operation state optimization. (a) 24 h operation of grid node voltage without electricity price optimization; (b) 24-h operation of grid node voltage after power price optimization.
Sustainability 14 14476 g009
Figure 10. Price optimization results of the same charging station under different demand. (a) Electricity price result under demand 1; (b) comparison of charging station before and after use under demand 1; (c) electricity price result under demand 2; (d) comparison of charging station before and after use under demand 2; (e) electricity price optimization results of different algorithms in the case of demand 1; (f) compare the use of different charging stations under different algorithm optimization results.
Sustainability 14 14476 g010
Figure 11. Power grid voltage drop at 20 h under different vehicle numbers or demand. (a) Power grid voltage drop at 20 h under demand 1; (b) power grid voltage drop at 20 h under demand 2; (c) power grid voltage drop at 20 h under demand 3.
Sustainability 14 14476 g011
Figure 12. All day network loss under different OD modes. (a) All day network loss under the demand 1; (b) All day network loss under the demand 2; (c) All day network loss under the demand 3.
Sustainability 14 14476 g012
Table 1. Beijing traffic’s interpretation of the traffic index.
Congestion StateIndex of the TrafficTravel Time Consumption
open[0,2)Basic road speed limit standard driving
generally smooth[2,4)A trip takes 0.3 to 0.5 times longer
slightly congested[4,6)A trip takes 0.5 to 0.8 times longer
moderately congested[6,8)A trip takes 0.8 to 1.0 times longer
Severe congestion[8,10)A trip takes more than 1.0 times longer
The source: reference [25].
Publisher’s Note: MDPI stays neutral with regard to jurisdictional claims in published maps and institutional affiliations.