Article

Carbon Emission Evaluation of Recycled Fine Aggregate Concrete Based on Life Cycle Assessment

1
School of Building Engineering, Nanchang University, Nanchang 330031, China
2
School of Civil Engineering, Central South University, Changsha 410004, China
*
Authors to whom correspondence should be addressed.
Sustainability 2022, 14(21), 14448; https://doi.org/10.3390/su142114448
Submission received: 15 October 2022 / Revised: 26 October 2022 / Accepted: 30 October 2022 / Published: 3 November 2022
(This article belongs to the Section Resources and Sustainable Utilization)

Abstract

:
This study conducts a life cycle assessment (LCA) of carbon emissions for recycled fine aggregate (RFA) concrete. There were six stages involved in the life cycle of RFA, including raw material extraction and processing, transportation to the manufacture, RFA concrete manufacturing, transportation to the building site, construction, and de-construction or demolition. The carbon uptake effect, due to the carbonation of RFA concrete, was also considered. The concept of “carbon-strength ratio” was introduced to comprehensively evaluate the carbon emission of RFA with different strengths. Sensitivity analysis was performed on the key parameters, including the water-to-cement ratio, RFA replacement ratio, and transportation distance, by employing three sensitivity coefficients. The results show that, under a certain water-to-cement ratio, the increase in RFA replacement ratio would decrease the carbon emission but increase the carbon-strength ratio. The higher the replacement ratio of RFA, the more sensitive the carbon emission of RFA concrete is to the change in transportation distance. Under a certain 28-day cubic compressive strength, the higher the RFA replacement ratio, the higher the carbon emission. The sensitivity analysis demonstrates that the carbon emission was the most sensitive to the water-to-cement ratio, which was followed by the RFA replacement ratio and transportation distance.

1. Introduction

Currently, over 10 billion tons of concrete are consumed worldwide every year [1]. In the meantime, numerous concrete buildings and structures are demolished [2]. According to the World Bank, the world will produce 2.59 billion tons of construction and demolition waste in 2030, and this number will climb to 3.4 billion tons by 2050 [3,4]. The large consumption of concrete and the large production of construction waste create two sets of conflicts. On the one hand, the preparation of concrete requires the extraction of a large amount of natural resources, which is prone to cause serious ecological problems. According to statistics, 32 to 50 billion tons of sand will be extracted worldwide every year, causing serious environmental damage to developing countries, such as China, India, and other developing countries [5]. On the other hand, the demolition of concrete structures generates a large amount of construction solid waste. In China, for example, it is estimated that 75% of cities face a serious problem of construction waste siege, and the annual generation of construction solid waste accounts for 30–40% of total urban solid waste [6,7]. To solve these two dilemmas, recycling construction solid waste to produce recycled aggregates has been treated as a potential and promising route. The recycled aggregates obtained from the recycling process were divided into recycled coarse aggregates (greater than 4.75 mm) and recycled fine aggregates (less than 4.75 mm), according to the particle size, where the recycled fine aggregates (RFA) accounted for about 40–60% of the total mass of waste concrete [8]. The concrete prepared with recycled coarse aggregate and RFA as raw material is called recycled coarse aggregate concrete or RFA concrete, respectively.
Research on the material properties and structural behavior of recycled concrete started at the end of World War II. The poor quality of recycled aggregate makes it difficult to apply them in practical engineering [9], and this is resulted from the adhesion of porous old mortar on the surface (nearly 40% of the mass of old mortar [10]), roughness of the surface [11,12], high water absorption (from several times up to 20 times that of natural sand [13,14]), low apparent density (which can be reduced by 25% [14]), and low firmness. However, in recent years, the strict government restrictions on river sand mining, as well as the soaring prices of natural sand and gravel [15], have led to an increase in research on recycled aggregates. The success of the application of recycled coarse aggregate concrete in high-rise buildings also makes the application and study of recycled fine aggregates get more attention [6,16,17,18]. Currently, RFA has been used in a small amount in municipal engineering, construction engineering, road backfilling, bedding, and other fields [19]. For instance, Yoda et al. [20], through the application of RFA concrete in engineering practice, found that the mechanical properties and durability of the material were able to meet the requirement of the project, proving that RFA concrete has the potential for practical engineering applications. Marian et al. [21] found that reasonable design ratio and pretreatment of recycled concrete can make its compressive strength reach comparable compressive strength to natural aggregate concrete, and they pointed out that carbon analysis and carbon evaluation studies of recycled concrete should be urgently conducted, at this stage, to accurately estimate the ecological and environmental benefits of recycled concrete.
At present, a large number of scholars have applied the life cycle assessment (LCA) theory to calculate the carbon emissions of recycled coarse aggregate concrete [22,23,24]. However, the evaluation of carbon emissions for RFA concrete is less involved [25]. Additionally, the existing studies have several problems. First, the environmental assessment of recycled concrete has problems, such as an incomplete definition of the life cycle scope and failure, to consider the environmental impact after the removal of concrete components. Secondly, the carbon emission evaluation of recycled concrete does not consider the compensating effect of its full life cycle carbonation absorption of CO2 on the environment. Finally, when performing life cycle environmental assessment of recycled concrete, existing studies have not yet established the existence of a correlative relationship among the RFA replacement ratio, concrete mechanical properties, and carbon emissions.
In this study, the innovation is to supplement and improve the systematic boundary of the life cycle carbon emission calculation of RFA concrete, as well as to consider the influence of mechanical properties in the environmental evaluation of RFA concrete. The details of the study are as follows. Based on LCA theory, the life cycle of RFA concrete is divided into six stages: raw material extraction and processing, transportation to the manufacturer, RFA concrete manufacturing, transportation to the building site, construction, and de-construction or demolition. First, the life cycle carbon emissions of RFA concrete are systematically calculated by considering the effect of carbonation. Secondly, a spatial three-dimensional model was established to fit the interaction among RFA replacement ratio, 28-day cubic compressive strength, and carbon emissions. The concept of “carbon-strength ratio” was introduced to conduct a comprehensive environmental assessment of RFA concrete. Finally, three methods of sensitivity analysis were used to explore the effects of the water–to-cement ratio, RFA replacement ratio, and transportation distance on the whole life cycle carbon emissions of RFA concrete. Overall, this work accurately assesses the environmental benefits of RFA concrete, as well as, to some extent, supports the large-scale promotion and application of RFA concrete in future.

2. Methodology and Quantitative Analysis

2.1. Research Objectives and Scope

In this study, the LCA methodology was employed for the assessment of the life cycle carbon emissions of RFA concrete. Additionally, 1 m3 of RFA concrete was taken as the functional unit, and the considered life cycle includes six stages: specifically, raw material extraction and processing, transportation to the manufacture, RFA concrete manufacturing, transportation to the building site, construction, and de-construction or demolition. Figure 1 presents the system boundary utilized in this study. In addition, the effects of the water-to-cement ratio, the RFA replacement ratio, and transportation distance on the life cycle carbon emissions were explored.

2.2. Life Cycle Inventory Data

Kawai et al. [26] state that the carbon emission factors were 3.1 kg-CO2eq/t and 17.7 kg-CO2eq/t, respectively, for the production of recycled aggregates used for road backfill and concrete body members. As recycled aggregates are mainly used for concrete elements in the scenarios of this study, the carbon emission factor of recycled aggregates is taken as 17.7 kg-CO2eq/t. It has been reported that the treatment of 1 t of waste concrete can yield 650 kg of recycled coarse aggregate, 330 kg of RFA, and 20 kg of waste [25]. Therefore, the carbon emission factors were 11.51 kg-CO2eq/t for recycled coarse aggregates and 5.84 kg-CO2eq/t for recycled fine aggregates, respectively, based on the mass allocation. Considering the recycling of waste concrete to produce recycled aggregates as an “environmentally friendly” treatment, it is necessary to allocate the environmental impact of the recycled aggregates.
International Organization for Standardization [27] divided the environmental impact distribution of material recycling into two categories. The first category is a closed-loop recycling system, that is, within the whole product system, when the material is reused, its essential properties and application methods remain unchanged, and the material can be reused directly. The second category is an open-loop recycling system, that is, within the whole product system, when the material is used, its essential properties and application methods change somewhat, and the material needs to be recycled and processed before reuse. There are two methods of determining the allocation factor for the environmental impact of recycled materials: the mass allocation method and the economic allocation method, and the corresponding calculation formulas are shown in Equations (1) and (2), respectively [21,25].
C m = M recycled - material M disposable - material + M recycled - material
where Cm denotes the environmental impact factor of recycled aggregates obtained according to the mass allocation method. Mrecycled-material denotes the mass of recycled aggregates; Mdisposable-material denotes the mass of waste concrete.
C e = E 1 money × M recycled - material E 2 money × M disposable - material + E 1 money × M recycled - material
where Ce denotes the environmental impact factor of recycled aggregates obtained according to the economic allocation method. Mrecycled-material denotes the quality of recycled aggregate. Mdisposable-material denotes the quality of waste concrete. E1-money and E2-money refer to the market economic value of recycled aggregate and the cost of waste concrete, respectively.
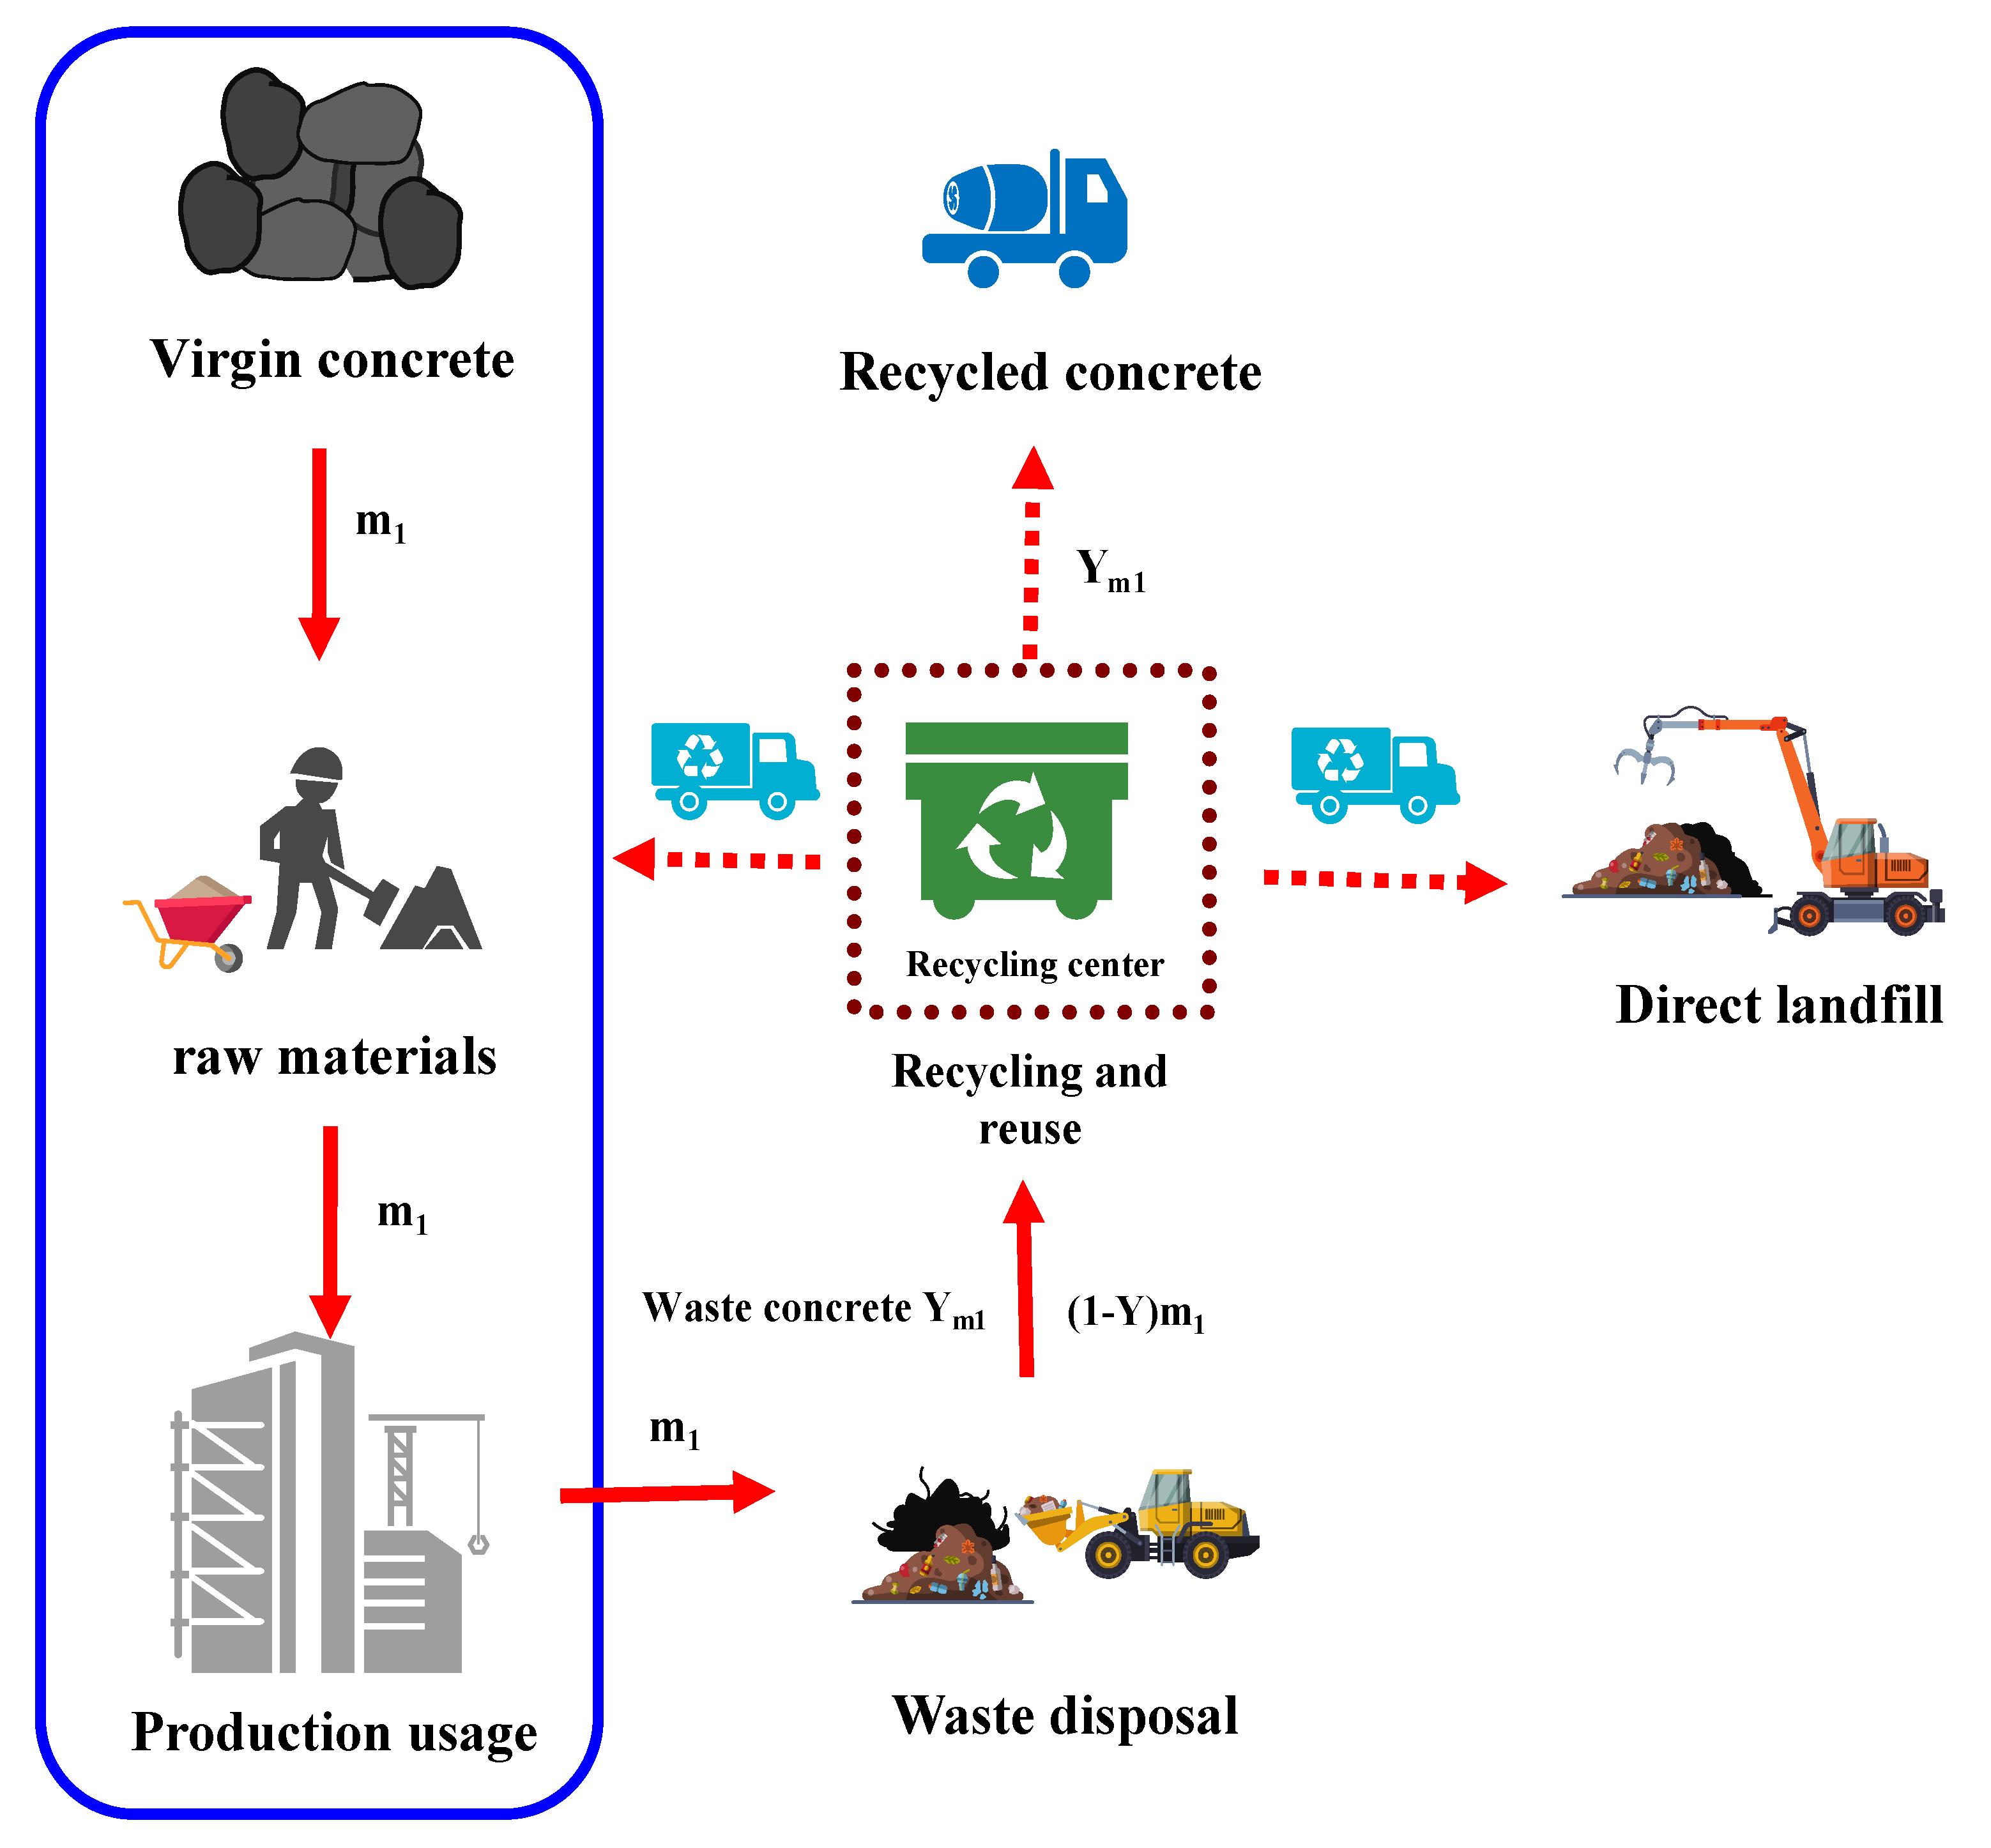
The mass allocation method refers to the determination of the environmental impact factor of recycled aggregates based on the mass ratio between the primary materials (waste disposal) and secondary materials (recycled aggregates production) [28]. The distribution coefficients calculated by this method are imprecise because they don’t take into account the fact that there will be mass loss in the preparation of recycled materials by recycling the primary materials. The economic allocation method is based on market prices, and the price ratio between the initial raw material and the recycled material is weighted to determine the environmental impact allocation factor for the material [29]. This method takes into account the loss of quality during material recovery, but it has the disadvantage of being vulnerable to market price fluctuations. Considering the quality loss of the waste concrete after recycling, the obtained recycled aggregates will be slightly inferior to natural aggregates in terms of performance. The existing research is less related to the multiple regeneration of concrete, and the recycling of waste concrete is classified as an open-loop recycling system. The economic allocation method is used to determine the environmental impact allocation factor of recycled aggregates, and the allocation schematic and calculation formula are shown in Figure 2 and Equation (2), respectively.
According to the Chinese construction market price, the cost of 650 kg of recycled coarse aggregate and 330 kg of RFA is CNY 14.29 and CNY 17.99, respectively, while the cost of 1 t of waste concrete directly to landfill is 143.48 yuan [30]. With reference to Equation (2), the environmental impact distribution coefficients of recycled coarse aggregate and RFA can be calculated according to the economic distribution method, as shown in Table 1.
As can be seen from Table 2, when waste concrete is recycled and prepared into recycled aggregates, the environmental impact allocation of recycled coarse aggregates and RFA, in the whole recycled concrete system, is 8.13% and 10.24%, respectively. Therefore, after considering the environmental impact allocation, the carbon emissions of preparing 1 t of RFA is 0.598 kg-CO2eq.
Carbon emission factors for the production and transportation phases of other raw materials for RFA concrete were determined through the literature review. Considering that RFA concrete is not yet used on a large scale, it is assumed that the carbon emissions of RFA concrete are the same as those of recycled coarse aggregate concrete during the procedures of the manufacturing, transportation to the building site, construction, and de-construction or demolition [31]. The life cycle inventory data for RFA concrete is as shown in Table 2.

2.3. Calculation Method of Carbon Emissions

The life cycle of RFA concrete includes six stages: raw material extraction and processing, transportation to the manufacture, RFA concrete manufacturing, transportation to the building site, construction, and de-construction or demolition. The formula for calculating the life cycle carbon emissions per unit of recycled concrete is given by Equation (3), in which the effect of carbonation of recycled concrete is considered [31].
C L C = C Y S + C Y Y + C Z S + C Z Y + C Z Z + C Z C C T H
where: CLC refers to the total carbon emission of the life cycle of RFA concrete. CYS and CYY denote the carbon emission in the stages of the raw material extraction and transportation, respectively. CZS, CZY, CZZ, and CZC represent the carbon emission in the stages of preparation, transportation, construction, and demolition of RFA concrete, respectively. CTH is the carbon uptake due to the carbonation of concrete.
The carbon emission of the raw material production stage (CYS) can be determined based on the material consumption for concrete of one functional unit and the corresponding carbon emission factor. The carbon emission of the transportation stage (CYY) can be determined based on the quality of different raw materials, the distance from the raw material origin to the recycled concrete mixing plant, and the carbon emission factor of the corresponding transportation equipment. During the transport phase (CZY) of RFA concrete, it was transported by concrete mixer truck with a transport distance of 20 km and a transport carbon emission factor of 0.26 kg-CO2eq/m3 [31]. The carbon emissions of recycled concrete preparation stage (CZS), construction stage (CZZ), and demolition stage (CZC) are shown in Table 2, respectively.
The alkaline material, calcium hydroxide, in concrete will have a certain neutralization reaction with carbon dioxide in the air to produce calcium carbonate and water, which is expressed as a CO2 uptake phenomenon and will have a compensating effect on the environment [33,34]. Pade et al. [35] proposed that the total carbonation of concrete components will increase by 20% to 40% after being dismantled, crushed, and exposed to the air for between 2 weeks and 4 months. Sereewatthanawut et al. [23] suggested that the CO2 from the production of cement would eventually be completely absorbed by concrete. However, since the full carbonation takes hundreds of years and cannot be determined experimentally, the upper limit of CO2 uptake by carbonation is predicted, by theoretical analysis, to be 75% of the CO2 emitted from production. Compared with natural fine aggregate, the surface of RFA must contain a small amount of cement mortar in the microscopic state. Under the same conditions, the CO2 uptake capacity of recycled concrete is higher than that of ordinary concrete. The CO2 uptake capacity of RFA concrete will vary for a different RFA replacement ratio, and the amount of CO2 uptake by carbonation of RFA concrete can be determined according to the carbonation depth prediction equation, with the specific calculation procedure referring to the literature [36].
The previous studies have shown that the RFA replacement would lead to the degradation of mechanical properties [37,38,39]. Therefore, the necessity for a comprehensive evaluation of the mechanical properties and life cycle carbon emissions of RFA concrete is evident. In this paper, we proposed an analytical model for a more comprehensive performance and environmental analysis, in which the replacement of the RFA ratio, 28-day cubic compressive strength, and carbon emissions are involved.

3. Case Study

3.1. Material Parameters

The ratio design of RFA concrete and its life cycle carbon emission analysis and calculation were carried out using the mixture design in the literature [37,38,39]. In all three cases, P.O. 42.5 ordinary Portland cement was used for cement, crushed stone with continuous gradation from 5 to 25 mm was used for natural coarse aggregate, and river sand with the gradation of Zone 2 was used for natural fine aggregate. The RFA was provided by the construction resource manufacturer. For case 1, different water–to-cement ratios and RFA replacement ratios were considered, and additional water was added to allow RFA to reach the saturated surface dry condition. For case 2 and case 3, different RFA replacement ratios were considered based on the densest volume method, and an equal volume of RAF is used to replace natural fine aggregate without considering additional water. For the purpose of analysis, the volumetric substitution rate of RFA is transformed into the mass substitution rate. The details of RFA concrete mixes are shown in Table 3, Table 4 and Table 5.

3.2. Life Cycle Carbon Calculation Results

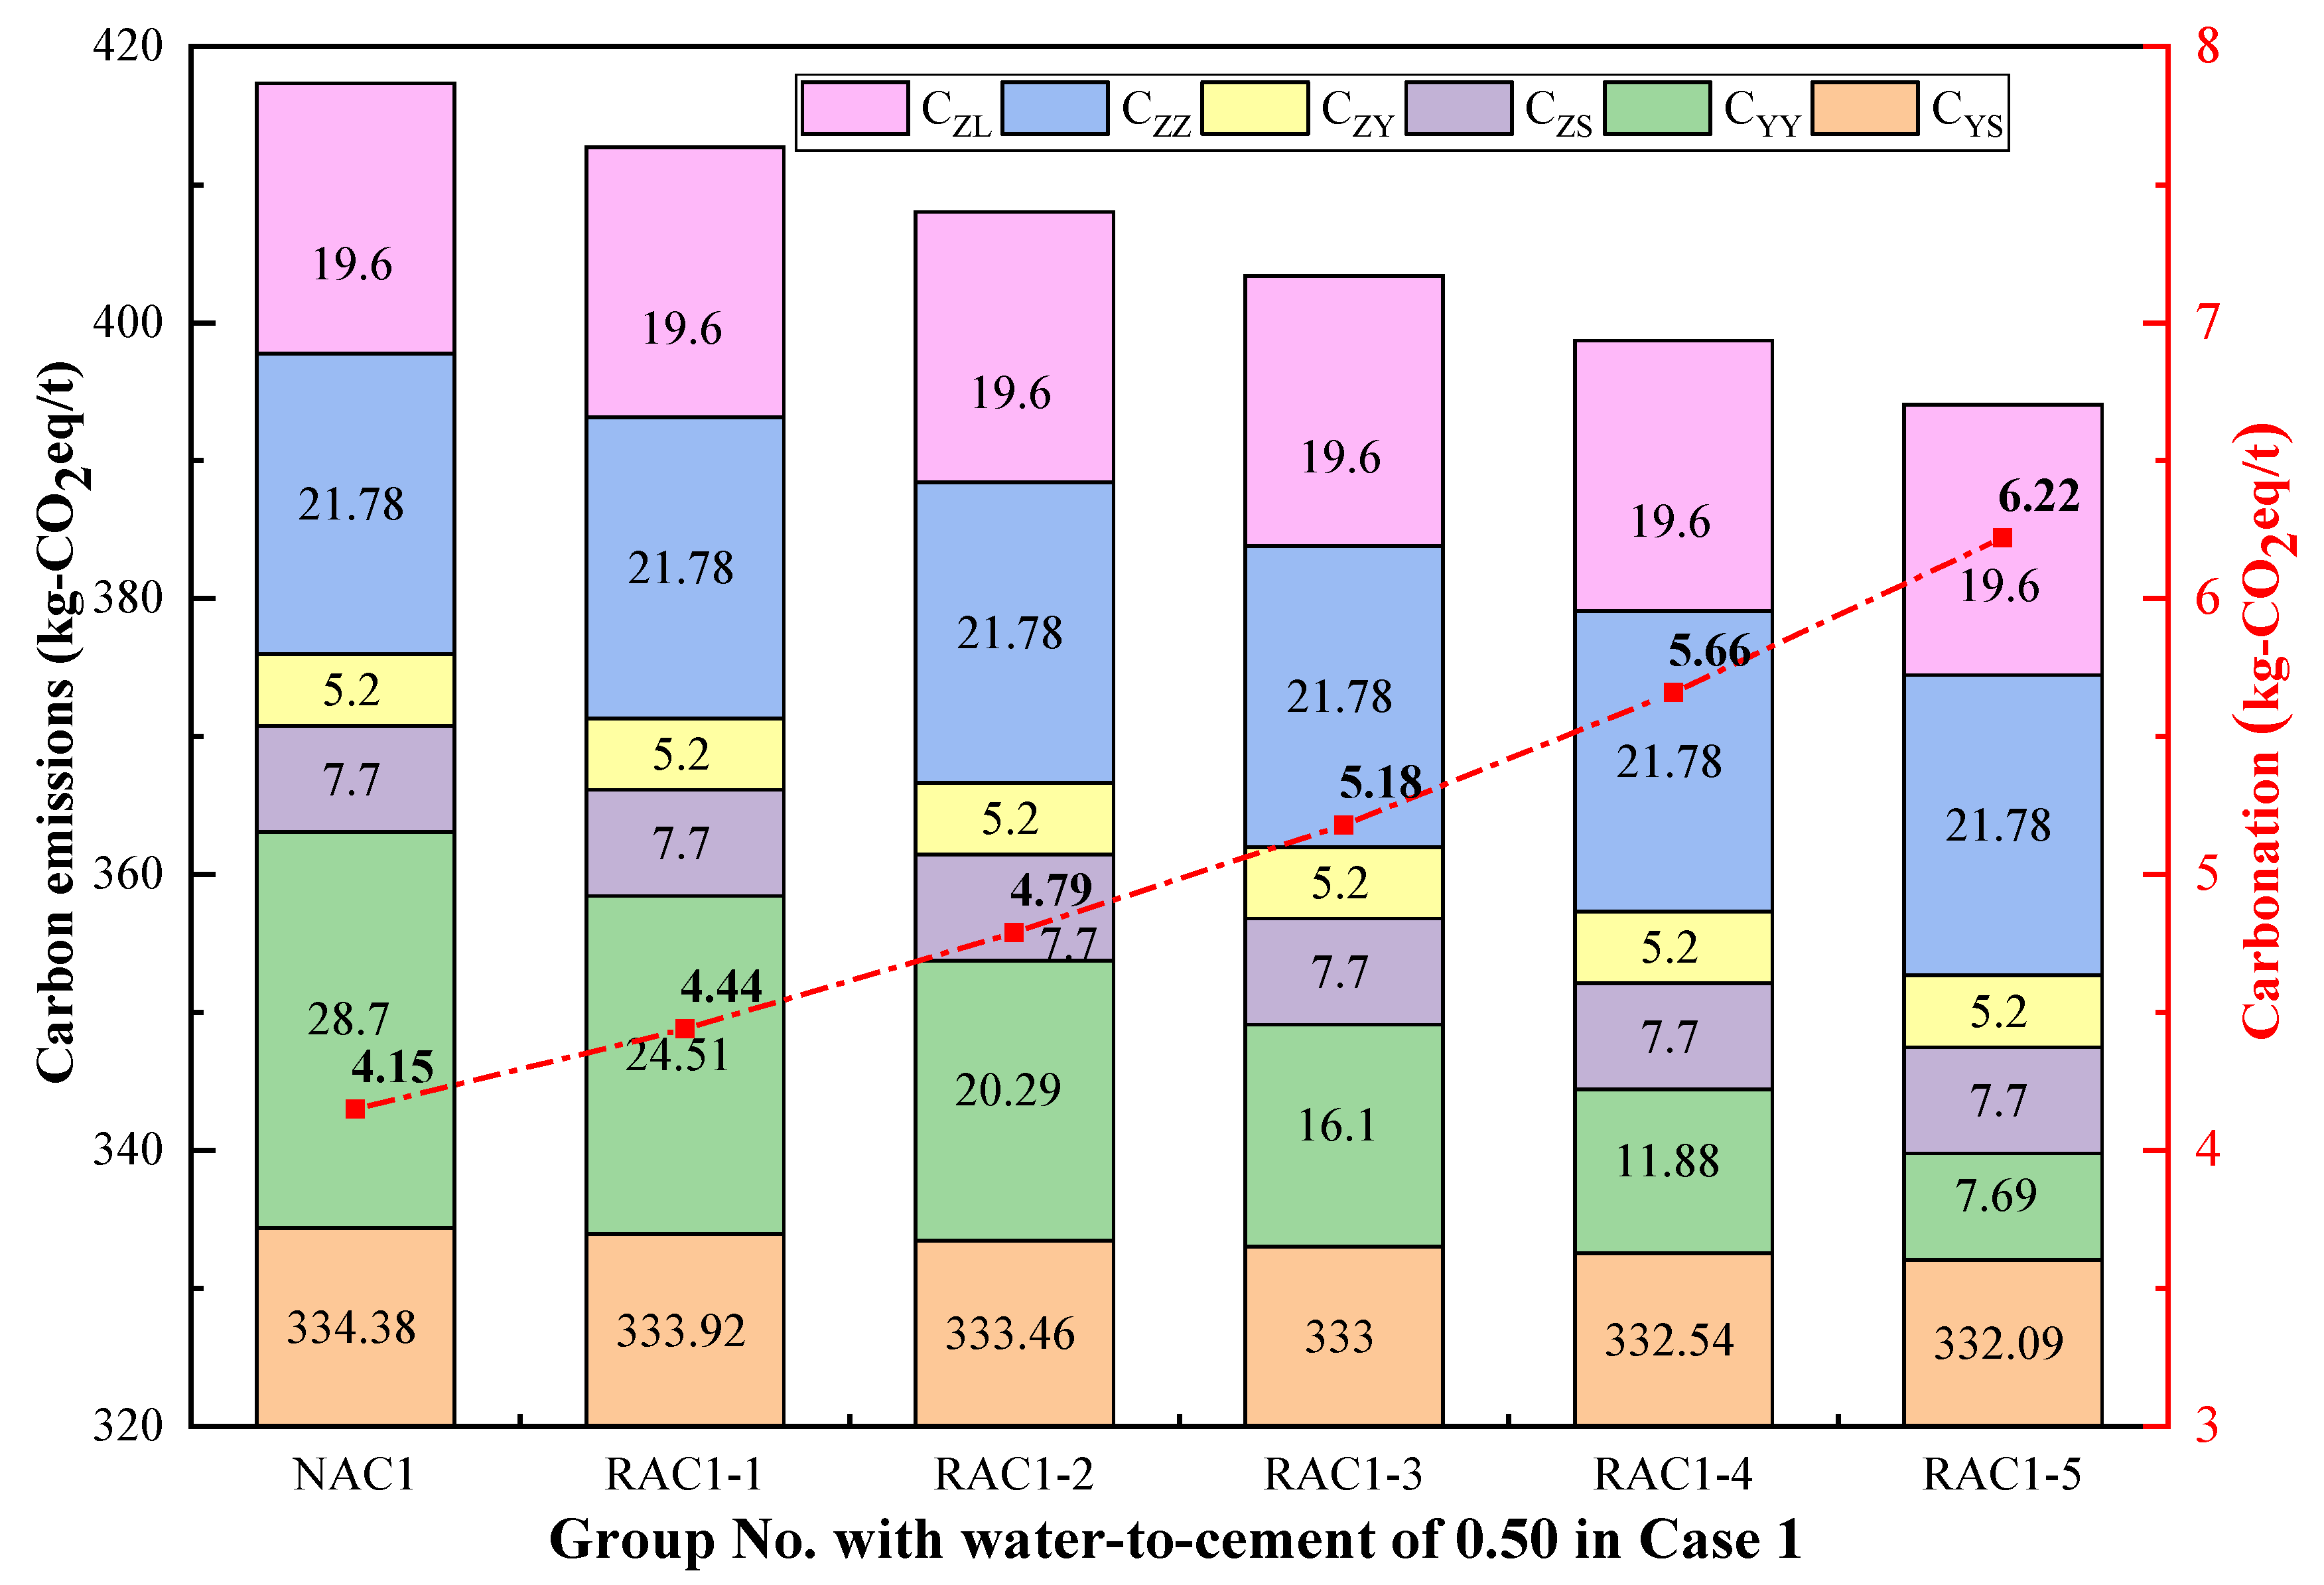
Taking the RFA concrete mix with a water-to-cement ratio of 0.50 in Case 1 as an example, the life cycle carbon emissions were calculated and shown in Figure 3. At a constant water-to-cement ratio, carbon emission shows a decreasing trend as the replacement of the RFA ratio increases. It also can be observed that the higher the replacement ratio, the more pronounced the carbon uptake by RFA concrete, indicating the better compensation effect on the environment. For instance, the total carbon emission and carbon sequestration effect of 1 t of RFA concrete are 417.36 kg-CO2eq and 4.15 kg-CO2eq, respectively, at 0% RFA replacement ratio, while the total emission and carbon sequestration effect of 1 t of recycled concrete are 394.06 kg-CO2eq and 6.22 kg-CO2eq, respectively, at 100% RFA replacement ratio. Without considering the carbonation effect of concrete, the increment of 20% in the recycled aggregate replacement will reduce carbon emissions by 4.66 kg-CO2eq/t, and the carbon emission reduction will reach 5.58% when the natural fine aggregate is completely replaced. When considering the effect of carbonation, the increment of 20% in the recycled aggregate replacement will reduce carbon emissions by 5.07 kg-CO2eq/t, and the carbon emission reduction will reach 6.14% when the natural fine aggregate is completely replaced.
The results also show that the carbon emissions from the raw material production stage (CYS) account for 80.92% to 85.62%. This indicates that carbon emissions from the raw material production stage are the main source of carbon emissions for RFA concrete. The main reason is that a large amount of CO2 will be produced in the production process of cement calcination, and the amount of cement in the concrete mix ratio is relatively high. Therefore, controlling the amount of cement in concrete and using green supplementary cementitious materials, such as fly ash, can significantly reduce carbon emissions. With the increase in the RFA replacement ratio, the carbon emission in the transportation stage (CYY) of raw materials decreased from 28.70 kg-CO2eq/t to 7.69 kg-CO2eq/t, along with the 73.21% decrease. It is attributed to the transportation distance of RFA being much smaller than that of natural aggregate.

3.3. Effect of Transportation Distance on Carbon Emissions of RFA Concrete

Currently, large-scale recycled aggregate production has not yet been formed in China, and the number of recycled aggregate processing plants is also limited. Therefore, the impact of transportation distance was investigated when evaluating carbon emissions of the RFA concrete life cycle. Specifically, six transport scenarios for RFA were considered (i.e., 0 km, 50 km, 100 km, 150 km, 200 km, and 250 km), and a diesel truck was chosen as the transport machinery.
Taking the RFA concrete mix ratio of a 0.50 water-to-cement ratio in Case 1 as an example, the life cycle carbon emissions of RFA concrete under different transportation scenarios can be calculated, as shown in Figure 4. As can be seen from the figure, for the same RFA replacement ratio, the farther the transportation distance, the higher the carbon emission of RFA concrete. The main reason is that the increase in transportation distance will lead to the increase in carbon emission in the transportation stage of RFA concrete raw materials. The test results also illustrate that, when the transportation distance of RFA is greater than 331.7 km, the carbon emission of RFA concrete will be greater than that of natural concrete. Besides, the greater the RFA replacement ratio, the greater the slope of the fitting line of carbon emission of RFA concrete, that is to say, the critical transportation distance of RFA concrete is 331.7 km for this case, and the higher the RFA replacement ratio, the more sensitive the carbon emission of RFA concrete is to the change in transportation distance.

3.4. Spatial Fitting Analysis of RFA Replacement Ratio, 28-Day Cubic Compressive Strength and Carbon Emissions

From Table 3 and Figure 3, it could be found that the carbon emission of concrete decreases with the increase in the RFA replacement ratio under the same water-to-cement ratio. However, the 28-day cubic compressive strength of RFA concrete decreases as the RFA replacement ratio increases, which can affect the serviceability of concrete members. To further analyze the relationship between life cycle carbon emissions, RFA replacement ratio, and 28-day cubic compressive strength of RFA concrete, a fitting relationship was established with RFA replacement ratio, 28-day cubic compressive strength, and carbon emissions as x-axis, y-axis, and z-axis, respectively, as shown in Figure 5. Equation (4) gives the fitted relationship, and the correlation coefficient R-squared value is 0.890.
Z = 107.62 + 0.42 X + 7.23 Y
where Z denotes the amount of CO2 generated per unit of RFA concrete throughout its life cycle (kg CO2-eq); X denotes the RFA replacement ratio of RFA concrete; Y denotes the 28-day cubic compressive strength of RFA concrete at different RFA replacement ratios (MPa).
As can be seen from Figure 5 and Equation (4), when the replacement ratio of RFA is certain, the average 28-day cubic compressive strength of RFA concrete increases by 7.23 kg-CO2eq of carbon emission for every 1 MPa increase. It is reasonable that the higher the 28-day cubic compressive strength, the lower the water-to-cement ratio will be, and hence, the cement usage will increase, ultimately resulting in the higher life cycle carbon emissions of RFA concrete. The results also indicated that, when the 28-day cubic compressive strength is the same, the carbon emission increases by 0.42 kg-CO2eq for every 1% increase in RFA replacement ratio of RFA concrete. The main reason is that, as the replacement ratio of RFA increases, more cement per unit volume of RFA concrete is required to achieve the same compressive strength, which leads to an increase in carbon emissions. Therefore, when conducting the life cycle carbon emission evaluation of RFA concrete, the carbon emission should be considered, together, with the mechanical properties of RFA concrete.

3.5. Analysis of Carbon-Strength Ratio of RFA Concrete

According to the index of “cementitious strength” proposed by Damineli et al. [40], Zhang et al. [30] and Knoeri [41] proposed the concept of “carbon-strength ratio” to evaluate the carbon emission while considering its strength. Specifically, carbon-strength ratio is defined as the amount of CO2 emitted for 1-MPa compressive strength. Therefore, the smaller the “carbon-strength ratio”, the better the environmental effect of RFA concrete and, conversely, the worse the environmental effect of RFA concrete.
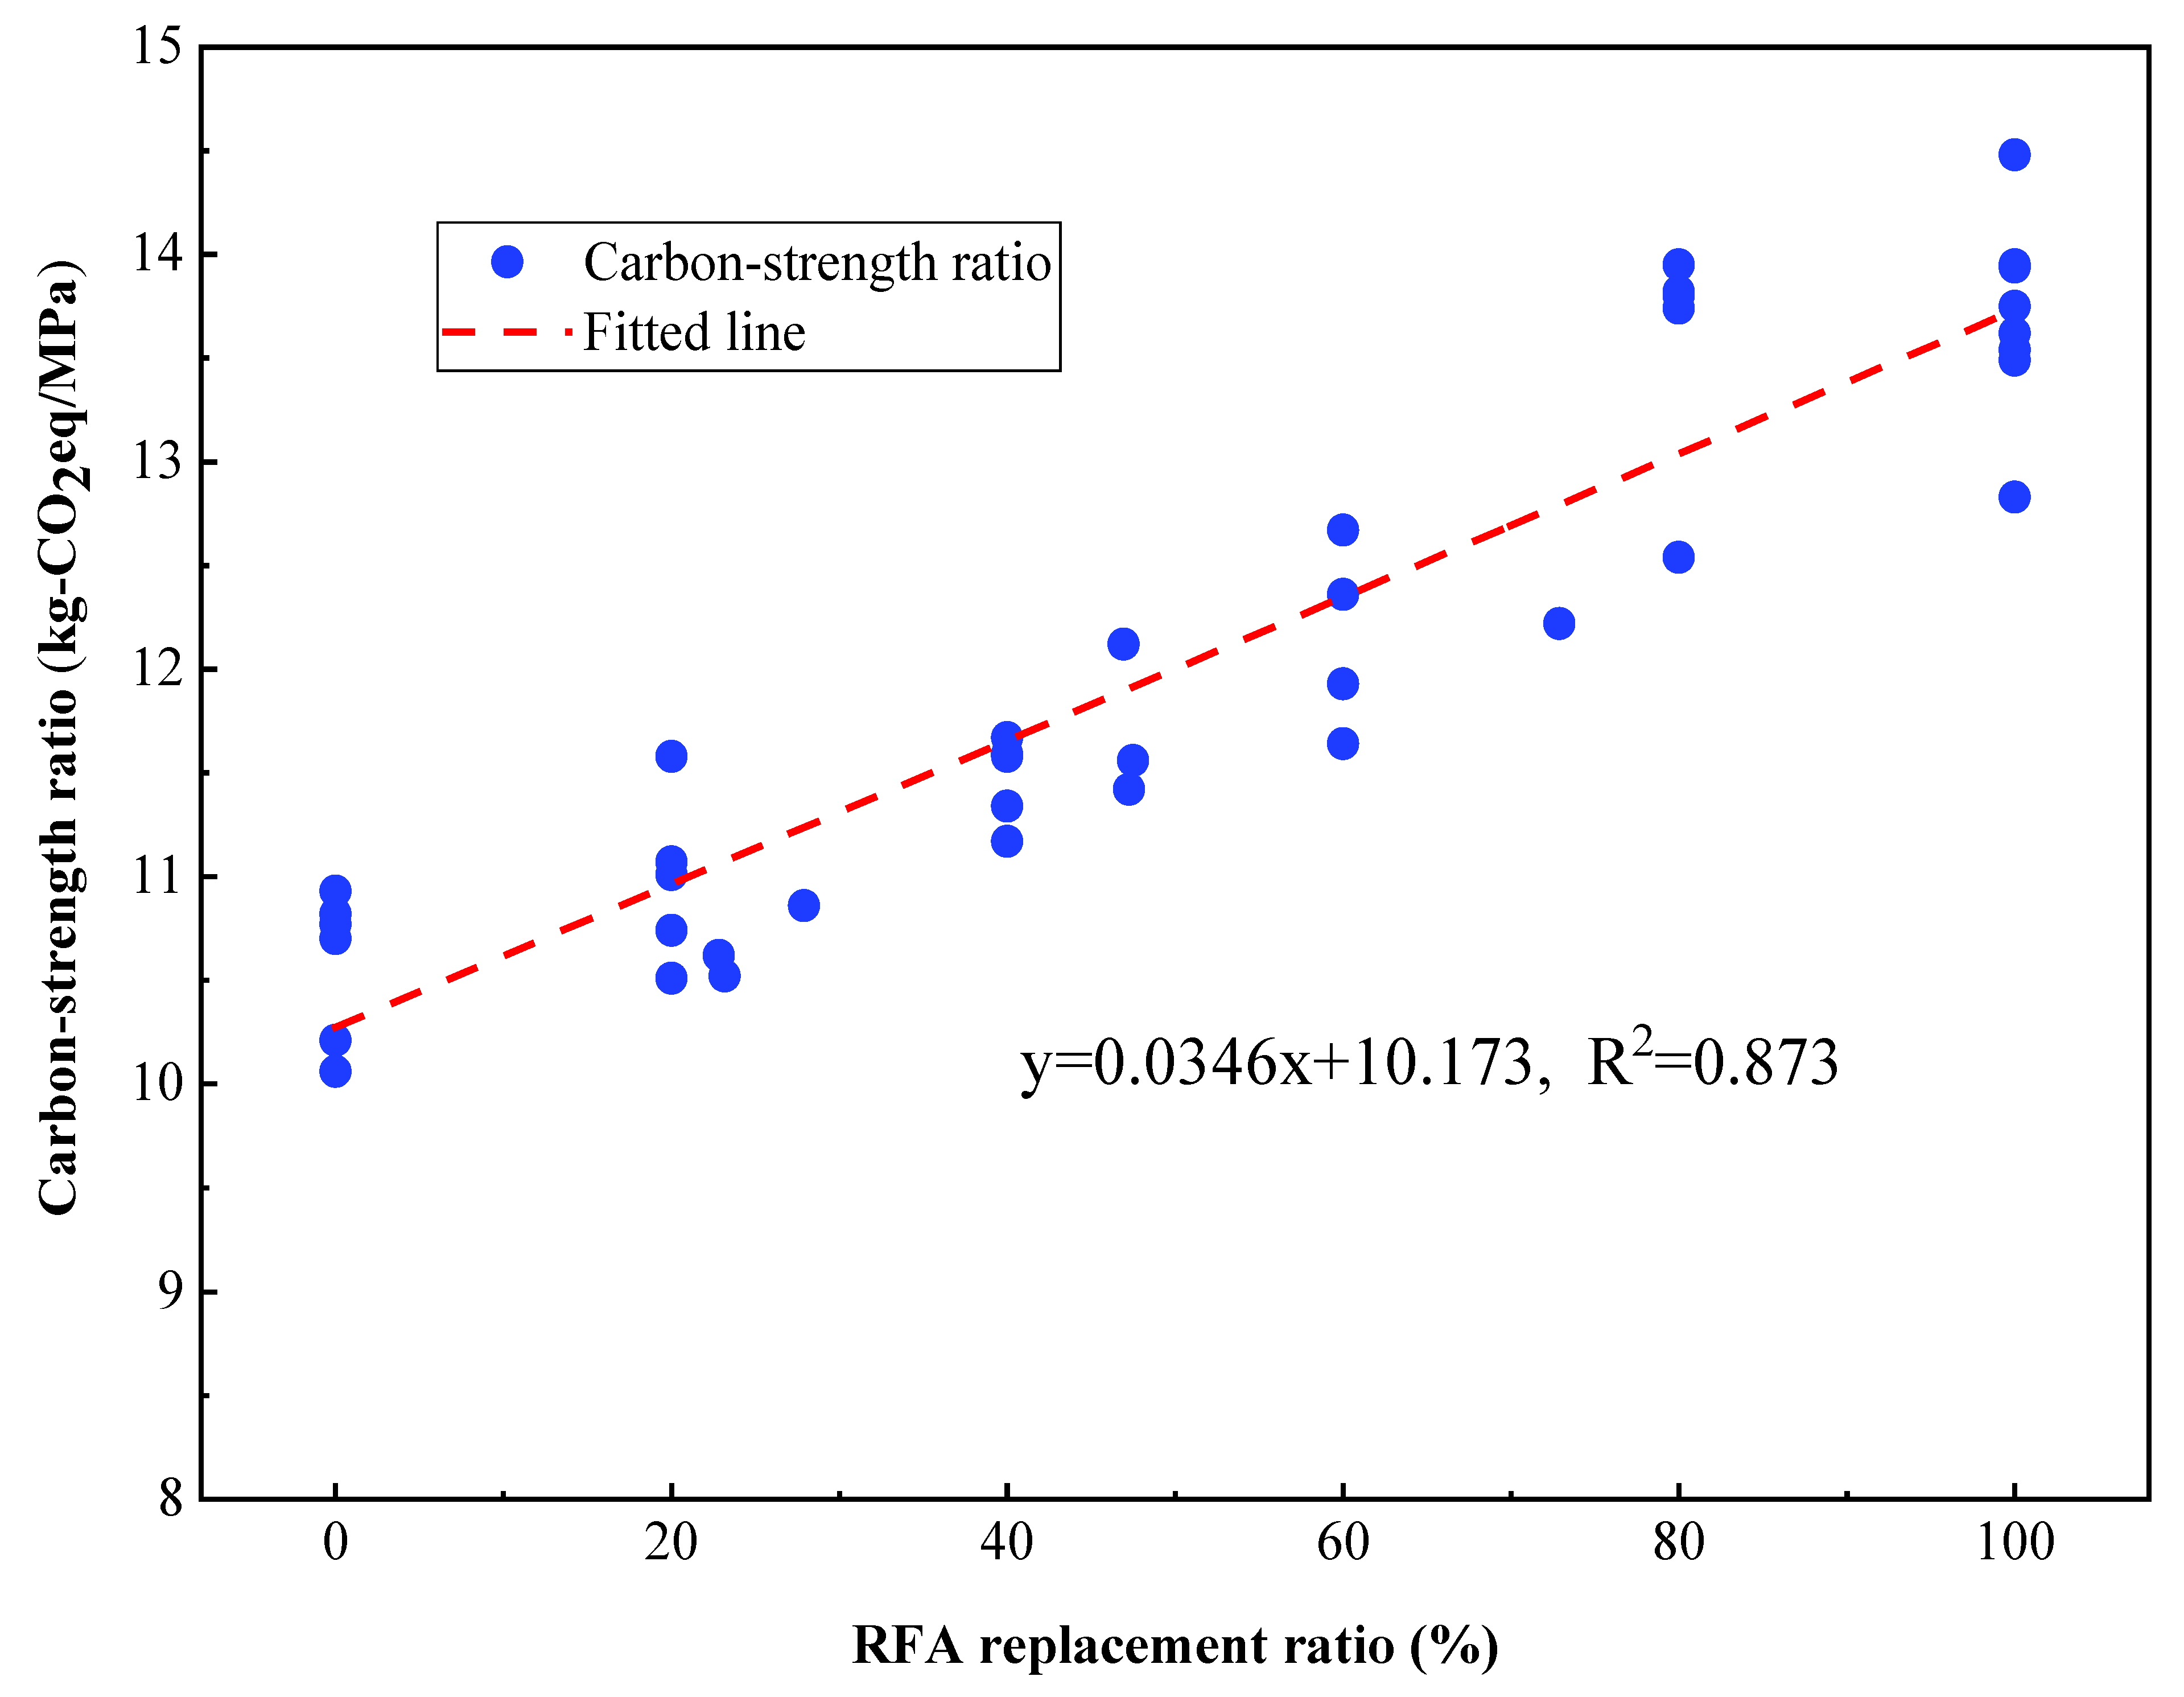
In this study, the 28-day compressive strength was used as the strength indicator. The calculated carbon-strength ratios for the cases 1, 2, and 3 are presented in Figure 6, and a linear fit is also established. The R-squared value of the fitted relationship curve was 0.873, indicating a reasonable fitting result. The intercept of the vertical coordinate in the fitted curve graph indicates the carbon-intensity ratio is 10.173 kg-CO2eq/MPa for natural concrete when the RFA replacement ratio is 0. The slope indicates that the carbon-strength ratio will increase by 0.0346 kg-CO2eq/MPa for a 1% increase in the RFA replacement ratio; when the RFA replacement ratio increases from 0 to 100%, the carbon-strength ratio will increase by 3.46 kg-CO2eq/MPa, with a 34.01% increase—that is to say, the detrimental effect of RFA replacement on the strength reduction in RFA concrete is more significant than the beneficial effect on its carbon emission reduction. For instance, the increase in the replacement ratio of RFA, from 0 to 100% in the three cases, reduces the strength of RFA concrete by 12.03% to 34.58%, while the carbon emission is reduced by 6.14% to 8.92%.

3.6. Sensitivity Analysis of Influencing Factors

To investigate the extent to which three variation parameters water-to-cement ratio, RFA replacement ratio and transportation distance affect the life cycle carbon emissions of RFA concrete. In this study, three analytical methods are utilized to explore the analysis through Grey Relational Analysis (GRA) and validate the results using Analysis of Variance (ANOVA) with Spearman correlation analysis. The water-to-cement ratio was selected as 0.50, 0.55, 0.60, 0.65, and 0.70; the RFA replacement ratio was 0%, 20%, 40%, 60%, 80%, and 100%; the transportation distance was 0 km, 50 km, 100 km, 150 km, and 200 km. The results of carbon emission calculations under 150 working conditions are used as the subject of the study, and the specific analysis is shown below.

3.6.1. Grey Relational Analysis

GRA is a method of measuring the degree of correlation between factors based on the degree of similarity or dissimilarity of trends between factors, where the degree of correlation refers to a measure of the magnitude of the correlation between factors, in two systems, over time or with different objects [42]. GRA is applicable to dynamic history analysis and provides a quantitative measure of the developmental dynamics within the system. The method does not require the number of samples or the regularity of the samples. The basic idea is to judge the closeness of the connection based on the similarity of the geometry of the sequence curves.
The detailed calculation formula could be referred to in the literature [43]. After calculation, it was found that the grey relational coefficients of carbon emission of RFA concrete with water-to-cement ratio, RFA replacement ratio, and transportation distance are 0.7610, 0.6596, and 0.5556, respectively. It has been reported that a grey correlation coefficient greater than 0.5 indicates the existence of a correlation between the two, and the larger the coefficient, the stronger the correlation between the two. Therefore, there is a correlation between the life cycle carbon emissions of RFA concrete and the water-to-cement ratio, RFA ratio, and transportation distance, with the highest sensitivity belonging to the water-to-cement ratio, followed by the RFA replacement ratio, and finally, the transportation distance.

3.6.2. Analysis of Variance

ANOVA is a statistical analysis method that identifies the effects of various factors by analyzing the results of experimental or theoretical derivations [44]. The basic idea is to determine the influence of controllable factors on research results by analyzing the contribution of variation, from different sources, to the total variation. Referring to the calculation steps in the literature [45], a multi-factor ANOVA was performed using Statistical Product Service Solutions (SPSS) software to analyze the significance correlation of the water-to-cement ratio, RFA replacement ratio, and transportation distance for carbon emissions from RFA concrete, and the results are shown in Table 6.
As can be seen from Table 4, the p-values of the water-to-cement ratio, RFA replacement ratio, and transportation distance are less than the F-values, and the p-values are less than 0.001. It indicates that this SPSS ANOVA is statistically significant, and the individual changes in the water-to-cement ratio, RFA replacement ratio, and transportation distance of RFA concrete have a significant effect on carbon emissions. By conducting a comparison of F-values, it was found that the water-to-cement ratio was the largest, the RFA replacement ratio was the second largest, and the transportation distance was the smallest. It shows that the variation of water-to-cement ratio has the greatest effect on the carbon emission of RFA concrete, followed by the RFA replacement ratio and finally the transportation distance.

3.6.3. Spearman Correlation Analysis

The Spearman correlation analysis is a common method to describe the correlation between two sets of variables, and it is applicable to data satisfying a continuous or hierarchical distribution or a continuous plus hierarchical distribution [46]. The Spearman correlation coefficient is a nonparametric measure of the degree of dependence of two variables, and it is often denoted by the Greek letter ρ. The value of ρ ranges from [–1, 1], and the larger the absolute value of ρ, the stronger the correlation. When ρ > 0, it indicates a positive correlation between the two sets of variables; when ρ < 0, it indicates a negative correlation between the two sets of variables. The results of the Spearman correlation analysis of carbon emissions from RFA concrete, with respect to water-to-cement ratio, RFA replacement ratio, and transportation distance, are shown in Table 7.
From Table 5, the correlation coefficients of water-to-cement ratio, RFA replacement ratio, and transportation distance are −0.978, −0.202, and 0.068, respectively, indicating that the carbon emission of RFA concrete shows negative, negative, and positive correlation with water-to-cement ratio, RFA replacement ratio, and transportation distance, and the correlation degree of water-to-cement ratio is the highest, RFA replacement ratio is the second, and transportation distance is the lowest. From Table 5, it can also be found that the p-value of water-to-cement ratio is the smallest, RFA replacement ratio is the second largest, and transportation distance is the largest, indicating that the variation of water-to-cement ratio has the most significant effect on the carbon emission of RFA concrete, followed by the RFA replacement ratio, while the variation of transportation distance has the least significant effect.

3.6.4. Comparison of Three Correlation Methods

Through the examination and verification of three correlation analysis methods, it was found that the whole life cycle carbon emission of RFA concrete has the highest sensitivity to water-to-cement ratio, the second highest RFA replacement ratio, and the lowest transportation distance. There are two main reasons for this. On the one hand, it is because changes in the water-to-cement ratio significantly affect the amount of cement used in concrete, which is an essential cementitious material in concrete, and it has a relatively high amount and carbon emission factor, as well as is more sensitive to carbon emissions. On the other hand, it’s because the carbon emission coefficients of the production and transportation stages of RFA are small (two to three orders of magnitude lower than those of cement), so they have a smaller impact on the life cycle carbon emissions of RFA concrete.

4. Conclusions

(1) With the same water-to-cement ratio, the higher the replacement ratio of RFA, the better the carbon sequestration effect of RFA concrete and the lower the carbon emission. The stage of raw material extraction accounts for 80.92% to 85.62% carbon emission of the production of RFA concrete, mainly due to the large amount of CO2 produced during the calcination of cement production.
(2) For the same RFA replacement ratio, the farther the transportation distance, the higher the carbon emission of RFA concrete. The higher the replacement ratio of RFA, the more sensitive the carbon emission of RFA concrete is to the change in transportation distance.
(3) By establishing a three-dimensional spatial fitting equation, it was found that the carbon emission of FRA concrete slightly increased with a higher RFA replacement ratio for the same 28-day cubic compressive strength. The main reason is that, in order to achieve the same 28-day cubic compressive strength as ordinary concrete, more cementitious material is required per unit volume of RFA concrete.
(4) Although high replacement rates of RFA result in low carbon emission, they lead to the high carbon-strength ratio. It is mainly attributed to the fact that, as the FRA replacement ratio increases, the reduction degree in the compressive strength is more obvious than that in the carbon emission.
(5) Multiple analysis methods showed that RFA concrete carbon emissions were the most sensitive to the water-to-cement ratio, followed by RFA replacement ratio, with the lowest being transport distance.
(6) The carbon sequestration potential of RFA concrete may also be underestimated due to the fact that the surface of RFA contains some old mortar, which can take in carbon dioxide. Furthermore, the preparation of recycled aggregates from waste concrete recycling can avoid the landfill of waste concrete and the consumption of natural resources. Both of these positive effects of aggregate recycling should be considered in a future study.

Author Contributions

Conceptualization, C.D.; Data curation, L.Y.; Formal analysis, B.L.; Investigation, B.L. and Z.C.; Methodology, Z.T.; Resources, B.L.; Writing—review & editing, W.Y. All authors have read and agreed to the published version of the manuscript.

Funding

This work was supported by the National Natural Science Foundation of China (51968046; 52268043), and Training Plan for Academic and Technical Leaders of Major Disciplines in Jiangxi Province—Leading Talent Project (20204BCJ22003), and Science and Technology Research and Development Program Project of China railway group limited (Key Project, No.: 2021-Key-08).

Conflicts of Interest

The authors declare no conflict of interest.

Abbreviations

AbbreviationsFull Name of the Term
LCALife Cycle Assessment
RFARecycled Fine Aggregate
GRAGrey Relational Analysis
ANOVAAnalysis of Variance
SPSSStatistical Product Service Solutions
CmThe environmental impact factor of recycled aggregates obtained according to the mass allocation method.
Mrecycled-materialThe mass of recycled aggregates.
Mdisposable-materialThe mass of waste concrete.
CeThe environmental impact factor of recycled aggregates obtained according to the economic allocation method.
E1-moneyThe market economic value of recycled aggregate.
E2-moneyThe cost of waste concrete.
CLCThe total carbon emission of the life cycle of RFA concrete.
CYSThe carbon emission in the stages of the raw material extraction and processing.
CYYThe carbon emission in the stage of the raw material transportation to the manufacture.
CZSThe carbon emission in the stage of RFA concrete manufacturing.
CZYThe carbon emission in the stage of transportation to the building site for RFA concrete.
CZZThe carbon emission in the stage of construction of RFA concrete.
CZCThe carbon emission in the stage of de-construction or demolition of RFA concrete.
CTHThe carbon uptake due to the carbonation of concrete.
XRFA replacement ratio of RFA concrete.
Y28-day cubic compressive strength of RFA concrete at different RFA replacement ratios (MPa).
ZThe amount of CO2 generated per unit of RFA concrete throughout its life cycle (kg CO2-eq).

References

  1. Meyer, C. The greening of the concrete industry. Cem. Concr. Compos. 2009, 31, 601–605. [Google Scholar] [CrossRef]
  2. Vieira, T.; Alves, A.; Brito, J.; Correia, J.R.; Silva, R.V. Durability-related performance of concrete containing fine recycled aggregates from crushed bricks and sanitary ware. Mater. Des. 2016, 90, 767–776. [Google Scholar] [CrossRef]
  3. Kaza, S.; Yao, L.; Bhada-Tata, P.; Van Woerden, F. What a Waste 2.0-A Global Snapshot of Soild Waste Management to 2050; Urban Development Series; World Bank Group: Washington, DC, USA, 2018; pp. 1–295. [Google Scholar]
  4. Guo, H.; Shi, C.; Guan, X.; Zhu, J.; Ding, Y.; Ling, T.C. Durability of recycled aggregate concrete—A review. Cem. Concr. Comp. 2018, 89, 251–259. [Google Scholar] [CrossRef]
  5. Bendixen, M.; Best, J.; Hackney, C.; Iversen, L. Time is running out for sand. Nature 2019, 571, 29–31. [Google Scholar] [CrossRef] [Green Version]
  6. Xiao, J.; Li, W.; Fan, Y.; Huang, X. An overview of study on recycled aggregate concrete in China (1996–2011). Constr. Build. Mater. 2012, 31, 364–383. [Google Scholar] [CrossRef]
  7. Huang, B.; Wang, X.; Kua, H.; Geng, Y.; Bleischwitz, R.; Ren, J. Construction and demolition waste management in China through the 3R principle. Resour. Conserv. Recycl. 2018, 129, 36–44. [Google Scholar] [CrossRef]
  8. Duan, Z.; Hou, S.; Xiao, J.; Li, B. Study on the essential properties of recycled powders from construction and demolition waste. J. Clean. Prod. 2020, 253, 119865. [Google Scholar] [CrossRef]
  9. Deepak, P.; Bhupendra, S.; Kumar, S.S. Utilization of recycled concrete aggregate in bituminous mixtures: A comprehensive review. Constr. Build. Mater. 2022, 326, 126859. [Google Scholar]
  10. Li, L.; Zhan, B.J.; Lu, J.; Poon, C.S. Systematic evaluation of the effect of replacing river sand by different particle size ranges of fine recycled concrete aggregates (FRCA) in cement mortars. Constr. Build. Mater. 2019, 209, 147–155. [Google Scholar] [CrossRef]
  11. Behera, M.; Minocha, A.K.; Bhattacharyya, S.K. Flow behavior, microstructure, strength and shrinkage properties of self-compacting concrete incorporating recycled fine aggregate. Constr. Build. Mater. 2019, 228, 116–819. [Google Scholar] [CrossRef]
  12. Leite, M.B.; Santana, V.M. Evaluation of an experimental mix proportion study and production of concrete using fine recycled aggregate. J. Build. Eng. 2019, 21, 243–253. [Google Scholar] [CrossRef]
  13. Evangelista, L.; Brito, J.D. Mechanical behaviour of concrete made with fine recycled concrete aggregates. Cem. Concr. Comp. 2007, 29, 397–401. [Google Scholar] [CrossRef]
  14. Martínez, I.; Etxeberria, M.; Pavón, E.; Díaz, E. Influence of demolition waste fine particles on the properties of recycled aggregate masonry mortar. Int. J. Civ. Eng. 2018, 16, 1213–1226. [Google Scholar] [CrossRef] [Green Version]
  15. Gao, D.; Gu, Z.; Pang, Y.; Yang, L. Mechanical properties of recycled fine aggregate concrete incorporating different types of fibers. Constr. Build. Mater. 2021, 298, 123732. [Google Scholar] [CrossRef]
  16. Xiao, J.; Wang, C.; Ding, T.; Akbarnezhad, A. A recycled aggregate concrete high-rise building: Structural performance and embodied carbon footprint. J. Clean. Prod. 2018, 199, 868–881. [Google Scholar] [CrossRef]
  17. Tsujino, M.; Noguchi, T.; Tamura, M.; Kanematsu, M.; Maruyama, I. Application of conventionally recycled coarse aggregate to concrete structure by surface modification treatment. J. Adv. Concr. Technol. 2007, 5, 13–25. [Google Scholar] [CrossRef] [Green Version]
  18. Shi, D.; Shi, Q. Study on mechanical properties and mesoscopic numerical simulation of recycled concrete. Sustainability 2022, 14, 12125. [Google Scholar] [CrossRef]
  19. Yildirim, S.T.; Meyer, C.; Herfellner, S. Effects of internal curing on the strength, drying shrinkage and freeze-thaw resistance of concrete containing recycled concrete aggregates. Constr. Build. Mater. 2015, 91, 288–296. [Google Scholar] [CrossRef]
  20. Yoda, K.; Shintani, A. Building application of recycled aggregate concrete for upper-ground structural elements. Constr. Build. Mater. 2014, 67, 379–385. [Google Scholar] [CrossRef]
  21. Marian, S.; Dan, V.; Luis, F. Comparative carbon emission assessments of recycled and natural aggregate concrete: Environmental influence of cement content. Geosci. Front. 2021, 12, 101235. [Google Scholar]
  22. Lage, I.M.; Burgo, P.V.; Lizancos, M.V. Sustainability evaluation of concretes with mixed recycled aggregate based on holistic approach: Technical, economic and environmental analysis. Waste. Manag. 2020, 104, 9–19. [Google Scholar] [CrossRef] [PubMed]
  23. Sereewatthanawut, I.; Prasittisopin, L. Environmental evaluation of pavement system incorporating recycled concrete aggregate. Int. J. Pavement Res. Technol. 2020, 13, 455–465. [Google Scholar] [CrossRef]
  24. Marinković, S.; Radonjanin, V.; Malešev, M.; Ignjatović, I. Comparative environmental assessment of natural and recycled aggregate concrete. Waste Manag. 2010, 30, 2255–2264. [Google Scholar] [CrossRef]
  25. Zhang, Y.; Luo, W.; Wang, J.; Wang, Y.; Xu, Y.; Xiao, J. A review of life cycle assessment of recycled aggregate concrete. Constr. Build. Mater. 2019, 209, 115–125. [Google Scholar] [CrossRef]
  26. Kawai, K.; Sugiyama, T.; Kobayashi, K.; Sano, S. Inventory data and case studies for environmental performance evaluation of concrete structure construction. J. Adv. Concr. Technol. 2005, 3, 435–456. [Google Scholar] [CrossRef] [Green Version]
  27. ISO. ISO, 14044; Environmental Management--Life Cycle Assessment--Requirements and Guidelines. International Organization for Standardization: Geneva, Switzerland, 2006; p. 2006.
  28. Chen, C.; Habert, G.; Bouzidi, Y.; Jullien, A.; Ventura, A. LCA allocation procedure used as an incitative method for waste recycling: An application to mineral additions in concrete. Resour. Conserv. Recycl. 2010, 54, 1231–1240. [Google Scholar] [CrossRef] [Green Version]
  29. Werner, F.; Richter, K. Economic allocation in LCA: A case study about aluminium window frames. Int. J. Life Cycle Assess. 2000, 5, 79–83. [Google Scholar] [CrossRef] [Green Version]
  30. Zhang, Y.; Xu, Y.; Yao, Z.; Wang, L. Effect of mix design methods on life cycle assessment of recycled aggregate concrete. J. Zhejiang Univ. Technol. 2020, 48, 648–653. (In Chinese) [Google Scholar]
  31. Xiao, J.; Li, A.; Ding, T. Life cycle assessment on CO2 emission for recycled aggregate concrete. J. Southeast Univ. (Nat. Sci. Ed.) 2016, 46, 1088–1092. (In Chinese) [Google Scholar]
  32. Xing, W.; Tam, V.W.; Le, K.N.; Butera, A.; Hao, J.L.; Wang, J. Effects of mix design and functional unit on life cycle assessment of recycled aggregate concrete: Evidence from CO2 concrete. Constr. Build. Mater. 2022, 348, 128712. [Google Scholar] [CrossRef]
  33. Gong, X.; Nie, Z.; Wang, Z.; Cui, S.; Gao, F.; Zuo, T. Life cycle energy consumption and carbon dioxide emission of residential building designs in Beijing. J. Ind. Ecol. 2012, 16, 576–587. [Google Scholar] [CrossRef]
  34. Mahmood, W.; Khan, A.R.; Ayub, T. Carbonation resistance in ordinary Portland cement concrete with and without recycled coarse aggregate in natural and simulated environment. Sustainability 2021, 14, 437. [Google Scholar] [CrossRef]
  35. Pade, C.; Guimaraes, M. The CO2 uptake of concrete in a 100 year perspective. Cem. Concr. Res. 2007, 37, 1348–1356. [Google Scholar] [CrossRef]
  36. Yang, K.H.; Seo, E.A.; Tae, S.H. Carbonation and CO2 uptake of concrete. Environ. Impact Asses. 2014, 46, 43–52. [Google Scholar] [CrossRef]
  37. Sun, Y.; Li, D.; Xu, Y.; Huang, H. Experimental research on mechanical properties and durability of recycled fine aggregate concrete for actual production. Build. Struct. 2019, 49, 81–84+11. (In Chinese) [Google Scholar]
  38. Kirthika, S.K.; Singh, S.K. Durability studies on recycled fine aggregate concrete. Constr. Build. Mater. 2020, 250, 118850. [Google Scholar] [CrossRef]
  39. Fan, C.C.; Huang, R.; Hwang, H.; Chao, S.J. Properties of concrete incorporating fine recycled aggregates from crushed concrete wastes. Constr. Build. Mater. 2016, 112, 708–715. [Google Scholar] [CrossRef]
  40. Damineli, B.L.; Kemeid, F.M.; Aguiar, P.S.; John, V.M. Measuring the eco-efficiency of cement use. Cem. Concr. Comp. 2010, 32, 555–562. [Google Scholar] [CrossRef]
  41. Knoeri, R.; Silvestre, J.D.; Brito, J.; Ahmed, H. Effect of incorporation of high volume of recycled concrete aggregates and fly ash on the strength and global warming potential of concrete. J. Clean. Prod. 2017, 166, 485–502. [Google Scholar]
  42. Wen, K. The proof of a new modified grey relational grade. Grey Syst. Theory Appl. 2016, 6, 180–186. [Google Scholar] [CrossRef]
  43. You, M.L.; Shu, C.M.; Chen, W.T.; Shyu, M.L. Analysis of cardinal grey relational grade and grey entropy on achievement of air pollution reduction by evaluating air quality trend in Japan. J. Clean. Prod. 2017, 142, 3883–3889. [Google Scholar] [CrossRef]
  44. Fausto, M.G.; Alexander, L.B.; Enrique, D.C. A novel approach for the control of grain size distributions based on variance analysis. Constr. Build. Mater. 2021, 285, 122748. [Google Scholar]
  45. Chen, L.; Zhou, W.; Yu, C.; Shen, F. SPSS variance analysis-based teenager physical health promoting strategy research. Indian J. Biotechnol. 2014, 10, 1156–1161. [Google Scholar]
  46. Michael, S.; Melvin, V. Sequential estimation of Spearman rank correlation using Hermite series estimators. J. Multivar. Aanal. 2021, 186, 104783. [Google Scholar]
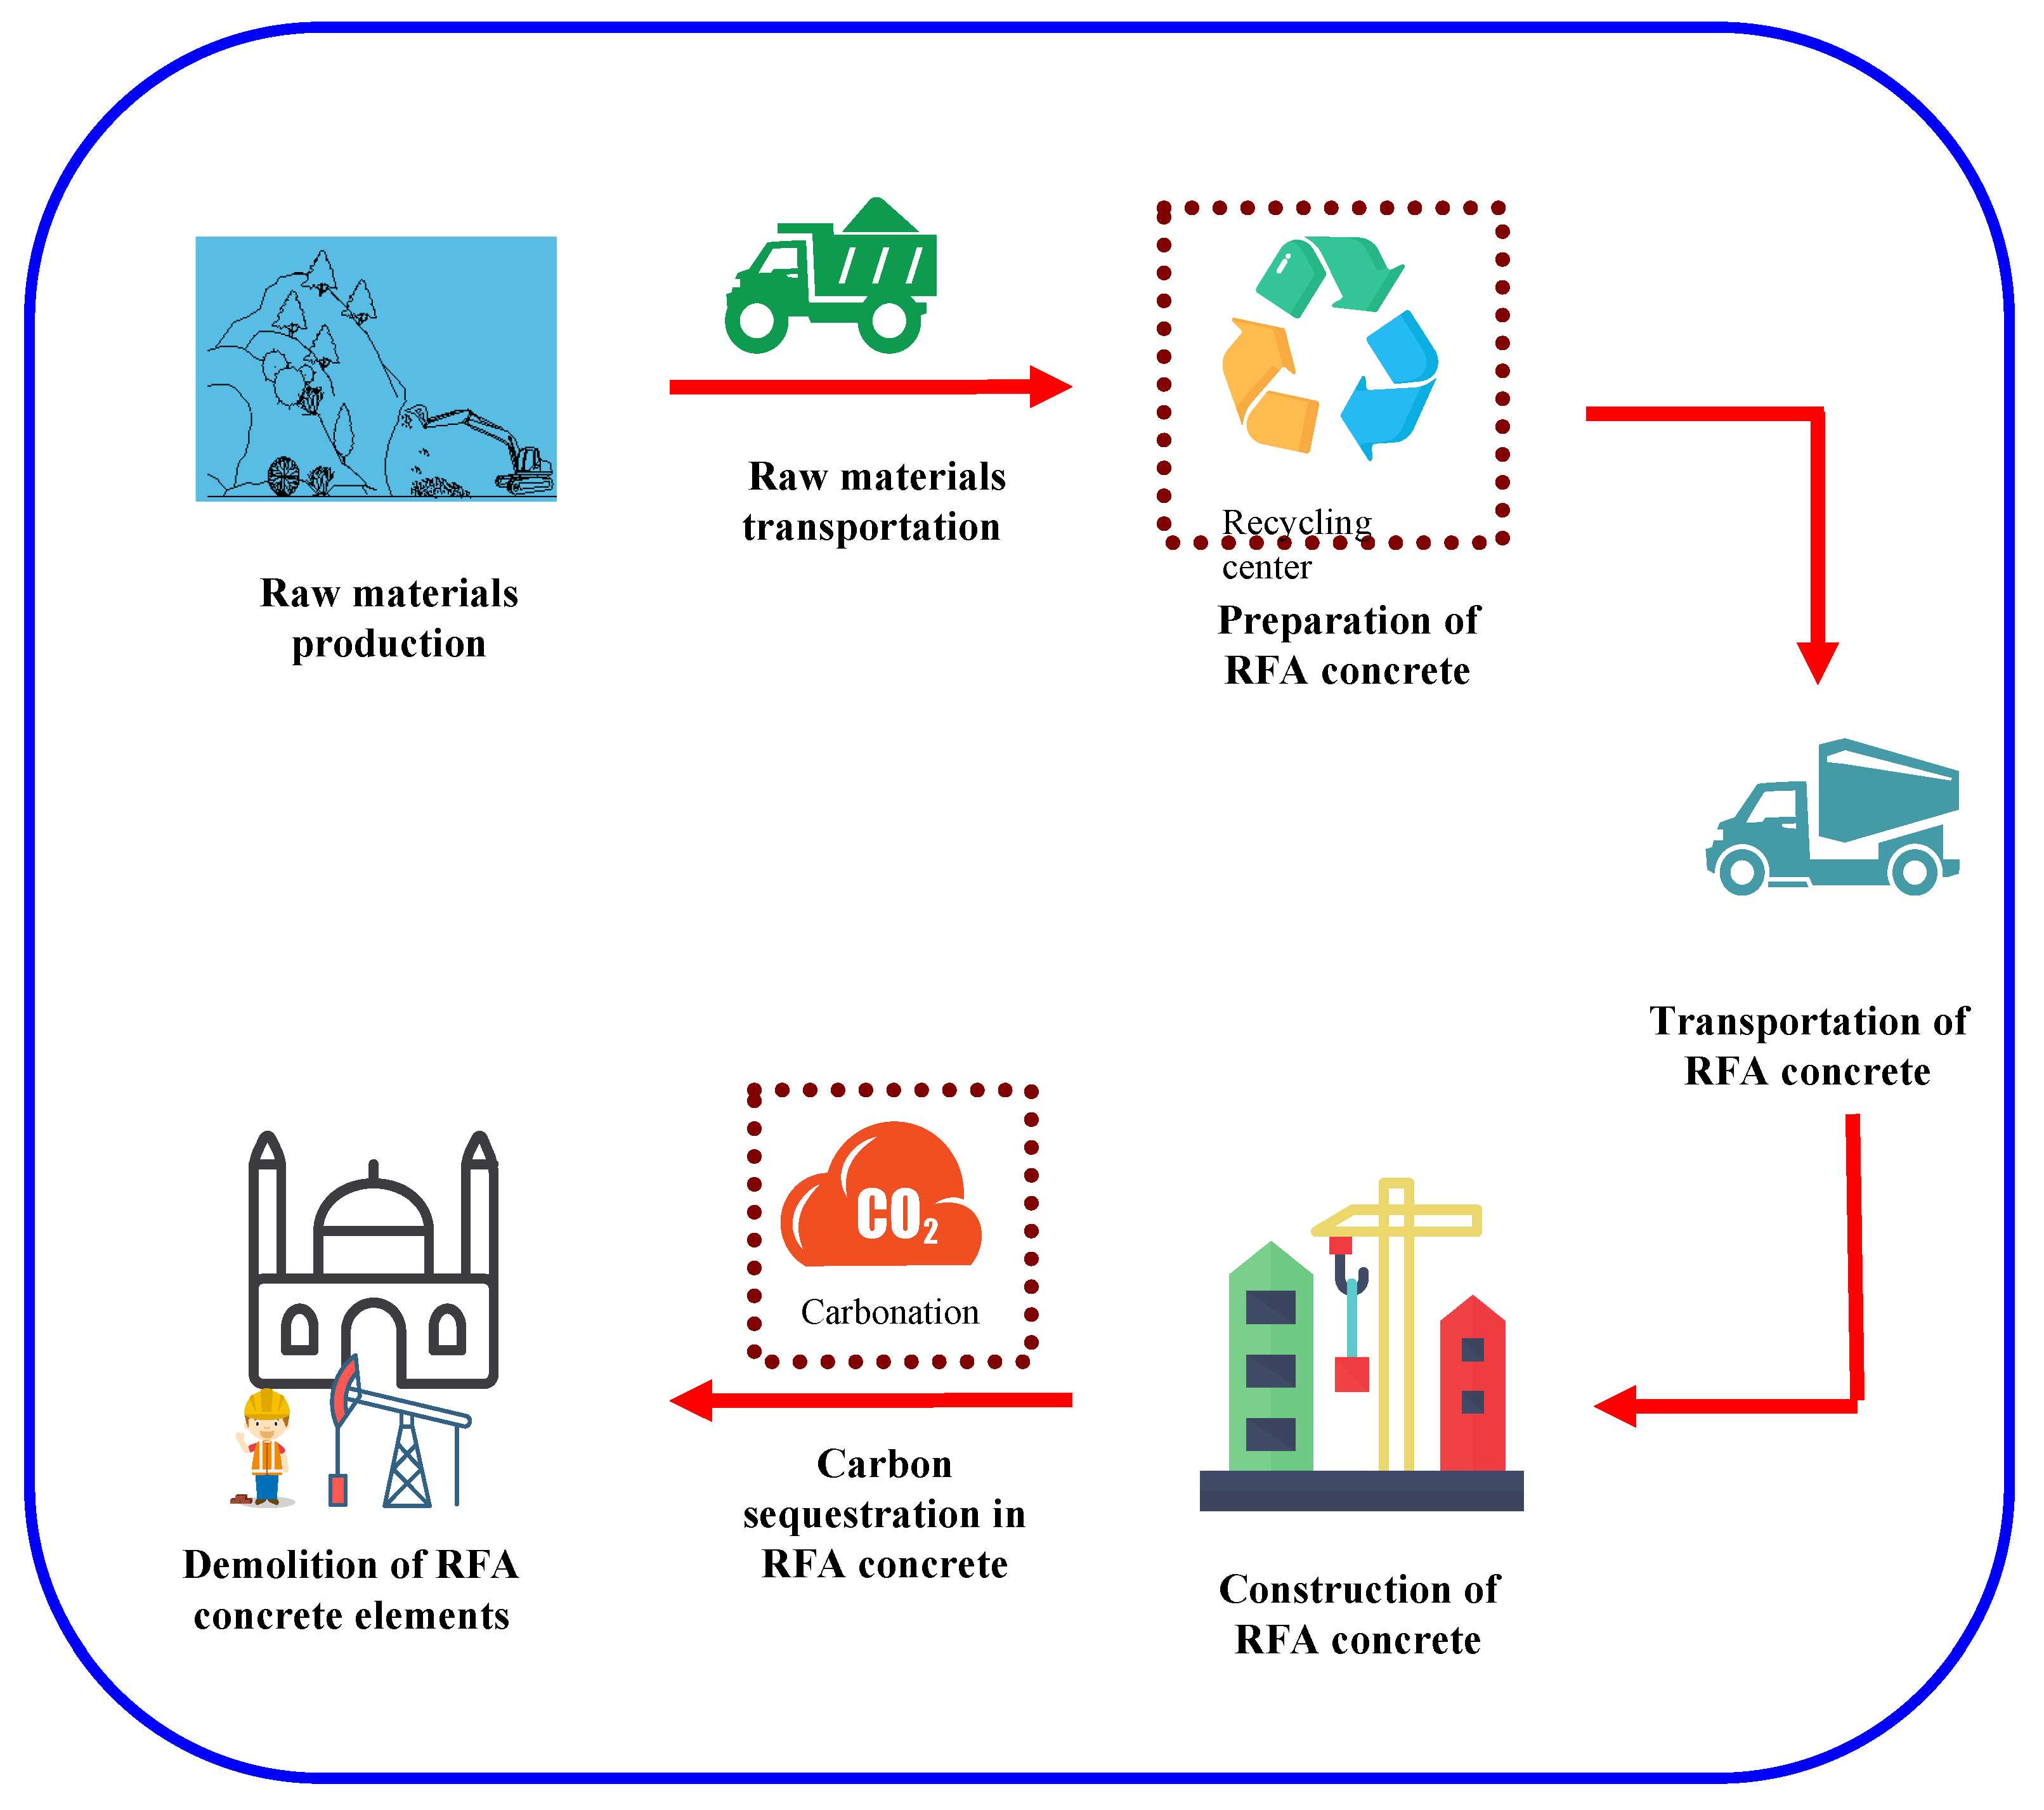
Figure 1. Boundary of the life cycle carbon emission calculation system for RFA concrete.
Sustainability 14 14448 g001
Figure 2. Schematic diagram of the distribution of the environmental impact of recycled aggregates.
Sustainability 14 14448 g002
Figure 3. Variation of life cycle carbon emissions with different RFA replacement ratio for the same water-to-cement ratio concrete.
Sustainability 14 14448 g003
Figure 4. Life cycle carbon emissions of RFA concrete under different transportation scenarios.
Sustainability 14 14448 g004
Figure 5. Fitting plane between RFA replacement ratio, 28-day cubic compressive strength and carbon emissions of RFA concrete.
Sustainability 14 14448 g005
Figure 6. Fitting relation curve between replacement ratio of RFA and carbon-strength ratio of concrete.
Sustainability 14 14448 g006
Table 1. Environmental impact distribution coefficient of recycled coarse aggregate and RFA.
Quantity (kg)Cost (CNY)Allocation Factor
Waste concrete1000143.48143.48/175.76 × 100% = 81.63%
Recycled coarse aggregates65014.2914.29/175.76 × 100% = 8.13%
Recycled fine aggregates33017.9917.99/175.76 × 100% = 10.24%
Total--175.76100%
Table 2. Life cycle inventory data for RFA concrete.
RFA Concrete ListCement
[24]
Natural Coarse Aggregate
[30]
Natural
Fine
Aggregate
[32]
Recycled Fine
Aggregate
[25]
Superplasticizer
[32]
Water
[30]
Carbon emission factor (kg-CO2eq/t)8613.704.000.59811500.213
Transportation machineryCement truckDry bulk carrierDry bulk carrierDiesel trucksDiesel trucks--
Transport distance/km2038030010100
Transportation carbon emission factor
kg-CO2eq/(t∙km)
0.1110.01340.01340.1070.107--
RFA concrete
preparation of carbon emissions [30]
(kg-CO2eq/m3)
7.7
RFA concrete
construction carbon emissions [31]
(kg-CO2eq/m3)
21.78
RFA concrete carbon emissions from construction and demolition [31]
(kg-CO2eq/m3)
19.6
Table 3. Mix proportions of RFA concrete (Case 1) Date from [37].
Group NO.RFA Replacement Ratio/wt%Water-to-Cement RatioMaterials/(kg/m3)28-Days Cubic Compressive Strength/MPa
CementNatural Coarse AggregateNatural Fine AggregateRecycled Fine AggregateFree WaterAdditional Water
NAC100.5038012036770190041.45
RAC1-1200.5038012035421351901039.39
RAC1-2400.5038012034062711902036.78
RAC1-3600.5038012032714061903034.15
RAC1-4800.5038012031355421904135.03
RAC1-51000.50380120306771905129.15
NAC200.5534512036770190036.01
RAC2-1200.5534512035421351901034.51
RAC2-2400.5534512034062711902032.71
RAC2-3600.5534512032714061903026.33
RAC2-4800.5534512031355421904126.68
RAC2-51000.55345120306771905125.46
NAC300.6030812036770185032.63
RAC3-1200.6030812035421351851030.08
RAC3-2400.6030812034062711852029.76
RAC3-3600.6030812032714061853029.36
RAC3-4800.6030812031355421854124.47
RAC3-51000.60308120306771855123.99
NAC400.6527712036770180029.88
RAC4-1200.6527712035421351801029.05
RAC4-2400.6527712034062711802027.12
RAC4-3600.6527712032714061803024.72
RAC4-4800.6527712031355421804122.52
RAC4-51000.65277120306771805121.92
NAC500.7025712036770180027.88
RAC5-1200.7025712035421351801028.05
RAC5-2400.7025712034062711802026.27
RAC5-3600.7025712032714061803023.82
RAC5-4800.7025712031355421804121.07
RAC5-51000.70257120306771805121.27
Table 4. Mix proportions of RFA concrete (Case 2) Date from [38].
Group NO.RFA Replacement Ratio/wt%Water-to-Cement RatioMaterials/(kg/m3)28-Days Cubic Compressive Strength/MPa
CementNatural Coarse AggregateNatural Fine AggregateRecycled Fine AggregateWaterSuperplasticizer
NAC600.50330.01215.07200165.01.6536.2
RAC6-127.90.50330.61160.1504195165.31.6536.8
RAC6-247.30.50331.01124.0360323166.01.6633.8
RAC6-372.90.50331.51077.8180484165.81.6631.7
RAC6-41000.503321032.00645166.01.6630.1
Table 5. Mix proportions of RFA concrete (Case 3) Date from [39].
Group NO.RFA Replacement Ratio/wt%Water-to-Cement RatioMaterials/(kg/m3)28-Days Cubic Compressive Strength/MPa
CementNatural Coarse AggregateNatural Fine AggregateRecycled Fine AggregateWaterSuperplasticizer
NAC700.3544989889801574.553.12
RAC7-127.90.354498986731991574.548.34
RAC7-272.90.354498984493971574.541.97
RAC7-31000.3544989807941574.534.75
RAC7-423.170.354498986732031574.549.64
RAC7-547.490.354498984494061574.548.52
RAC7-61000.3544989808131574.546.73
Table 6. Results of ANOVA.
Independent VariablesClass III Sum of SquaresDegree of FreedomMean SquareF-ValueSignificance (p-Value)
Water-to-cement ratio240,349.66460,087.4217,535.68<0.001
RFA replacement ratio6792.1851358.44396.44<0.001
Transportation distance983.894245.9771.78<0.001
Table 7. Results of Spearman’s correlation test analysis.
Independent VariablesNumber of Samples (N-Values)Correlation CoefficientSignificance (p-Value)
Water-to-cement ratio150−0.978<0.001
RFA replacement ratio150−0.2020.013
Transportation distance1500.0680.409
Publisher’s Note: MDPI stays neutral with regard to jurisdictional claims in published maps and institutional affiliations.