Abstract
In engineering education, traditional teaching approaches cannot sufficiently help students to learn electric vehicle (EV) concepts. In this study, the design of an educational test setup including all the components and all dynamics of EVs is implemented, and case studies for engineering education with practical applications are discussed. The proposed test and training platform not only provides hands-on experience for engineering students, but also the opportunity for expert users to test their own designed algorithms on the test setup through a computer and human–machine interface device. The aim of the study is to show students the effects of road slope, vehicle weight and energy recovery parameters on a light EV. In this context, five case studies have been carried out by the students, and a survey was conducted with them. The survey results show that the test setup can help them better comprehend any EV system and develop their professional knowledge and skills.
1. Introduction
Practical studies are important for learning in engineering education. For effective learning, theoretical knowledge should be supported by practice in the closest way to reality. Today, practical education is carried out with computer-based programs and experimental studies in laboratories. Although simulation programs support theoretical knowledge, they are not sufficient for effective learning. On the other hand, laboratory training provides the closest training to reality, while improving the hand skills of the engineering students. It is possible to show the components of a system practically in laboratories with separate modules. However, this method is not enough to understand the whole system. Therefore, a compact test setup is needed for special systems. There is a need for a test setup in laboratories to make the EV technology, which has become widespread these days, more understandable.
Electric vehicles (EVs), which were invented towards the end of the 19th century, have been subject to more demand than fossil fuel vehicles thanks to their ease of use and comfort. However, in the middle of the 20th century, interest in EVs gradually decreased due to the mass production of internal combustion engines (ICE), their low cost and long driving distances. In the middle of the 20th century, with the effects of the world economic crisis and the emergence of global warming problems, the search for alternative energy sources became necessary. Thanks to the rapid development of technology in these years, countries became interested in EVs as a solution to reducing their dependence on oil and reducing carbon emissions [1].
In the last decade, automotive companies have not been indifferent to the interest in EVs, and have launched hybrid vehicles to overcome the range problem of EVs. With the increasing interest in EVs and the development of battery technology, pure EVs have also started to be produced. However, the energy demand increases day by day because of the intense interest in EVs. According to the International Energy Agency (IEA) 2020 World Energy Outlook Report, while the energy demand of the transportation sector was 51 TWh in 2018, it is expected to be 1551 TWh in 2040. Considering that the demand for electrical energy will increase in other sectors similarly to the transportation sector, it is not sustainable to meet the demand with alternative energy sources. In a statement made in the June 2020 IEA report seeking to ensure the energy supply-–demand balance, the importance of designing more efficient vehicles in the electricity sector was stated [2]. In addition, the global energy crisis nowadays affects the entire transportation sector. This crisis threatens new investment plans in the EV sector with the increase in energy costs. Therefore, in order to expand the interest in EVs, the cost of travel with EVs must be reduced. To reduce energy consumption in EVs, first, it is necessary to design more efficient and improved EV components. In addition, optimized driving algorithms can require less energy consumption. Thus, by increasing the driving efficiency, people can travel longer ranges with a limited energy capacity.
EVs contain several components, such as a motor, a battery, a power electronics driver, a transmission mechanism, and other equipment. Generally, the electrical energy stored in the battery is converted into mechanical energy by the electric motor, and the drive is performed by transferring it to the wheels of the car thanks to the powertrain. The speed and acceleration of the vehicle depend on the traction power, vehicle mass, rolling resistance, aerodynamic drag, hill resistance, and the physical specifications of the vehicle.
Considering the above issues, simulation models, such as equation-based models [3], forward models [4], car-following models [5] and predictive models [6], have been designed for a better understanding of EV dynamics. Besides this, six different drivetrain systems have been presented in Ref [7]. A comparative study showed that among these systems, the single-level geared topology is the most favored drivetrain system for electric motor drives, with a wide speed range and high maximum speed in EVs. Additionally, considering this drivetrain system, the requirements of customers and the motor characteristics of EVs are presented in the study. In another study conducted during the years of increased interest in EVs, DC, induction, reluctance and permanent magnet motors, recommended for EVs, were compared. As stated in that study, DC motors, which initially attracted great attention due to their ease of driving, have been replaced by AC motors, thanks to the development of motor drivers and effective control methods [8]. Additionally, the advantages of DC motors, brushless DC (BLDC) motors, permanent magnet synchronous motors (PMSMs), line-start PMSMs, induction motors (IM), and switched reluctance motors (SRM) have been investigated. It was reported that the motors including magnets are highly efficient, and their performances are more suitable for EVs [9,10,11].
On the other hand, inner- and outer-rotor-type motors have been used, depending on the transmission topology. While inner-rotor electrical motors are used in topologies such as fossil fuel vehicle designs, outer-rotor electrical motors are preferred in in-wheel designs. In a study in which an outer-rotor permanent magnet motor was designed and tested for EVs, it was emphasized that this motor was highly efficient, and more suitable for EVs [12].
Another important component studied in EVs is the battery, which is the energy source required for movement. EVs, in contrast to fossil fuel vehicles, can convert the mechanical energy into electrical energy and store it in their batteries for reuse. The mechanism by which energy recovery takes place is called regenerative braking, and regenerative compression stabilizes the drive. These involve controlling the electrical motor in the generator region during compression or braking mode operation. The bidirectional flow of electrical energy has great significance for energy management in EVs. In recent studies, highly efficient energy management systems using regenerative braking have been used [13,14]. In such studies, the maximization of the state of charge (SoC) was investigated [15]. The SoC cannot be measured directly; therefore, it is estimated by many different mathematical methods using some measurable or sensible variables. These methods are classified into four groups. One of these methods uses the direct measurement of the battery voltage and its impedance. Another is the bookkeeping estimation method, which calculates the SoC by integrating the discharging current. The other is an adaptive system based on the neural network. The most commonly used one is a hybrid of these methods, which, when compared to the others, gives more accurate results, as presented in [16].
For validating the results obtained by the simulations, there are many methods of testing the vehicle components. The V-models used for the developing and testing of vehicles in the automotive industry are as follows, listed from low to high in terms of accuracy; Model-in-the-Loop (MIL), Software-in-the-Loop (SIL), Hardware-in-the-Loop (HIL), and Vehicle-in-the-Loop (VIL). In general, it is acceptable to complete the MIL-SIL-HIL test processes in the development of the vehicles [17]. In the literature, there are some studies employing these methods on fossil fuel vehicles, considering the car driver’s behavior, road slope, and load factor and road type [18,19]. In addition, all of the EVs’ components have been analyzed in detail, since EVs are used in wide speed ranges, variable temperatures, different road conditions, and with different driving characteristics [20,21,22,23,24,25,26]. In [27], motor, battery, and energy management systems are investigated using the HIL method to derive more information with high accuracy in relation to the vehicle’s dynamics with real components.
Nowadays, there is an increasing interest in EVs. There are many new components, both mechanical and electrical, in an EV, and each of them should be examined separately and tested under real road conditions with minimal assumptions. However, in the engineering education given in many universities, application laboratories have not yet been developed with this ability. For this reason, only theoretical educational support is offered to students. The experiential learning theory, an innovative approach, was presented by Kolb in 1984. According to Kolb, this learning style includes experience, perception, cognition and behavior. First, in concrete learning, the student encounters a new experience or reinterprets an existing experience. Then, in reflective observation, the learner personally reflects on his/her experience. After this, the learner reaches the abstract conceptualization stage by forming new ideas or modifying existing abstract ideas based on their reflections. Finally, in the active experimentation stage, the student applies the new ideas to see if there are any changes in the next experience. In this study, an EV test system was designed to provide the convergence of the learning cycle for students who have completed the previous stages. With this test setup, students can observe the practical uses of the theoretical knowledge they have acquired about EVs.
It is difficult to understand vehicle dynamics by performing separate tests on the components of EVs. Unfortunately, testing all the components in a real environment is unsafe and involves high costs. Therefore, a test setup should be designed to observe the effects of all parameters under real-world driving conditions. Within the scope of this study, a test setup has been prepared to be used in the laboratory for use by both academicians in their studies and engineering students seeking to obtain learning experience about vehicle dynamics, considering criteria such as cost, safety, portability and flexibility. The test setup consists of a battery, a traction motor, a servomotor, drivers, a user interface, a Programmable Logic Controller (PLC), a PC and sensors. Firstly, maintenance-free, inexpensive, reliable and high-performance 12 V gel batteries, which are frequently used in light EVs, were selected for the energy storage and source. Similarly, a BLDC motor with an outer-rotor structure, as used in many EVs for maintaining high torque, was included in the design. The BLDC motor driver was used to control the speed and torque through a PLC. The servomotor, connected to the same shaft, was used to represent the forces acting on the EV. In addition, a torque sensor was placed on the shaft to observe the torque developing in the traction motor. Thanks to the human–machine interface (HMI) connected to the PLC, the user could change the vehicle parameters, road slope and driving profiles as desired. In addition, it was possible to monitor the status of variables on the HMI screen during the test. After that, when the test was completed, the test data were saved to an external disk or on a computer hard drive. In addition, this device has a flexible structure, and it can be programmed using the available software, such as Python, by making a connection with the PLC and the computer. In this way, it is possible to test complex algorithms on the system, depending on the users’ level of knowledge. Moreover, the test setup was designed modularly so that different motors and their drives could be tested if desired.
In this study, a new test platform for EVs is presented to test both the motor and power electronics components with full integrity under real road conditions. In this way, an application platform suitable for all kinds of research, from the most basic level of knowledge to the most advanced research topics, has been obtained. Testing both expert systems and learning-based control algorithms under real test conditions is possible thanks to this platform. On the other hand, it also allows the testing of regenerative brake-assisted driving cycles to increase the driving range and energy efficiency of EVs. Thus, the energy efficiency between driving with a regenerative brake and driving directly can be easily observed. In this context, there is a need for an EV test system that is suitable for undergraduate student, as well as being low-cost and including basic EV components. For this reason, an EV simulator has been designed with the advantages and innovations mentioned in this study.
2. Components of the EVs
EVs are in many ways similar to vehicles powered by ICEs. The bodies of many EVs in use today are taken from vehicles that previously contained an ICE. However, unlike fossil fuel vehicles, EVs consist of an electric motor, a battery, a vehicle control, a motor driver, an electronic controller and a power electronics converter, as shown in Figure 1.
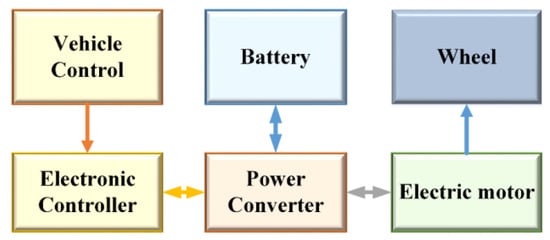
Figure 1.
Components of an EV.
2.1. Motor
Since the electric motor is an electromechanical system that allows the conversion of electrical and mechanical energy, it is responsible for providing the pulling force that moves the vehicle via a connection between the electrical and mechanical systems. In other words, the electric motor converts the electrical energy into mechanical energy, and creates the rotational movement of the wheels through mechanical transmission parts. In addition, when in a braking state, the electric motor works as a generator to provide energy recovery from the wheels to the battery through the electronic power converters.
In the literature, many conventional DC and AC electric machines used in EVs have been designed to provide the necessary power to the wheels. Brushed DC motors, IMs, PMSMs, BLDC motors and SRMs are examples of conventional electrical machines commonly used in EVs. The BLDC motor, one of these electrical machines, is a motor with high torque and high power density that is used especially for light EVs. In this study, the BLDC motor, commonly used in EVs, is used to maintain movement torque in the EV’s setup.
The stator of the BLDC motor consists of concentrated coils spaced 120 degrees apart. The permanent magnets in the rotor are placed one after the other at 180-degree magnetic intervals. Thus, when the motor is rotated, voltage is induced in the rotor windings in the form of a trapezoidal waveform with a phase difference of 120 degrees. A balanced three-phase rectangular current with a conduction period of 120 degrees is required to properly rotate the motor. The electrical equivalent circuit of the BLDC motor is shown in Figure 2. In this model, the rotor and stator winding only excite the spatial sinusoidal voltages and currents. In addition, the magnetic materials are isotropic and there is no saturation.
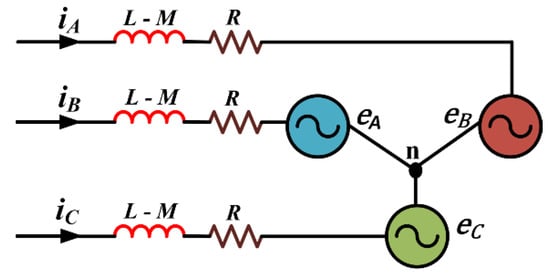
Figure 2.
The equivalent circuit of a BLDC motor.
The corresponding voltage equations are as follows:
where , and are the winding resistance, winding inductance and mutual inductance, respectively. , and , and , and are the voltages and currents of the windings. The values , and are the electromotive force induced in the windings (EMF).
In Equation (4), the total current is zero when the system is balanced.
The converted electrical power is represented as
where is the amplitude of the back EMF waveforms and is the amplitude of the current waveforms.
The torque developed in the electrical motor is calculated as
where is the angular frequency.
2.2. Motor Drive
A non-sinusoidal waveform is required to ensure the smooth motion of the BLDC motor. In addition, in order to produce maximum torque in the constant torque region, there must be a 90-degree difference between the stator and rotor fluxes. A microprocessor-based controller and power converter are required in the BLDC motor driver to generate the control signals. Hall effect sensors are often used to detect the rotor angle for motor control. The signals produced by the sensors are evaluated in the controller, and the desired control signals are produced. A voltage-sourced inverter (VSI) generates three-phase motor voltages, which is the main component of the variable frequency drives. Since the VSI is a device that converts a unidirectional voltage waveform to a bidirectional voltage waveform, the battery used for energy storage in EVs provides a voltage source.
2.3. Battery Systems
Batteries are electrochemical devices in which the electrical energy needed by the EV is stored as chemical energy. There are different types of batteries on the market, with different structures and characteristics. A battery cell consists of positive and negative electrodes, electrolytes, and a separator. The electrolytes allow the charge to flow between the positive and negative electrodes. In most cases, the electrical energy released is the difference between the cohesive or bond energies of metals, oxides, or molecules that undergo an electrochemical reaction.
The batteries that contain the energy used to fuel an EV do not have the same range potential as today’s ICE vehicles. This determines the EV’s range, driving characteristics and charging time. A long-range EV requires large amounts of energy. To provide this energy needed in EVs, the batteries are connected to each other in a serial configuration, a parallel configuration, or a combination. In addition, this is why alternative options are often used, such as flywheels and ultra-capacitors. Today, many types of batteries with different chemical properties are used in EVs. The most used batteries are flooded lead–acid, sealed gel lead–acid-, nickel cadmium- (Ni Cad), nickel metal hydride- (NiMH) or lithium-based. Thus, there is more than one model in the literature, depending on the characteristics of the batteries. The battery model to be used in simulations and experiments is important for the accuracy of the studies. Therefore, it is necessary to use suitable models for the estimation of the charge and health status of the battery. However, the non-linear charge and discharge behavior of the batteries increases the complexity of the calculations. In this study, the simplest electrical equivalent circuit of the battery is used, as shown in Figure 3. Since the parallel internal resistance is neglected in this circuit model, the open circuit voltage of the battery remains constant.
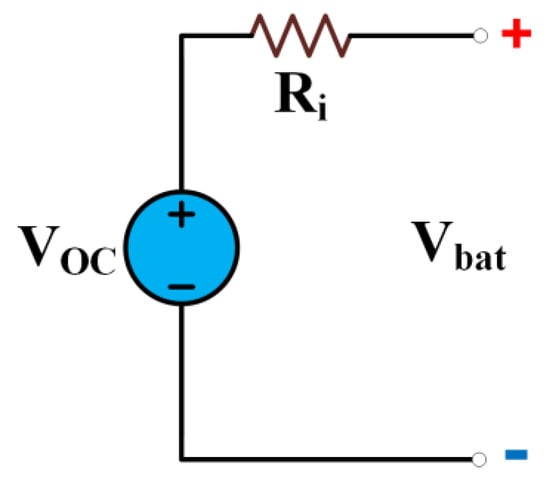
Figure 3.
The simplest electrical equivalent circuit battery used.
In Equation (7), the values , and are the battery’s open circuit voltage, the battery’s current, and the battery’s internal resistance, respectively. Depending on these values, the battery’s voltage is calculated. In addition, the capacity of the batteries is defined as the number of ampere–hours (Ah) consumed when the terminal voltage in the fully charged state decreases to the cut-off voltage value during the discharge, and it is shown on their labels. Since the value changes at different discharge rates, battery manufacturers usually specify the ampere–hour values on their labels together with the current rates. Another important parameter of the battery, the , is defined as the ratio of the remaining capacity to the full capacity. A fully charged battery’s SoC is accepted as 100%, and a fully discharged battery’s is 0%. The change in in the time interval during discharging or charging and the ampere–hour capacity () is expressed as follows.
i is positive in discharge and negative in charge. The of the battery is expressed below, while the initial value is .
(i, ) is the battery’s terminal voltage, which is a function of the battery’s current and . The electrical energy taken from the battery is expressed by Equation (10).
2.4. Vehicle Dynamics and Controller
Mathematical knowledge based on the general principles of mechanics is required to describe a vehicles’ behavior. According to Newton’s second law, the change in the momentum of an object is in a set ratio with the propulsion force applied to the object. The change in motion is directly proportional to the net force moving the object, and this force is given in the same direction as the movement. The forces acting on the vehicle, such as rolling friction force, aerodynamic friction force, hill resistance force and acceleration force, are depicted in Figure 4.
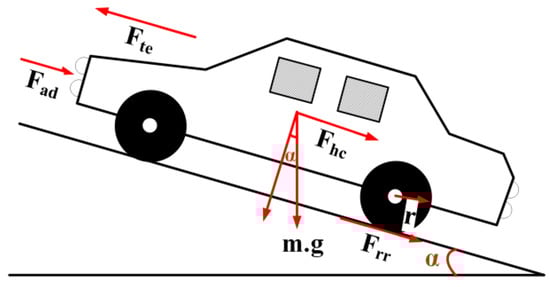
Figure 4.
A representation of all the dynamic forces acting on the vehicle.
The rolling friction force () acts in the opposite direction to the movement at the point where the vehicle’s wheels touch the ground. Equation (11) gives the corresponding .
where, is the coefficient of the rolling friction, m is the mass of the vehicle (kg) and g is the acceleration due to gravity (m/s2). Depending on the vehicle speed, the aerodynamic friction force () manifests in the opposite direction to the vehicle’s motion, and is caused by the air. Vehicle designers consider this parameter should be low to achieve higher energy efficiency. is expressed below as depending on the vehicle dynamics and environment conditions.
where ρ is the density of the air (kg/m3), is the front surface area of the vehicle (m2), is the friction coefficient of the air, and (m/s) is the straight speed of the EV.
On sloped roads, depending on the mass of the vehicle () and the road slope angle (α), uphill resistance force () occurs in the opposite direction to the movement, as given in Equation (13). The acceleration force () is formed due to the acceleration of the vehicle (), which is the ratio of the speed change value () in the acceleration and deceleration states of the vehicle and the average time value at which this speed change occurs, as follows.
The net force acting on the vehicle is equal to the sum of all forces. The power that is required to move the vehicle depends on the net force and the velocity in the direction of this force. In addition, the moment (necessary torque) is defined as a product of the force and the moment arm. The net force (), the power () and the moment () are expressed as follows:
All of the above equations describing the behavior characteristics of the vehicle in relation to the components of the EV are used for analytical calculations via the software in the test platform, and all kinds of calculations can be obtained and reported with this software. The developed software has open source codes for advanced research, so that researchers can easily employ the desired algorithms and make many adjustments to the setup using a computer connected to the platform or embedded in an HMI. Furthermore, this platform is available for many types of EVs of different sizes, and the variable dynamics can be easily updated in the system’s software. This platform has high-speed computing power, servo-driving support, and independent speed–torque meters, as well. In this respect, a completely innovative test platform for practical education and advanced researches is presented in this study.
3. Designing of the Test Setup
In specialized fields, educators want their students to not only learn or memorize the theory, but also learn how to use their theoretical knowledge in practice. An applied course is indispensable for consolidating the theoretical knowledge and achieving more learning that is permanent. A test setup can provide undergraduate students with an important learning experience. For this reason, there is a need for test systems that will prepare the student for the future, and make the subject clear and understandable. In this study, considering the EV components, an experimental test setup is designed and implemented in accordance with an engineering education curriculum.
The proposed test setup consisted of a battery group including the management system, BLDC motor, BLDC motor driver, servo motor, servo motor driver, energy analyzer, torque sensor, PLC, and HMI, together with all the communication hardware and protocols. The devices included in the test setup and their intended uses are briefly shown in Table 1. An industrial HMI is preferred for operating the system, making settings, observing, and recording the data obtained. Firstly, the test was conducted by selecting the EV parameters, the desired references and the type of the driving cycle. Then, while the PLC unit was sending the speed reference data to the BLDC driver, it was also sending the torque data to the servo motor driver, depending on the driving profile and the physical characteristics of the vehicle. Thus, power transfer occurred between the BLDC motor and servo motor coupled on the same shaft. Thanks to the bidirectional BLDC motor driver, the BLDC machine worked as both a motor and a generator. When the BLDC machine works as a motor, energy flows from the batteries to the motor. On the contrary, when it works as a generator, the energy recovered by the wheels is stored in the batteries. In our system, six serially connected 12 V-60 Ah batteries were as the energy source, as per laboratory conditions. An HIOKI PW3390 model power analyzer was included in the system for monitoring and recording all data obtained from the current and torque sensors. On the other hand, the whole system can be managed and motorized through a computer, and was observable for the analysis of the results. Moreover, due to its flexible features, we could incorporate different driving profiles, different motor types and complex algorithms. The general scheme of the system is given in Figure 5a.

Table 1.
Devices and their functions in the test setup.

Figure 5.
Test setup: (a) the principle scheme; (b) implemented design.
The servo system applying the forces acting on the EVs is fed by a three-phase AC network. When the BLDC machine functions as a motor, the servo motor works as a generator, and the produced energy is converted into heat energy due to the braking load resistor that protects the servo driver. All system components were combined on a set. This is shown in Figure 5b.
To control the test system and observe the data, the training–control interface is illustrated on the touch panel. Through the parameter input menu shown in Figure 6a, students can set the vehicle’s parameters, the driving cycles and the regenerative braking mode.
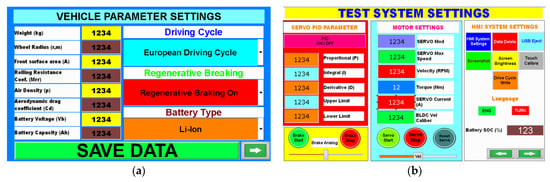
Figure 6.
HMI pages: (a) vehicle parameters and driving cycle settings; (b) servo system and system control settings.
Figure 6b shows the expert menu of the test system wherein the servo system and interface settings are changed. In this page, the servo motor can be adjusted independently in the torque and speed modes. The servo control button can also use the training test setup as a manual motor test unit. In addition, the PID parameters can be updated on this page to avoid torque fluctuations of the servo system and to ensure torque accuracy in accordance with the torque reference.
As shown in Figure 7a, it can be seen that after the necessary data are applied, automatic driving is started, and the system data can be displayed on the data view page. Reference torque-speed and instantaneous torque-speed characteristics can be observed via this page during automatic operation, and the obtained data are saved to the Universal Serial Bus (USB) memory at the end of the driving cycle. In addition, a graph of these recorded data can be viewed instantaneously through the HMI page shown in Figure 7b.
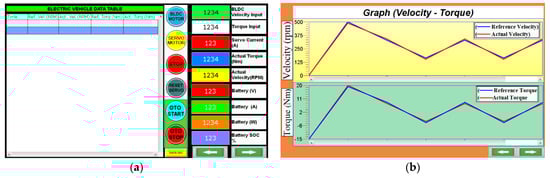
Figure 7.
Data monitoring on the HMI: (a) homepage; (b) speed–torque graph page.
The braking system’s working principle is shown in Figure 8. Firstly, the vehicle and road parameters are entered using the HMI. Then, the driving is started and the required torque is calculated. If the torque demand is negative, it can be checked whether the regenerative mode is active. If the regenerative operation mode is active and the < 90%, the regeneration coefficient is calculated and the brake distribution is performed according to this coefficient. If the regenerative operating mode is passive or < 90%, the regeneration coefficient is considered zero and all braking is done by the mechanical system. In addition, if there is no negative torque demand, the reference speed is set and these processes continue until the driving cycle is finished.
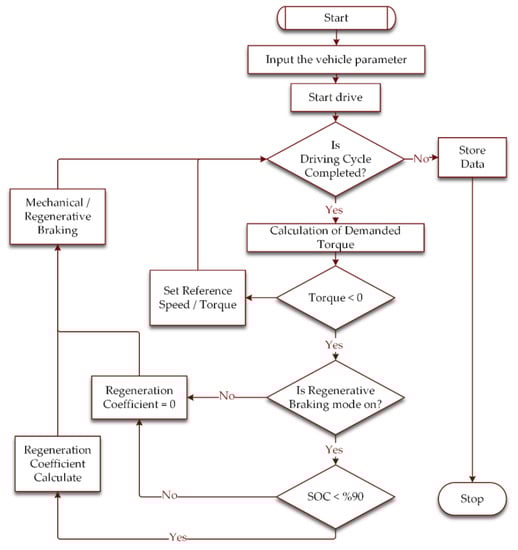
Figure 8.
Flow chart control diagram for regenerative breaking operation.
4. Experimental Studies and Discussion
In this study, several experimental case studies have been composed to show the effects of light EV parameters, and different road slope and energy recovery parameters, on operation of an EV. In addition, EV parameters related to the design are selected by considering the constraints in the experimental set. The vehicle parameters and their values under the test conditions are given in Table 2.
Table 2.
Vehicle parameters used in the case studies.
Many driving cycles or profiles have been created by different countries to test vehicles. One of these profiles is the New European Driving Cycle (NEDC), which is widely used in Europe. Here, the NEDC, consisting of the urban driving cycle (ECE-15) and the extra-urban driving cycle (EUDC), is used for the approval of light vehicles. In the ECE15 driving cycle used for the urban test, the average speed is defined as 18.7 km/h, the maximum speed is 50 km/h and the driving distance is 4 km, and it is completed in approximately 193 s. The vehicle’s speed in the ECE-15 is converted to rotational velocity depending on the wheel radius. According to the vehicle’s parameters, shown in Table 2, the forces acting on the EV according to the ECE 15 speed profile are calculated based on the EV dynamic equations, and the required torque values are determined. Figure 9 shows the speed and required torque references of the EV on a straight road for the ECE-15 profile.
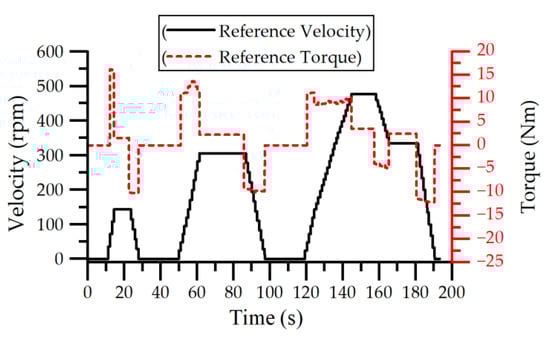
Figure 9.
ECE R15 driving cycle and torque demand.
4.1. Case Studies
The short driving range is one of the most important problems of EVs. To overcome this problem, optimal energy use is necessary. In addition, the availability of energy recovery in EVs requires the most effective management of energy. The most effective parameters for energy consumption in EVs are the physical specifications of the vehicle, the slope of the road and the speed of the vehicle. For students to understand the effects of these parameters more easily, five different experiments have been set up. The parameters to be applied for these cases are given in Table 3.
Table 3.
The specification of the case studies.
The students participating in the research can easily perform the experiments via the steps given in Table 4. Thus, students obtain experimental data according to the desired parameters.
Table 4.
The steps of the experimental process.
ECE-15 is preferred as a driving profile for the speed reference in all experimental studies. The reference speed data are divided into three regions to determine the dynamic behavior of the vehicle. Firstly, the acceleration regions of the EV are labeled 2, 6 and 10. Secondly, the regions wherein the vehicle moves at a constant speed are defined as parts 3, 7, 11 and 13. Lastly, the vehicle slows down in regions of 4, 8, 12 and 14. As shown in Figure 10, the BLDC machine’s speed is very close to the reference throughout all experiments. The differences due to driving conditions are too small to be considered. Therefore, only one velocity graph from the experiment is shown in Figure 10. Afterward, the students are asked to compare and evaluate the data from the experiment, such as calculated torque, real torque, instantaneous power, and energy parameters.
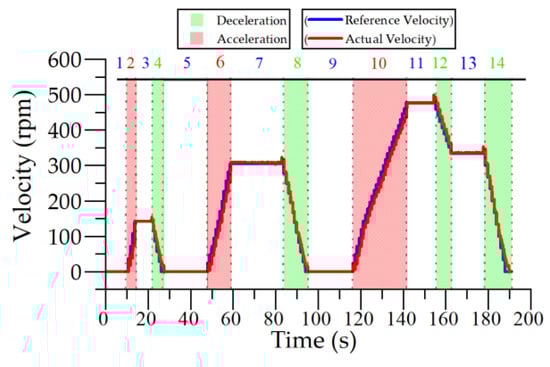
Figure 10.
Experimental results of the speed chart and the numbers of regions.
4.2. Case Study 1
In case study 1, using the ECE-15 driving profile, our aim is to compare the energy changes and torque demands of the EV during speed changes and when in motion at a constant speed on a flat road without regenerative breaking.
The test graphs are given in Figure 11, and the observed results of this experiment are evaluated as follows:
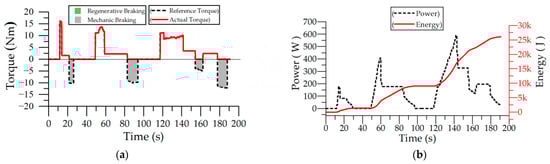
Figure 11.
Flat road driving test: (a) torque graph; (b) power and energy graph.
- The total energy consumption is 26,076 Joules;
- Toque demand and energy demand are directly proportional;
- The torque demand regions, from the largest to the smallest, are acceleration, constant speed, and deceleration. In the deceleration regions, the motor torque is zero;
- In the constant speed regions, the higher the speed, the bigger the torque demand;
- Although energy consumption occurs during acceleration and constant-speed motion, no energy is consumed in the deceleration region;
- In regions where the reference torque is negative, only mechanical braking is applied.
4.3. Case Study 2
In the second case study, unlike the first case study, our aim is to observe the effects of energy recovery by performing regenerative braking.
The test graphs are given in Figure 12 and the observed results from this experiment are as follows:
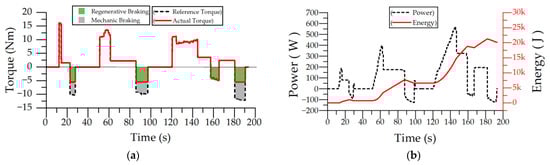
Figure 12.
Flat road driving test with regenerative breaking: (a) torque graph; (b) power and energy graph.
- The total energy consumption is 20,319 Joules. However, 2883 Joules was recovered thanks to the regenerative braking;
- The torque demand regions, from the largest to the smallest, are acceleration, constant speed, and deceleration. In the deceleration regions, the motor torque is negative;
- While energy is consumed during acceleration and constant-speed motion, energy is recovered in the deceleration regions;
- While the maximum possible energy recovery is realized, mechanical braking is also applied to adhere to the reference speed;
- A decrease is observed in the energy consumption graph in the deceleration regions where energy recovery occurred;
- In the regions showing energy recovery, the power is negative. In other words, the energy flows from the electric motor to the battery.
4.4. Case Study 3
Case study 3 aims to observe the effects of the forces acting on the EV under inclined road conditions. To make this parameter more understandable, two different experiments are designed to represent uphill and downhill. In this study, a road with a constant positive slope is tested.
The test graphs are given in Figure 13 and the observed results from this experiment are as follows:
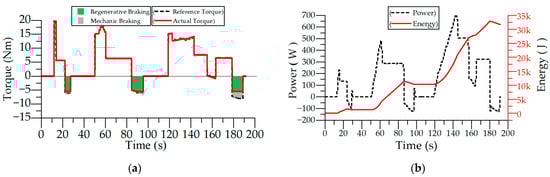
Figure 13.
Uphill road driving test with regenerative breaking: (a) torque graph; (b) power and energy graph.
- The total energy consumption is 31,758 Joules, although energy recovery occurs. However, the energy recovery here is lower compared to case study 2, but it is 2580 J;
- On an uphill road, the vehicle requires more torque than on a flat road. Conversely, less mechanical braking is required to decelerate.
4.5. Case Study 4
For this test experiment, case study 4, in contrast to case study 3, downhill road driving is performed.
The test graphs are given in Figure 14, and the results from this experiment are as follows:
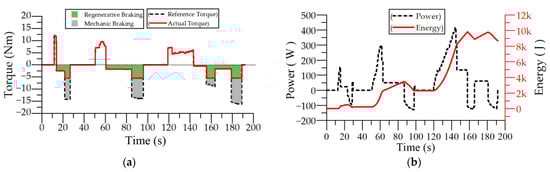
Figure 14.
Downhill road driving test with regenerative breaking: (a) torque graph; (b) power and energy graph.
- There is a very big decrease in the total energy consumed by the vehicle on the downhill road, and the total energy is 8758 Joules. In addition, 3532 Joules is produced as energy recycling and mechanical braking are mostly used;
- On a downhill road, the vehicle needs less torque than on a flat road. Conversely, more mechanical braking is required for deceleration.
- A high level of energy recycling has been achieved as well. However, the amount of energy lost in mechanical braking is greater.
4.6. Case Study 5
Another parameter that affects the energy requirements in EVs is the weight of the vehicle. In this experiment, it is assumed that the other characteristics of the vehicle do not change, and 50 kg of load is added to the mass of the vehicle.
The test graphs are given in Figure 15, and the results of this experiment are as follows:
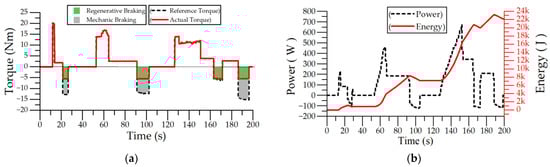
Figure 15.
Flat road driving test with regenerative breaking and 50 kg load: (a) torque graph; (b) power and energy graph.
- The total energy consumption is 22,966 Joules. The amount of energy recovered is 2496 Joules;
- Compared to experiment 2, more toque is demanded at the times of both acceleration and deceleration.
4.7. Experimental Result and Discussion
In EV systems, the regenerative braking system can recover kinetic energy and potential energy to the battery through an electric machine. The main factors influencing the regenerative braking control of EVs are road slope and vehicle weight. The net force acting on the vehicle is shown in Equation (15). Since the aerodynamic properties and speed of the vehicle are similar in all experiments, the aerodynamic friction force does not change. On the other hand, depending on the slope of the road, the uphill resistance force acting on the vehicle varies between negative and positive values. According to Equation (13), the net force acting on the vehicle increases as the vehicle moves uphill. Likewise, the net force acting on the vehicle decreases as the vehicle moves downhill.
In this study, five case studies have been carried out under varying load, road slope and regenerative braking conditions. The results are shown in Table 5. Firstly, the no-load condition was tested on a flat road without regenerative braking. As a result of the experiment, the total energy was 26,076 J, and the maximum power demand was 590 W. Unlike in the first case, energy recovery was achieved with regenerative braking. Thus, an approximately 22% gain was achieved thanks to regenerative braking. On the other hand, unlike case study 2, the road slope was changed. When the road slope was increased by 3%, the total energy increased by 56%, while the amount of energy recovery decreased by 10%. Conversely, when the road slope was reduced by 3%, the total energy was reduced by 56% and the recovered energy increased by 22%. On the other hand, the fifth case involved adding a load of 50 kg to the conditions of case 2 to observe the effects of the load. As a result of the 25% load increase, there was a 13% increase in total energy. The difference in energy recovered between each state is small because of the motor driver’s limited energy recovery. As a result, the experimental results support the EV’s dynamic equations.
Table 5.
Experimental results of case studies.
Many case studies performed on this test platform, which was developed to improve engineering education, are presented in a separate section, and the results obtained for each study case are re-evaluated. Vehicle weight, load conditions, road conditions, different driving cycles, useful braking or direct driving situations were examined separately, and the findings are presented under the relevant case study. In particular, the effect of regenerative braking on energy consumption was emphasized for different driving cycles.
5. Evaluation of the Test System
The proposed test system focused on simplifying engineering education via the practical testing of an EV’s components, especially for undergraduate students who participate in EV races conducted by the Scientific and Technical Research Council of Turkey (TUBITAK) and for graduate students working on motor design and power electronics. Due to the innovative approach, a questionnaire was completed at the end of the training to determine the views of the students participating in the training, what components should be improved in the testing system, and to what extent the initial goals were achieved. This evaluation study aims to answer many questions about the attitudes of the participating students towards the applied method using a new test system, and to compare them with those towards their theoretical education. The survey was conducted with three groups, and each group consisted of 10 students. The survey questions are given in Table 6.
Table 6.
Questions of the survey.
Questionnaires using a 5-point Likert scale are the most common type of instrument for measuring. The answers to the questions are rated from the lowest level of strongly disagree (1) to the highest level of strongly agree (5). The cumulative results of the survey are given in Table 7. The students who participated in the survey think thought the test system was easily useable and more understandable. In addition, students stated that they learned and comprehended the components, parameters and dynamics of an EV under different case studies, including those with regenerative operation as well.
Table 7.
Cumulative results of the students’ survey.
Comparative statistics were obtained by applying a t-test and ANOVA in the SPSS program, as shown in Table 8. The study sample included participants who were graduate and undergraduate students at Pamukkale University. Comparisons were made by sex, education level, department (Mechanical Engineering, Electrical and Electronics Engineering, Automotive Engineering) and age (19 to 30). The analysis shows that there was a significant difference by sex. The results show that males scored higher than females. The findings in this study are similar in relation to education level, as graduate students had better scores than undergraduate students. As regards the departments of the students, the Electrical and Electronics department achieved a higher score than the others. Finally, no significant difference was found according to the ages of the students.
Table 8.
Scores of students’ survey.
This study was based on a nationally representative sample of students at Pamukkale University. The results provide a comprehensive view of the benefits of hands-on training. In this way, it shows that it is an application platform that is suitable for all levels of knowledge.
Learning Outcomes of the Experimental Tests
The case studies offered the following benefits to the students:
- Knows the components and parameters of the EVs;
- Knows the forces acting on the EVs;
- Learns the operation principles of the EVs;
- Learns the relationship between speed, torque, power and energy;
- Learns about energy recovery from regenerative breaking;
- Observes how energy recycling is realized;
- Observes the effect of road types on torque, energy, and power;
- Observes the effect of the load on torque, energy, and power.
6. Conclusions
A test platform for the EVs has been designed and implemented for undergraduate and graduate students of the Faculty of Engineering in this study. The proposed experimental test setup reveals that the whole system’s dynamics can be safely explained to student in practice by following the desired driving cycle road conditions and vehicle parameters, while the designed set emulates the operation of a real EV for each configuration. In this context, firstly, practical knowledge of EV components was presented, and five case studies were designed to observe the impacts of EV weight and road slope parameters on energy recovery. Finally, a survey was conducted with the students who completed the case studies, and their answers are included in the paper.
The energy recovery cases focused on comparing three main variables: the effect of the slope, the effect of energy recovery, and the effect of vehicle weight. The experimental results show that the energy consumption is reduced by 22% in cases of energy recovery on a straight road. On the other hand, when considering uphill and downhill cases, it can be concluded that a 3% road gradient has about a 56% impact on the total energy consumption in the regenerative mode. In contrast, if the total weight of the vehicle increases by 25%, there is an increase of approximately 13%. Considering the forces acting on the EV, the theoretical knowledge supports the experimental results.
On the other hand, the results of the surveys conducted with the students who completed the case studies are discussed. Students’ feedback shows that they believed that the comprehensive teaching method, which combines the basic concepts of theoretical knowledge with hands-on education, can help them better comprehend any EV system and develop their professional knowledge and skills. Considering the development of EV systems, the test platform can be updated to perform advanced experiments. From this, we can develop a philosophy of design that will enable us to learn not only with the basic systems discussed within this training, but also with the unusual and special requirements that continue to arise as student education becomes more sophisticated.
Since the test system can be controlled by software using a computer, many algorithms and driving techniques can be included. In future studies on EVs, artificial intelligence and machine learning algorithms will be applied on the test system presented in this manuscript.
Author Contributions
Conceptualization, S.K. and O.B.; methodology, S.K.; software, O.B.; validation, M.T.; data curation, O.B.; writing—original draft preparation, M.T.; writing—review and editing, S.K.; visualization, M.T.; supervision, S.K. All authors have read and agreed to the published version of the manuscript.
Funding
This research was funded by Pamukkale University Scientific Research Projects Coordination Office with project number 2020FEBE044.
Institutional Review Board Statement
Not applicable.
Informed Consent Statement
Not applicable.
Data Availability Statement
Not applicable.
Conflicts of Interest
The authors declare no conflict of interest.
References
- Chan, C.C. The State of the Art of Electric, Hybrid, and Fuel Cell Vehicles. Proc. IEEE 2007, 95, 704–718. [Google Scholar] [CrossRef]
- IEA. World Energy Outlook 2020–Analysis; IEA: Paris, France, 2020. [Google Scholar]
- Adegbohun, F.; Von Jouanne, A.; Phillips, B.; Agamloh, E.; Yokochi, A. High performance electric vehicle powertrain modeling, simulation and validation. Energies 2021, 14, 1493. [Google Scholar] [CrossRef]
- Miri, I.; Fotouhi, A.; Ewin, N. Electric vehicle energy consumption modelling and estimation—A case study. Int. J. Energy Res. 2021, 45, 501–520. [Google Scholar] [CrossRef]
- Xu, Y.; Zheng, Y.; Yang, Y. On the movement simulations of electric vehicles: A behavioral model-based approach. Appl. Energy 2021, 283, 116356. [Google Scholar] [CrossRef]
- López, F.C.; Fernández, R.Á. Predictive model for energy consumption of battery electric vehicle with consideration of self-uncertainty route factors. J. Clean. Prod. 2020, 276, 124188. [Google Scholar] [CrossRef]
- Xue, X.D.; Cheng, K.W.E.; Cheung, N.C. Selection of Electric Motor Drives for Electric Vehicles. In Proceedings of the 2008 Australasian Universities Power Engineering Conference, Sydney, Australia, 14–17 December 2008; pp. 1–6. [Google Scholar]
- West, J.G.W. DC, Induction, Reluctance and PM Motors for Electric Vehicles. Power Eng. J. 1994, 8, 77–88. [Google Scholar] [CrossRef]
- Chau, K.T.; Li, W. Overview of Electric Machines for Electric and Hybrid Vehicles. Int. J. Veh. Des. 2014, 64, 46. [Google Scholar] [CrossRef]
- Zhu, Z.Q.; Howe, D. Electrical Machines and Drives for Electric, Hybrid, and Fuel Cell Vehicles. Proc. IEEE 2007, 95, 746–765. [Google Scholar] [CrossRef]
- Kim, M.K.; Jang, K.Y.; Choo, B.H.; Lee, J.B.; Suh, B.S.; Kim, T.H. A Novel IGBT Inverter Module for Low-Power Drive Applications. PESC Rec.-IEEE Annu. Power Electron. Spec. Conf. 2002, 2, 642–647. [Google Scholar] [CrossRef]
- Chung, S.U.; Moon, S.H.; Kim, D.J.; Kim, J.M. Development of a 20-Pole-24-Slot SPMSM with Consequent Pole Rotor for in-Wheel Direct Drive. IEEE Trans. Ind. Electron. 2016, 63, 302–309. [Google Scholar] [CrossRef]
- Tie, S.F.; Tan, C.W. A Review of Energy Sources and Energy Management System in Electric Vehicles. Renew. Sustain. Energy Rev. 2013, 20, 82–102. [Google Scholar] [CrossRef]
- Li, Z.; Khajepour, A.; Song, J. A Comprehensive Review of the Key Technologies for Pure Electric Vehicles. Energy 2019, 182, 824–839. [Google Scholar] [CrossRef]
- Demircali, A.; Koroglu, S. Jaya Algorithm-Based Energy Management System for Battery- and Ultracapacitor-Powered Ultralight Electric Vehicle. Int. J. Energy Res. 2020, 44, 4977–4985. [Google Scholar] [CrossRef]
- Chang, W.-Y. The State of Charge Estimating Methods for Battery: A Review. ISRN Appl. Math. 2013, 2013, 953792. [Google Scholar] [CrossRef]
- Nibert, J.; Herniter, M.E.; Chambers, Z. EVS26 International Battery, Hybrid and Fuel Cell Electric Vehicle Symposium Model-Based System Design for MIL, SIL, and HIL. World Electr. Veh. J. 2012, 5, 1121–1130. [Google Scholar] [CrossRef]
- Rosero, F.; Fonseca, N.; López, J.M.; Casanova, J. Effects of Passenger Load, Road Grade, and Congestion Level on Real-World Fuel Consumption and Emissions from Compressed Natural Gas and Diesel Urban Buses. Appl. Energy 2021, 282, 116195. [Google Scholar] [CrossRef]
- Carrese, S.; Gemma, A.; la Spada, S. Impacts of Driving Behaviours, Slope and Vehicle Load Factor on Bus Fuel Consumption and Emissions: A Real Case Study in the City of Rome. Procedia Soc. Behav. Sci. 2013, 87, 211–221. [Google Scholar] [CrossRef]
- Oh, S.C. Evaluation of Motor Characteristics for Hybrid Electric Vehicles Using the Hardware-in-the-Loop Concept. IEEE Trans. Veh. Technol. 2005, 54, 817–824. [Google Scholar] [CrossRef]
- Zhu, Y.; Hu, H.; Xu, G.; Zhao, Z. Hardware-in-the-Loop Simulation of Pure Electric Vehicle Control System. In Proceedings of the Proceedings-2009 International Asia Conference on Informatics in Control, Automation, and Robotics, CAR 2009, Bangkok, Thailand, 1–2 February 2009. [Google Scholar]
- Ciceo, S.; Mollet, Y.; Sarrazin, M.; van der Auweraer, H.; Marţiș, C. Model-Based Design and Testing for the Energy Consumption Analysis of the Electric Vehicles. EEA-Electroteh. Electron. Autom. 2016, 64, 46. [Google Scholar]
- Fajri, P.; Prabhala, V.A.K.; Ferdowsi, M. Emulating On-Road Operating Conditions for Electric-Drive Propulsion Systems. IEEE Trans. Energy Convers. 2016, 31, 1–11. [Google Scholar] [CrossRef]
- Sharma, A.; Nusrat, R.; Bhuiya, M.A.; Youssef, M.Z. Hardware-in-the-Loop Validation of Different Power Train Topologies’ Models in Electric Vehicles: A Plug-and-Play Capability. IEEE Open J. Veh. Technol. 2021, 2, 365–376. [Google Scholar] [CrossRef]
- Song, C.; Xiao, F.; Peng, S. Implementation of Electric Vehicle Hardware-in-the-Loop Test Platform. Int. J. Multimed. Ubiquitous Eng. 2016, 11, 147–158. [Google Scholar] [CrossRef]
- Mohammed, O.A.; Abed, N.Y. Real-time Simulation of Electric Machine Drives with Hardware-in-the-loop. COMPEL-Int. J. Comput. Math. Electr. Electron. Eng. 2008, 27, 929–938. [Google Scholar] [CrossRef]
- He, H.; Xiong, R.; Zhao, K.; Liu, Z. Energy Management Strategy Research on a Hybrid Power System by Hardware-in-Loop Experiments. Appl. Energy 2013, 112, 1311–1317. [Google Scholar] [CrossRef]


Publisher’s Note: MDPI stays neutral with regard to jurisdictional claims in published maps and institutional affiliations. |
© 2022 by the authors. Licensee MDPI, Basel, Switzerland. This article is an open access article distributed under the terms and conditions of the Creative Commons Attribution (CC BY) license (https://creativecommons.org/licenses/by/4.0/).