1. Introduction
Currently, simulation and virtual environment tools have become more integrated in lighting design and in museums. The perceptual and photometric quality of numerous lighting conditions can be evaluated easily with less time and cost in a controlled digital environment, as compared to conducting them in a real space [
1,
2]. Simulations can provide both a predictive render (qualitative output) for end-user involvement and provide an estimation of lighting properties (quantitative output) during the design process [
3]. Effective outcomes can be obtained from virtual environments without building physical experiment setups. In a previous study, lighting control systems under different lighting conditions were evaluated in virtual reality and user behavior outcomes were efficiently obtained [
4]. The effectiveness of these outputs depends on the accuracy of input, such as the level of geometry detail during modelling, calculation time, material information, location, luminaire data and sky conditions. As for the effectiveness of the simulation engine, ray-tracing was considered to be the most successful [
5,
6].
The use of virtual reality in museum environments has been rapidly gaining popularity for several different applications, ranging from the conservation and restoration of artistic heritage and the support as a story-teller tool for real visits to the replacement of real-life visits with virtual experiences of portions of or the entire museum [
7]. In particular, the latest application seems to be decidedly promising to allow visitors to be brought into the museum from anywhere, and this can be particularly useful to both broaden the diffusion of culture in ordinary periods and not to interrupt it in special periods, such as the current, in which the health emergency due to the virus SARS-CoV-2 does not allow people to move freely. In museums, virtual reality increases access possibility and allows the visitor to reach the museum’s collection and to experience its environment. Artists can present their work, which could not be presented in the physical world, and museums can conserve, backup their collection and communicate it with other museums’ collections through digitalization [
8]. Similarly, Garside et al. discussed that reproducing artefacts and lighting in a virtual environment can help the standardization problem in museum lighting, for example by building a database [
9]. The digitalization of lighting design is studied by creating a database of supposed lighting characteristics of unique exhibition pieces [
10].
Sense of reality, effectiveness, and the accuracy of the graphic representation of virtual environments are, however, still being discussed by information technology experts. Many studies compared the visual experience of real and virtual environments by comparing subjects’ answers/behaviors. Some studies focused on the answers given to certain spatial characteristics, e.g., dimensions, ceiling height [
11], window size [
12] or lighting, and the found virtual environment to be an adequate replacement of the physical environment. A study suggested a genetic algorithm to replace subjective evaluation of lighting with rendered images [
13]. The results of other studies gave promising/questionable [
14,
15,
16] or positive [
17,
18,
19,
20] results for surrogating physical environments with virtual environments in terms of subjective evaluation and behavior. The selection of aspects that are required to evaluate the validity of these environments is another issue to consider [
21]. We unexpectedly found that the presence performance of high realism and high immersion may change according to psychological or physiological aspects [
22]. Inversely, aspects of presence sense changes with the virtual environment [
23].
Lighting, which is a fundamental concern in human perception, satisfies visual quality and reveals artworks in museums. Properly designed lighting systems can maintain the exhibited objects’ visibility, conservation, and aesthetics with high quality, as well as the visitors’ visual sense and the appeal [
24] in the visiting experience. Several studies are available in the literature concerning museums, e.g., the deterioration of artworks due to lighting conditions [
25,
26], the use of daylight [
27,
28], sustainability and energy efficiency [
29,
30,
31], the use of LED technology [
32,
33,
34,
35,
36,
37,
38], impact of lighting systems on visual perception and color quality [
39,
40], and lighting techniques in historic buildings [
41,
42].
In view of these lighting concerns and virtual reality aspects, comparison of quantitative outputs of physical and virtual environments is generally not enough to understand the perceptual quality of lighting [
11]. Perceptual quality of these environments could be enhanced by using advanced numerical data, such as chromaticity and spectral data [
42]. Virtual reality was used to evaluate qualitative effect of complex sunlight patterns [
43]. A study on lighting features in various virtual environments demonstrated that virtual reality is the closest to physical space, in comparison to video and photograph reproductions [
44]. As for the sense of reality in virtual museums, both the museum and lighting factors should be considered together.
The aim of this study was to understand the effectiveness of virtual museum environments by comparing the subjective impressions of groups of visitors with different visual experiences (based on the real-life visits or virtual visits) of the lighting conditions of some rooms in the Natural History Museum of the University of Pisa, which is housed in the Monumental Charterhouse of Calci. The comparison between different visual experiences, with a focus on museum lighting using non-immersive virtual environments that are more accessible in the current practice of museum lighting, is significant. The impact of spatial and lighting characteristics (nature of exhibits, dimensions of rooms, size of windows, color and distribution of light) on the answers to a specific questionnaire was analyzed.
2. Materials and Methods
This section provides information on the questionnaire and the methods used for the survey, the characteristics of the participants, and the methods used to set and generate the visual data for the research. It includes a physical description of the four exhibition halls used for this research and the results of a field survey in regards to their lighting conditions is provided.
2.1. Location
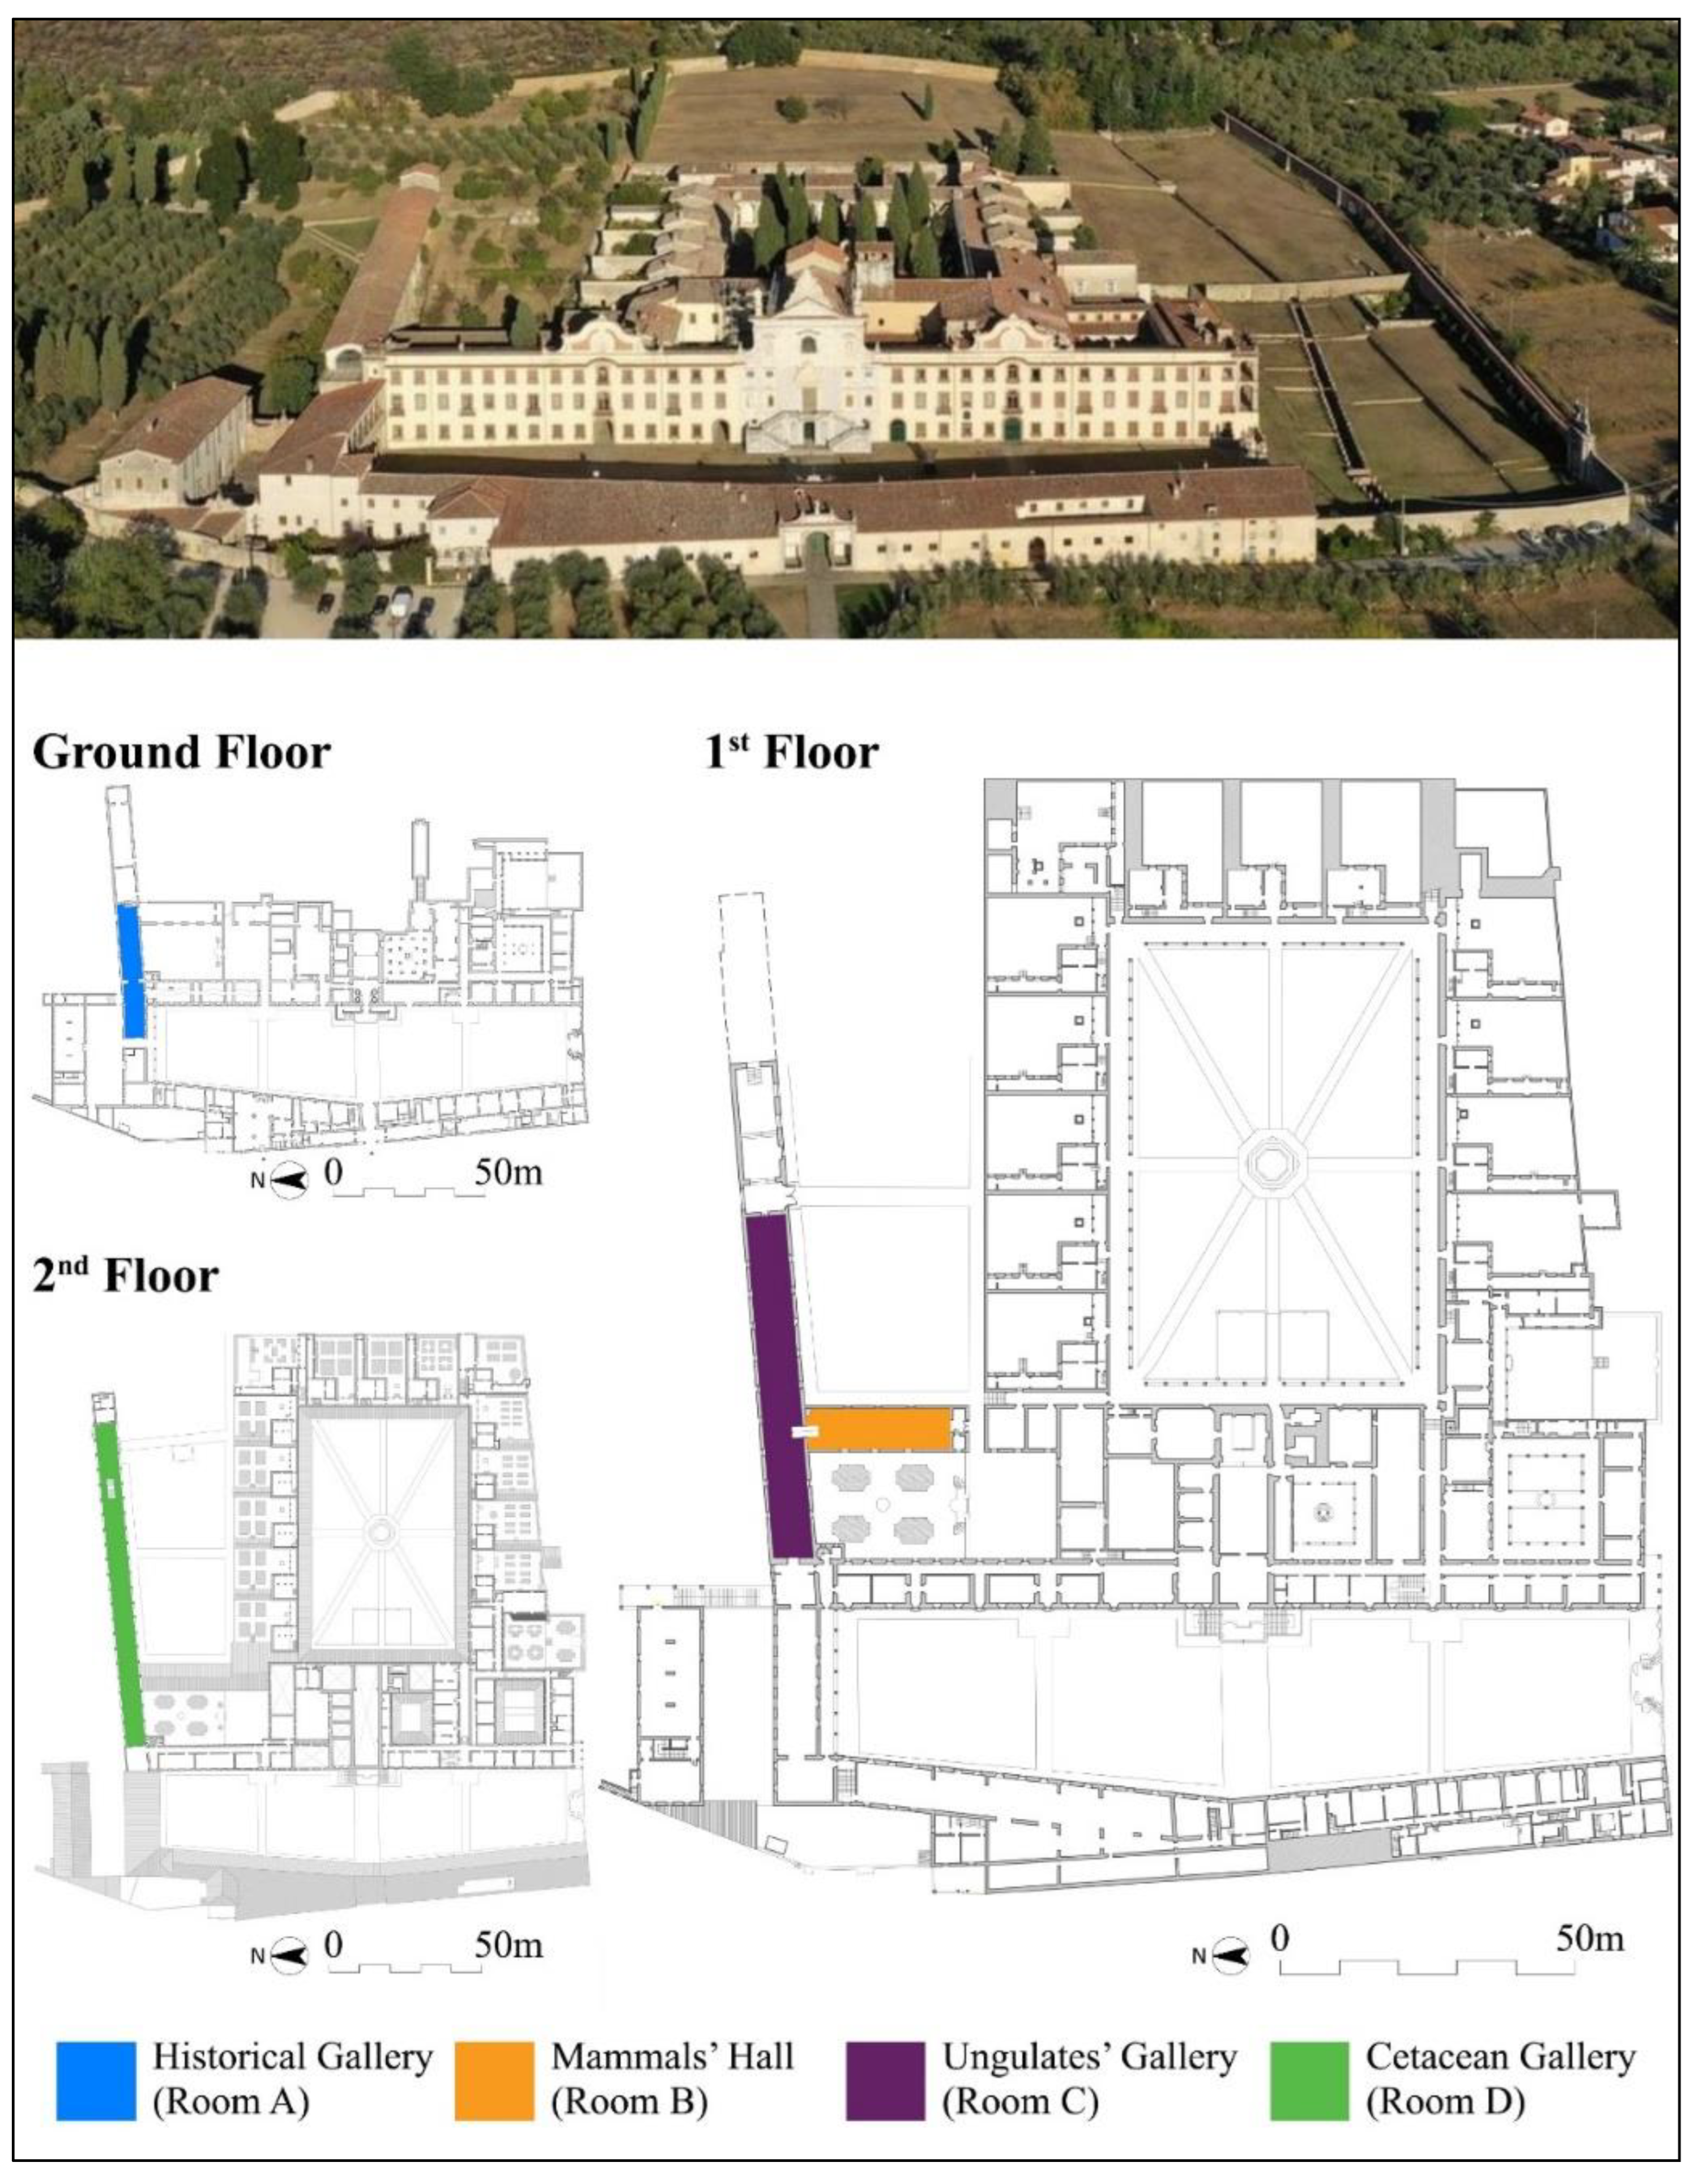
The Natural History Museum of the University of Pisa [
45] and the National Monumental Museum of the Charterhouse are housed in the Charterhouse of Calci, Pisa (43.72 N, 10.52 E), which was formerly a Carthusian monastery (
Figure 1). The Museum was established in approximately the 16th century to gather the collections of the nobility (Natural History Museum of the University of Pisa, 2018). Four exhibition halls of the Museum were selected (
Figure 1).
The Historical Gallery (Room A,
Figure 1) is illuminated with both daylight and artificial light. It is located on the ground floor and exhibits documents, paintings, insect specimens and collections of taxidermies and skeletons in many of the display cases. Mammals’ Hall (Room B,
Figure 1) is only illuminated with artificial light because daylight is completely shielded with curtains. It is located on the first floor, and it exhibits numerous specimens of mammals from around the world. Ungulates’ Gallery (Room C,
Figure 1) is illuminated with both daylight and artificial light. It is dedicated to a specific subgroup of mammals, namely the ungulates. Cetaceans’ Gallery (Room D,
Figure 1) is completely daylit, thanks to a large amount of glazing (567 m
2). It requires no artificial light before the sunset and exhibits collections of cetacean skeletons and whale fossils. Consequently, by ordering the rooms according to the increasing contribution of daylighting, the results are Room B (no daylighting), Room A and Room C (mixed day/artificial lighting), and Room D (dominant daylighting). Further characteristics of the selected exhibition halls (in terms of geometry, sources of light, glazing area and exhibited objects) can be consulted in the
Supplementary Materials (Section S2).
2.2. Field Survey
Illuminance levels were measured inside each exhibition halls to evaluate the adequacy of current lighting conditions according to the standards. The measurements provided data references for the calibration of the simulation model (realized using ArchiCAD and rendered using Relux). Vertical illuminance levels were measured on 2 July 2019, with a luxmeter strapped to the chest of a participant (approximate height: 1.20 m) while he was performing his real-life visiting experience. In
Figure 2, measurement points and directions for every 10 s are shown for Room A.
In the museums, the adequacy of daylight involves both visitors’ visual comfort and the correct exposure conditions for the exhibited objects. When sensitive objects are displayed, the upper limit of illuminance is due more to conservational concerns rather than visitors’ visual comfort. Such a limit depends on the exhibits’ material. Among the four exhibition halls, the maximum illuminance was 50 lx for the most sensitive exhibits, and 200 lx for the less sensitive ones (according to the technical standard CEN/TS 16163, 2014).
Except for Room D, where there are only skeletal specimens, in the other exhibition halls the exhibits are more sensitive because furs, feathers, insect specimens, drawings are mostly displayed, so the illuminance level should not be over 50 lx. For instance, during the measurement activities (2 July, clear sky condition) in Room A, illuminance levels were measured, starting from 14:20, and they always exceeded the upper limit set by the standard (CEN/TS 16163, 2014), with an average of 250 lx. In Room B, illuminance levels were measured, starting from 15:30, and they were adequate for conservation in 22 points out of 23, with an average of 32 lx. In Room C, measurements started from 16:00, and they were below the standard upper limit in 19 points out of 40, with an average of 55 lx. Bones are mostly displayed in Room D, so the illuminance levels should be lower than 200 lx. However, this occurred in 2 points out of 43, with an average of 1320 lx, due to the full-height windows on the north and on the south-oriented façades. The most inadequate exhibition hall, in terms of conservation, is Room D. Standards are achieved in Room B, which is the only exclusively artificially lit exhibition hall.
2.3. Participants
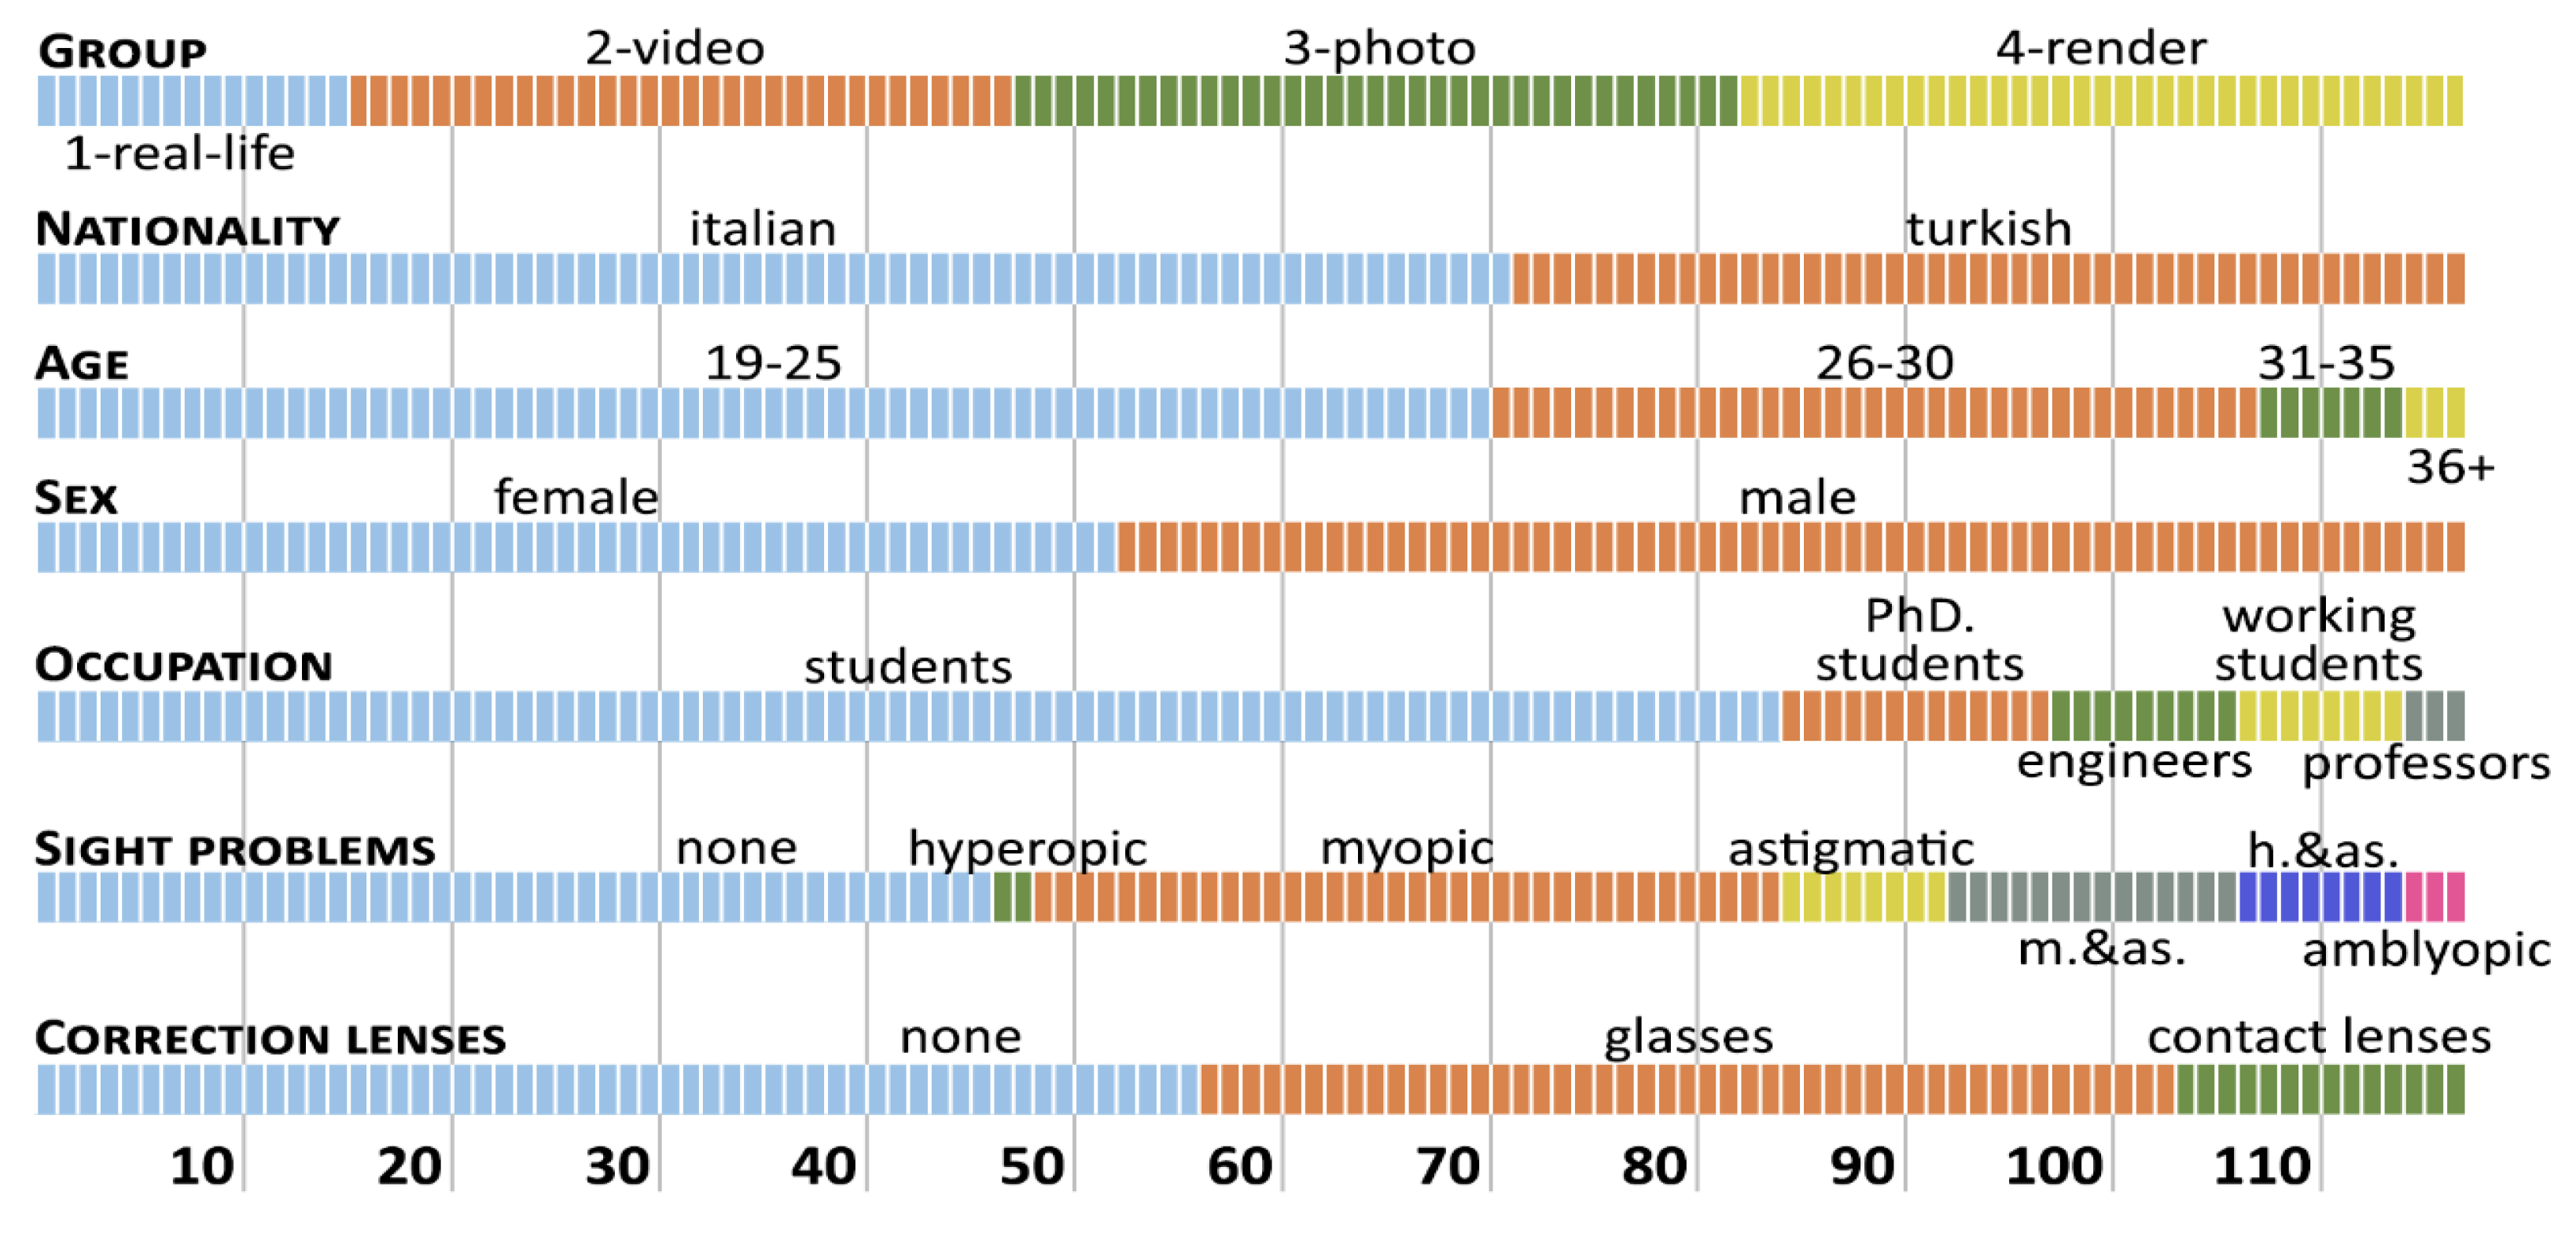
A total of 117 subjects, who were mostly university students from both institutions, University of Pisa and Izmir Institute of Technology, participated in the questionnaire. Participants were divided into four experience groups: Real-life, virtual-video-based, virtual-photo-based and virtual-render-based. Each participant was included in only one experience group to avoid carryover effects. However, a small group of participants (12 participants, approximately the 10% of the overall sample) was used as a control group. This group participated in all the four different visiting experiences. The participants’ information is summarized in
Figure 3.
2.4. Questionnaire
A set of 14 questions evaluating the lighting of the space were asked; the questionnaire sheet can be consulted in the
Supplementary Materials (Section S1). Since multiple exhibitions halls were included to understand the impact of the hall’s characteristics, participants rated the same set of questions for each hall. The questions were selected to understand the impact of the experience on the answers to the light’s characteristics and to understand the relationship between light and space. Questions 1–11 concerned the visual quality of the space. Questions 12–14 concerned the major causes of influences on the visiting experiences. Participants had the possibility of picking up to two answers for Questions 12 and 13. The questionnaire has four identical pages, one for each of the analyzed exhibition halls (A-Historical Gallery, B-Mammals’ Hall, C-Ungulates’ Gallery, D-Cetaceans’ Gallery). Participants were divided into four groups depending on the nature of their visiting experience (1—real life, 2-virtual—video-based, 3—virtual-photo-based, 4—virtual-render-based). Each participant answered the questions after visiting (real-life or virtual-based) each room and without consulting other participants.
2.5. Procedure and Visual Set-Up
Participants responded to the questions after the real-life or virtual-based (i.e., videos, photos and renders) visits. The same questionnaire sheet in English was given to each experience group. Most of the participants were already familiar with lighting terms because of Master’s degree courses they had taken, but all of them were briefly informed about the sequence of the procedure before starting the questionnaire (
Figure 4).
First, participants watched the visuals, based on their experience group (Group 2: video, Group 3: photo, Group 4: render), and then answered Questions 1–13. Later, all experience groups observed the marked photos for each hall and rated the points (from 1 to 6), starting from most disturbing one to the least disturbing one, and then answered Question 14. The purpose was to find out whether significant differences in visitors’ perception of discomfort existed between actual visits (real-life) and any other kind of virtual experience (video-based, photo-based or render-based).
Data were collected between May and December 2019. Participants of the virtual experiences groups observed the visuals in the test rooms, one in the Faculty of Architecture of the Izmir Institute of Technology (Turkey) and the other in School of Engineering of the University of Pisa. The test room avoided any bias in the visual sense, which might happen due to the uncontrolled surrounding lighting conditions while looking at the computer screen. The rooms were completely shielded from daylighting, and they were equipped with a desk, chair, desk lamp and a laptop. The same computer screens with full brightness were used throughout the questionnaire (LCD screen, 15.6 inch, 1366 × 768 pixel resolution both in Izmir and Pisa) to remove any bias of the environmental factors. They were accompanied by a conductor to administrate the questionnaire and to monitor the activities. It should be noted that the selected virtual visual experiences allow for the representation of all objects as sharp focus images, without the possibility of dynamically changing the depth, thus bringing the object of vision closer or further away from the observer. Moreover, virtual images can only show the luminance values that the displays used can technically show, usually in the range 1–400 cd/m
2 [
46].
2.5.1. Real-Life Experience
A group of 15 participants visited the Museum at different times, 4 of them were able to visit on 14 May 2019 (clear sky condition), and 11 of them visited on 12 December 2019 (overcast sky condition). It must be noted that 7 of the visits on 12 December 2019, were after sunset. Participants completed the real-life visits in about 5 min in Room A and in Room B, about 6 min in Room C and about 7 min in Room D. After the visits, participants answered all the questions (including Question 14) based on their real-life experience. While the real-life visits were executed in May and December, the visuals used in the virtual experiences (i.e., videos, photos and renders) were taken in July using the same time slot, as mentioned below. This is a potential limitation of the study, discussed in the specifically in
Section 5.
2.5.2. Virtual-Video-Based Experience
Videos were taken on 2 July 2019, with a GoPro Hero7 action camera (main settings were the following: image size = 1940 × 1440, frame per second = 60, bitrate = 45). A researcher visited each hall with a recording camera strapped to their head (
Figure 2). In Rooms A and B, videos were recorded at 14:20 and at 15:30, respectively. The visits had a duration of about 5 min. In Rooms C and D, videos were recorded at 16:00 and 17:05, respectively. The visits had a duration of approximately 6 and 7 min, respectively. Participants of the video-based group watched the videos before answering Questions 1–13, then they watched the marked photo and answered Question 14.
2.5.3. Virtual-Photo-Based Experience
Photos were taken with a Nikon D3000 camera (main settings were the following: image quality = NEF(RAW), ISO = 400, exposure time = 1/10) on 2 July 2019, in the afternoon, starting from 14:20. For each exhibition hall, a photo was selected that captures the space with adequate quality. Standpoints of each photo were marked on floor plans for rendering. Participants of the photo-based group watched the photos (
Figure 5, left) before answering Questions 1–13, then they watched the marked photo and answered Question 14.
2.5.4. Virtual-Render-Based Experience
Utilizing floor plans, elevation drawings, photos and videos, digital models of each exhibition hall were generated in Relux. The software allowed us to model and simulate lighting with outputs of calculations and visuals. Exhibition halls and display cases were modelled in both ArchiCAD (later imported to Relux) and Relux. 3D models of species and animals, which resemble the exhibited objects as closely as possible, were obtained from 3D model sites (Achieve 3D; 3D Warehouse).
Renders were generated using the same viewpoints, angle and focal length of those used in the photos. In addition, renders were generated using the same date and time when the photos were taken. The aspect ratio of the photos and renders were kept the same. Visualizations were repeated several times until the simulated illuminance values converged with the on-site measurements. Finally, white balance and exposure of the renders were set by referencing photos visually. Participants of the render-based group watched the renders (
Figure 5, right) before answering Questions 1–13, then they watched the marked photo and answered Question 14.
3. Results
In the following subsections, the results obtained from the questionnaire submissions are summarized and discussed. In
Section 3.1, the visual quality of space, based on the results of Questions 1–11 (see Annex A), is explored. In
Section 3.2, the causes of influence on the visiting experiences, based on the results of Questions 12–14 (see Annex A), are explored. The results of Questions 1–11 are reported separately from those of Questions 12–14 because both the topic explored, and the structure of the questions were different. In fact, unlike the others that provide a single answer, for Questions 12–14 it was possible to express up to two preferences (Questions 12 and 13) or to rank the proposed elements (Question 14). The summary of the results in this section is functional to the discussion of the results obtained in the next section. It is important to note that the reported results refer to the entire sample of 117 participants. The results obtained for the control group that participated in the four visit experiences (see
Section 2.3) did not show significant variations compared to the results of the entire sample.
3.1. Visual Quality of Space
The median values of the answers given to Questions 1–11, regardless of the experience group, are shown in
Table 1 for each analyzed room. The median values of the answers given to Questions 1–11, grouped by experience group, are shown in
Figure 6 for each analyzed room. The results show that, even though some responses change with the experience, the distinctive differences are mostly between Room D and the others, since Room D is the only room where natural lighting plays a dominant role in comparison to artificial lighting.
3.2. Causes of Influence on the Visiting Experiences
In this section, the results of the answers to Questions 12–14 are shown. In these questions, participants were expected to pick up to two choices (i.e., one or two) for the Questions 12 and 13 and to rank the proposed elements for Question 14 in order to explore if there was a hierarchy among the investigated causes of influence on the visiting experience.
In Question 12, participants were asked to state the generic cause of influence on experience in the exhibition hall. The results of Question 12 are shown in
Figure 7 for each analyzed room and globally. Considering the four experience groups altogether, ‘exhibited objects’ (answer b) was perceived as the major influence in all exhibited halls, except for Room D, where most participants selected ‘exhibited objects and outdoor space’ (answer b + c). Out of the 468 answers (117 participants multiplied 4 exhibition halls), ‘exhibited objects’ (b) was chosen 200 times (42.7%) as the main cause of influence on the visiting experience. Participants then found that the ‘exhibited objects and outdoor space’ (b + c), and the ‘interior space’ (a) were the major influencing factors on their visiting experience, with 72 (15.4%) and 71 (15.2%) answers. The third major cause of influence is ‘interior space and exhibited objects’ (a + b), with 68 answers (14.5%). ‘Outdoor space’ (c) was considered relevant only 9.8% of times (46 answers). Finally, only 2.4% of times ‘interior and outdoor space’ (a + c) were considered to be equally relevant. Distributions of answers are more uniform in Rooms A and D. A similar trend can be seen in all exhibition halls when the different visiting experiences are compared.
In Question 13, participants were asked to state the cause of visual discomfort. The results of Question 13 are shown in
Figure 8 for each analyzed room and globally. Considering the four experience groups altogether, ‘reflections’ was considered the main cause of visual discomfort in Rooms A, B and C. Those exhibition halls use glasses in the displayed cases. Only focal lighting is used in Room B, which can create coarser shadows. This may be the reason for the rise in the number of times ‘shadows’ was chosen, as compared to other spaces. Both daylight and artificial light are used in Rooms A and C, and in fact, a similar distribution of answers can be seen in this question. While ‘excessive brightness’ was significantly chosen the most, ‘none’ was the most stated visual discomfort in Room D. The impact of the causes of visual discomfort can be ordered, from highest to lowest, as ‘reflections’, ‘excessive brightness’ and ‘shadows’.
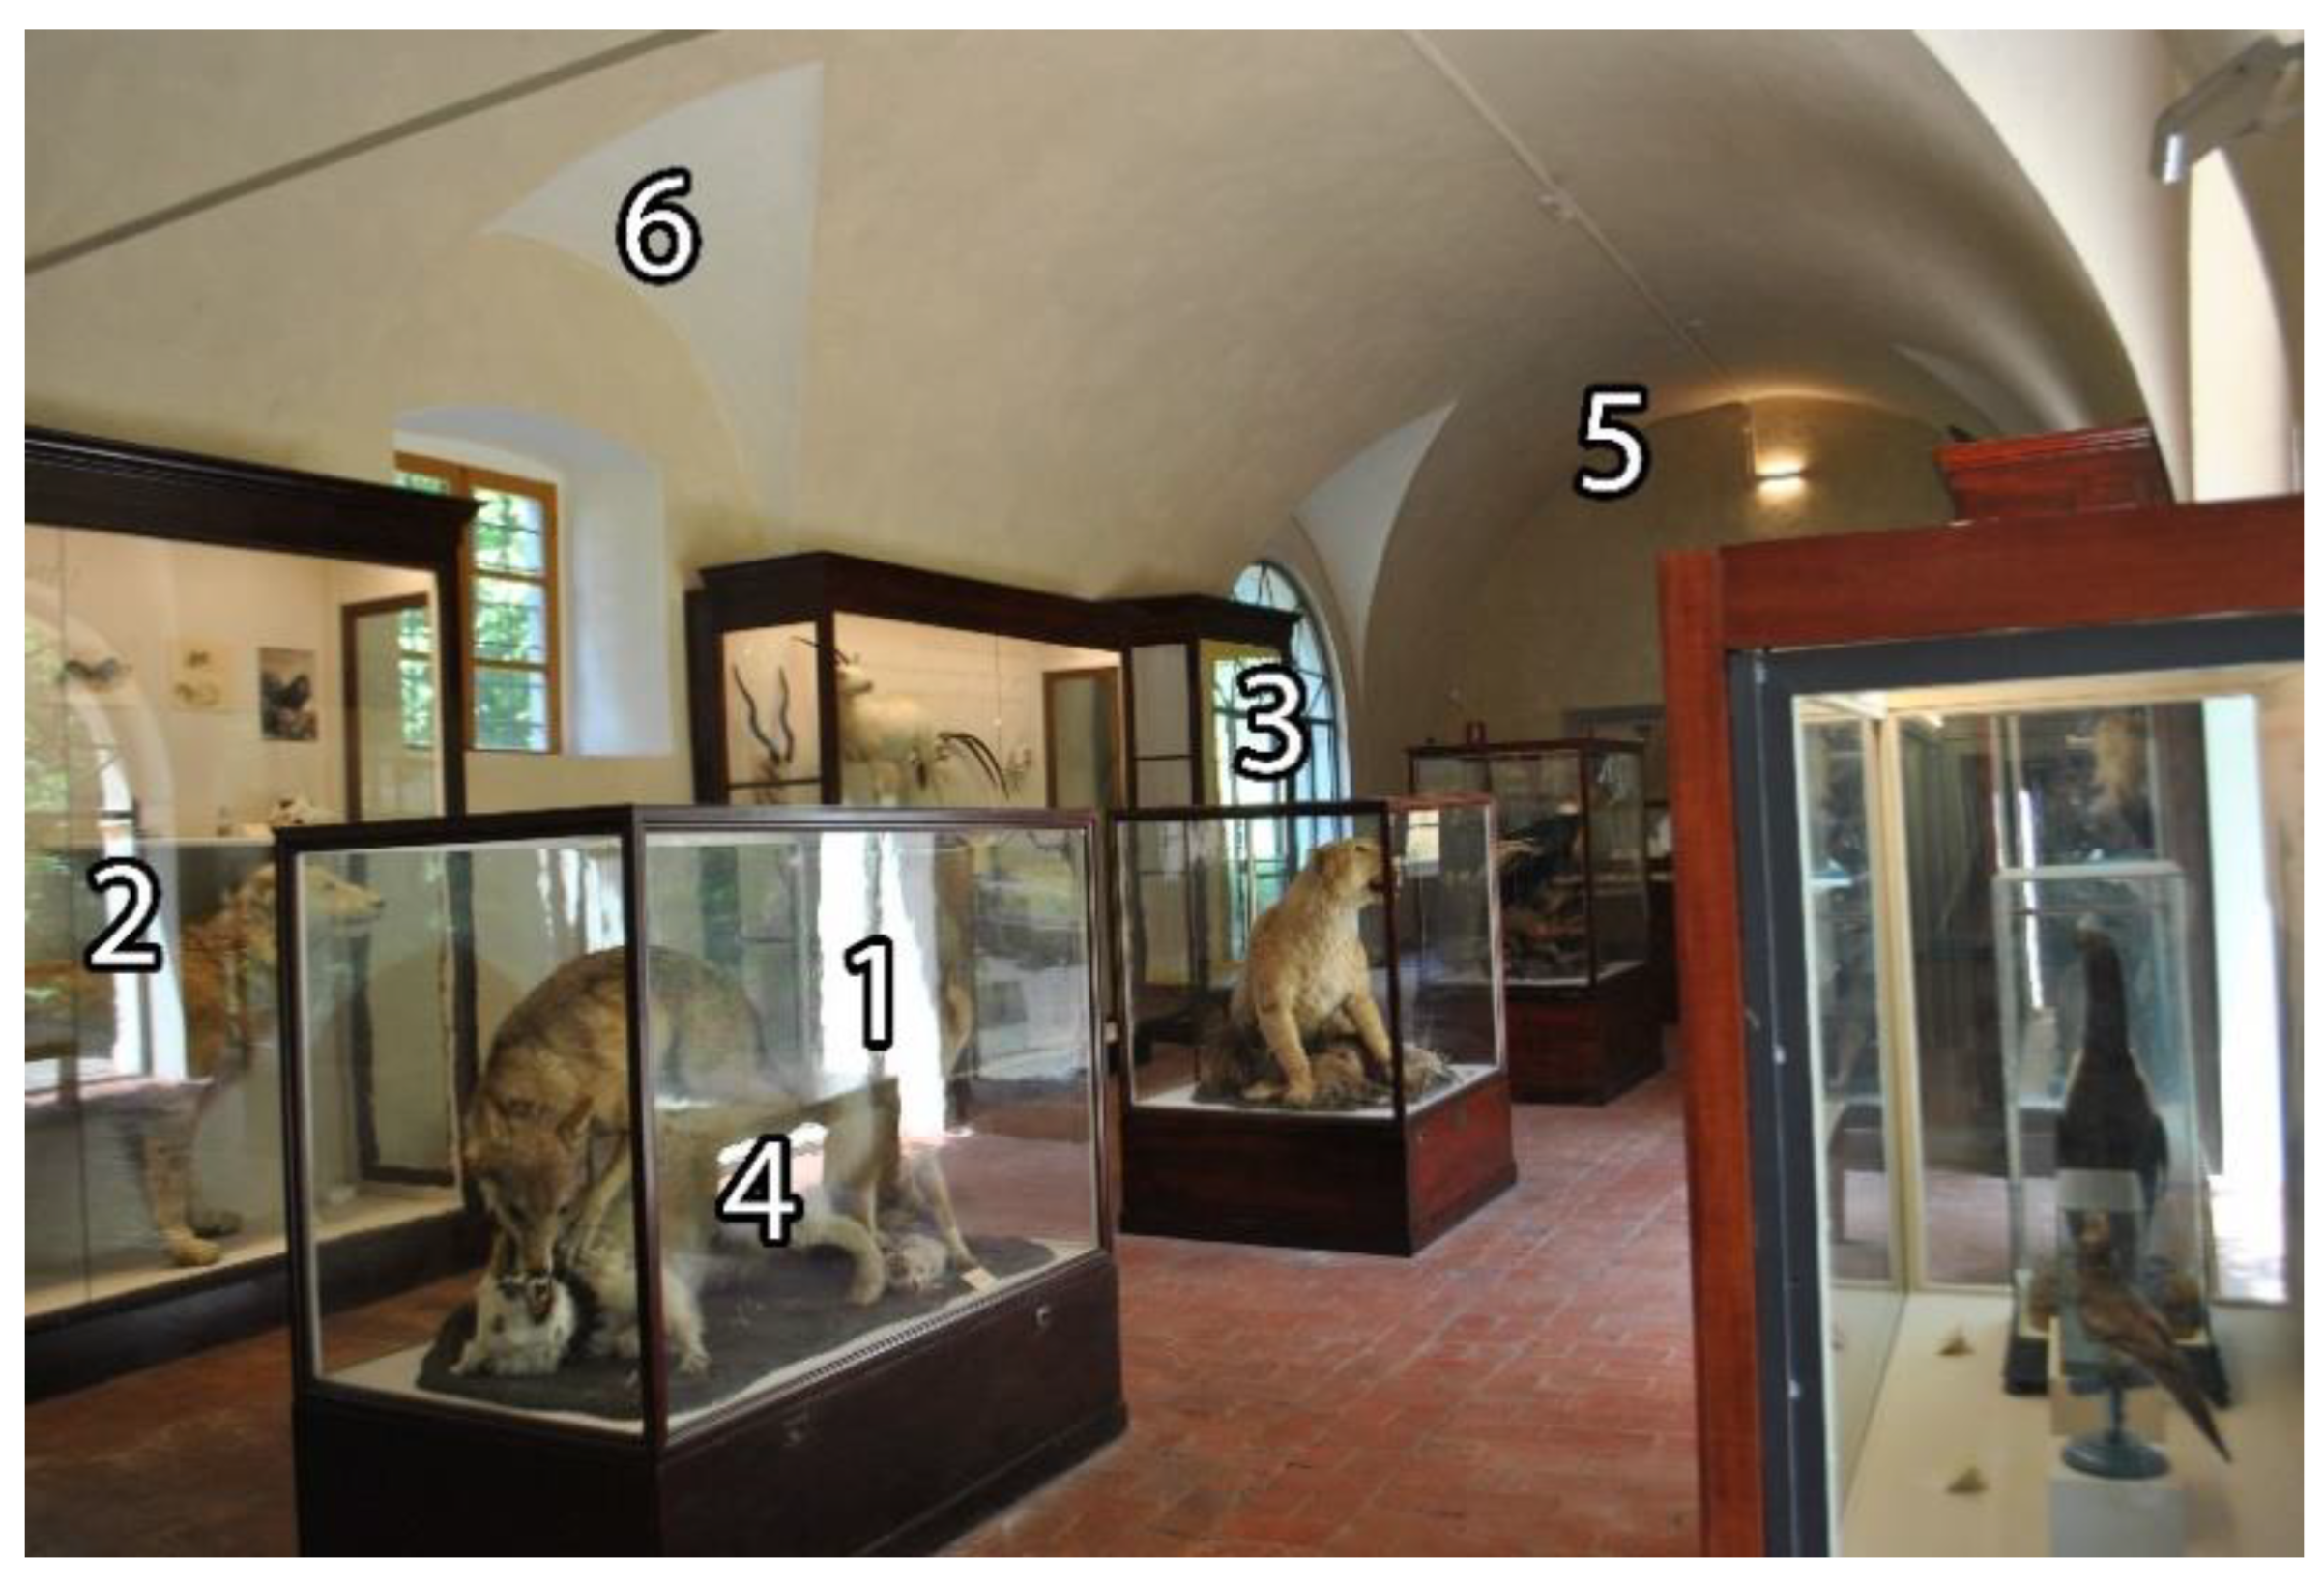
In Question 14, participants were asked to rank the given points (marked on each photo) from the most disturbing to the least disturbing. Points were marked by referencing possible visual discomfort points, such as reflections, shadow and glare.
Figure 9 displays the six marked points for Room A, and
Figure 10 displays the graphical results, separated by experience group for Room A. The results for Rooms B, C and D can be consulted in the Annex B. In the graphs, each bar on the
x-axis corresponds to the number of times a certain point was given a position between one and six (one being the most disturbing point to look at, and six being the least disturbing one to look at). It must be noted that all the participants (regardless of their experience group) completed their experience before observing the marked photo and ordering the given points. The aim is to see if there is any bias due to the experience when evaluating the photos. In Room A (
Figure 10), Point 1 is the most chosen point. Such a point is placed on a reflection that blocks the perception of the displayed object. The second most disturbing selection differs significantly between the virtual-render-based experience and the other ones. The disturbance level of reflection in the back (Point 2) increases as the experience becomes less detailed (from real-life to virtual-render-based). Point 5 and 6 are placed on the vault ceiling, they were always found to be the least disturbing. The answer distributions show that perception is related to the experience one is having. In addition, different experiences can create bias on further observations of the same space, since all answers to Question 14 were given by looking at the same marked photos (regardless of the kind of experience one previously performed).
In general, the results show that the nature of the visiting experience can affect the perception of visual discomfort. Reflections were often picked as the most disturbing, as they make the object (or its detail) unreadable. Daylight coming from openings was considered less disturbing than reflections. The results also show that the order of disturbance level between reflections, shadows and excessive brightness may change with some distinct hall characteristics, such as the window to wall ratio.
4. Discussion
In order to discuss the questionnaire results, the impact of different visiting experiences on the answers to the questionnaires was analyzed. The analysis was performed by considering all the experiences, using ANOVA (Generalized Linear Model method), and considering the experiences in pairwise, using a
T-test. In the following subsections, some considerations are reported, in light of the analysis conducted in the case of all the experiences (
Section 4.1) and in the case of experiences in pairwise (
Section 4.2).
4.1. Comparisons of All Visiting Experiences
The impact of different visiting experiences on the answers to the questionnaires, according to the results of the ANOVA GLM method, is summarized in
Table 2, where the obtained
p values are indicated. The values in
Table 2 are referred to as the answers to the Questions 1 to 11; multiple choice questions (Questions 12, 13, and 14) were excluded from the analysis. A total of 18 values, out of 44 (11 questions per 4 halls) values, showed significant differences due to the visiting experience (
p < 0.05).
The values in
Table 2 can be discussed according to different points of view. If the rooms are considered, it is possible to observe that the visiting experience impacts differently in the various rooms. In particular, it impacts the most in Room B (six significant
p values) and less in the others room (significant values ranging from three to five). If the questions are considered, it is possible to observe that the aspects of the perception of the environment most influenced by the visit experience are: Lighting Type (Question 1, significant
p values in three of the four analyzed rooms), Glare (Question 2, significant
p values in three of the four analyzed rooms), and Darkness/Lightness of Space (Question 5, significant
p values in three of the four analyzed rooms). The least influenced is the Catchiness of the Space (Question 6, no significant
p values in the four analyzed rooms). However, the Overall Quality of the Space seems only slightly affected by the experience (Question 11, significant
p values in only one of the four analyzed rooms).
4.2. Pairwise Comparisons of the Visiting Experiences
The impact of different visiting experiences on the answers to the questionnaires was further analyzed using two pairwise comparisons: Comparison between real-life and virtual-video-based experiences, comparison between virtual-photo-based and virtual-render-based experiences. The first represents a comparison between two dynamic experiences, one real (real-life) and one virtual (virtual-video-based). The second represents a comparison between two virtual experiences, based on static images (virtual-photo-based and virtual-render-based). The comparisons, according to the results of the
T-test performed on all the answers to Questions 1–11 for the different rooms, are summarized in
Table 3, where the obtained
p values are indicated. Note that significant
p values (
p < 0.05) in
Table 3 translate into significant differences in visiting experiences.
As for the comparison between real-life and virtual-video-based experiences, the highest number of differences occurred in Room A, where the answers to seven out eleven questions were found to be significantly different. The lowest number of differences occurred in Room B, where the answers to only two questions were found to be significantly different. The lighting descriptors for which the greatest differences were found are Lighting type (Question 1) and Glare (Question 2), which resulted significantly different in all artificially illuminated rooms (Rooms A, C, D). Overall, answers to Color temperature (Question 10) and Quality of space (Question 11) did not change within different experiences between dynamic experiences, regardless of the analyzed room.
As for the comparison between virtual experiences with static images (virtual-photo-based and virtual-render-based), less significant differences were found in the T-test compared to the one between real-life and virtual-video-based experiences. The highest number of differences occurred in Room D, where the answers to five out eleven questions were found to be significantly different: Glare (Question 2), Catchiness of the space (Question 6), Visual comfort (Question 8), Distribution of light (Question 9) and Overall quality of space (Question 11). The other rooms showed only minor and very similar numbers of significant differences to each other. It is evident that the faithful reproduction of renderings compared to photographic images becomes critical when the contribution of daylight predominantly replaces that of artificial light. Perception of Glare (Question 2) distinctively changes between virtual-photo-based and virtual-render-based experiences, except in Room A. Overall, light on objects (Question 4), light of space (Question 5) and harshness/softness of light (Question 7) were found to be indifferent between still experiences, regardless of the hall’s characteristics. Considering that the majority of answers were always found to be indifferent in the experience, it can be deduced that renders may be a promising replacement for photos.
To check if there was a reciprocal influence between the individual lighting descriptors or an influence of the single lighting descriptor on the overall quality of the space, an analysis was carried out by calculating the Pearson correlation coefficients (r, variable between 1 and –1). The results of the analysis are summarized in
Table 4, where significant values are shown in bold.
From the values in
Table 4, it is possible to note that there is a positive significant correlation between Visual comfort (Question 8) and Overall quality of space (Question 11) with r = 0.702. It can be said that participants found visually comfortable halls more successful in terms of quality. Other notable positive correlations are between Visual comfort and Distribution of light (Questions 8 and 9), Distribution of light and Overall quality of space (Questions 9 and 11), and Catchiness of space and Overall quality of space (Questions 6 and 11). The highest negative correlation is between Lighting type and Connection to outdoors (Questions 1 and 3) with r = −0.681. As expected, when the ratio of artificial light increases, connection to the outdoor weakens. Another notable negative correlation is between Lighting type and Darkness-lightness of space (Questions 1 and 5) with r = −0.556. When artificial light increases, lightness of space decreases. The reason could be that focal lighting on objects is mostly used as an artificial light source.
5. Limitations
The described study is characterized as a first investigation regarding the differences in the perception of light between real-life and virtual visiting experiences. Given the complexity of the topic addressed (presence of numerous variables involved) and its innovativeness (lack of significant similar experiences to be used for comparisons), this study has some limitations. The main limitation is the different time slots, which correspond to different sky conditions, in which the visits (real-life and virtual-based) were performed (see
Section 2.5 and related Subsections). Further investigations, using the same time slots and operating in homogeneous sky conditions for all visiting experiences, are desirable to confirm some of the considerations made, based on the achieved results.
However, exploiting the acquired data in order to assess if there were difference in answers due to the different time slots, some additional analyses were conducted. In particular, a
T-test was performed to check if there were significant differences between the answers given in the real-life visiting experience made before sunset (eight participants) and after sunset (seven participants). These are the situations with the most marked variation in sky conditions. The results of the analysis are summarized in
Table 5, where the obtained
p-values are shown for two rooms (Room C and Room D) where the influence of sky conditions could be relevant. As can be seen from
Table 5, the significant differences are negligible (only one significant value) for Room C. As expected, the differences increase for Room D (5 significant values) since it is exclusively daylit before sunset. Overall, no differences were highlighted, such as to compromise the validity of the results obtained. As previously indicated, further real-life investigations, made more difficult by the recent pandemic, can be useful to confirm the considerations made.
A final comment deserves to be made about the relationship between vision and kinesthesia [
47]. In this study, in order to limit the field of investigation and providing effective comparisons, participants were asked to pause for a few seconds in front of the vision of the proposed scenes, even in dynamic visiting experiences (i.e., real life and video-based visiting experience) to minimize the kinesthetic effects (completely absent in cases of visiting experiences with static images). Further investigations should be conducted to explore the effect of movement on different visiting experiences, limited to those of a dynamic type.
6. Conclusions
In the present study, virtual visiting experiences were compared to real-life visiting experience in museum environments, analyzing the answers of 117 participants to an ad-hoc questionnaire on the lighting conditions of a museum. The survey was conducted with reference to four permanent exhibition halls in the Natural History Museum of the University of Pisa, which is housed in the Monumental Charterhouse of Calci. Participants were divided into four groups: Real-life, virtual video-based, photo-based and render-based experiences. The impact of the various experiences was analyzed alongside the characteristics of the exhibition halls using various statistical methods. Virtual experiences were evaluated through certain criteria and room characteristics to detect strengths and weaknesses when projecting a real-life condition.
Overall, the results showed that virtual experiences can be similar to real-life in appropriate conditions. The observed differences can be discussed according to the features considered for the visit. If the ability to express the catchiness of the exhibition space is considered, all virtual experiences are appreciated, regardless of the hall characteristics. If the ability to enhance the visual quality is considered, rendering experiences are more appreciated than any other virtual experience. If the ability to increase the visual comfort is considered, the richer in details the experiences are the greater their appreciation is (i.e., from real-life to virtual-video-based, virtual-photo-based and finally to virtual-render-based).
Since the experiences are vaguely dissimilar from each other, they were also analyzed separately as dynamic visiting experiences (real-life and virtual-video-based) and static visiting experiences (virtual-photo-based and virtual-render-based). The results showed that renders are good alternatives to photos, even though the perception of glare will most likely be different.
For all the exhibition halls, the exhibited objects were found to be the main cause of influence on the visiting experience. However, this influence decreases as the experience becomes less detailed. Reflections, shadows and excessive brightness on the exhibited objects were indicated, in descending order of relevance, as the main causes of visual discomfort.
Consequently, further comparing conventional real-life visiting and virtual experiences (such as videos, photos and renders) in museums, this study discusses how virtual environments can replace and even enhance the conventional real-life visiting experience under certain conditions and aspects. The study suggest that room characteristics play a key role in the fidelity of virtual experiences. The results of this study, even if based on a case study, can provide clues and feedback to better understand and to further develop future digitalized applications in museum environments.


 ,
, 


