Abstract
Artificial intelligence technology has enabled the manufacturing industry and actively guided its transformation and promotion for the past few decades. Injection molding technology is a crucial procedure in mechanical engineering and manufacturing due to its adaptability and dimensional stability. An essential step in the injection molding process is quality inspection and manual visual inspection is still used in conventional quality control, but this open-loop working method has issues with subjectivity and real-time monitoring capacity. This paper proposes an integrated “processing–matching–classification–diagnosis” concept based on machine vision and deep learning that allows for efficient and intelligent diagnosis of injection molding in complex scenarios. Based on eight categories of failure images of plastic components, this paper summarizes the theoretical method of processing fault categorization and identifies the various causes of defects from injection machines and molds. A template matching mechanism based on a new concept—arbitration function —provided in this paper, matches the edge features to achieve the initial classification of plastic components images. A conventional VGG16 network is innovatively upgraded in this work in order to further classify the unqualified plastic components. The classification accuracy of this improved VGG16 reaches 96.67%, which is better than the 53.33% of the traditional network. The accuracy, responsiveness, and resilience of the quality inspection are all improved in this paper. This work enhances production safety while promoting automation and intelligence of fault diagnosis in injection molding systems. Similar technical routes can be generalized to other industrial scenarios for quality inspection problems.
1. Introduction
Artificial intelligence technology is continuously revolutionizing how human production and labor is carried out in the new pattern of industrial development coordinated by “Made in China 2025” [1]. A new wave of technological change in the manufacturing sector has been brought on by the fact that intelligent production has evolved into the core of intelligent manufacturing. Injection molding is understood as the process by which a totally molten plastic substance is swirled by a screw at a specific temperature, injected into the cavity of the mold at high pressure, and then cooled and cured to produce a molded object. Due to the adaptability and dimensional stability of the processed products, it is one of the most widely used technologies [2] in mechanical engineering and manufacturing and is utilized on a large scale in the production of plastic items. The production quality of the molded part is closely correlated with the defect detection and fault diagnostic capability of the injection molding system, which is a key performance indicator of an injection molding machine [3]. Injection molding is also vulnerable to structural issues including flash, dimensional instability, short shot, buckling deformation, shrinkage depression, craze etc. In contrast, manual visual inspection is still employed in conventional industrial production to find surface flaws in plastic components, but this open-loop working technique is poor at real-time monitoring and is very subjective [4].
Machine vision and deep learning are the theoretical pillars of this paper. Machine vision is a class of non-contact, extremely reliable inspection methods [5,6]. Current vision inspection relies on the development of sensors that are utilized in a variety of industries, including industrial manufacture [7], smart automobiles [8], and disease recognition [9]. For domestic and international colleagues to conduct industry–academia research, it is crucial to build simple and intelligent fault diagnosis methodologies. Since 2012, the rapid development of deep learning has opened up new approaches in the field of fault diagnosis, as well as more interpretable methods [10].
The basis for determining processing flaws is the morphology and distribution of defective areas in the image [11]. Due to the objectivity of the intelligent detection system, no human intervention is allowed. Scientific and industrial leaders in this subject are developed nations, particularly the USA and Germany, with Cognex and ISRA serving as the leading examples. The basis for determining processing flaws is the morphology and distribution of defective areas in the image. Combining morphological processing techniques with algorithmic parallelism, Torres F. et al. [12] proposed a surface inspection machine vision system for the printing industry and achieved great success. Li Di [13] captured phone glass flaws using a vision device CMOS camera and thus, using a principal component analysis technique, diagnosed the flaws with an 88% detection accuracy. high-quality images of defects, high-precision localization and detection are fundamentally based on defect images of the highest caliber. Luke et al. [5,14,15,16] at Carnegie Mellon University have developed an algorithm that seamlessly transfers learning knowledge between various machines and offers real-time performance, improving the unsupervised machine learning algorithms that were initially used in the field of laser additive manufacturing, for accurate classification, detection, and feedback control. Their work allowed for accurate fault classification, detection, and feedback control.
Deep learning is a data-oriented science and has facilitated technical advances in a variety of disciplines, including natural language processing [17,18,19] and self-driving vehicles [20]. It has also offered up new methods for defect identification and fault diagnosis issues since its debut by Geoffrey Hinton [21] in 2006. A convolutional neural network is one of the primary methods used in the field of computer vision. Neural networks are the primary architecture for deep learning. Through adaptive training of multilayer networks, neural network algorithms have successfully replaced the onerous effort of manual feature extraction and feature engineering and have attained more accurate generalization capabilities. In 1989, LeCun [22] developed and proposed the convolutional neural network model. After AlexNet won the ImageNet championship in 2012, convolutional neural networks came to be seen as the standard for deep learning in the field of image recognition, replacing feature engineering methods that had previously dominated the academic community. D. Soukup et al. [23] used a combination of unsupervised hierarchical pre-training and data augmentation to train a convolutional neural network model to a 90% accuracy level. To detect steel plate defects, Jonathan Masci et al. [24] proposed a multi-scale pyramidal pooling network (MSPyrPool). With a training accuracy of 11.3% greater than the second-ranked model, the proposed MSPyrPool network significantly outperformed other engineering feature-based classifiers. Local connectivity and weight sharing reduce the algorithmic complexity of convolutional neural networks during training, and as the quality of the dataset improves and the network model continues to optimized, deep learning networks have an increasing ability to generalize.
This paper proposes an integrated method of “processing–matching–classification–diagnosis” based on eight forms of defects in plastic components and uses images of plastic components to diagnose the failure of injection molds and injection molding machines. The framework of this integrated method is shown in Figure 1. Accuracy, effectiveness, non-contact and non-damaging, and an extended continuous working period are all benefits of the integrated detection method in this study. The three main contributions of the research presented in this paper are to:
- (1)
- Reduce labor requirements at industrial production sites while enhancing production security.
- (2)
- Advance fully automated injection molding production.
- (3)
- Advance the automation and intelligence of fault diagnosis systems for injection molds and injection molding machines.
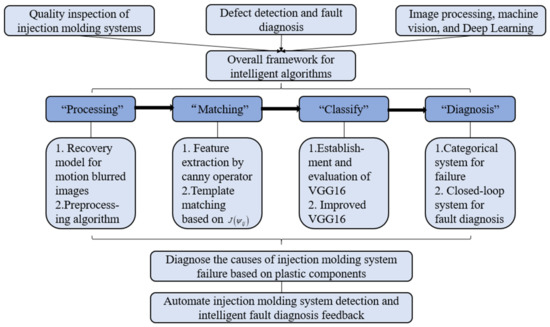
Figure 1.
The framework of the integrated method: “processing–matching–classification–diagnosis”.
Figure 1.
The framework of the integrated method: “processing–matching–classification–diagnosis”.
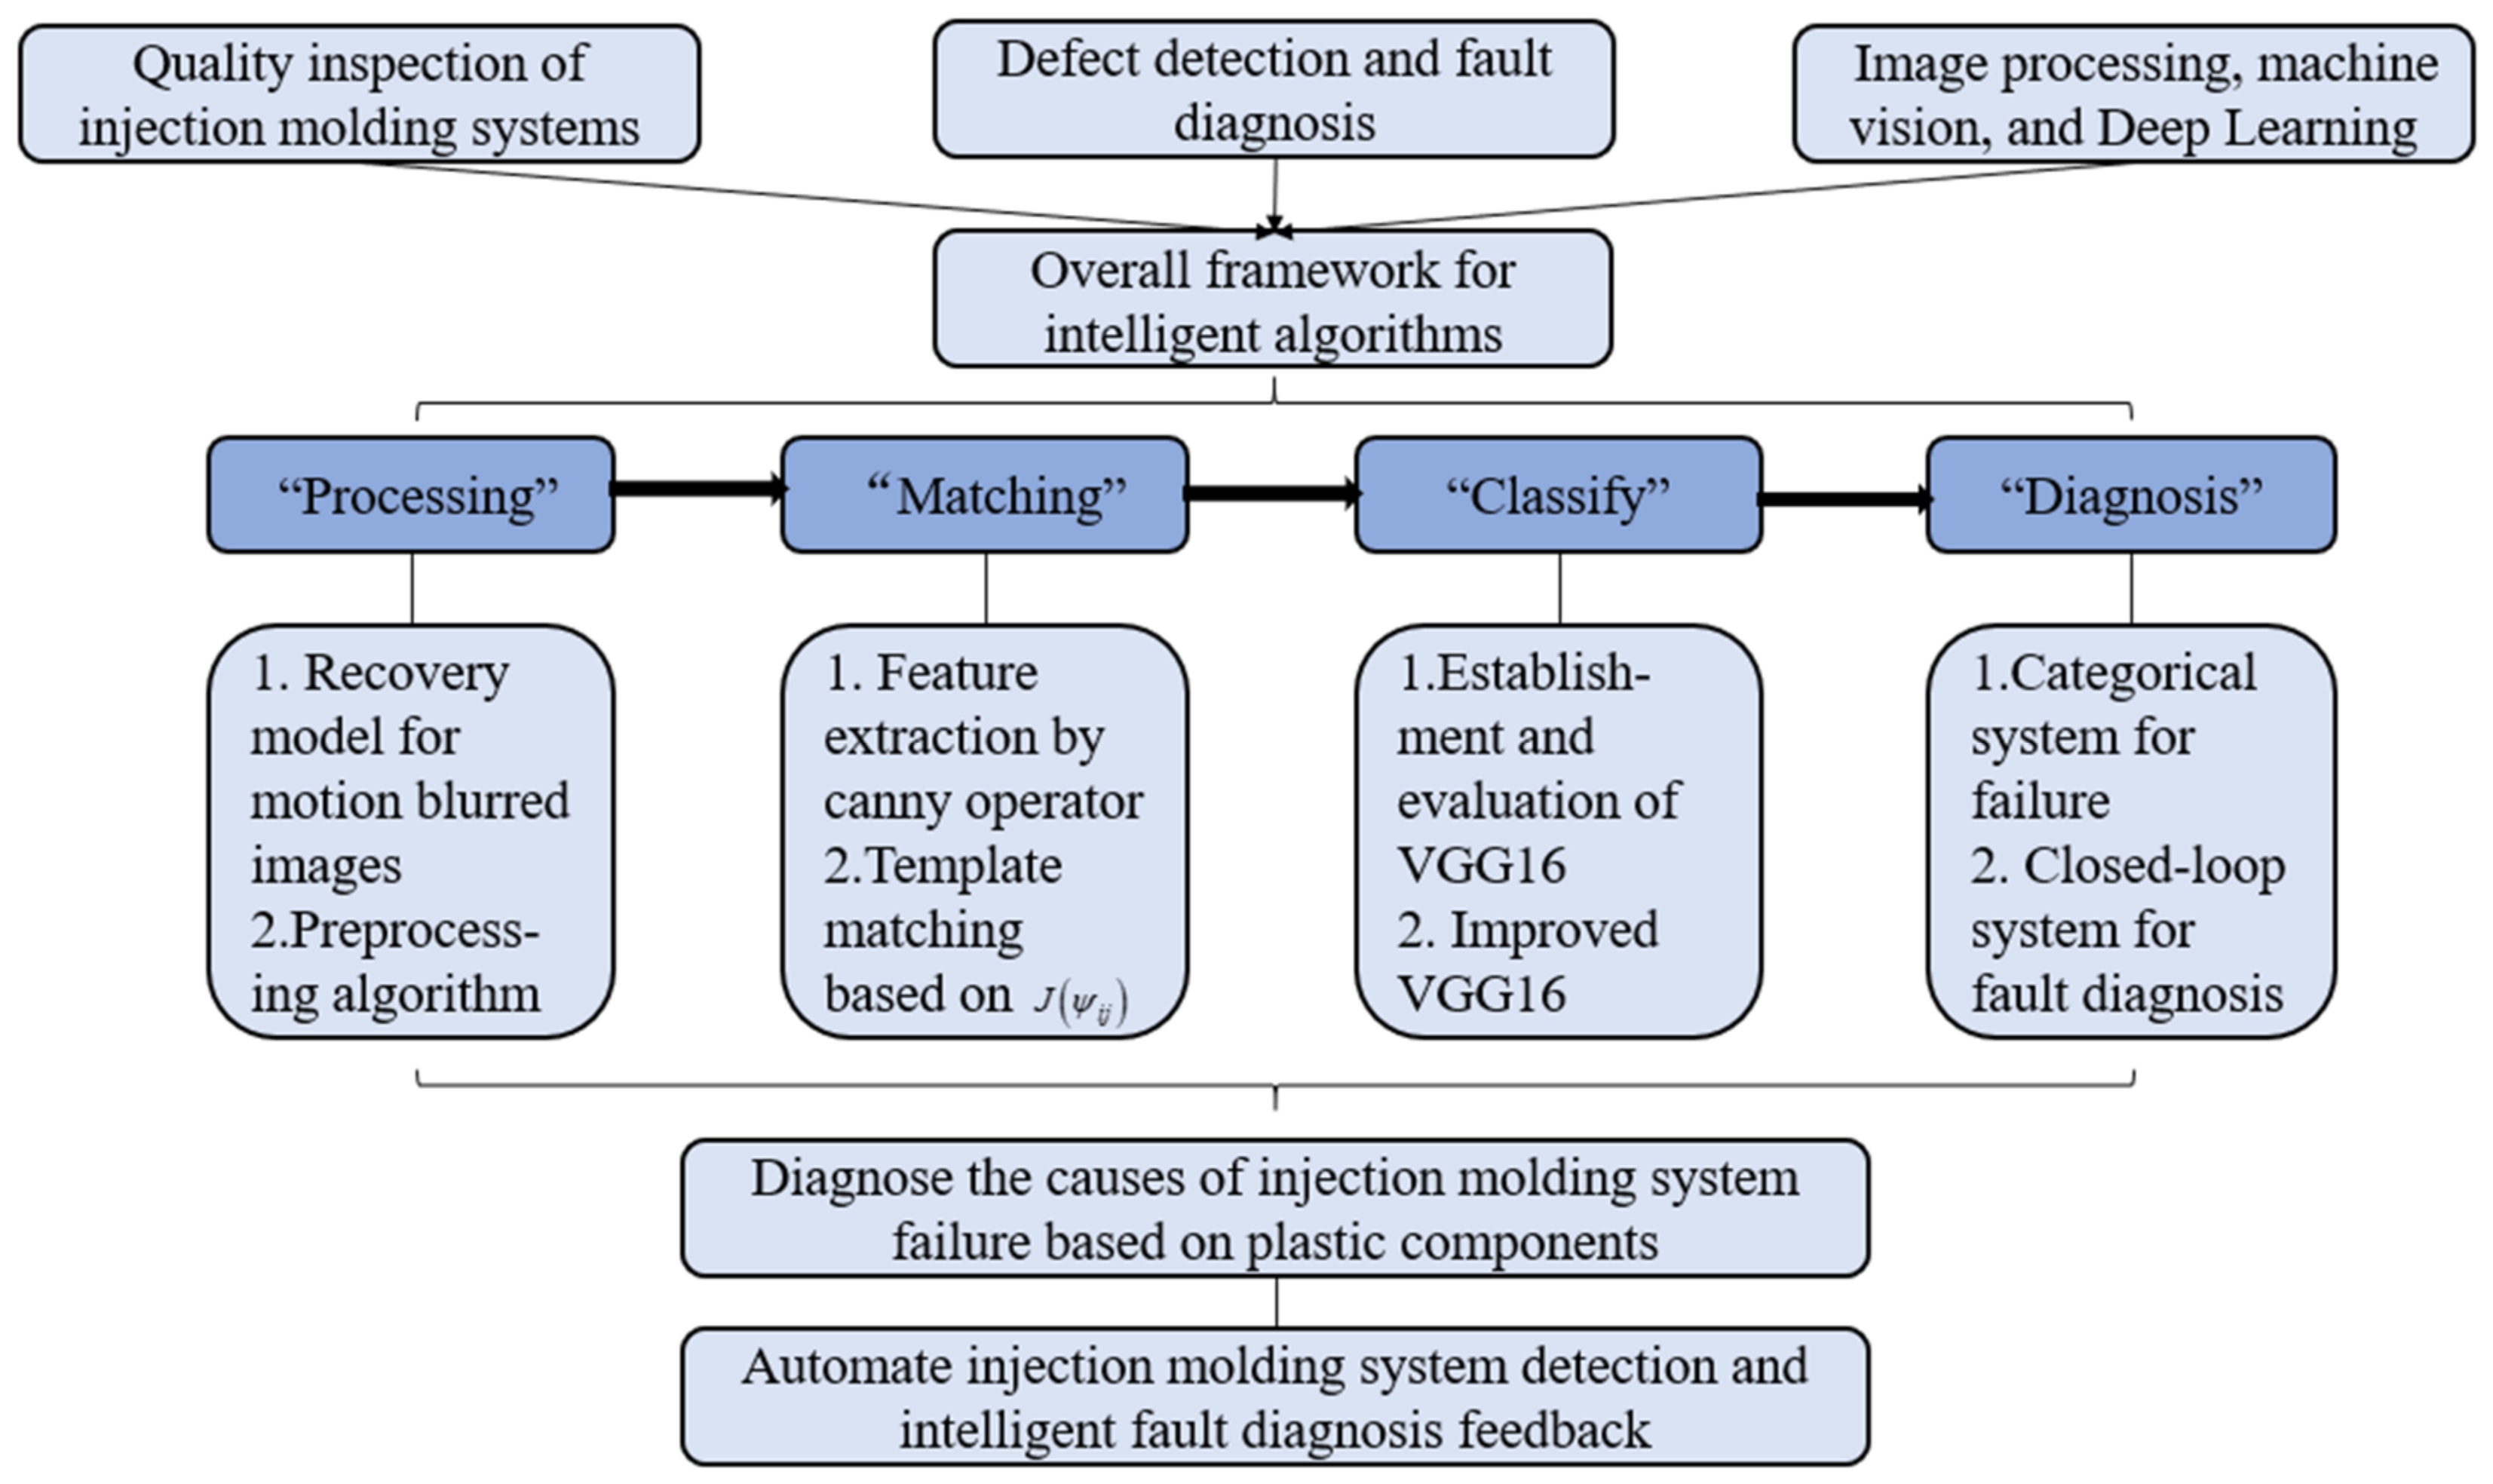
The core and innovation of this work is the integrated method of “processing–matching–classification–diagnosis”. To construct a template matching mechanism, a new concept of arbitration function is proposed in this paper. An effective template matching mechanism is the basis for accurate classification of plastic components and fault diagnosis of injection molding systems. In order to increase the robustness of the matching mechanism, the arbitration function allows for error tolerance for images with less-than-excellent initial matching accuracy (higher than the threshold but less than its statistical scaling value) during the initial classification of the plastic part images. In addition, this paper improves the conventional VGG16 convolutional neural network by simplifying network structure and adjusting hyperparameters. A series of experiments show that the new network with improved VGG16 has improved generalization capabilities when dealing with tiny batches of data, offering a fresh solution to the problem of fault diagnostics in injection molding systems.
This work is organized as follows. In Section 2, we analyze the main defect types, diagnose strategies of injection molding, and preprocess the dataset using the classical approaches to extract the edge features from each image (including template images). In Section 3, we propose the arbitration function to establish a template matching mechanism for injection molding and perform a preliminary test on the dataset. In Section 4, we propose a novel convolutional neural network—improved VGG16 for small batch sample refinement classification based on conventional VGG16. In Section 5, we explain the main experimental results of this new network. Finally, in Section 6, we discuss the following study routes for this work and summarize the main conclusions of this paper.
2. Pre-Processing Algorithms for Data Sets
2.1. Classification Theory and Setting of Image Dataset Labels
The “input end” and research object of the intelligent algorithm is the set of image data. To achieve the fault diagnosis of the injection mold and the injection molding machine, the research in this paper is based on the surface flaws of the injection molding workpiece. The reason for the plastic part’s fault must be identified in order to properly identify the image collection.
According to a macroscopic examination, the mold, the injection molding machine, and the injection molding process are the three elements that lead to faults in plastic parts. The first two categories of causes are mostly taken into account because this work is based on a specific injection molding production line. Combining the eight primary types of plastic component faults, the theoretical relationship between plastic part defects and injection molding system failure is outlined from the aforementioned two viewpoints, which serves as the theoretical foundation for segmenting the data set.
2.1.1. Dimensional Instability of the Plastic Components
The direct cause of the dimensional change [25] in plastic components is the shrinkage of plastic caused by temperature action. The size of plastic components will be unstable if there is a significant amount of uneven shrinkage. The impact of materials with various crystallinity levels needs to be studied further. The flaws are compared to the two causes mentioned above:
- (1)
- Injection molding machine:
Insufficient plasticizing capacity, unstable feeding, unstable screw speed, uncontrolled temperature, malfunctioning proportional valve, dysfunctional total pressure valve, unstable back pressure, and other factors.
- (2)
- Injection mold:
- The mold lacks sufficient rigidity and strength, and the core and cavity materials have poor wear resistance.
- The “one mold with multiple cavities” mold gating system is unreasonable.
- Dimensional instability of the plastic components are caused by an uneven mold cooling system configuration and a sizable temperature differential around the mold.
2.1.2. Short Shot of the Plastic Components (Insufficient)
This describes a scenario in which the injection mold cools and solidifies without being filled, leading to the production of flawed goods [26]. The main causes, from the perspective of the “three elements of molding and processing” are a lack of material and an imbalance in the injection pressure and speed. There are the following diagnostic options for the mold and the injection molding:
- (1)
- Injection molding machine:
- The injection molding machine’s plasticizing capacity is limited.
- The thermometer exhibits a fault, causing the actual temperature to be lower than the necessary working temperature.
- The nozzle’s inner hole’s diameter was improperly chosen.
- Too little time passes between injections.
- (2)
- Injection mold:
- The pouring system of the mold is designed absurdly.
- The mold structure is designed absurdly.
2.1.3. Buckling Deformation of the Plastic Components
Buckling deformation describes the deformation, bending, and twisting of plastic components. Anisotropy and the residual stress within the plastic part must also be taken into account when the plastic part’s structure is complicated [27]. Therefore, the mold design determines the plastic part’s propensity to warp, not the injection molding machine.
- (1)
- Injection mold:
- Plastic components’ structural designs are illogical.
- Unbalanced temperature in the mold.
- The design of the pouring system is not suitable for this kind of component.
- The ejector system’s design is illogical.
- The exhaust system’s layout is unreasonable.
- The mold’s material strength is insufficient.
2.1.4. Flash of the Plastic Components
The core mating surface, insert joint surface, and mold parting surface are among the positions where the flash [28], also referred to as overflow, batch front, or burr, occurs more frequently. From a structural standpoint, insufficient mold manufacturing precision and insufficient clamping force of the injection molding machine are the essentialcauses of the flash phenomenon.
- (1)
- Injection molding machine:
- The injection molding machine’s clamping force is insufficient.
- The clamping mechanism needs to be better adjusted.
- Flash may be caused by severe check ring wear, spring failure in the spring nozzle, excessive barrel or screw wear, loss of heating system control, including the small buffer pad, etc.
- (2)
- Injection mold:
- The mold parting surface’s manufacturing accuracy is subpar.
- The mold’s design is absurd:
- 1.
- Local flash and insufficient local filling are caused by an unbalanced distribution of mold cavities or by poor parallelism.
- 2.
- The flash will be produced when the movable parts and sliding cores in the mold are out of balance.
- 3.
- Neglected mold exhaust.
- 4.
- When plastic components have uneven wall thickness.
- 5.
- It is customary to open a side gate on the inside of a large molding hole that is in or near the center of the product. It is simple to cause minor warping deformation and flash under high injection pressure if the clamping force and supporting force of this part of the mold are insufficient.
- 6.
- If the side of the mold has a movable member, the projected area of the side is also affected by the molding pressure, and flash will result if the supporting force is insufficient.
- 7.
- Flash can also be caused by the movable core’s poor matching accuracy or by an offset between the fixed core’s installation position and the cavity.
- 8.
- For multi-cavity molds, consideration should be given to the reasonable design of each runner and gate, as failure to do so will result in flash and uneven filling of the mold.
2.1.5. Shrinkage Depression of the Plastic Components
Shrinkage depression refers to the increase in internal shrinkage rate brought on by the thickening of the plastic part’s local walls, and dents frequently occur in these locations [29]. Temperature differences, as well as the size and shape of the plastic components, are major determining factors for this defect.
- (1)
- Injection molding machine:
- The size of the nozzle hole is inappropriate.
- Not enough clamping force.
- (2)
- Injection mold:
- The mold should have a uniform wall thickness at the design level and should not be too thick to ensure the isotropy of the shrinkage process in order to prevent shrinkage depression. If a thicker wall is necessary, think about creating a hollow structure; arcs in place of sharp corners at the shunt channel can significantly lessen the amount of denting that occurs there.
- The mold’s cooling and heating system should guarantee that the cavity is essentially the same temperature.
- The main channel, runner, and gate sizes should be appropriate, and the roughness should be reasonable in order to ensure that the melt is not obstructed and that the resistance is not excessive.
- The mold temperature should be appropriately lowered for thick-walled plastic components and raised for thin-walled plastic components.
- The gate should open as symmetrically as possible and, to the greatest extent possible, at the thick-walled part of the plastic part. Additionally, the cold well’s volume needs to be increased.
2.1.6. Crack of the Plastic Components
Both small and large cracks that form on the surface of plastic components are referred to as cracks [30]. Demolding cracking and application cracking are two additional classifications based on the time at which cracks appear. The following is the cause analysis:
- (1)
- Injection molding machine:
- The injection molding machine’s plasticizing capacity needs to be appropriate. If it is too big, it will deteriorate. It will not become sufficiently plasticized if it is too small, and it will crack if it is not thoroughly mixed because it will become brittle.
- Pay attention to some engineering techniques, such as lowering the injection pressure, slowing down the last stage’s injection, slowing down the ejection speed, prolonging the cooling period, etc.
- (2)
- Injection mold:
- The ejection should be balanced in mold. In particular, the quantity of push rods, cross-sectional area, demolding slope, and cavity surface all need to be adequate to effectively prevent the concentration of residual stress in the ejection, which will result in the cracking of the plastic components.
- The transition part should utilize a circular arc structure as much as feasible to reduce stress concentration. The plastic components’ structure shouldn’t be too thin. Use metal inserts sparingly to reduce the internal stress caused by the disparity in shrinkage rates between inserts and plastic components.
- Deep cavity plastic components should have appropriate demolding air inlets set to prevent the development of vacuum negative pressure, which would ultimately affect demolding.
- The sprue needs to be big enough to allow demolding of the pouring system’s condensate before it solidifies.
- The nozzle and main runner in the sprue sleeve should be in line.
2.1.7. Craze of the Plastic Components
Craze on plastic components can be caused by surface air bubbles and interior holes [31]. The main factor is gas interference during the molding process.
- (1)
- Injection molding machine:
- The condition of the barrel, screw, and existence of a dead angle in the material flow through the rubber ring and head.
- The heating system is out of control, which results in an excessively high temperature and deterioration.
- To reduce the residence time as necessary.
- (2)
- Injection mold:
- Poor exhaust.
- The runner, gate, and cavity in the mold have high friction resistance, which leads to regional overheating and plastic degradation.
- An unreasonable cooling system, an unbalanced distribution of cavities and gates, and local overheating are all potential causes of airflow obstruction.
- The cavity is breached by a leak in the cooling water channel.
2.1.8. Blackspots Coking of the Plastic Components
These issues are typical injection molding flaws. Plastics or additional UV absorbers, antistatic agents, and other substances are thermally decomposed, explained, and coked in the barrel, and are then injected into the cavity with the melt. This thermal decomposition is the structural cause.
- (1)
- Injection molding machine:
- The barrel of the machine becomes overheated as a result of the heating control system losing control, degrading the related materials and turning them black.
- The melt is stuck because of a screw or barrel defect, and it will degrade if it is heated for an extended period of time.
- High heat in the barrel causes some plastics, such as ABS, to become cross-linked and coked. It is difficult to melt under conditions in which the original particle shape is almost maintained and, after being crushed by the screw, it is entrained into the plastic part.
- (2)
- Injection mold:
- The mold should have more venting slots opened because it may be poorly vented and the trapped air easily combustible.
- The mold contains unsuitable oil lubricants and mold release agents.
2.1.9. Acquisition and Image Database Calibration
Continuous photography and image acquisition were undertaken for one production process on the injection molding production line using image acquisition equipment. Before image preprocessing and feature extraction, the database labels were categorized and calibrated to produce high-quality fault diagnosis. The details of the dataset are shown in Table 1.

Table 1.
This table shows the labelling of the dataset in this paper and the size of the dataset.
2.2. Image Restoration Technology for Fuzzy Images
Due to the injection molding machine’s inertial motion, there is relative motion between the camera and the target image in a very short exposure time, and this motion blur causes the captured image’s pixels to drift [32]. On the other hand, the environment in the injection mold workshop influences the motion blur of the images. The interference of noise, such as variations in light and shade, dust, etc., will also lower the quality of the image. There must be some images in this dataset that need to be restored due to motion blur. The degradation model of the image serves as the foundation for the blurred image restoration technology, and the inverse process is calculated to complete the restoration.
2.2.1. Image Degradation Model
Utilizing image restoration technology, the damaged image is processed to restore it as much as possible. Establishing an appropriate image degradation model to describe the cause of degradation and to restore the image using its inverse process is a crucial technique. The image degradation process is modeled as a degradation system function H, where represents a pure image and represents a degraded image, corresponds to the external noise. Because the actual state in a factory is significantly more complicated than the theoretical model, noise should be taken into account. and the image degradation process is that is affected by a degradation system [33]. The exposure time is extremely brief, and the moving direction and speed of the image can roughly be considered as uniform linear motion . Although image denoising will be undertaken during data processing, it can be assumed that the noise is independent of the image’s location information for the model’s capacity to generalize. The image degradation model is shown in Figure 2.

Figure 2.
Image degradation model.
2.2.2. Blind Deconvolution Filtering Algorithm
It is challenging for researchers to reliably acquire PSF functions at injection molding manufacturing sites because of real-world issues such as inconsistent lighting and poor camera hardware performance. Therefore, at the theoretical level, it is still exceedingly challenging to identify the precise reason why visuals blur in real time. The blind deconvolution filtering algorithm can be used to recover the original image as much as possible when the exact reason for certain image degradation cannot be determined. Let , introduce the expected value of the random variable into (1).
From this, it is known that the image restoration idea of the blind deconvolution filtering algorithm is . where r is a penalty function and is a positive weighting coefficient. The Lagrangian form of this problem is:
The expression of Equation (3) includes the coefficients of the Lagrange multipliers. The core of the algorithm is how to define the penalty function. According to the rule of , Equation (3) can be translated into the following form:
Take partial derivatives with respect to and , thereout the following frequency domain expression is finally determined.
Among these, can be estimated according to the empirical formula of this paper, where M and N represent the size of R:
2.2.3. Fuzzy Image Recovery Tests (Constrained and Unconstrained Methods)
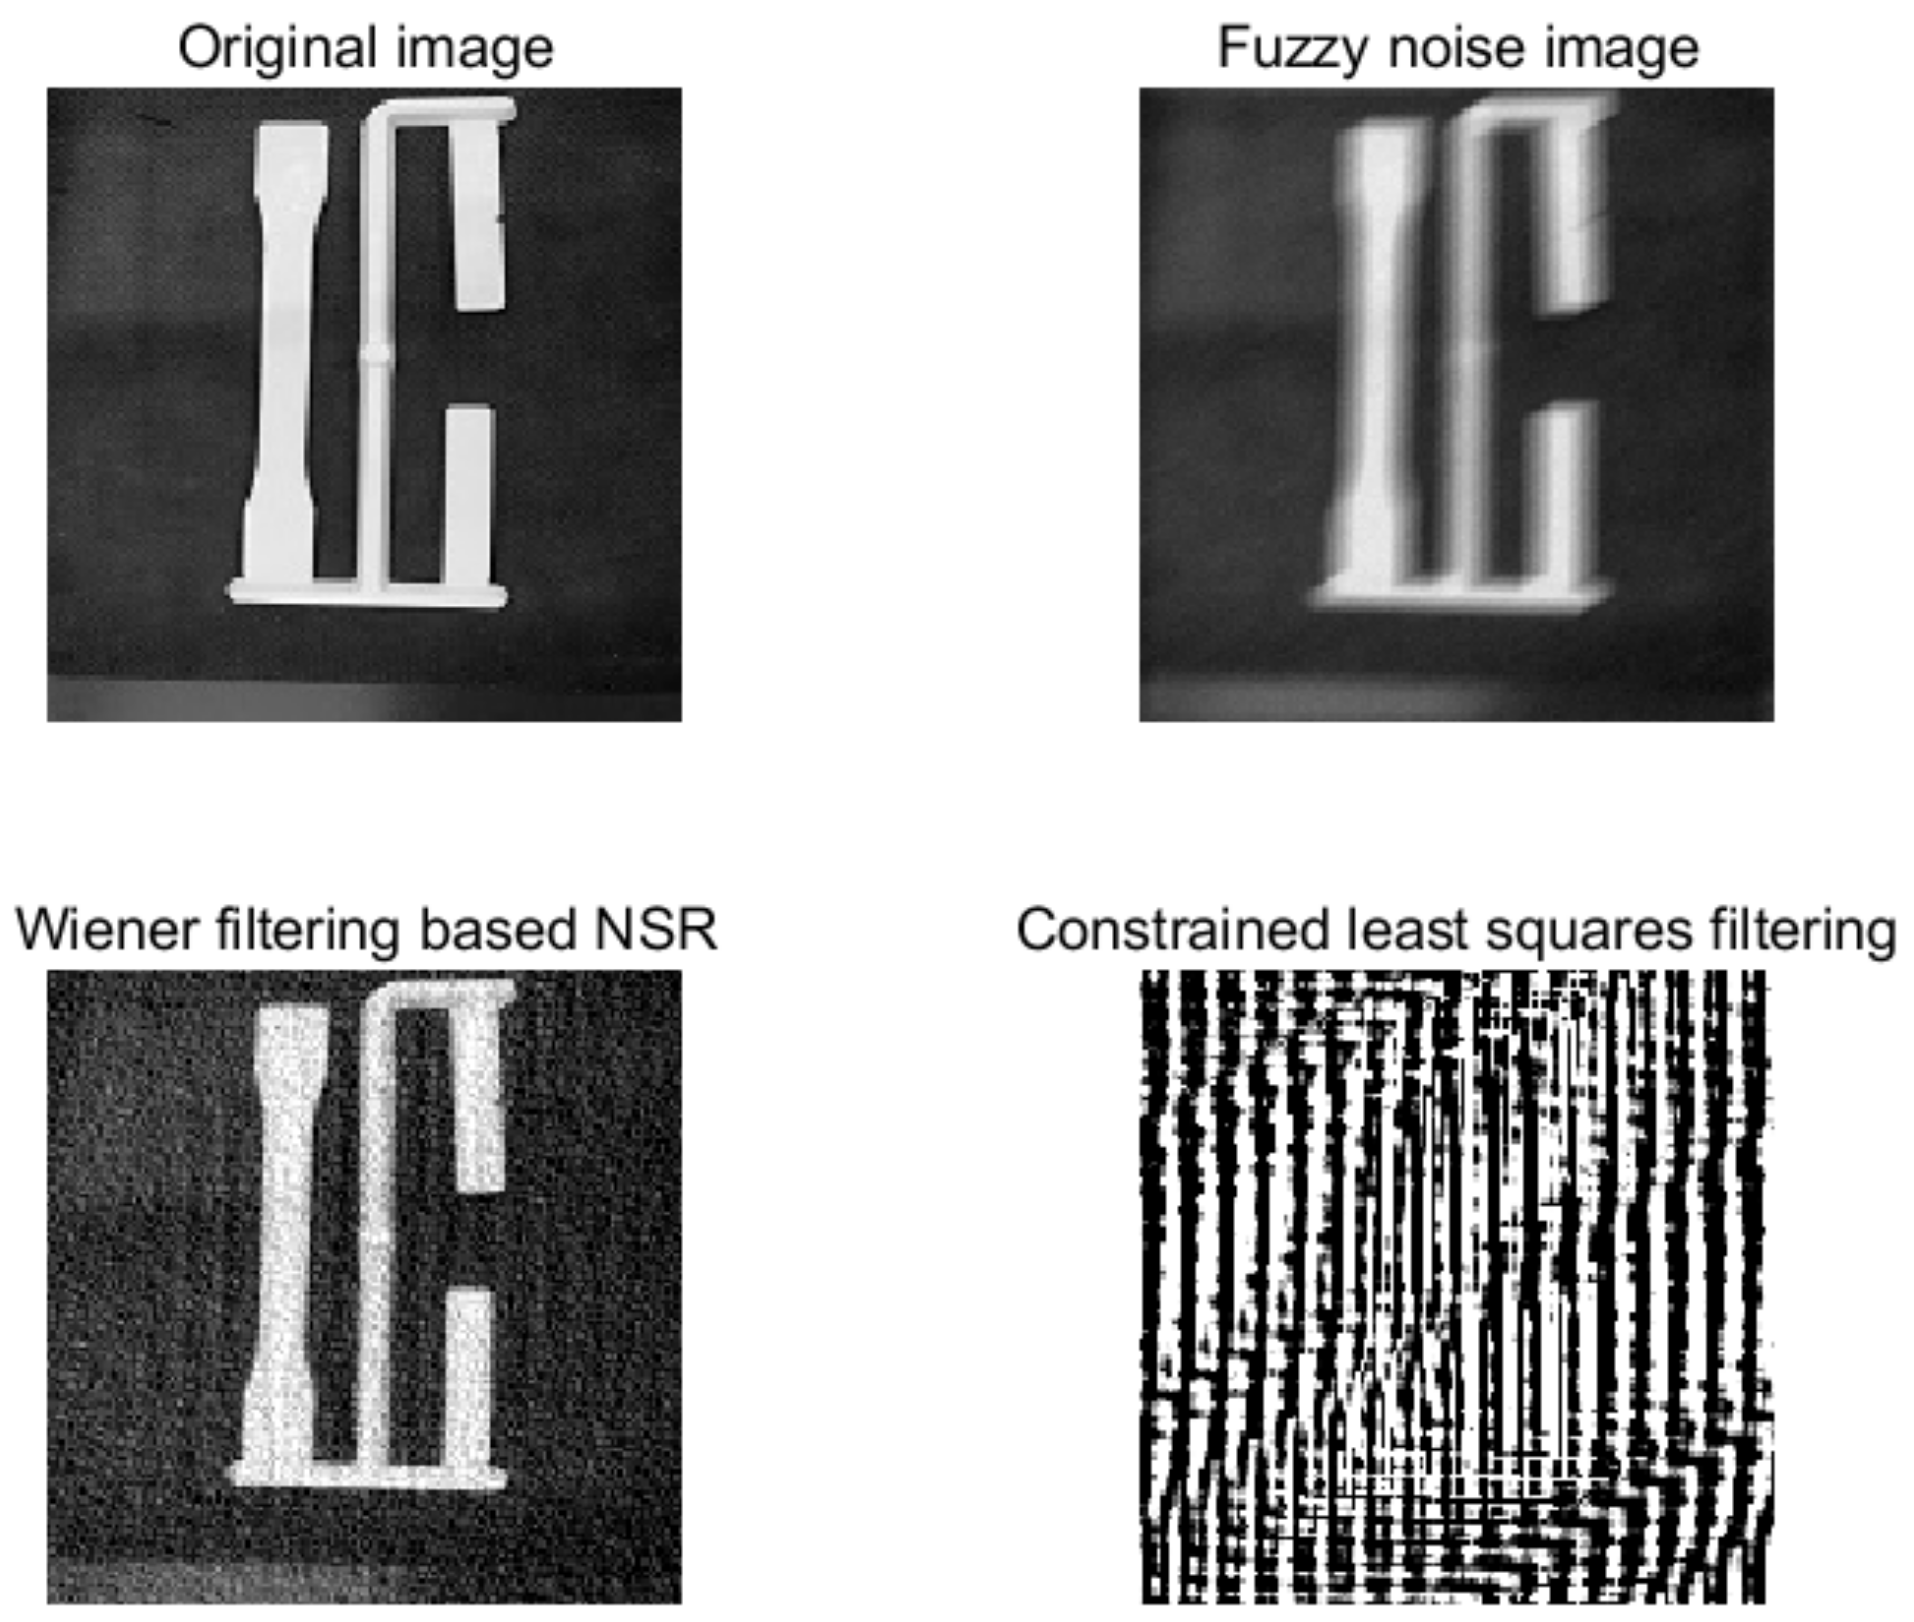
A point spread function(PSF) is created to cause the image to move linearly by 10 pixels in a direction of 30 degrees, and a normal distribution random number is used to simulate the noise signal to create the motion-blurred image as a result. Constrained least squares filtering and Wiener filtering are used to process the images, taking into account the noise-to-signal ratio K. The test results are shown in Figure 3. The image to be processed is shown in the upper right corner with motion blur and noise added, the restoration effect of Wiener filtering is shown in the lower left corner with K set to 0.0014, and the restoration effect of constrained least squares filtering is shown in the lower right corner. The experimental findings demonstrate that when the point spread function is known, the restoration effect of the Wiener filter outperforms that of the constrained least squares filter.
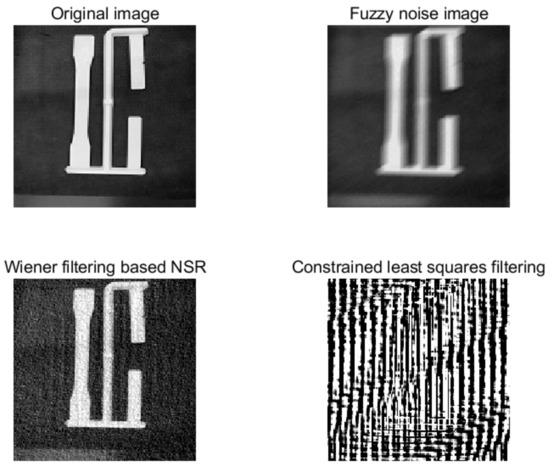
Figure 3.
Image restoration experiment of constrained filtering algorithm.
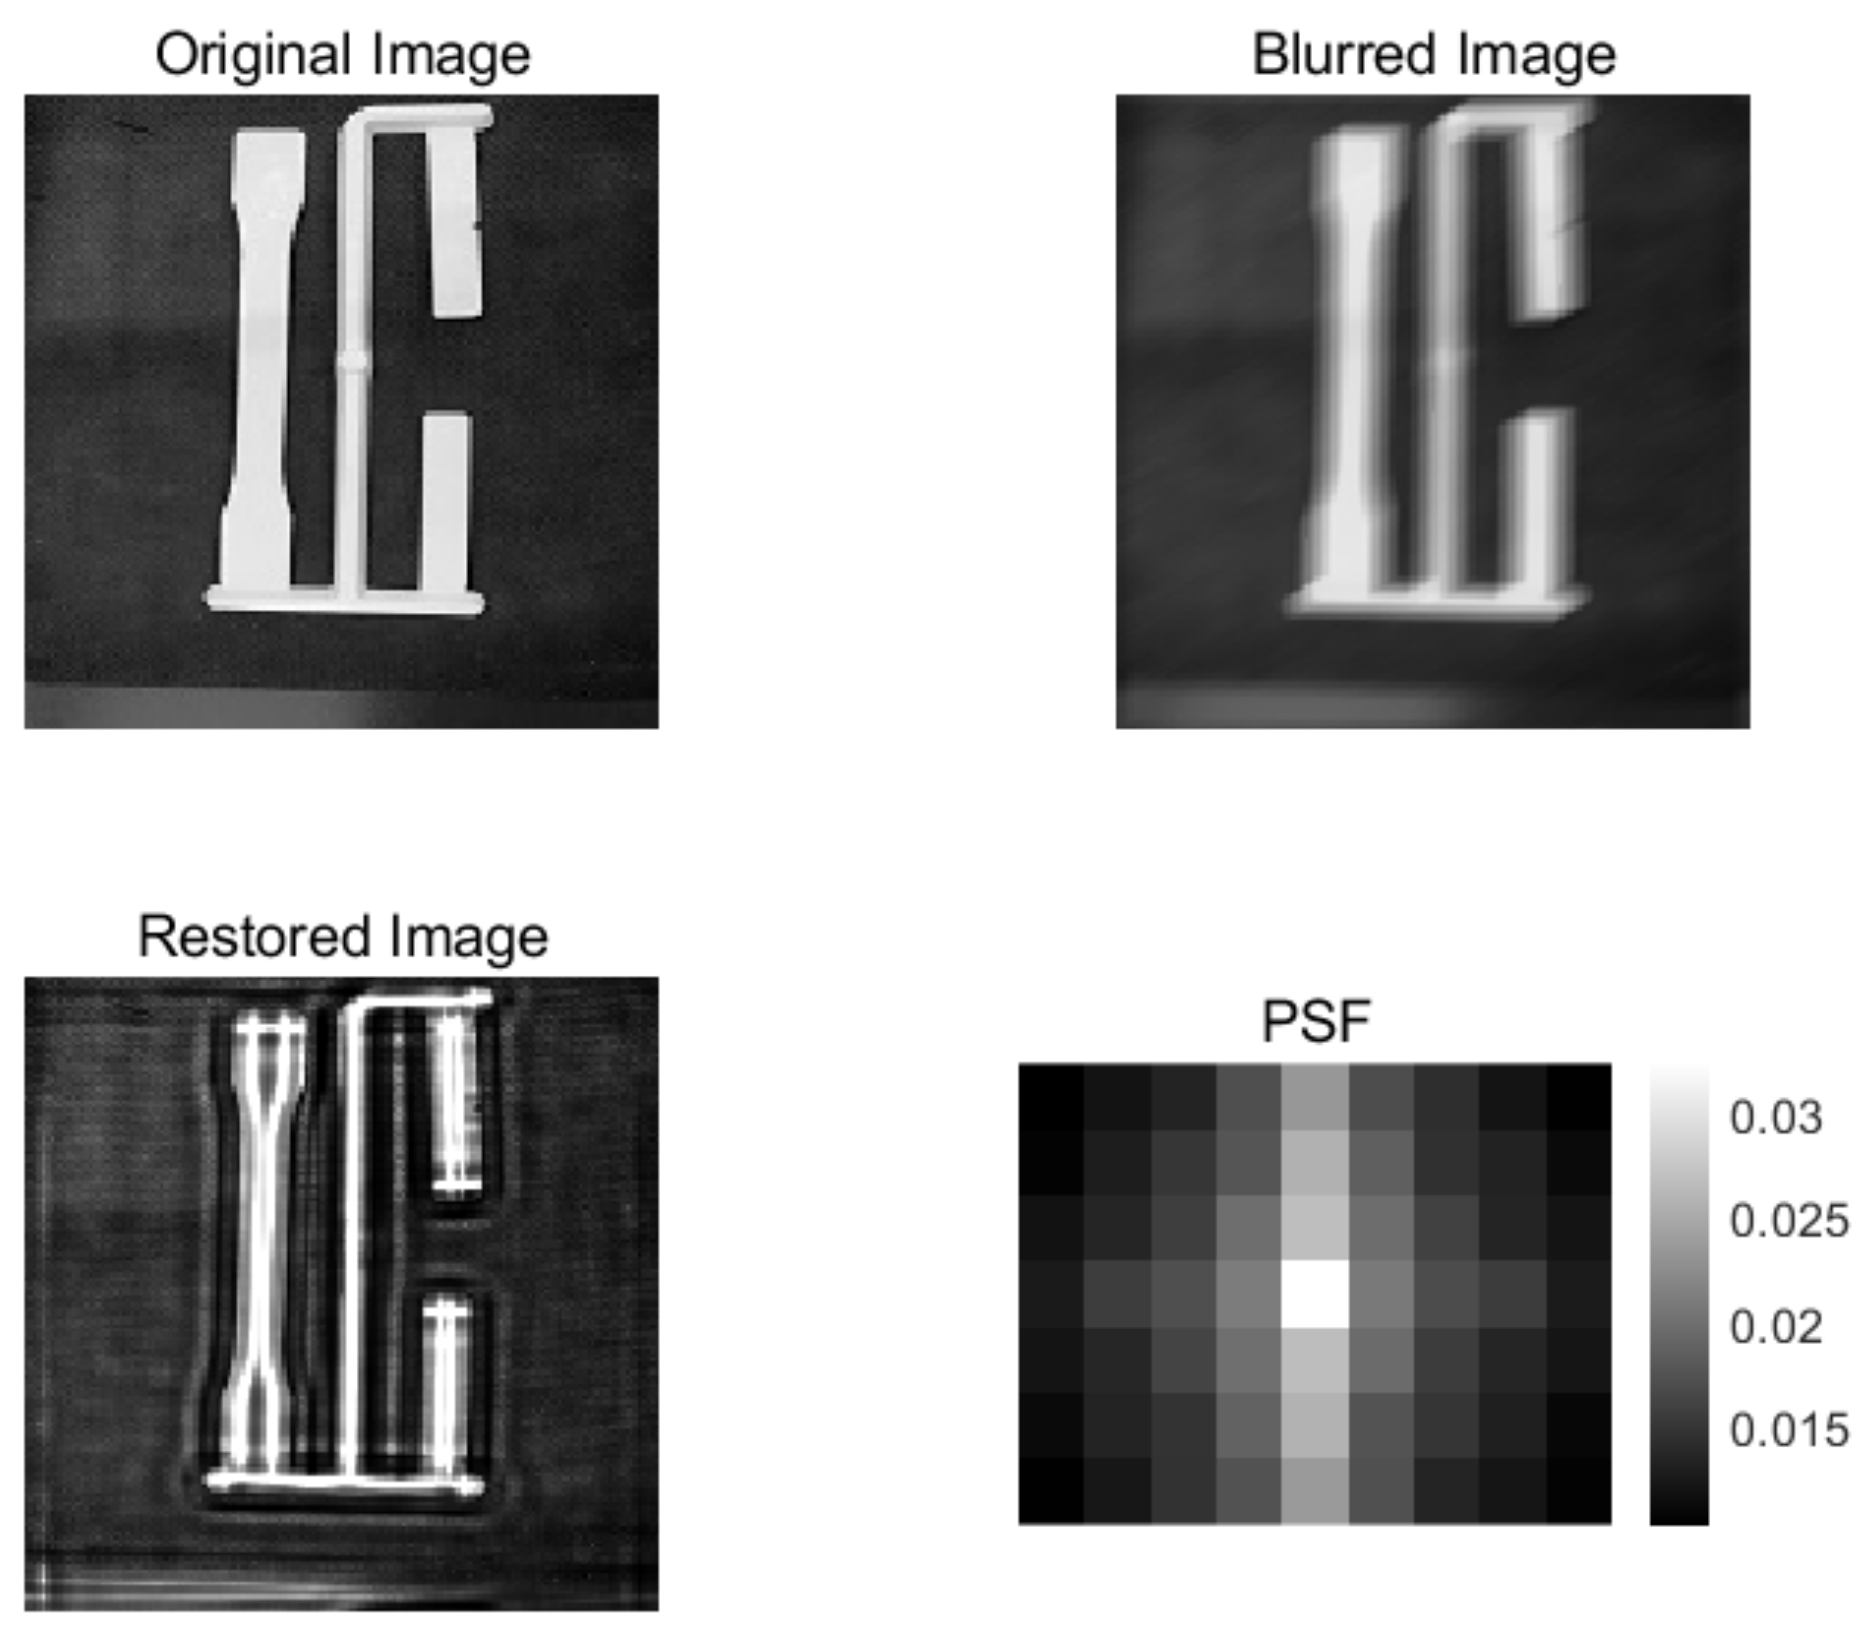
This paper uses the blind deconvolution algorithm to restore the below motion blurred image shown in Figure 4, because the point spread function is difficult to obtain accurately in the actual situation and the influence of noise in the actual production situation is also complicated.
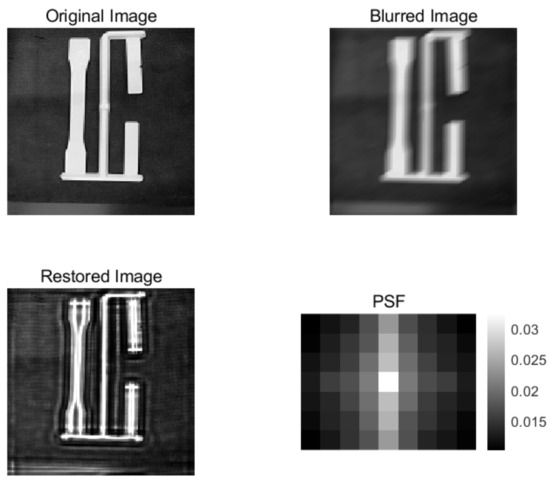
Figure 4.
Image restoration experiment of the blind deconvolution algorithm.
The lower left of Figure 4 displays the restoration effect of the blind deconvolution filtering, and the lower right corner displays the point spread function (PSF) that the blind deconvolution algorithm fitted. The application scene is more accurate to reality thanks to the algorithm’s effective recovery of the image’s edge and contour information. According to a number of experimental results, the blind deconvolution algorithm’s restoration effect is superior to the constrained least squares filter’s effect under the same circumstances and comes close to the Wiener filter’s performance. The blind deconvolution algorithm is used in this paper to restore the blurred image because it is more practical than the Wiener filter given the complexity of the actual working conditions.
2.3. Preprocessing of Plastic Components Images
2.3.1. Gamma Transform
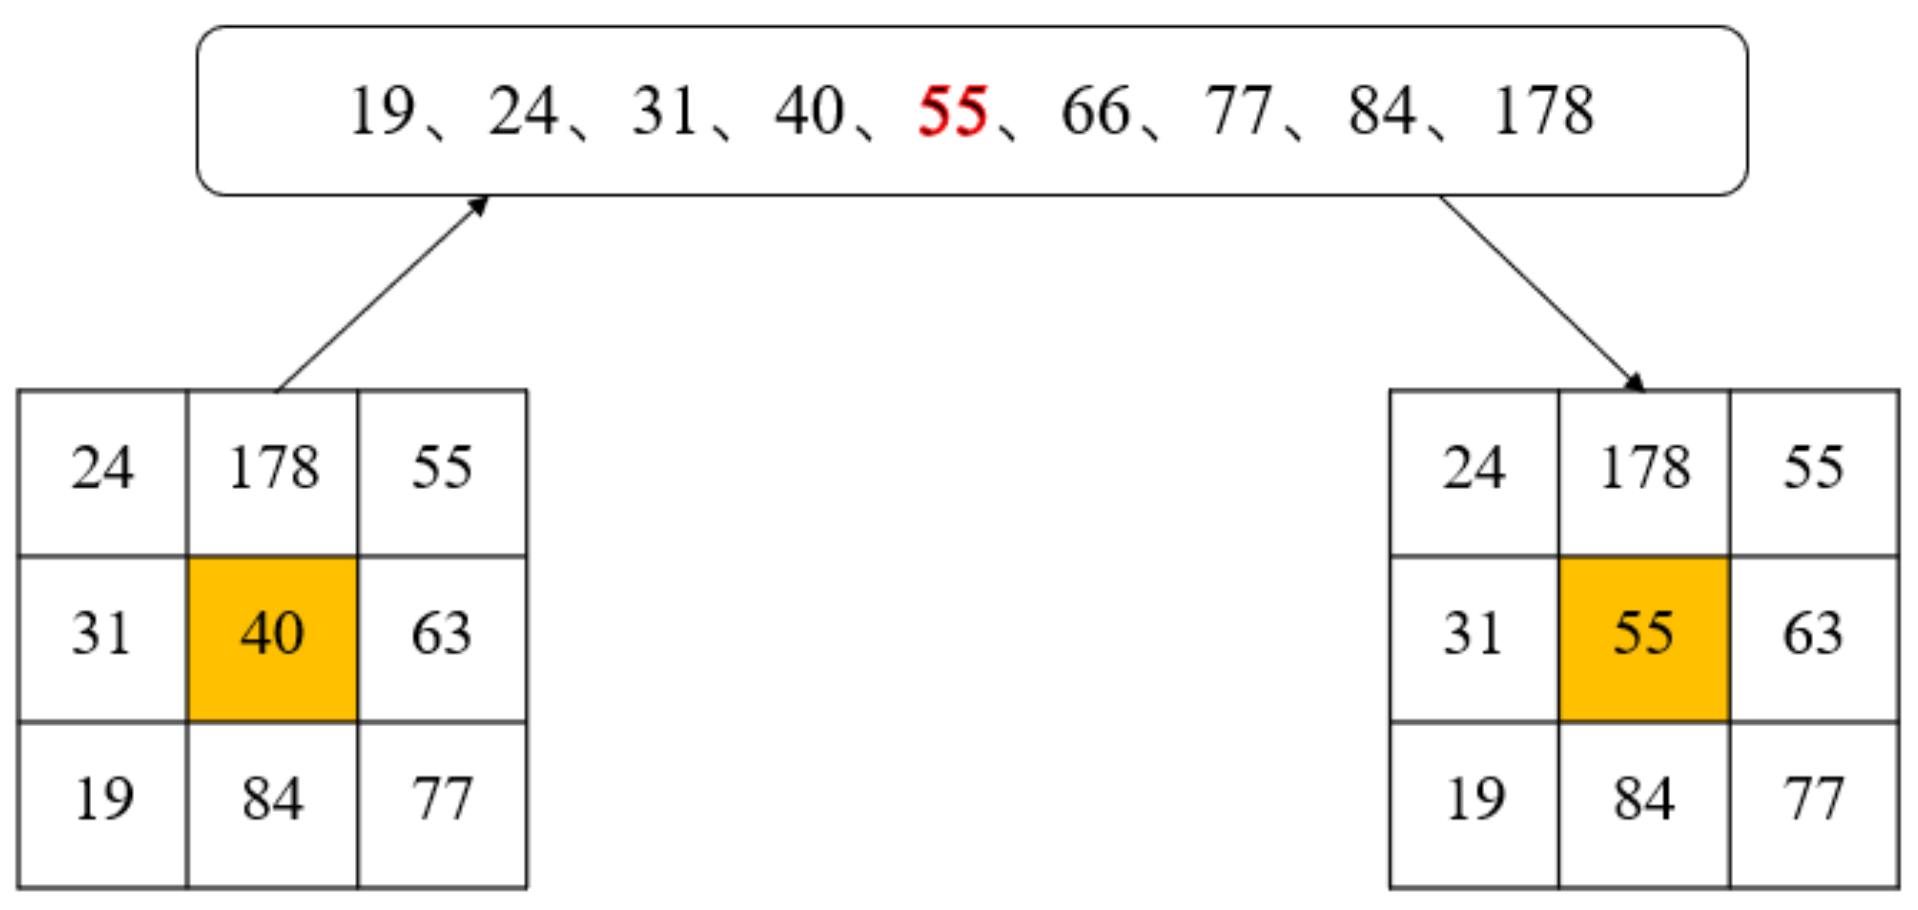
In order for the computer vision system to better understand the image during subsequent feature analysis, it is necessary to perform grayscale processing on the image before extracting image features. In this experiment, the grayscale is processed using the gamma transform method. The gamma transform is a nonlinear operation on the gray value of the input image, resulting in an exponential relationship between the gray value of the output image and the gray value of the input image:
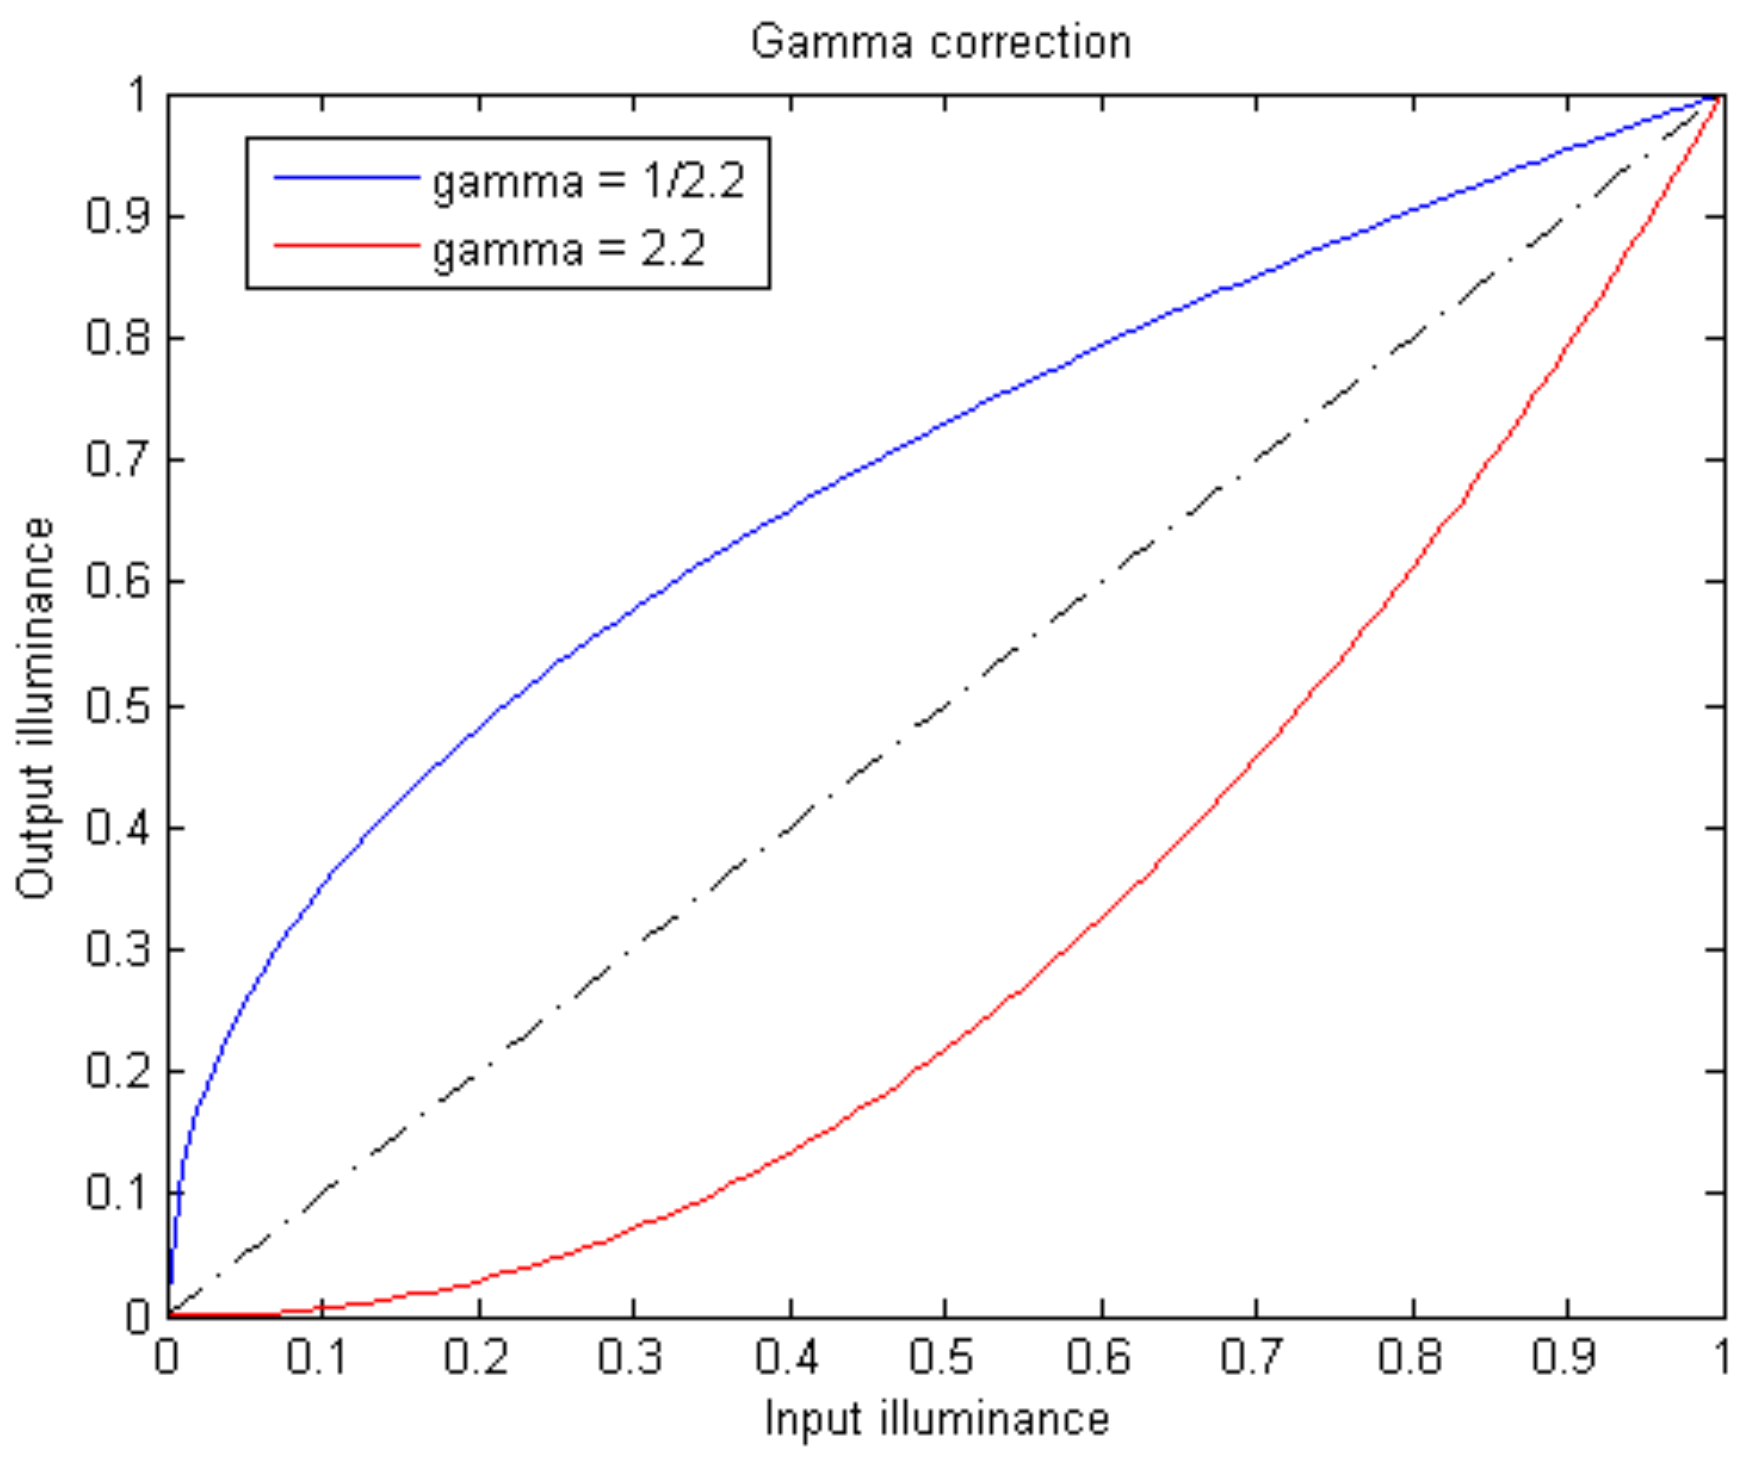
The name of this index is Gamma. In this study, the experimental parameter Gamma is set to 2.2, and the red curve in Figure 5 depicts the relationship between the gray values of the input and output images. When the gray value is transformed and output, the change speed is improved, the contrast of the image’s highlighted region is increased, and the exposure issue is fixed while the gray value significantly decreases in the low gray value area of the red curve in the high gray value area.
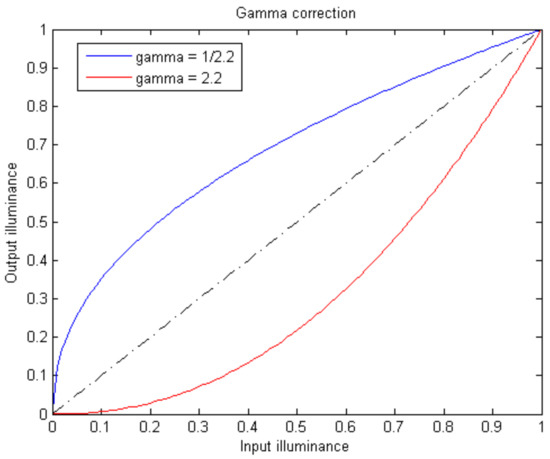
Figure 5.
Gamma correction.
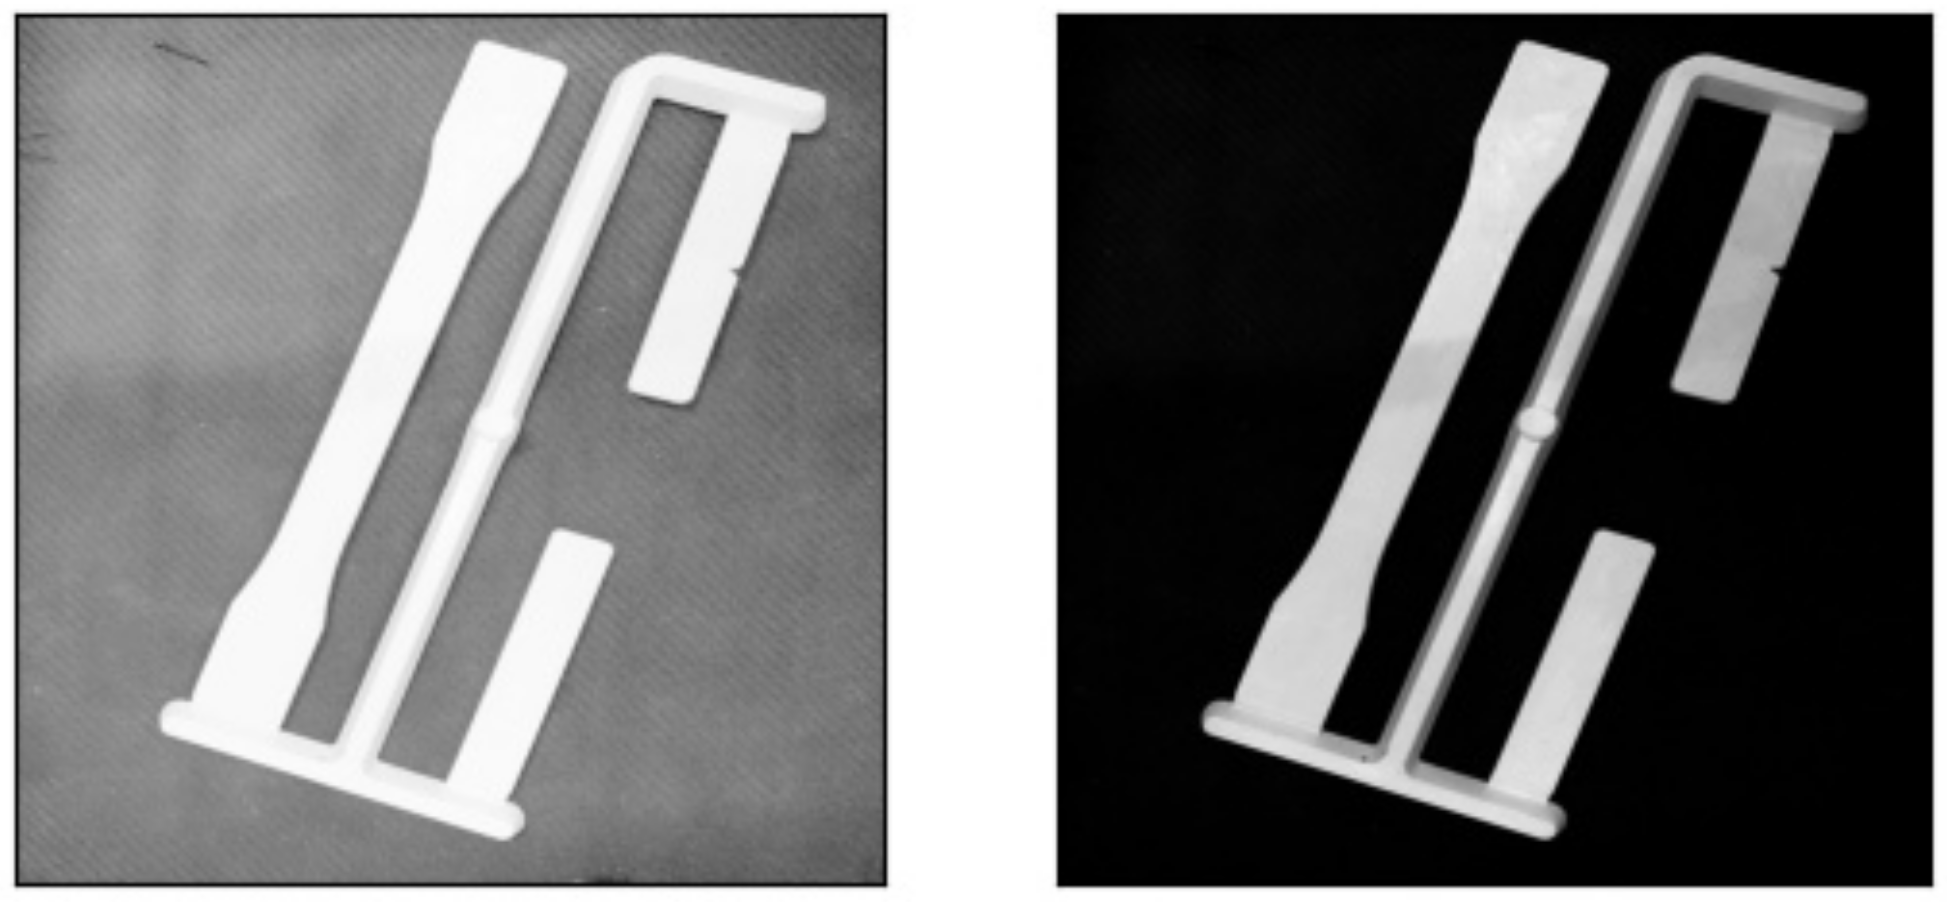
In this paper, the image dataset is gray-processed based on gamma transform. Taking an qualified image as example, Figure 6 shows the actual effect of gamma change.
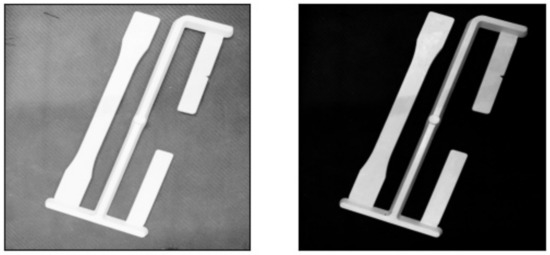
Figure 6.
The original image and the image after gamma transformation. Original image is at left, the same image after gamma transform is at right.
2.3.2. Image Smoothing
As can be seen from a comparison of the three processing results, the weighted average method falls short in addressing the exposure problem, whereas histogram equalization strengthens the exposure phenomenon. This will have an effect on the ensuing feature extraction. After using the gamma transform technique, the background noise can be significantly reduced and the exposure problem can be better controlled. This paper finally uses the gamma transform, a grayscale processing method, to process the original data.
The basic idea behind median filtering is to replace the pixel value that corresponds to the convolution kernel’s center with the median of the pixels within the filter’s convolution range. The filtering process is then finished by repeatedly traversing and sorting the image matrix. The algorithm has good robustness to speckle noise and salt and pepper noise because median filtering does not depend on points within the filter that are too different from the typical value (generally considered noise).
In the formula, represents the neighborhood of the current point, and is the final output value. Figure 7 illustrates the median filter’s fundamental idea. In this paper, median filtering was applied to the image with a window width of 5 × 5, which can not only reduce noise but also better preserve the texture features of the image.
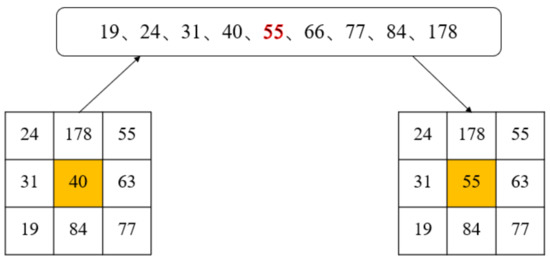
Figure 7.
Schematic diagram of median filter.
2.4. Feature Extraction of Image Datasets Based on Canny Algorithm
The Canny algorithm was proposed by John Canny [34] and has endured since its introduction. Much work [35,36,37] has been undertaken on the four core steps of the Canny algorithm, which is considered to be one of the most effective classical algorithms for edge detection. In this study, the edge information was chosen as the image feature, and the Canny algorithm was used to obtain the edge information. Three criteria for edge operators are suggested by the Canny algorithm.
- (1)
- The signal-to-noise ratio standard
Correct edge information should not be overlooked during the edge detection process, and noise information should not be misinterpreted as an edge. The introduced signal-to-noise ratio is recorded as SNR, and the larger the SNR, the higher the quality of the extracted edges. The two aforementioned objectives are monotonic functions of SNR.
- (2)
- Positioning Accuracy Guidelines
The algorithm’s edge points should be as near as possible to the actual edge’s center. The non-maximum suppression theory is put forth in the Canny algorithm to realize this criterion. Let L represents the edge positioning accuracy.
- (3)
- Single edge unique response criterion
When different answers are given for the same edge, only one of them can be proven to be accurate, and the others must be rejected. The average distance of the zero-crossing points of the detection operator’s impulse response function should be satisfied in order to guarantee the accuracy of the chosen response:
The optimal approximation operator of the product of signal-to-noise ratio and localization, which is comparable to the first-order derivative of the Gaussian function, is the Canny edge detector, which combines functional theory. The algorithm’s basic operation entails processing the image using a Gaussian smoothing filter, calculating the gradient direction and amplitude of each image pixel, using a non-maximization suppression algorithm to further determine the edge information, and then using a heuristic edge determination method based on double thresholds for complete edge removal.
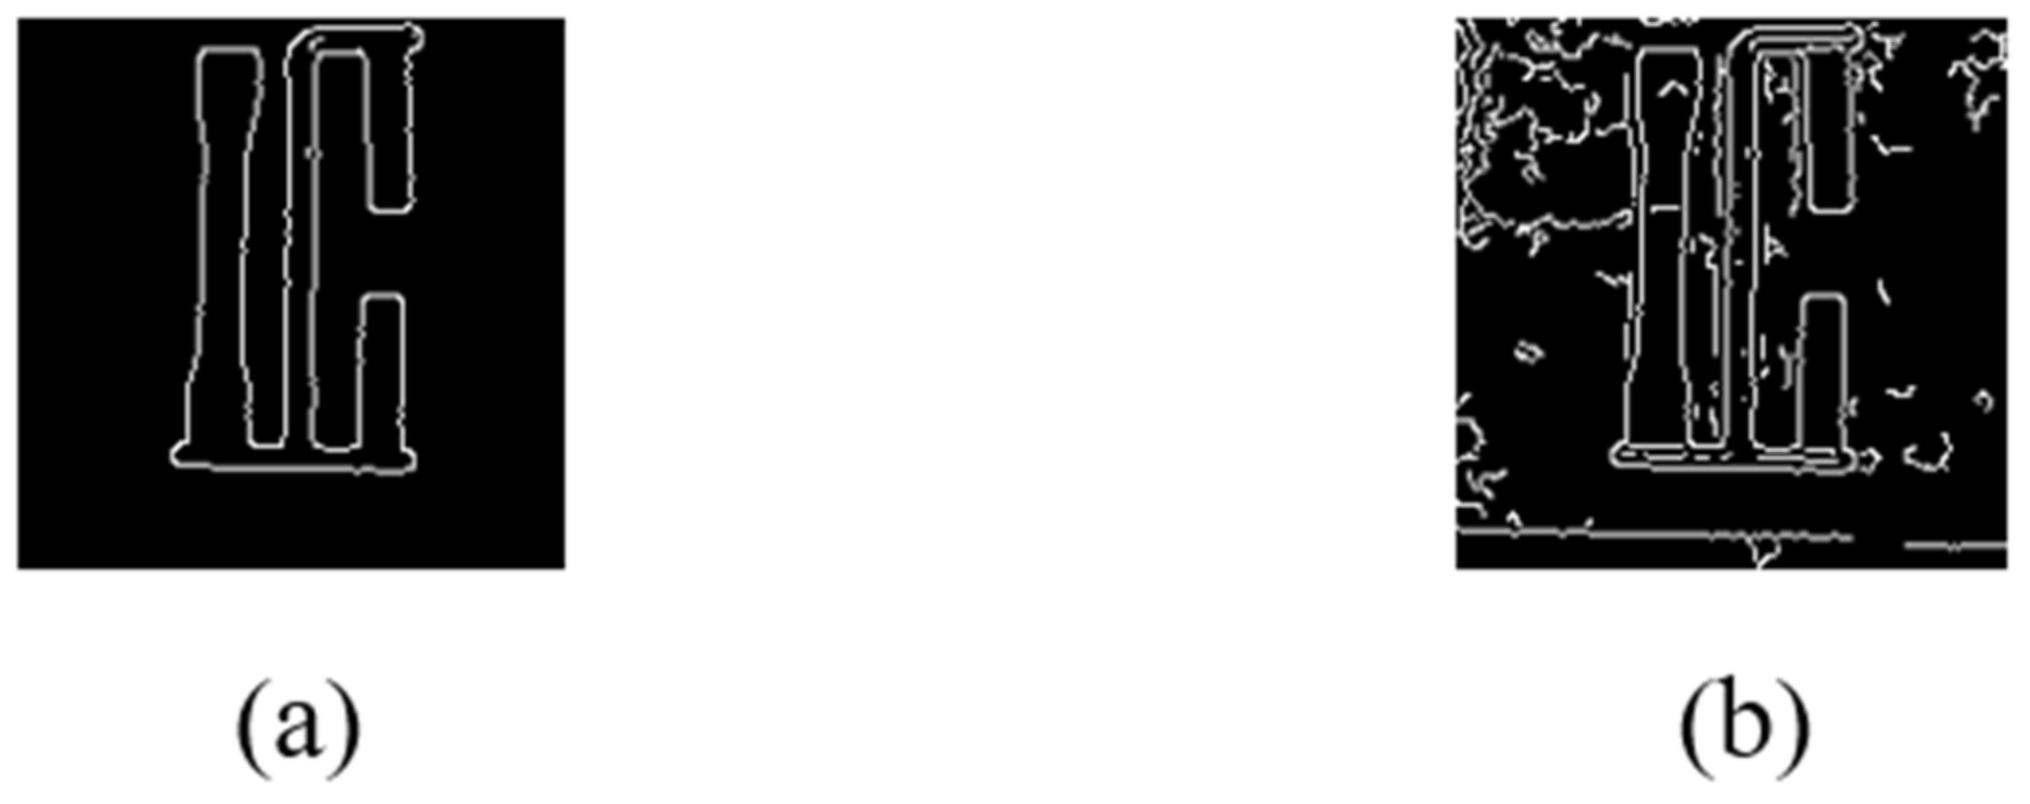
Based on the generalized function theory, the Canny edge detector is the optimal approximation operator of the product of SNR and location, which is similar to the first derivative function of a Gaussian function. In the image data set, a qualified workpiece image is selected, and the edge information is extracted by Canny operator after preprocessing, so as to establish a database for vision and deep learning tasks. The feature extraction results of standard templates and various defect images are as follows:
Establish the standard template as Figure 8. The experiment demonstrates that it is easier to gather the semantic information of the image when using a high threshold for edge extraction.
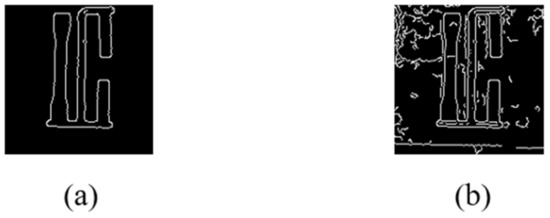
Figure 8.
(a) The high (200, 240) (b) and low (20, 40) thresholds.
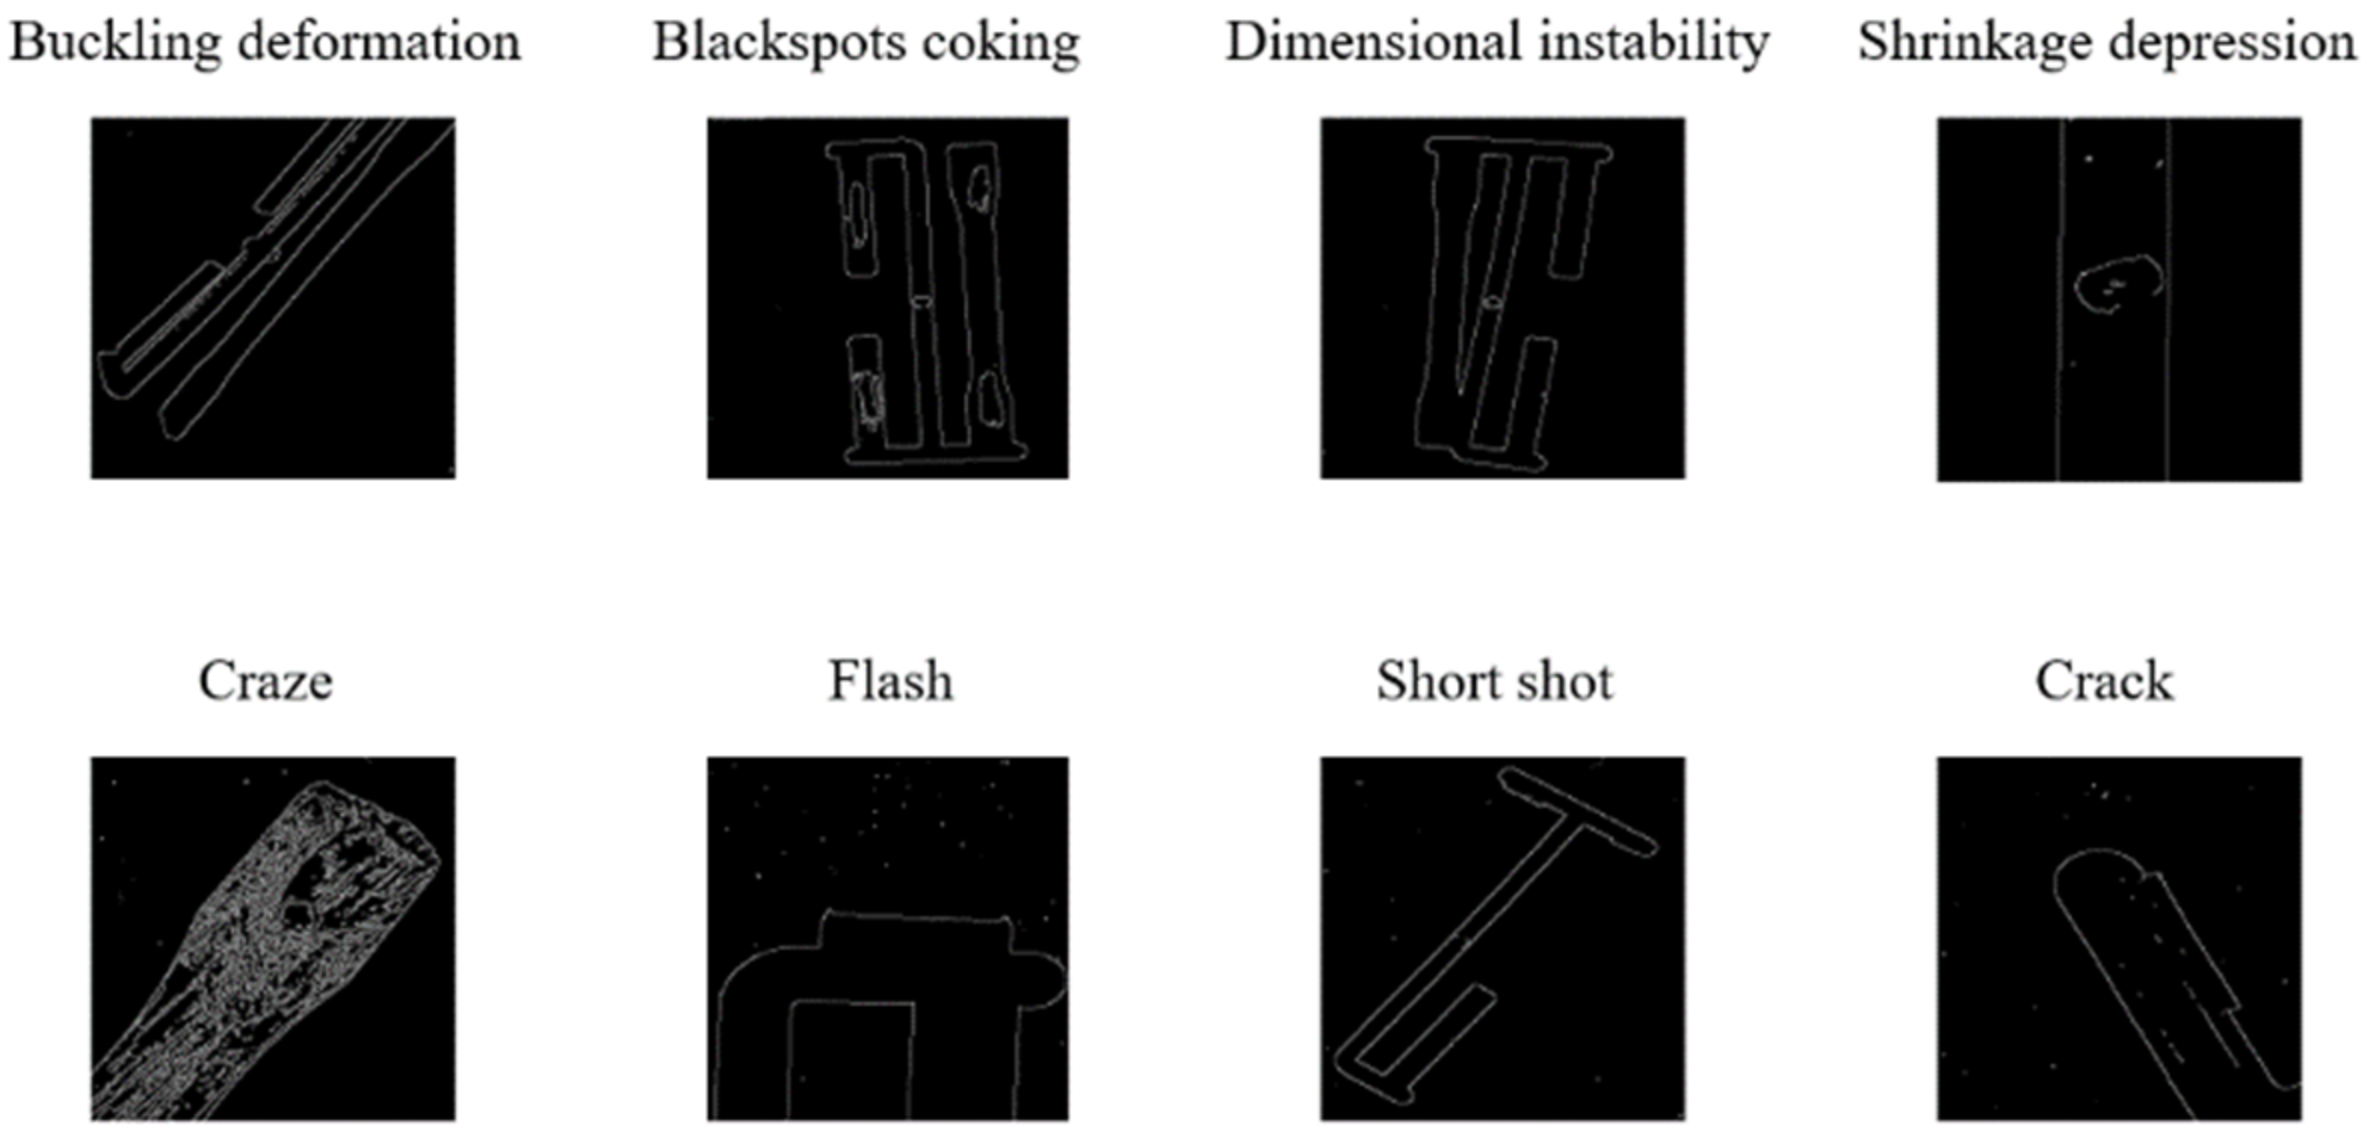
Feature extraction of eight types of defect images by high threshold as Figure 9.
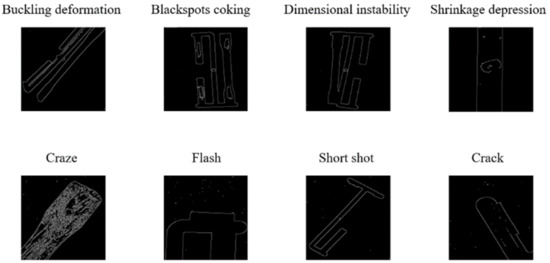
Figure 9.
Edge feature information of various defect images by Canny algorithm.
3. Template Matching Mechanism Based on Arbitration Function
3.1. Matching Algorithm Based on Hu Invariant Moments
Many characteristics of the image’s edge contour are present, and these characteristics form the realistic basis for the template matching mechanism suggested in this paper. Moment is a crucial operator for describing image features. Moment is a feature obtained by integrating all points on a contour. It is frequently employed in motion image sequence analysis, image matching, image reconstruction, and pattern recognition. Moments are used in mechanics to describe the spatial relationship of matter, in statistics to characterize the distribution of random variables, and in image processing to describe the distribution of pixels. The description of the pixel distribution by the image moments can reflect the shape characteristics of the image. The relationship between pixels and the image origin moment and centroid moment is used to reflect the characteristics of the image, which has good stability and generalization ability. The image is a two-dimensional or three-dimensional space. The second-order moment’s mathematical meaning is variance, while the third-order moment’s mathematical meaning is skewness.
3.1.1. Numerical Calculation of Hu Moments
Hu moment invariant theory was first proposed by M.K.Hu in 1962 [38]. The Hu moment is a collection of moment invariants made up of nonlinear combinations of moments. It effectively addresses template matching by having rotation, translation, and scaling invariance. Changes to scale, image translation, coordinate transformation, and rotation, among other things, occur during the process. The origin moments of the order of Hu moments are as follows, where p and q are the order of the horizontal and vertical distances in image pixel coordinates, respectively.
Specifically, Hu moments are seven invariant moments calculated from the second-order and third-order central moments, and the calculation formula is as follows:
The HU moment data of the template image established in this paper are obtained through experiments and shown in Table 2:

Table 2.
This table shows the HU moment data of the template image.
3.1.2. Contour Matching Algorithm Based on Hu Moments
Hu moment-based contour matching, is to use the matching result as a measure of geometric contour similarity. The smaller the value, the closer the “distance” between the image and the template, the higher the degree of similarity between the two. The matching method is shown in Equation (14):
In the Equation (14), denotes the matching result, i corresponds to the image sequence, j denotes the matching times of the same image. A represents the standard template, B represents the previous images to be tested. K represents the kth Hu moment of images. As for the template, this algorithm’s matching accuracy ranges from 0.0871 to 0.1517.
3.2. Plastic Template Matching Mechanism Based on Arbitration Function
The lower limit of accuracy for recognizing qualified plastic components is recorded as threshold , = 0.15. A qualified image is one for which the image matching result falls below the threshold; otherwise, it is categorized as a defective image. The matching mechanism achieves the initial classification of plastic components, and, in the subsequent work, it will carry out fine classification based on deep learning.
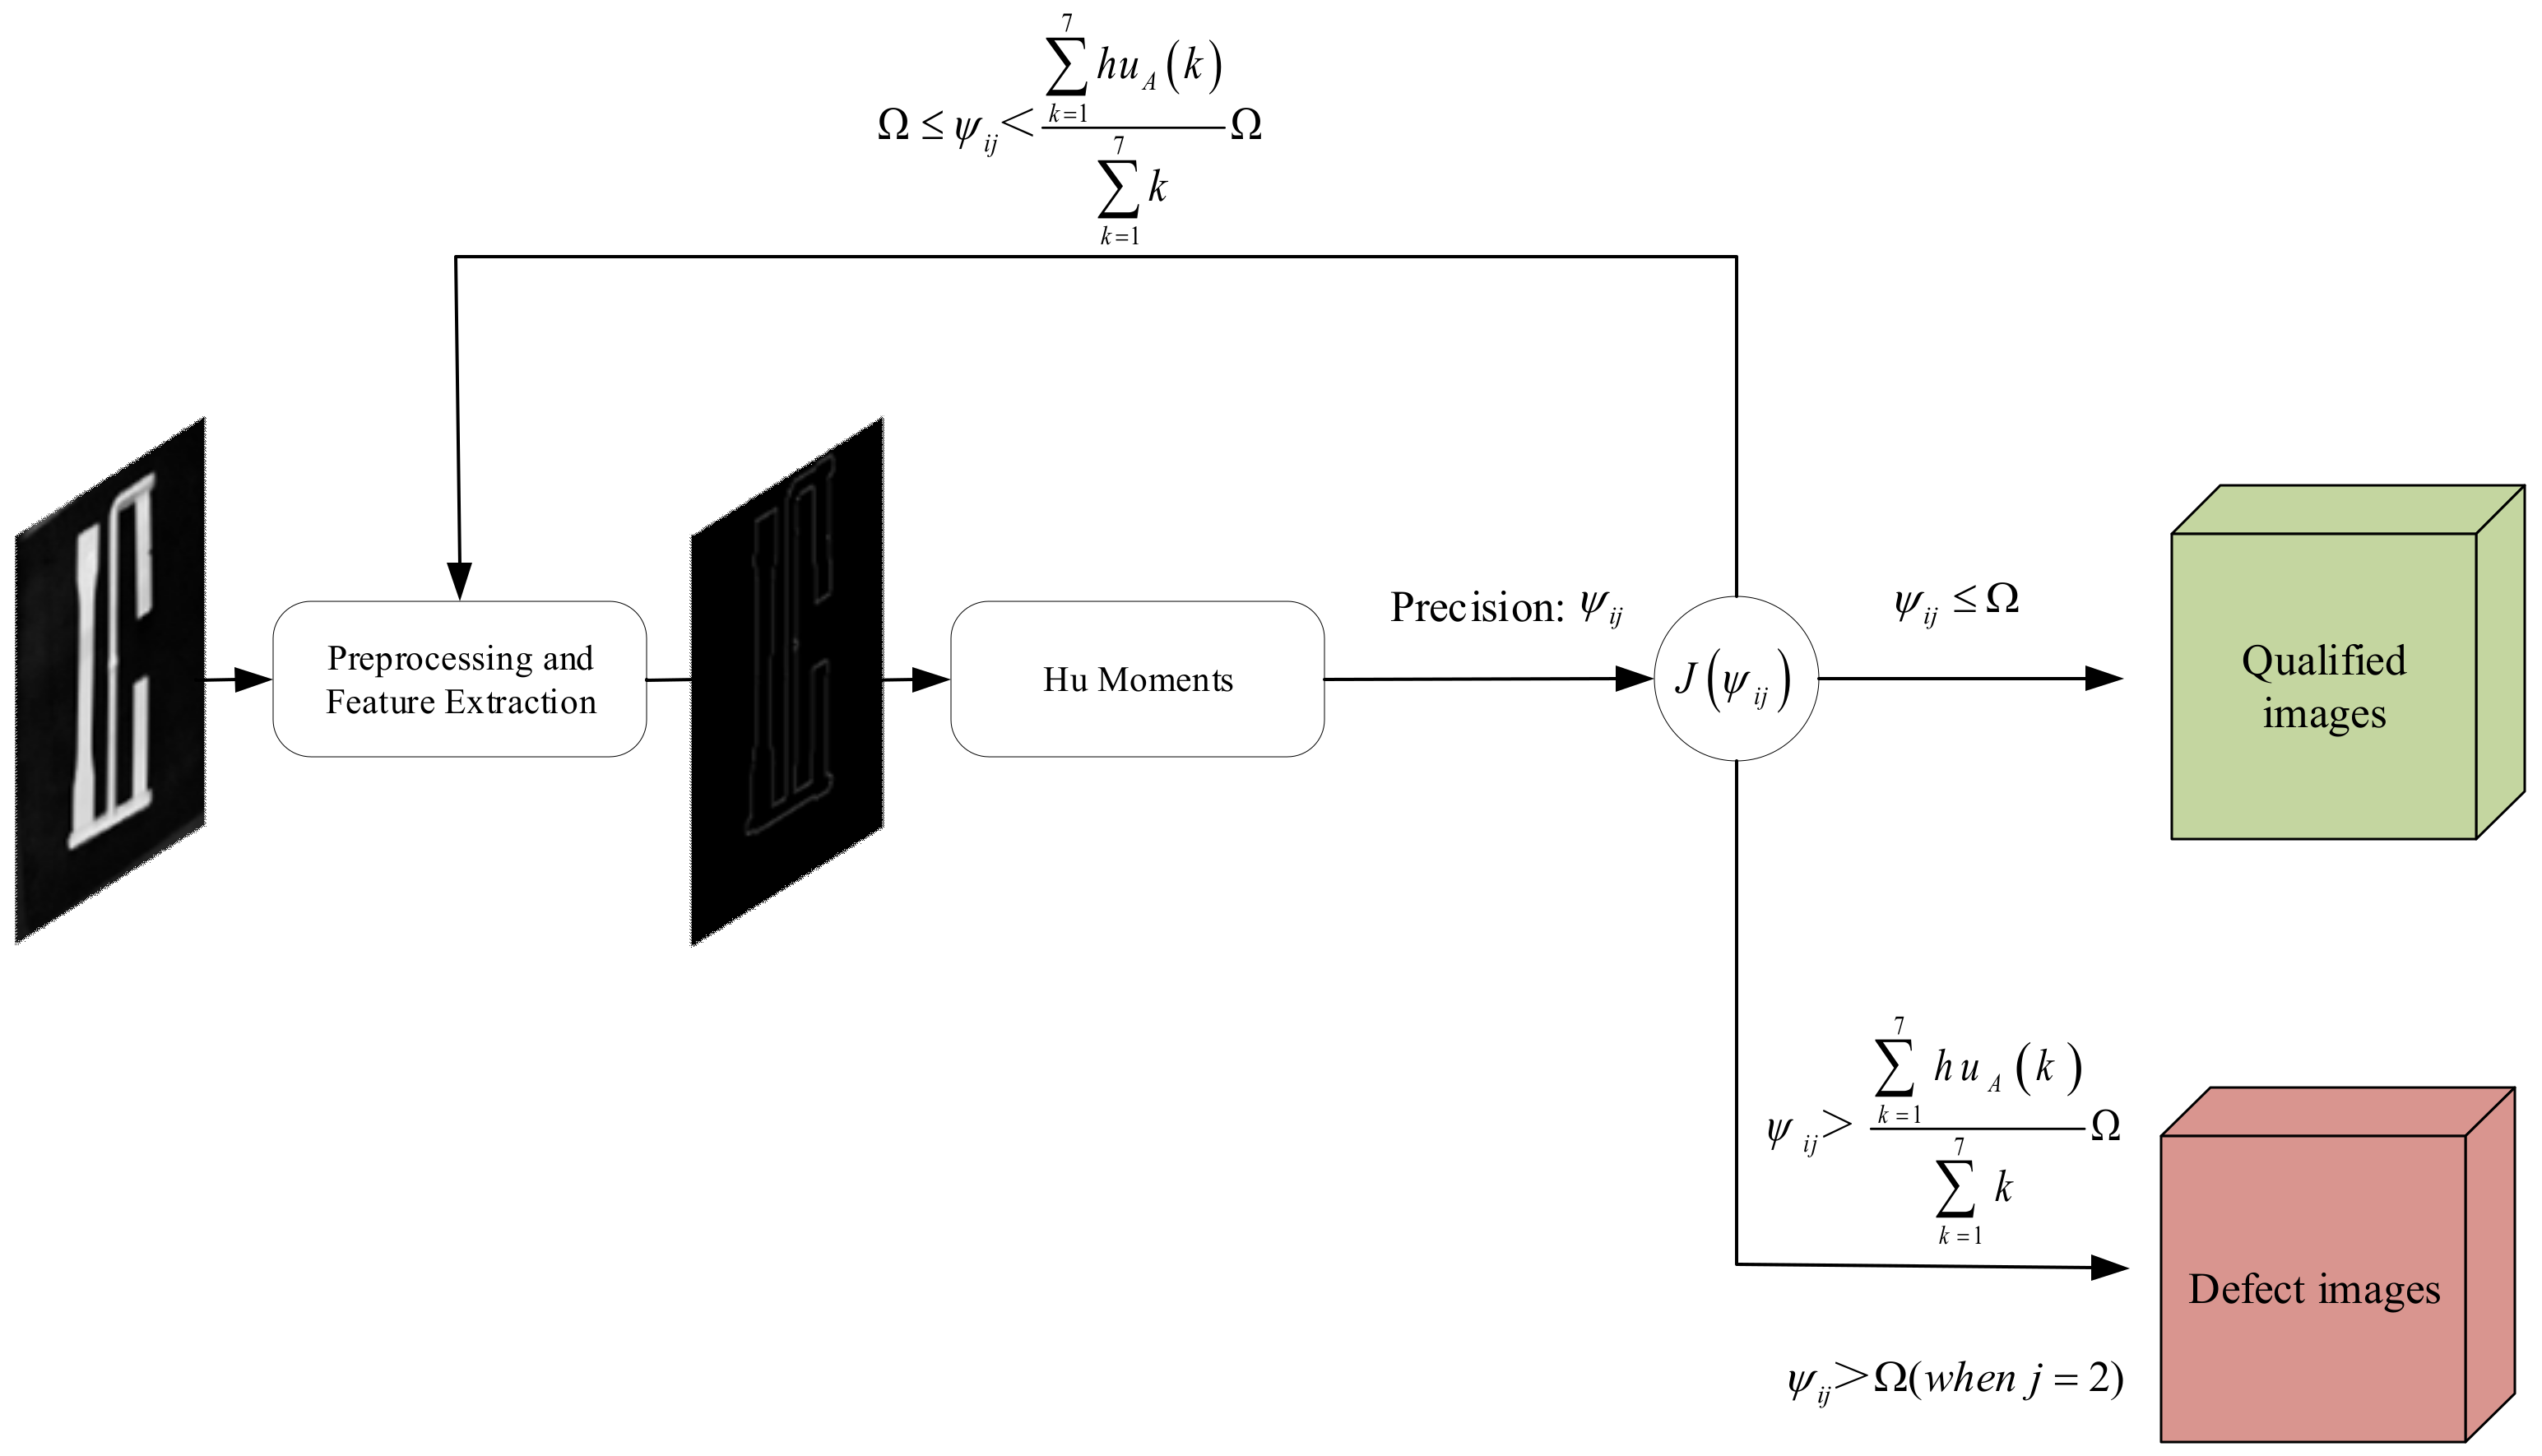
After obtaining Hu’s matching accuracy data, this paper proposes a new concept of arbitration function . A specific matching mechanism is formed through the arbitration function : if the function value is 0 ( is higher than the threshold but less than its statistical scaling value), the image can be preprocessed twice, and the feature information is further extracted before a secondary matching, if the second matching accuracy is still greater than threshold , the tested image is regarded as defect image. If the function value is 1 (the matching accuracy is lower than the threshold), the component represented by the image is a qualified product. If the function value is −1, the component is immediately classified as part of a defect image dataset.
In the Equation (15), i represents the number of the image to be tested, j represents the number of times the same image is input to the arbitration function, . represents the Hu invariant moments of the template image.
The matching mechanism proposed in this paper is visualized in Figure 10.
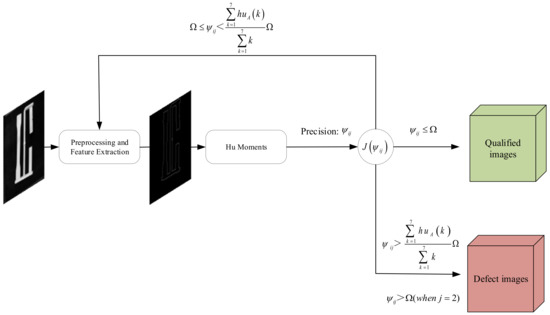
Figure 10.
Matching mechanism between the tested image and the standard template.
The following Table 3 shows the matching values for each type of defect image:

Table 3.
Matching test of nine types of images on Hu moments.
According to the experimental results, the Hu moment matching algorithm is robust when matching defect images and has size invariance for rotation, translation, and scaling. Qualified data show a clear distinction between the qualified images and the defect ones. The matching mechanism based on Hu theory developed in this paper achieved the initial evaluation of the components qualification from visual inspection.
4. Fault Classification Based on Improved VGG16
4.1. VGG16 Convolutional Neural Network Overview
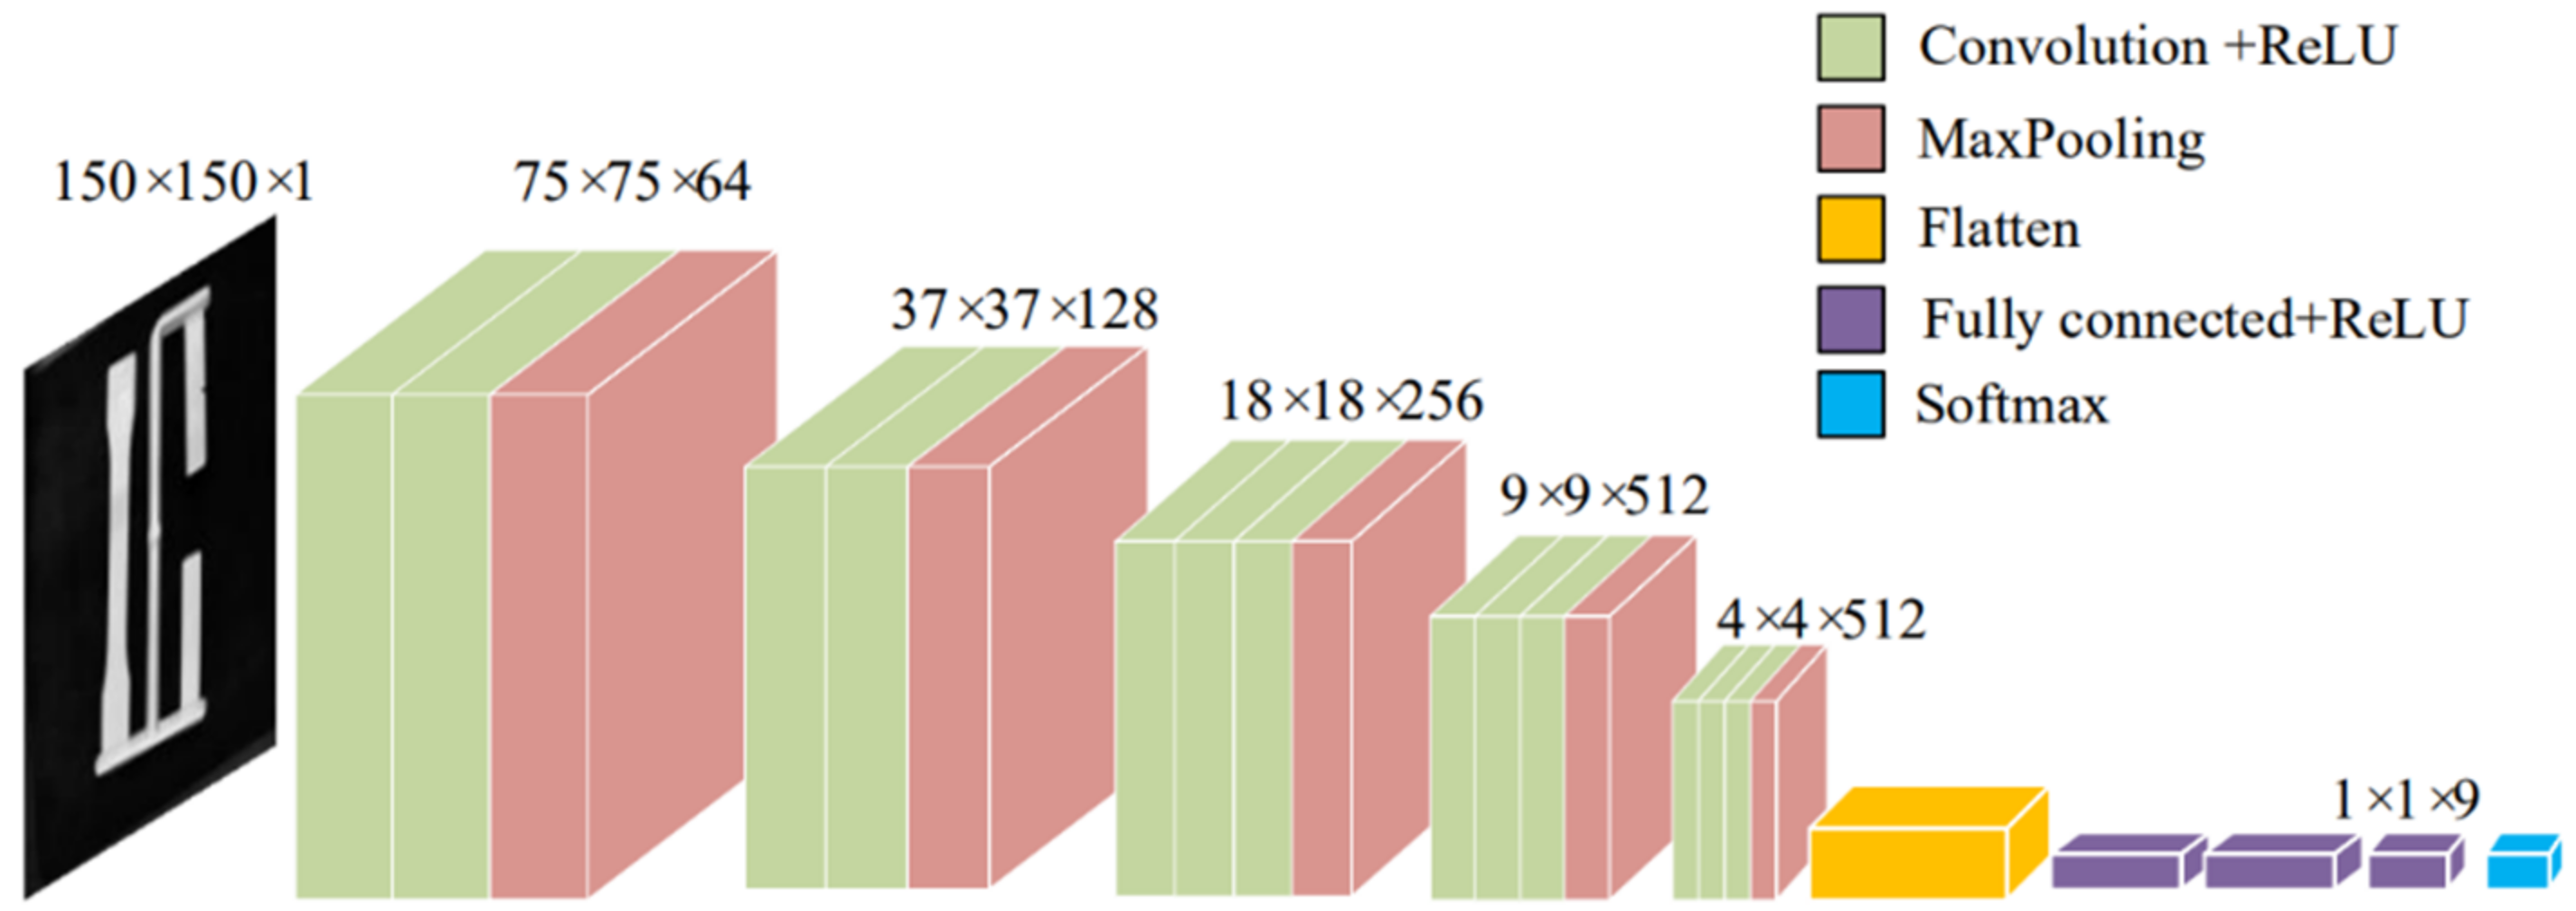
VGGNet is a deeper model than the AlexNet network proposed by the Visual Geometry Group team [39] at the University of Oxford. This study is based on the more traditional VGG16 structure, which is a kind of feedforward neural network. Each layer’s neuron nodes begin at the input layer to take in the data and information transmitted by the layer beneath them, process that data, and then output them. Figure 11 depicts the one-way, multi-layer structure of the VGG16 deep neural network.
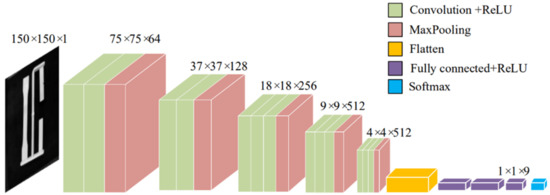
Figure 11.
VGG16 Convolutional neural network structure diagram.
4.2. Fault Diagnosis Classification Test Based on Traditional VGG16
4.2.1. Data Set Preprocessing and VGG16 Network Parameters
The data set that was processed in the prior step contains the experimental data used in this paper. The experiment’s network parameters were set up in accordance with Figure 11. Convolutional neural networks must first undergo some preprocessing on the dataset in order to make training easier: To calibrate the names of the different defect labels in the dataset, the one-hot encoding tool is first introduced. Variables are transformed into binary representations that machine learning algorithms can recognize and use. Each category needs to be separate from the others in order for the coding tool to work. The data set’s tensors must also be normalized to increase the network’s classification accuracy. The pertinent equation is as follows:
Following these preprocessing steps, the entire data set is randomly split into a training set and a test set with an 80/20 split. The concept of the difference between the test set and the validation set is not stressed in this paper because of the small size of the data set. A number of conventional hyperparameters will be used to test the VGG16 convolutional neural network that was used in this study. The root mean square forward gradient descent algorithm is the algorithm that the optimizer chooses, and the loss function uses the categorical cross-entropy function (RMSProp). In addition to solving the adaptive gradient algorithm, the learning rate might drop suddenly, and the algorithm for preventing decay differs from the standard momentum SGD algorithm. It keeps each of the adaptive gradient algorithms while calculating the second-order momentum using the weighted average of the window sliding. To benefit from the learning rate, the parameters can be adaptively updated. The activation functions used in this experiment’s convolutional layer and fully connected layer are both ReLU functions, and the accuracy rate has been chosen as the network’s evaluation metric. The initial learning rate of the network is set to , the training process’s batch size to 256 and the training epoch to 50.
4.2.2. Analysis of Test Results
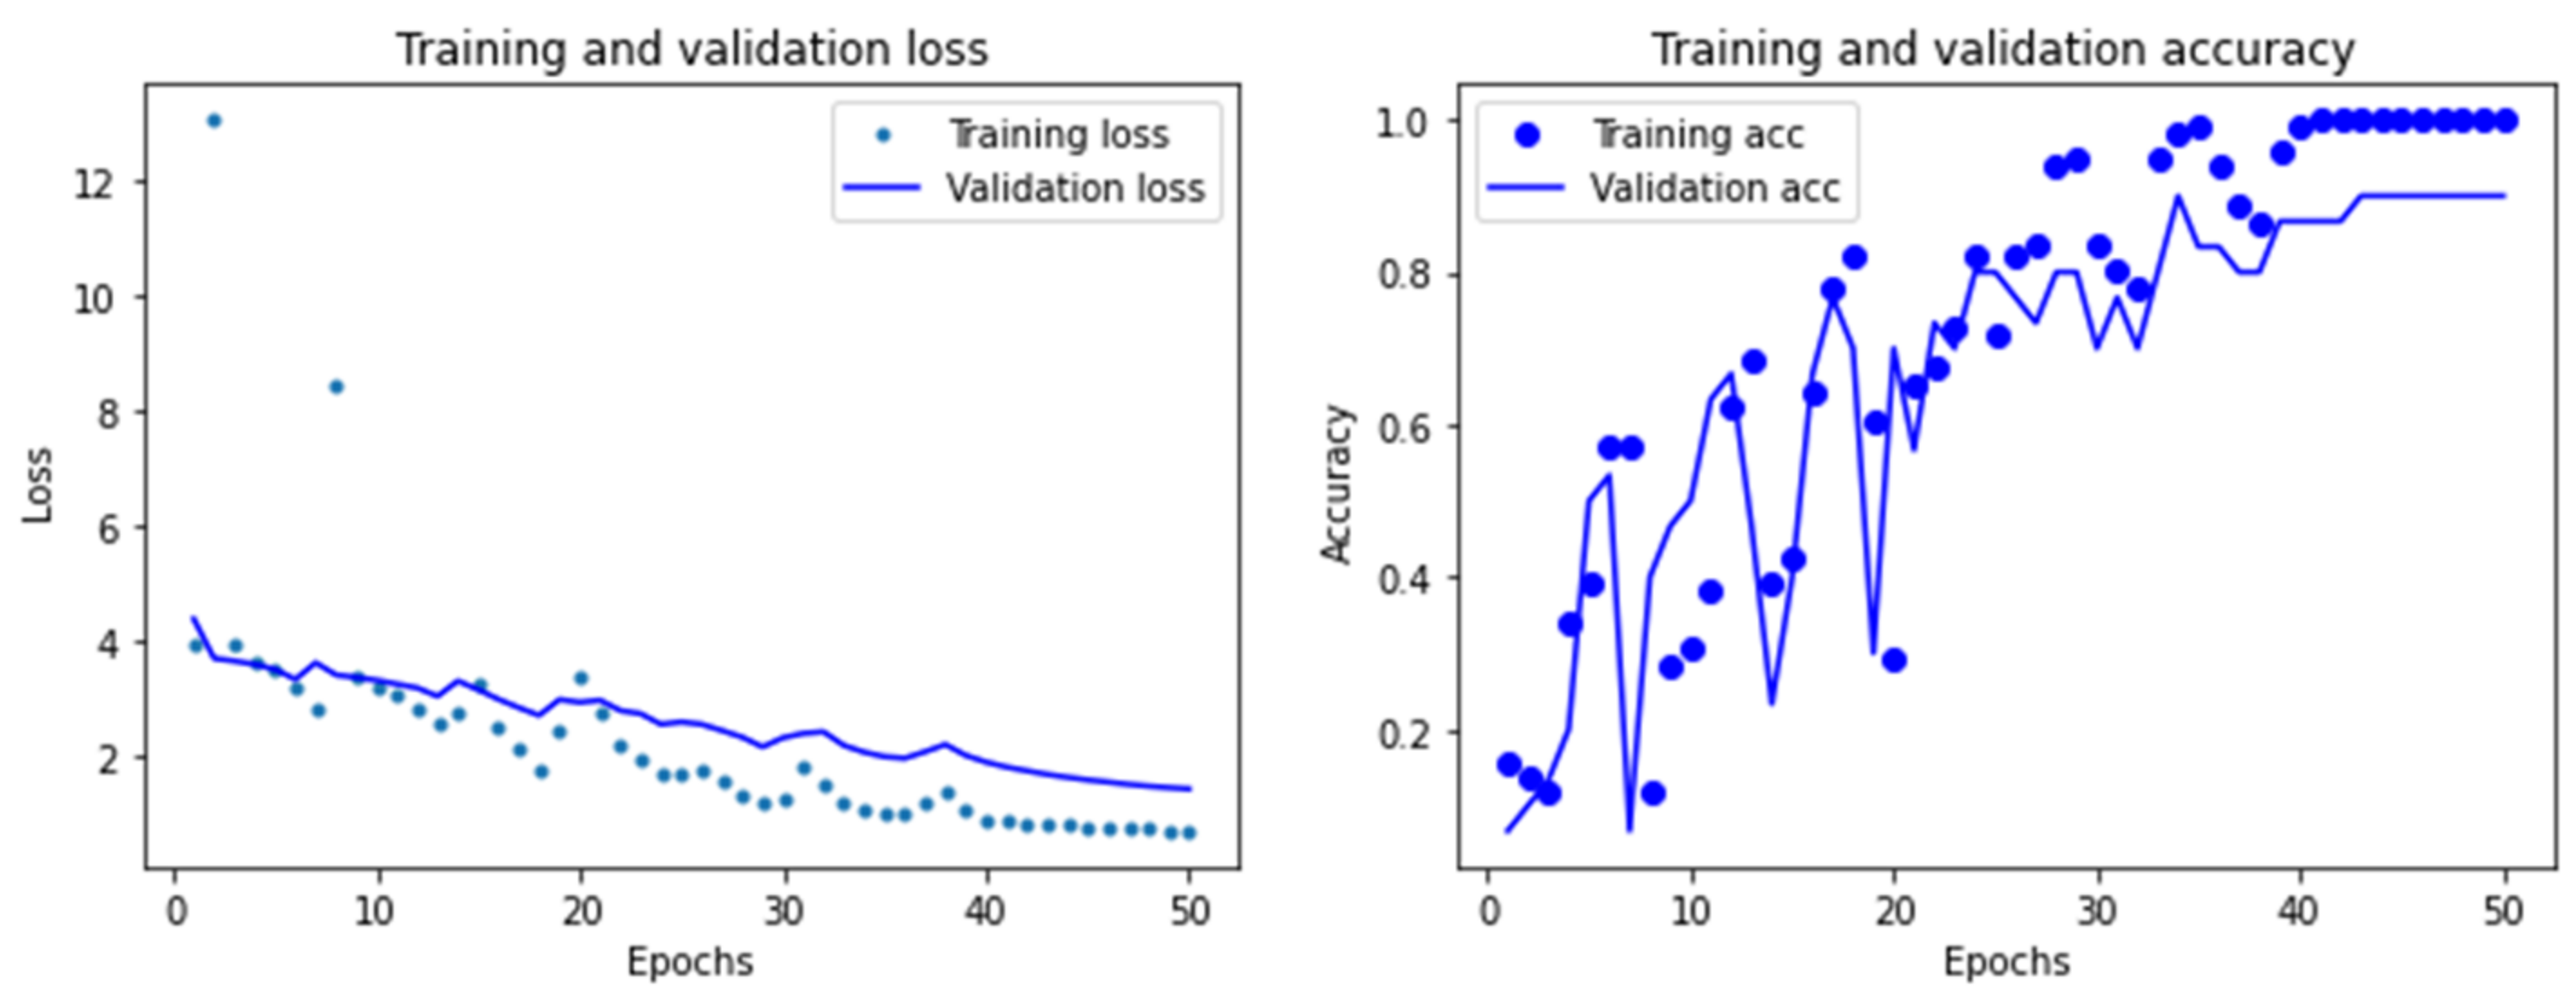
The loss function value for the VGG16 model on the training and validation sets is shown on the left in Figure 12, and the model’s evaluation index is shown on the right. The “accuracy rate” of classification prediction, also referred to as “classification accuracy” below, was used in this experiment.
- (1)
- The VGG16 convolutional neural network’s classification accuracy was insufficient. Before and after the 37th training, the accuracy on the test set increased from 13.33 percent to 43.33 percent, and, as a result of the overfitting issue, the fitting function of the accuracy oscillated with a significant amplitude for the last 10 pieces of training. The second training’s oscillation phenomenon was the worst, and it restricted the model’s ability to improve both its classification accuracy and the accuracy of its numerical values. The classification accuracy of VGG16 on this dataset is not high because, in the case of overfitting, the peak classification accuracy only reached 53.33 percent.
- (2)
- The early fitting effect of the loss function was quite impressive when compared with the results of the prediction accuracy. However, before and following the 14th training, a minor overfitting issue started to emerge. The number of training rounds was increased, which caused this phenomenon to worsen and ultimately prevented the loss function from converging. The model’s loss function value on the test set in the 12th training was 0.3667. Following that, oscillations with growing amplitude started to appear. Large outliers in the loss function value can be attributed to unreasonably high hyperparameter settings, such as the optimizer or network model’s learning rate, in the early stages of training.
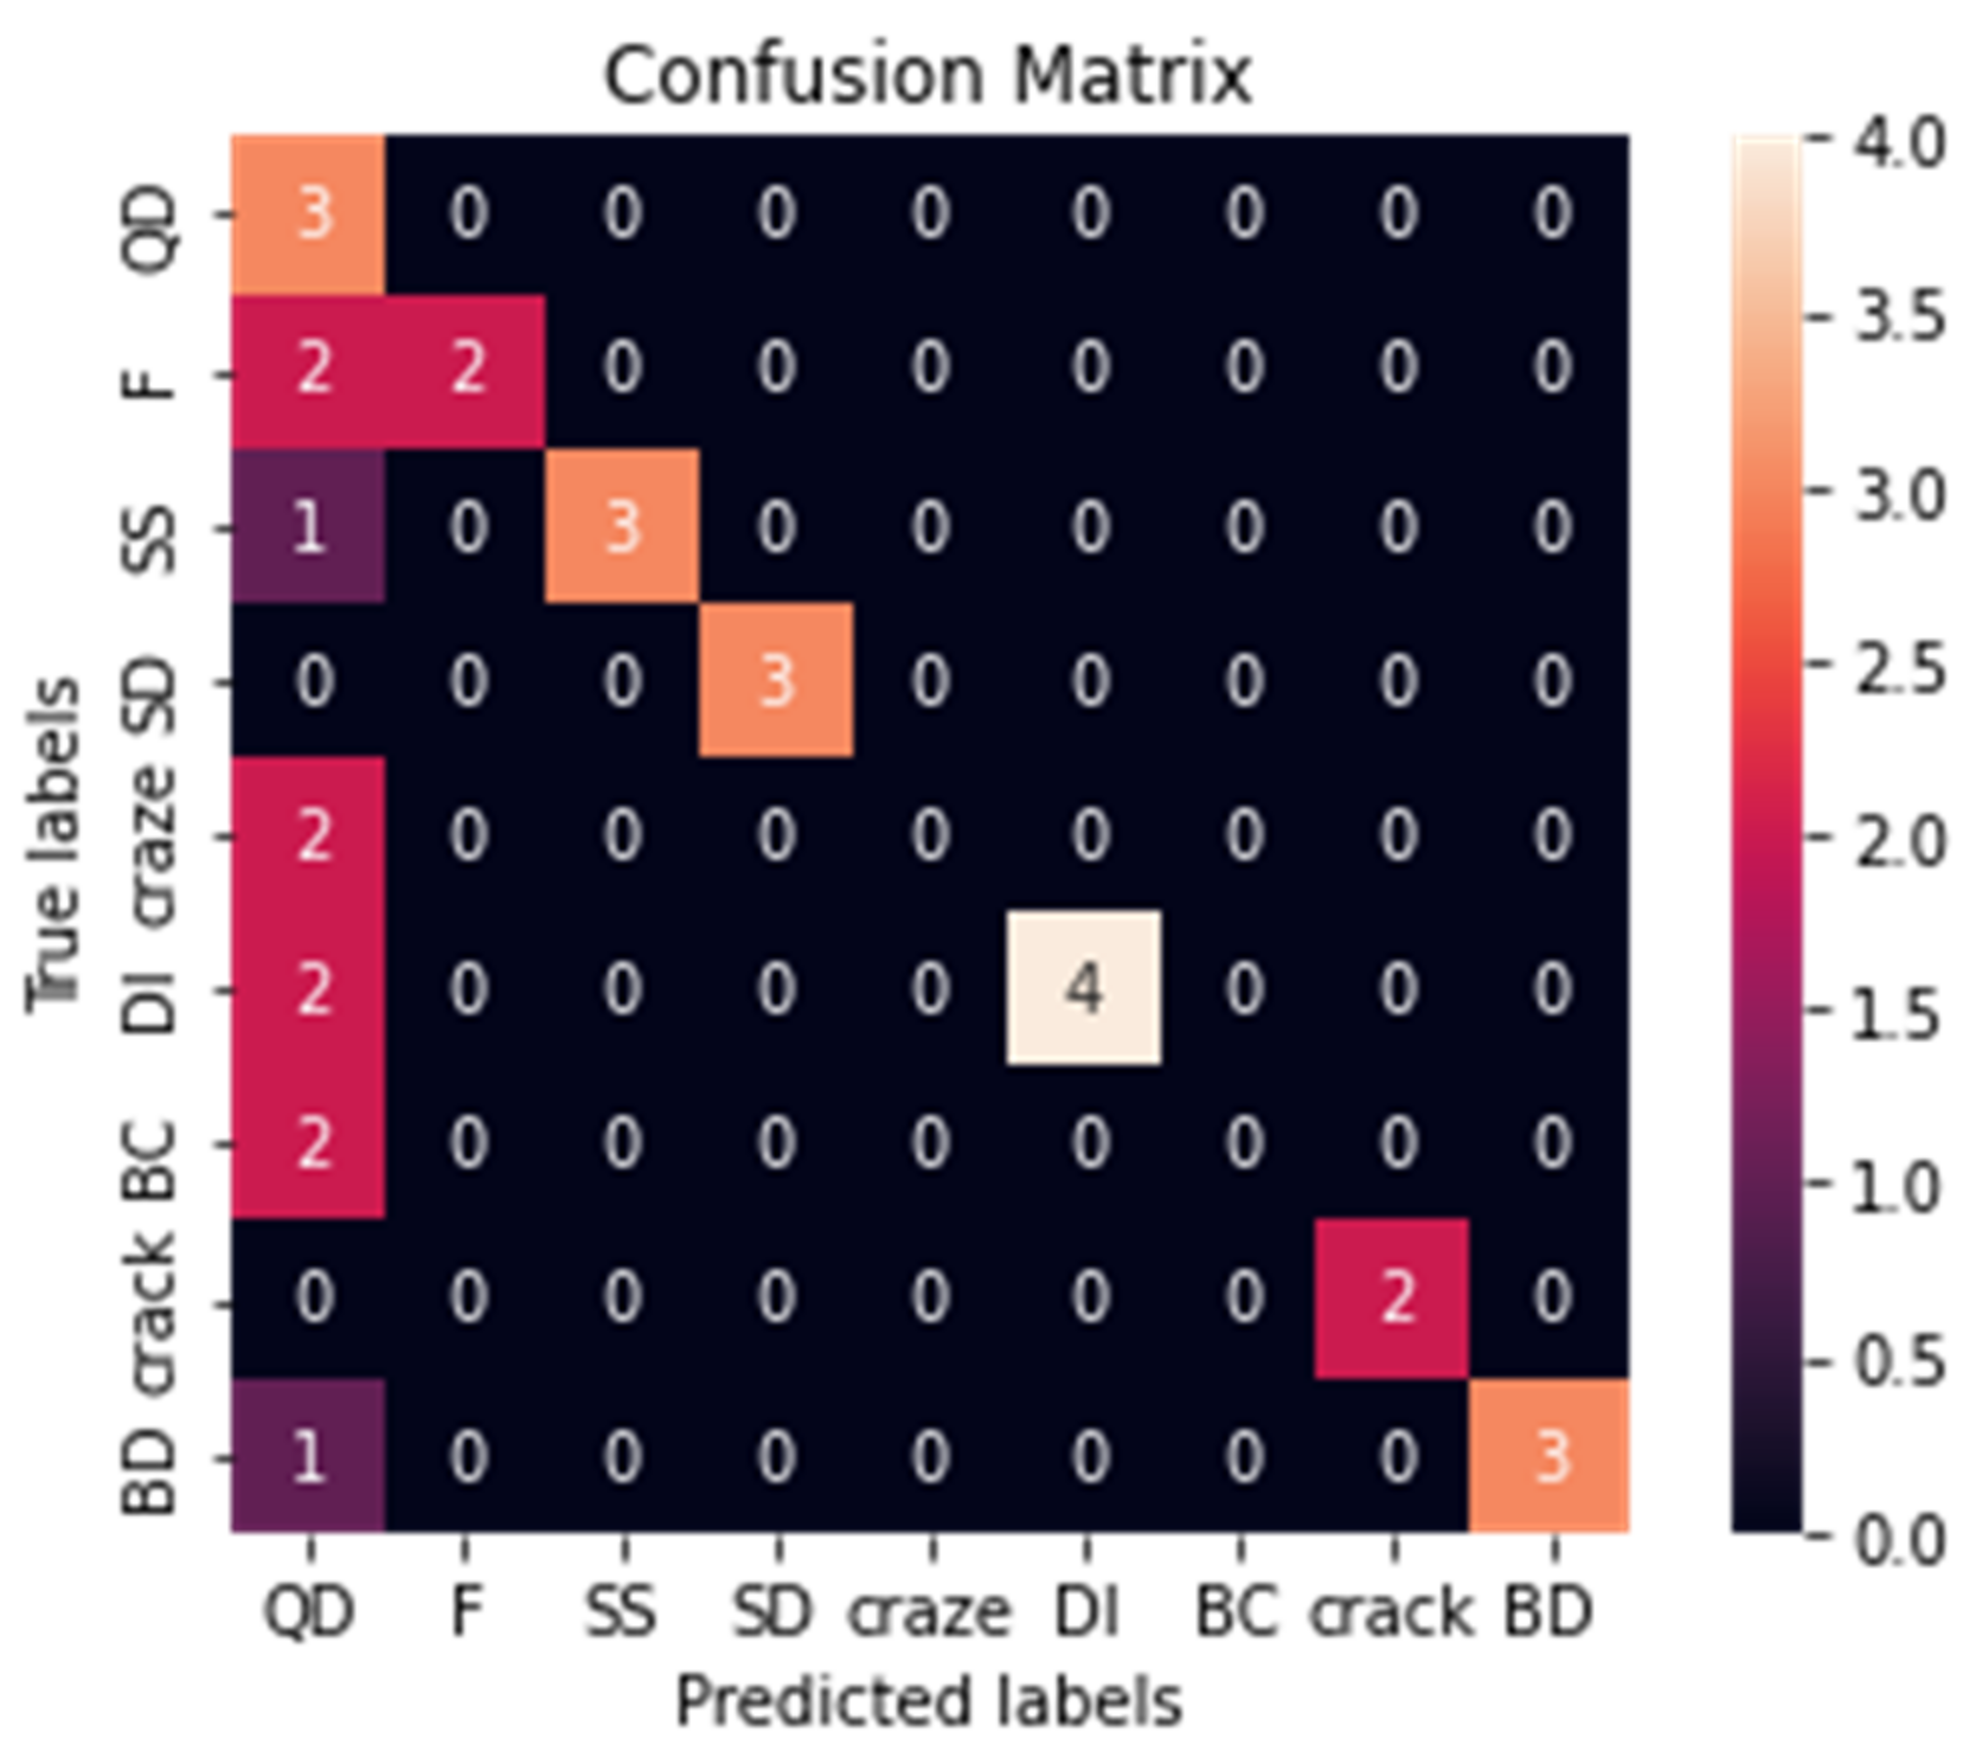
- (3)
- The accuracy of the classification is positively correlated with the numerical value of the multi-class confusion matrix, which represents the classification result in Figure 13. However, it is possible to predict silver streaks, shrinkage depressions, flash edges, and surface black spots as qualified plastic components. Experiments show that the network has a better recognition effect on plastic components with unstable size, warpage deformation, poor filling, and qualified plastic components.
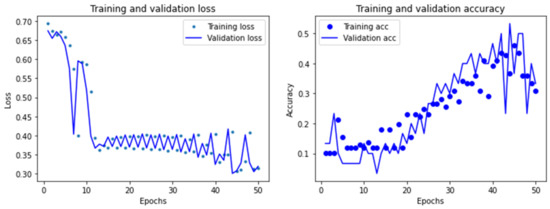
Figure 12.
Training results of the VGG16 network.
Figure 12.
Training results of the VGG16 network.
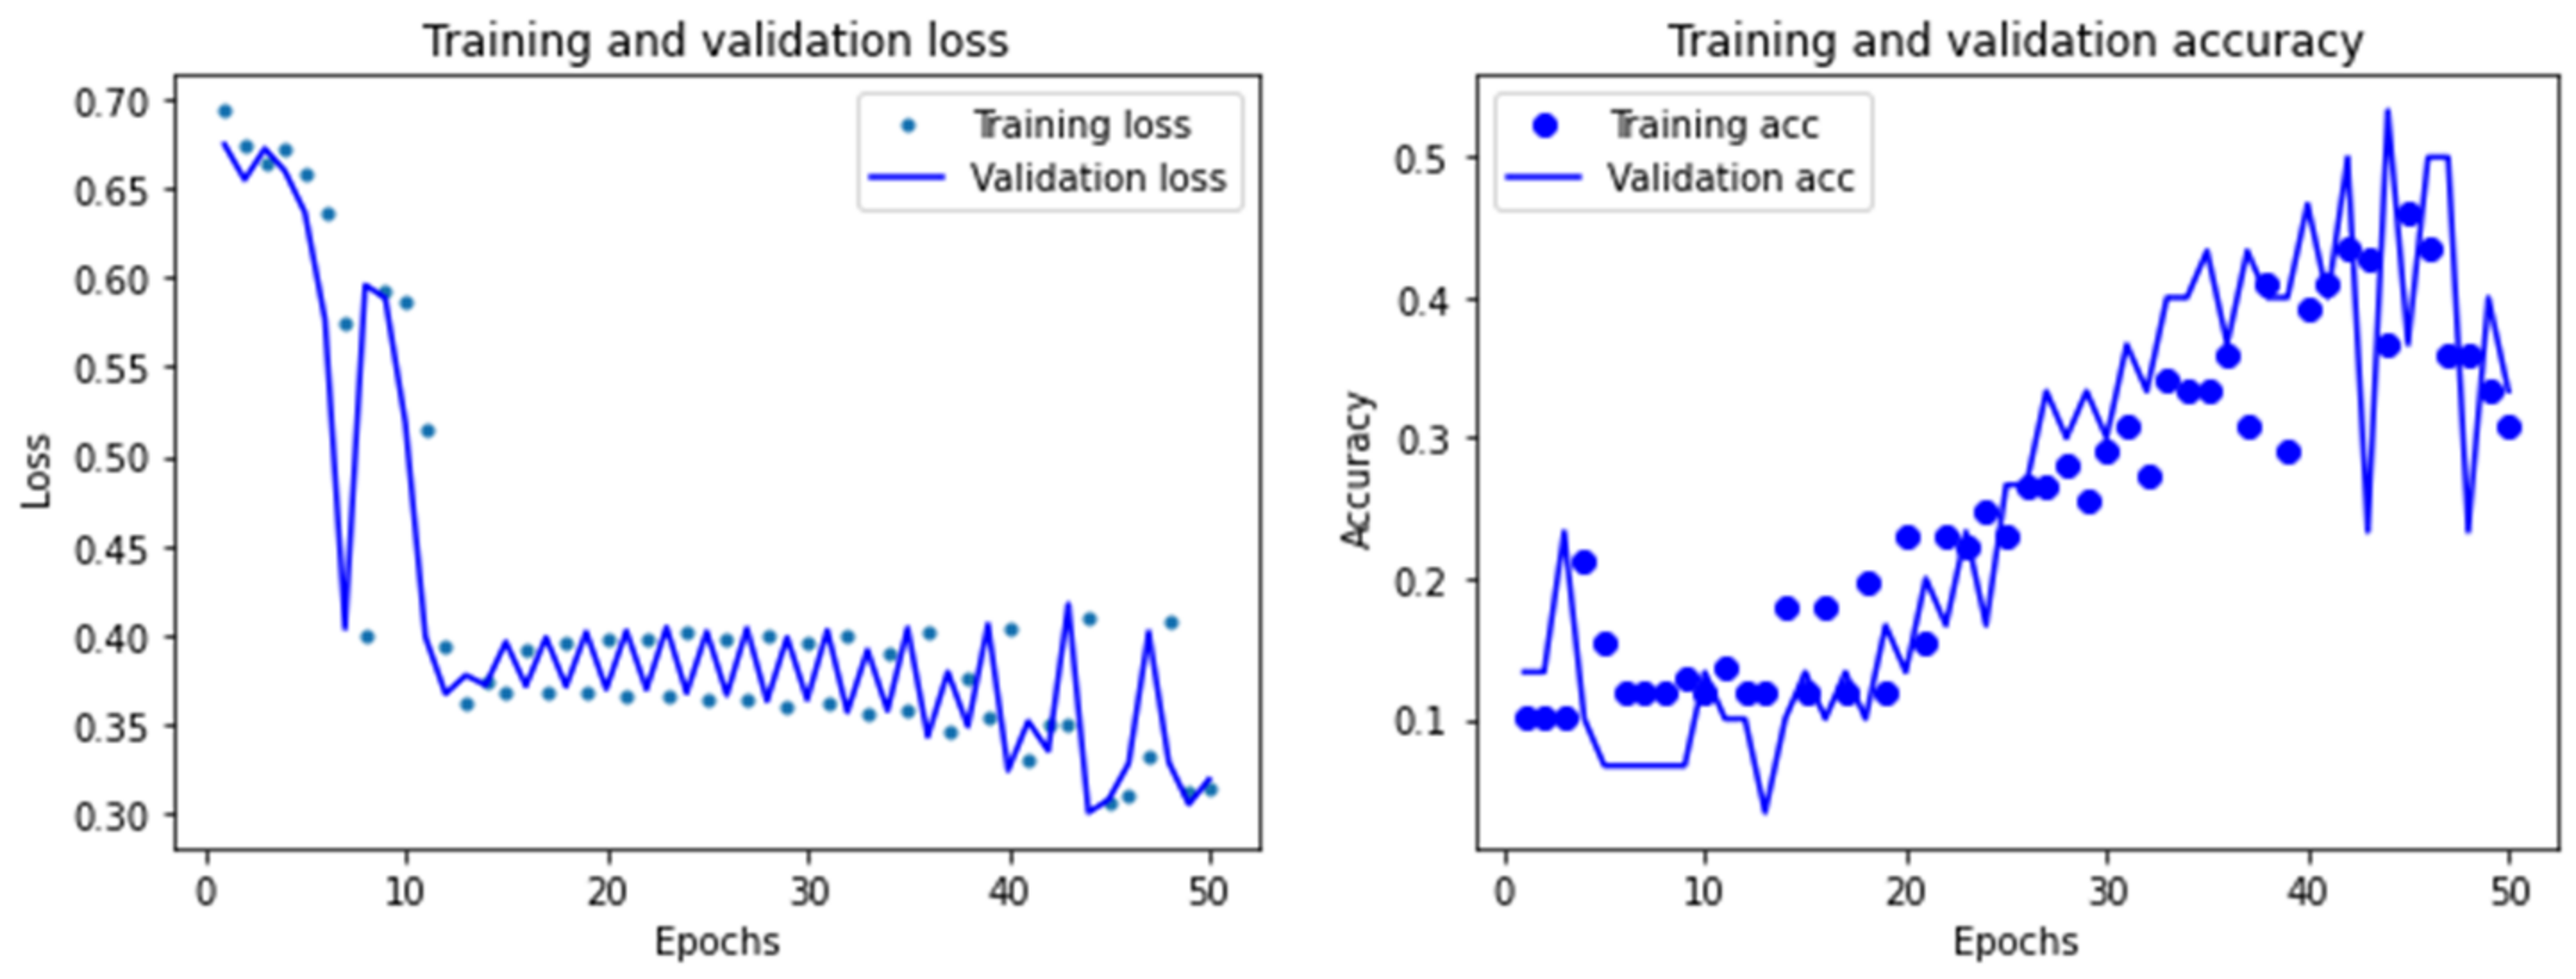
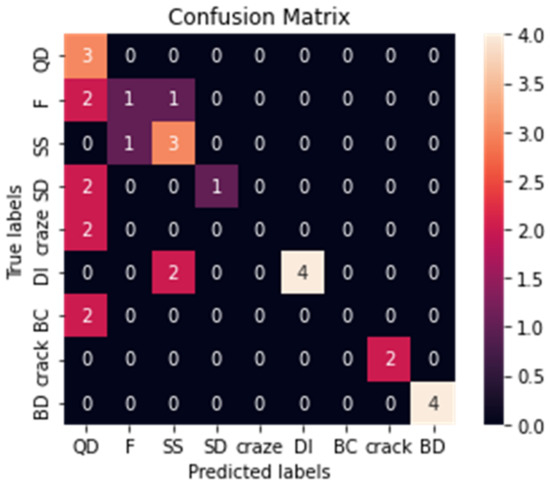
Figure 13.
Multivariate confusion matrix for VGG16 network.
Figure 13.
Multivariate confusion matrix for VGG16 network.
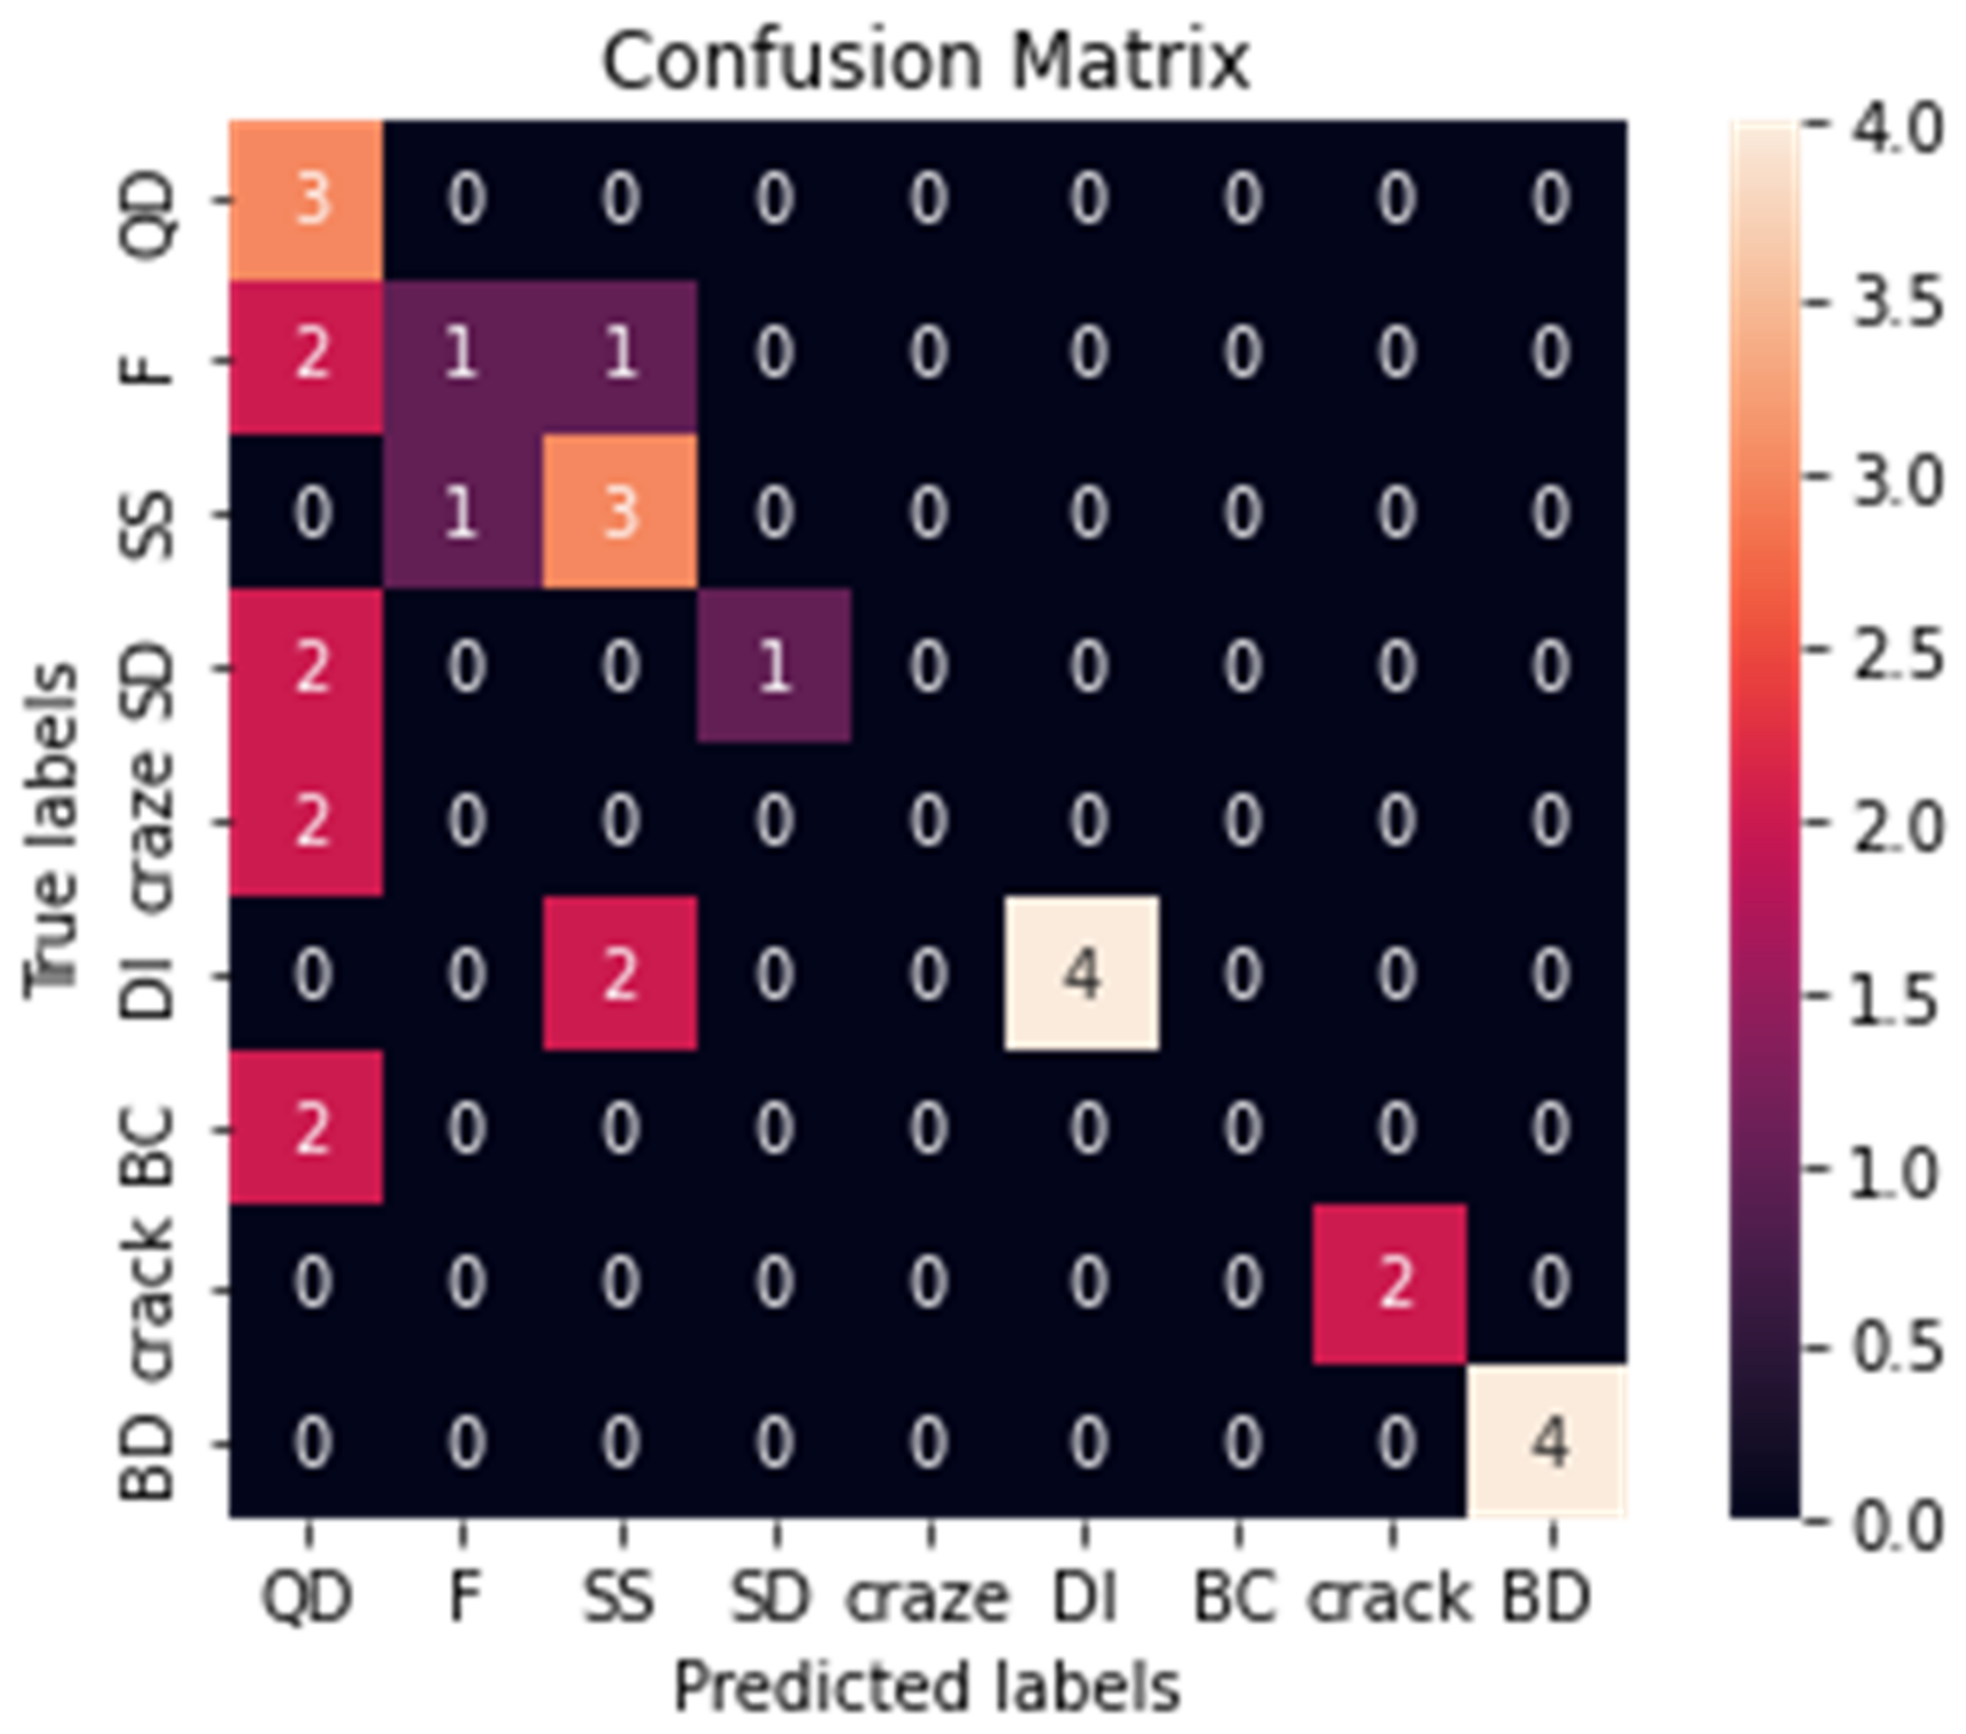
A confusion matrix is a visual evaluation tool that is used to see which class the network ultimately assigns to the test’s sample of each class. In the image above, the ordinate represents the actual label value of the data, while the abscissa represents the model’s predicted value for that label. The coordinate letters are abbreviations of labels.
4.3. Improvements to the Traditional VGG16 Topology
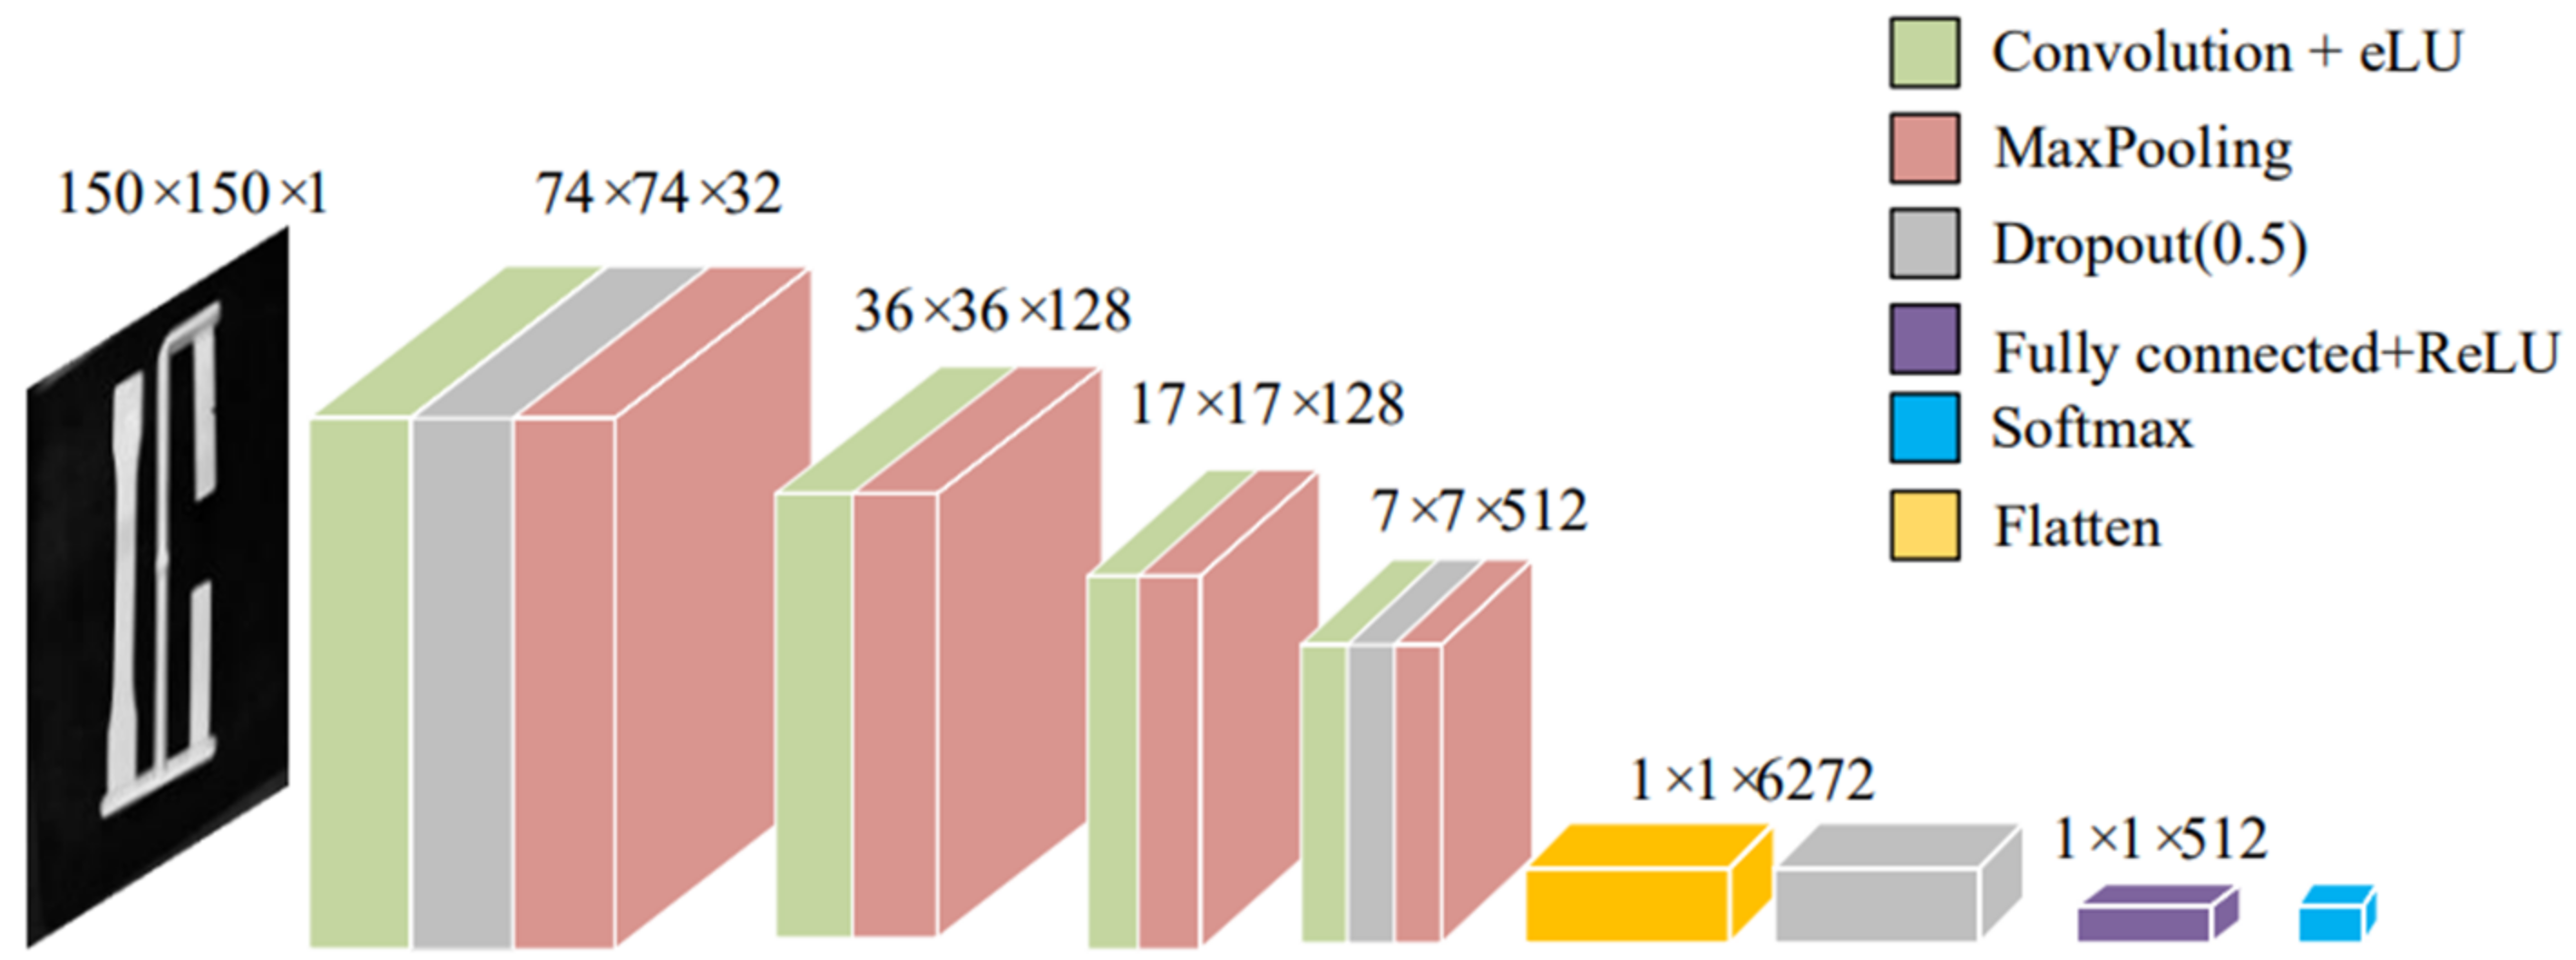
The classification accuracy, convergence value of the model loss function, and convergence are all subpar for the traditional VGG16 network training results. In terms of productivity, the network had trouble correctly classifying different defect images as qualified plastic components. Such a diagnosis mechanism cannot address the actual needs of industrial production, and it will simultaneously lower the rate of product qualification and create significant issues and costly waste. A better VGG16 algorithm is suggested in this paper based on network topology and hyperparameter debugging. The primary requirements are to increase the generalizability of the model, optimize the convergence of the loss function, and increase the classification accuracy of the fault diagnosis and classification processes. The strategies for structural improvement are the main topic of this section.
4.3.1. Improvements I: Changing the Number of Layers and Convolutional Kernels
Through sequential models, convolutional neural networks link multi-layer network architectures to create a vast hypothesis space. To perform deep learning, the model’s hypothesis space must encompass the feature space. To train more realistic and complex hypothesis functions and to recognize more abstract deep features of images, the number of network layers must be properly deepened. However, deep learning is a form of systems engineering, and there are other efficiency factors besides the number of network layers. The hardware environment, network topology, datasets, and hyperparameters must all be carefully taken into account. It is not recommended to use a network that is too deep for gradient backpropagation because this can cause serious overfitting issues. The first enhancement made in this paper involves appropriately reducing the number of network layers in order to guarantee the hidden layer’s operational efficacy. The existing network’s convolution kernel count is also decreased in this paper. This network structure’s relationship to this hyperparameter is more direct. A properly reduced convolution kernel can reduce the algorithm’s time complexity. However, this assessment is also based on the size of the particular data set.
4.3.2. Improvements II: Introduction of Weight Regularization
In addition to the gradient disappearance issue during backpropagation, deeper network models do not always represent better classification performance. The gradient disappearance problem gets worse as the number of layers is increased because the neural network’s gradient descent algorithm functions by sending feedback signals from output losses in the opposite direction to deeper layers. On the other hand, a gradient explosion issue can also be brought on by a network that is too deep. The root of the issue is an excessively high neuron weight value, which causes the gradient value of the deep network to grow exponentially as the number of layers increases. Both of these issues are the result of the weight update process being unable to proceed normally because of the excessively deep network layers.
This paper introduces weight regularization in the convolutional layer in response to the overfitting phenomenon and the practical issues with the aforementioned two types of deep learning. An essential concept in deep learning isolation. In order to increase the model’s ability to generalize, this paper adopts the L2 regularization scheme in the Keras architecture and adds the square of the neuron weight value as a regular term into the loss function.
4.3.3. Improvements III: Dropout Methods
Deep neural networks have the benefit of allowing for the training of more robust mathematical models using smaller amounts of data. Deep neural networks still have a large number of network parameters that need to be learned and updated, even though appropriately reducing the number of network layers can solve the overfitting issue. One of Keras’ layer components, the dropout algorithm, was developed primarily to address overfitting and enhance the network’s generalization. Dropout algorithm prevents mutual adaptation of neurons in the same layer by setting the weight value of each neuron in a layer of a neural network to zero through a probability value. As a result, the dropout algorithm can increase the network’s capacity for expressiveness while also enabling neurons to express their features more. In this study, the probability was set to 0.5 and a dropout layer was added between the weight layers after adjusting the number of network layers.
Figure 14 shows the structurally optimized VGG16 convolutional neural network.
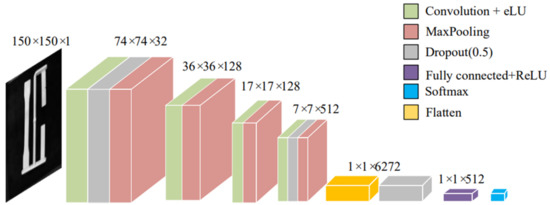
Figure 14.
VGG16 network after structural optimization.
4.4. Debugging of Hyperparameters
4.4.1. Changing the Optimizer
The gradient descent of the deep neural network and the parameter optimization process are realized via the optimizer. Based on the back propagation theory, the process of updating the weights of the optimization algorithm is as follows:
In the Equation (17), L and f correspond to the loss function and the output function respectively, represents the kth parameter in the network structure, represents the optimal parameter, and corresponds to the input of the convolutional neural network.
The adaptive gradient algorithm was used to create the RMSProp optimizer, which addresses the issue in which the learning rate caused by the latter in the training process drops sharply in the later stages. In addition to introducing the hyperparameter decay coefficient and computing the second-order momentum value using the weighted average method, the algorithm maintains the benefit from which each parameter in the adaptive gradient algorithm being adaptable to different learning rates. In this paper, the RMSProp optimizer was replaced by the adaptive moment estimation (Adam) optimizer, which dynamically adjusts the learning rate of each parameter using the first-order moment estimation and second-order moment estimation of the gradient. This incorporates RMSProp and the SGD algorithm while taking into account first-order momentum. The algorithm’s advantage, when second-order momentum is taken into account, is that each iteration of the learning rate has a specific range. One of the most popular optimizers in use right now is Adam. The model learning rate in this paper was set as 6 × 10⁻⁵.
4.4.2. Changing the Activation Function
The conventional VGG16 network’s activation function ReLU can address the gradient disappearance issue. This function, which is actually a ramp function, can simulate the sparseness of neurons in biological neural networks due to its wide excitation boundary and unilateral inhibition. sex. The efficiency of gradient descent is impacted by ReLU’s non-zero centralized nature, which creates a “bias offset” in the following layer. Another significant issue is that the ReLU function cannot update the weight value when the input value is less than 0. To ensure that the neuron can also have a non-zero gradient to update the parameters when the neuron is in an inactive state, a small positive number is added when the input is negative.
This algorithm’s drawback is that the neuron will saturate and become essentially inactive when the input value is a negative value with a large modulus. The eLU function [40] introduced in this paper is improved on the leaky ReLU algorithm by substituting a logarithmic curve on the -axis of the input value for the straight line that was previously used, combining the benefits of both.
5. Results
5.1. Fault Diagnosis Classification Test Based on VGG16 after Structural Optimization
The data set used in this experiment is the same as it was in the previous one, so the associated preprocessing work will not be repeated. Figure 15 displays the outcomes of the training set and test set. The new model has good generalization ability, according to an analysis of the classification accuracy data on the right. The classification accuracy has increased from the initial 6.67% to the final 90% after 50 training sessions. The classification accuracy of the model on the test set essentially stayed in the range of 86.67% to 90.00% over the course of the last 10 training sessions before stabilizing at 90.00%. The new model fits the data better than the conventional VGG16 model, effectively avoiding the over-fitting issue, and significantly increasing prediction accuracy. The overall loss function value of the model exhibits a monotonically decreasing trend, according to the analysis of the loss function value data on the left. The 50th value for the function was 1.4301. Although the convergence effect is not ideal, the convergence trend is significantly more significant than the previous network. This necessitates further fine-tuning of the model’s hyperparameters. It should be noted that the dropout layer introduced in this paper effectively filters out the impact of outliers on the loss function value.
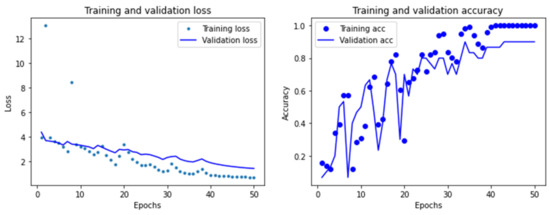
Figure 15.
Training results of VGG16 after structural optimization.
The issue of low work efficiency brought on by incorrect identification and classification still exists, according to the confusion matrix analysis of the classification results. The optimized network improves prediction accuracy for shrinkage and sag of plastic components in comparison with the previous network, but it is not stable in terms of size, warping, and shrinkage. Distortion and poor fill recognition both worsened when compared with the previous networks.
The experimental results demonstrate that structural optimization using the VGG16 convolutional neural network significantly enhances prediction accuracy. However, the new model still has two issues from the results in Figure 16: the serious issue of incorrectly classifying flawed artifacts still exists; and the loss function’s convergence is poor, necessitating the tuning of hyperparameters.
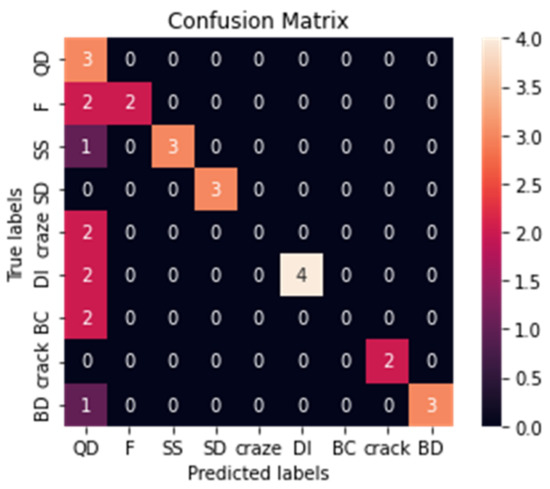
Figure 16.
Multivariate confusion matrix of VGG16 network classification results after structural optimization.
5.2. Fault Diagnosis Classification Test after Changing the Optimizer
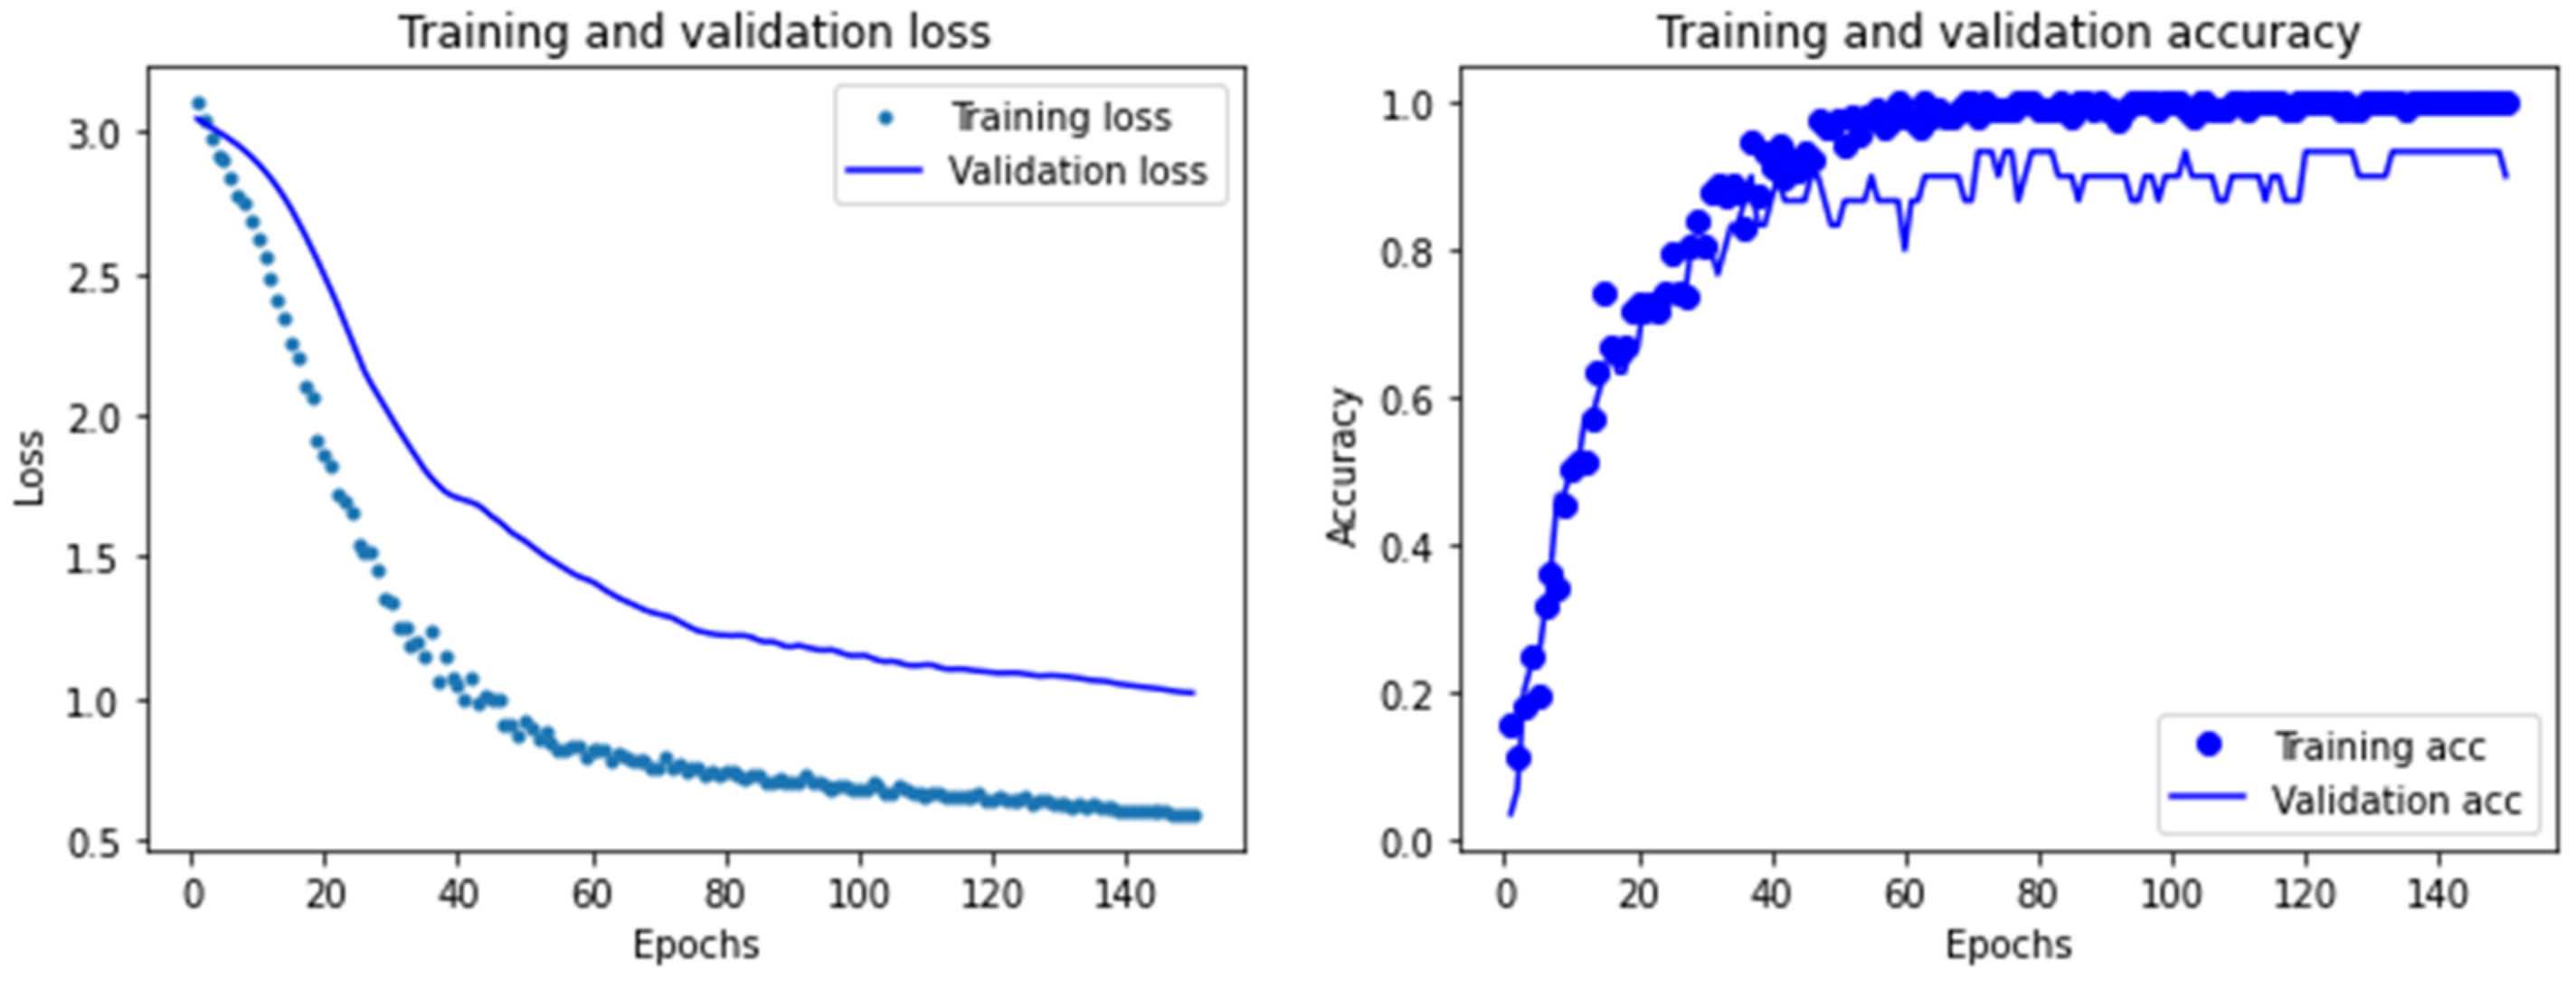
The training epochs were increased to 150 to fully utilize the capabilities of the new optimizer. Figure 17 displays the training results. In this experiment, the network’s classification accuracy increased from 3.33% to 93.33%. The classification accuracy of the model increased from 90.00% to stabilize at 93.33% from the 80th training to the end. The VGG16 network’s accuracy was further enhanced by the Adam optimizer with improved network structure but without hyperparameter tuning. In comparison to the prior experimental data, the convergence value of the loss function in the new network is 1.0171, a decrease of 0.413.
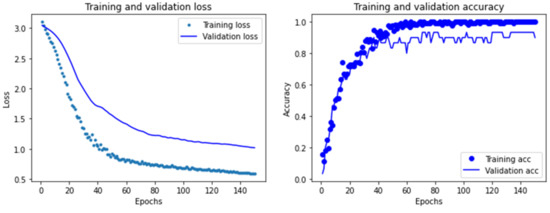
Figure 17.
New VGG16 test results with Adam replacing RMSProp.
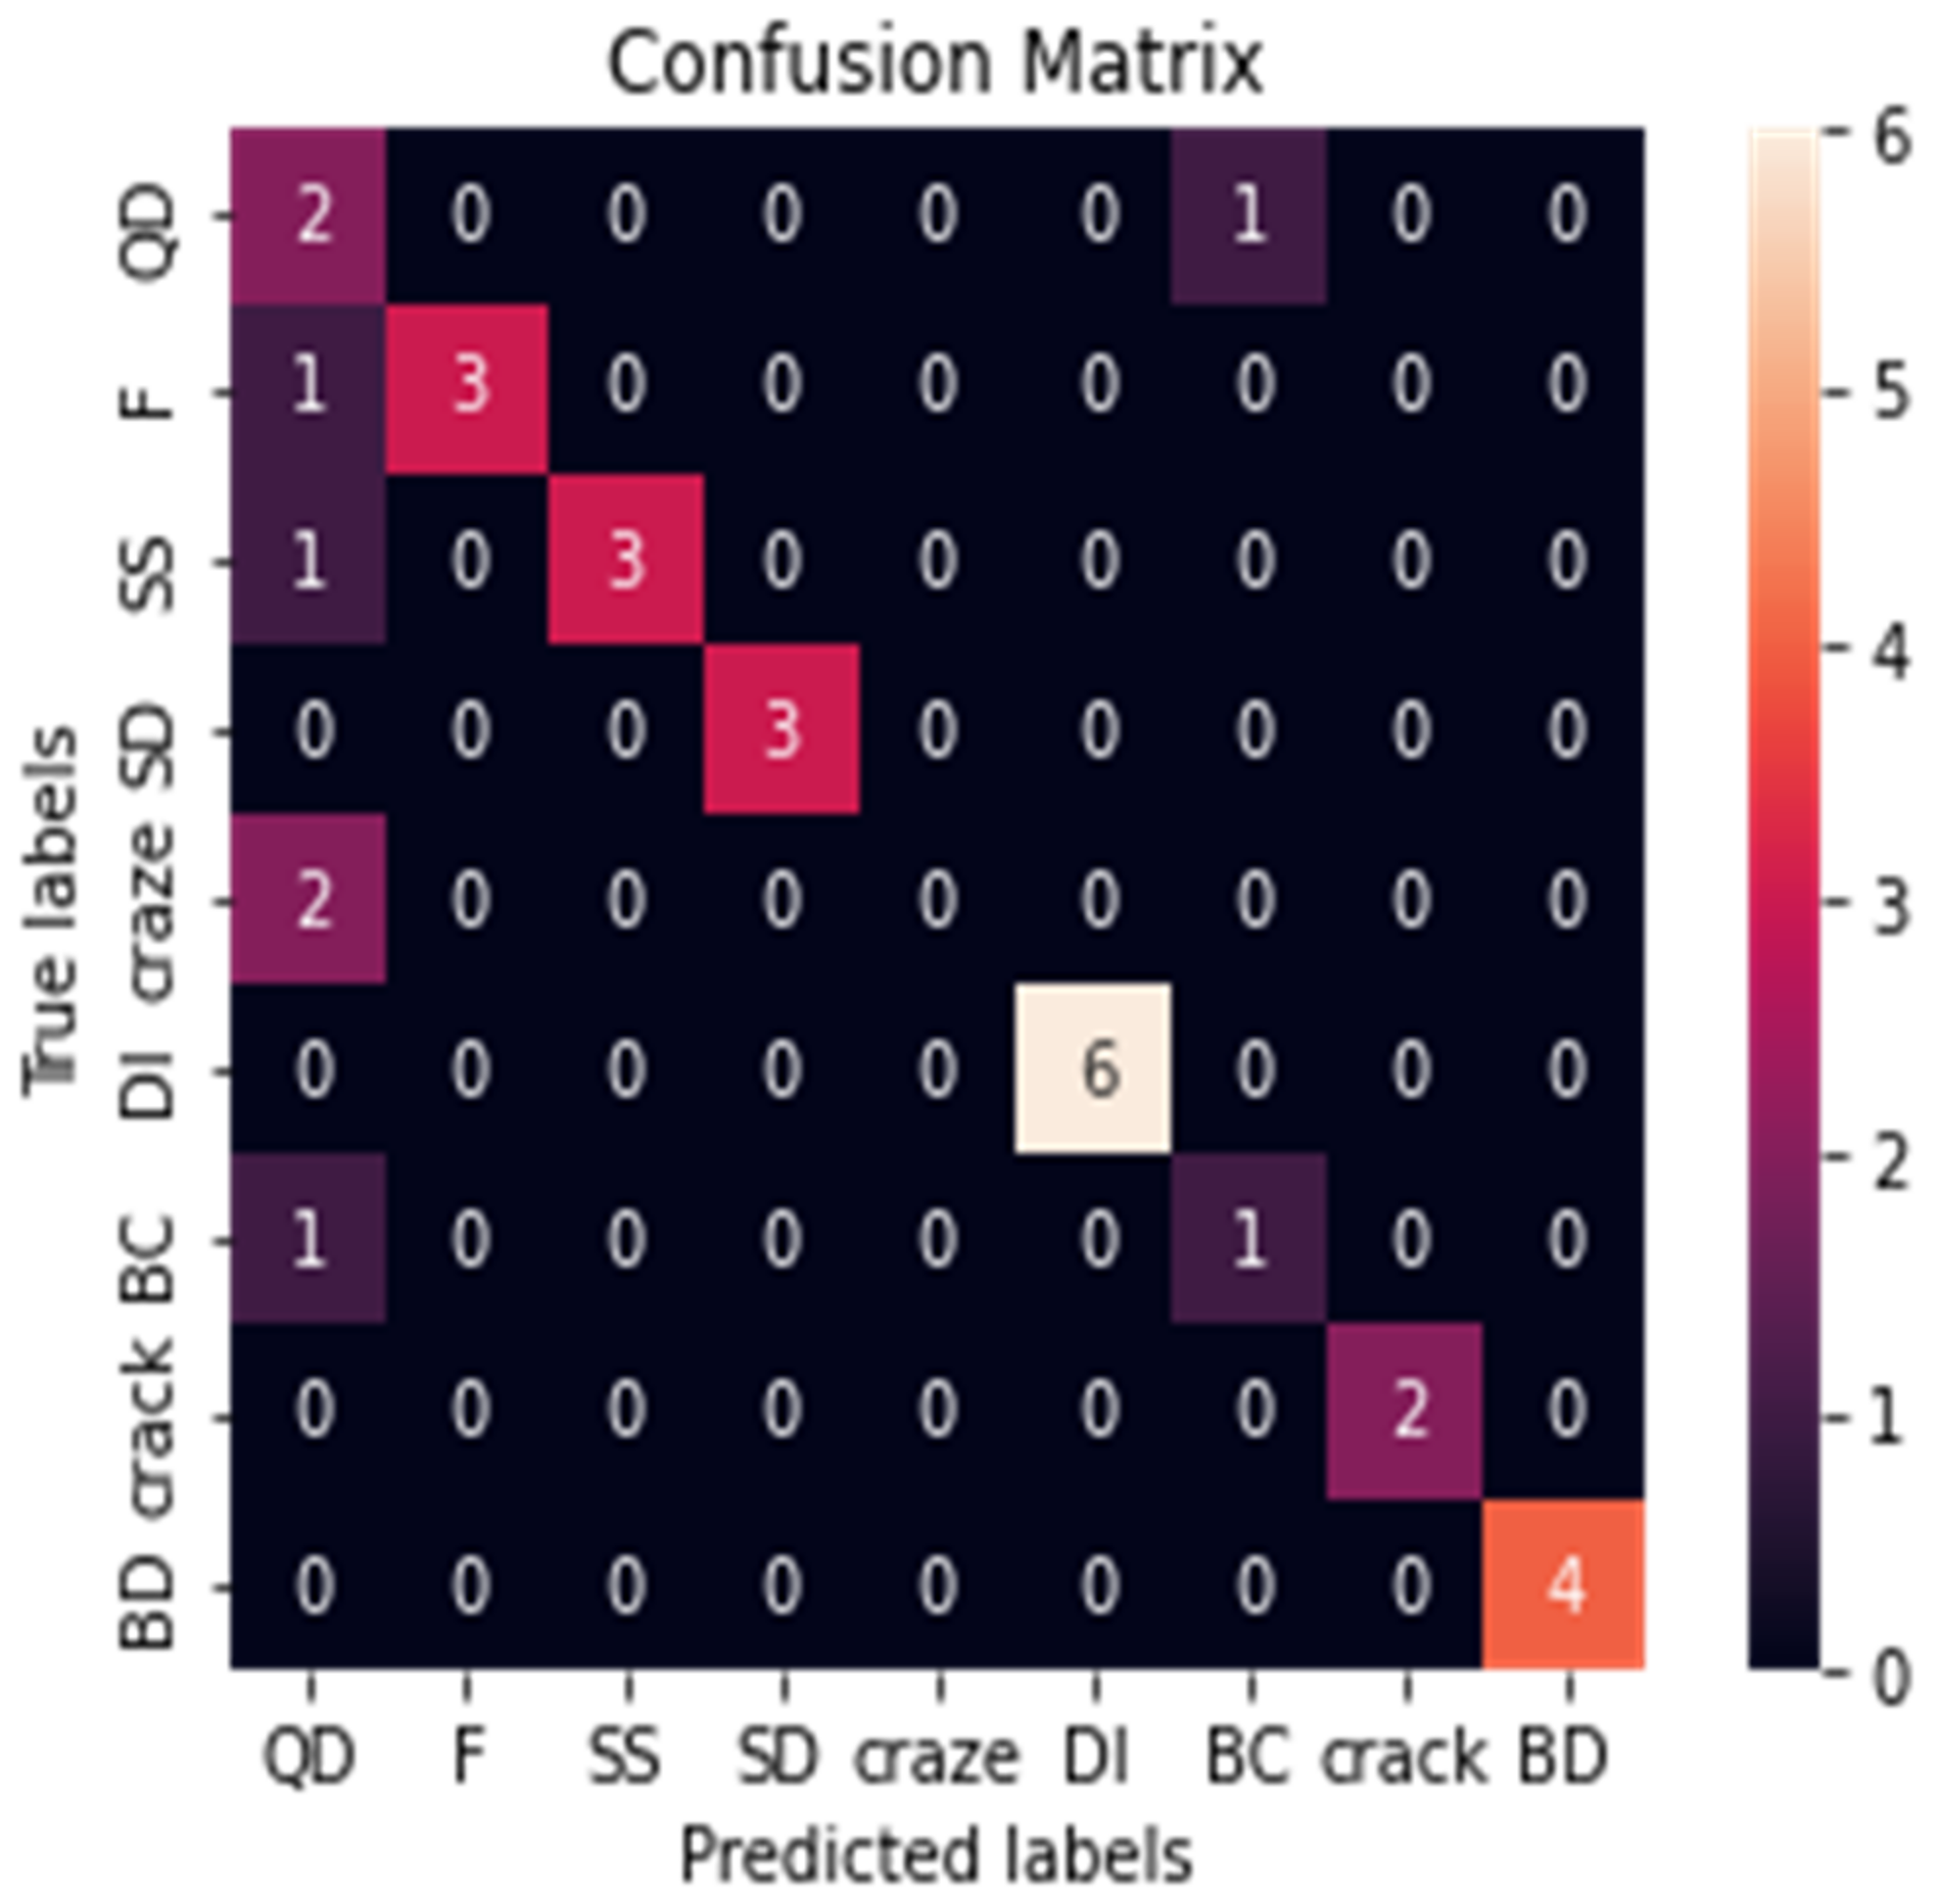
Figure 18 depicts the results of the confusion matrix used in this experiment. It is discovered that the issue of the detection system’s incorrect classification of defective plastic components remains unresolved. The four types of defects—plastic components flash, inadequate filling, silver streaks, and surface black spots—are still not accurately identified by this new network model; however, dimensional instability and warpage deformation are better identified.
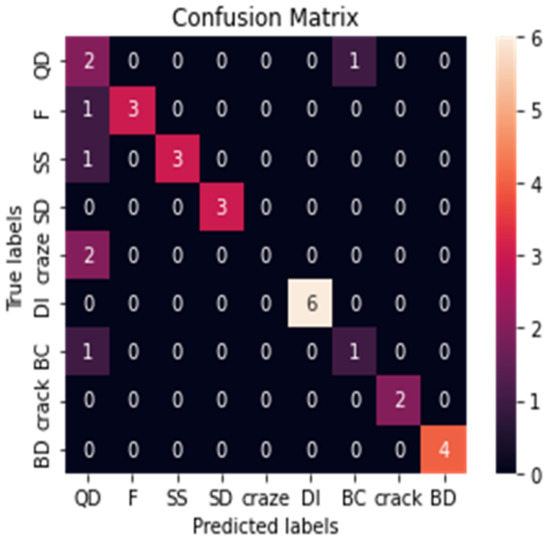
Figure 18.
New VGG16 network classification results with Adam replacing RMSProp multivariate confusion matrix.
5.3. Fault Diagnosis Classification Test Based on Improved VGG16 (Final Model)
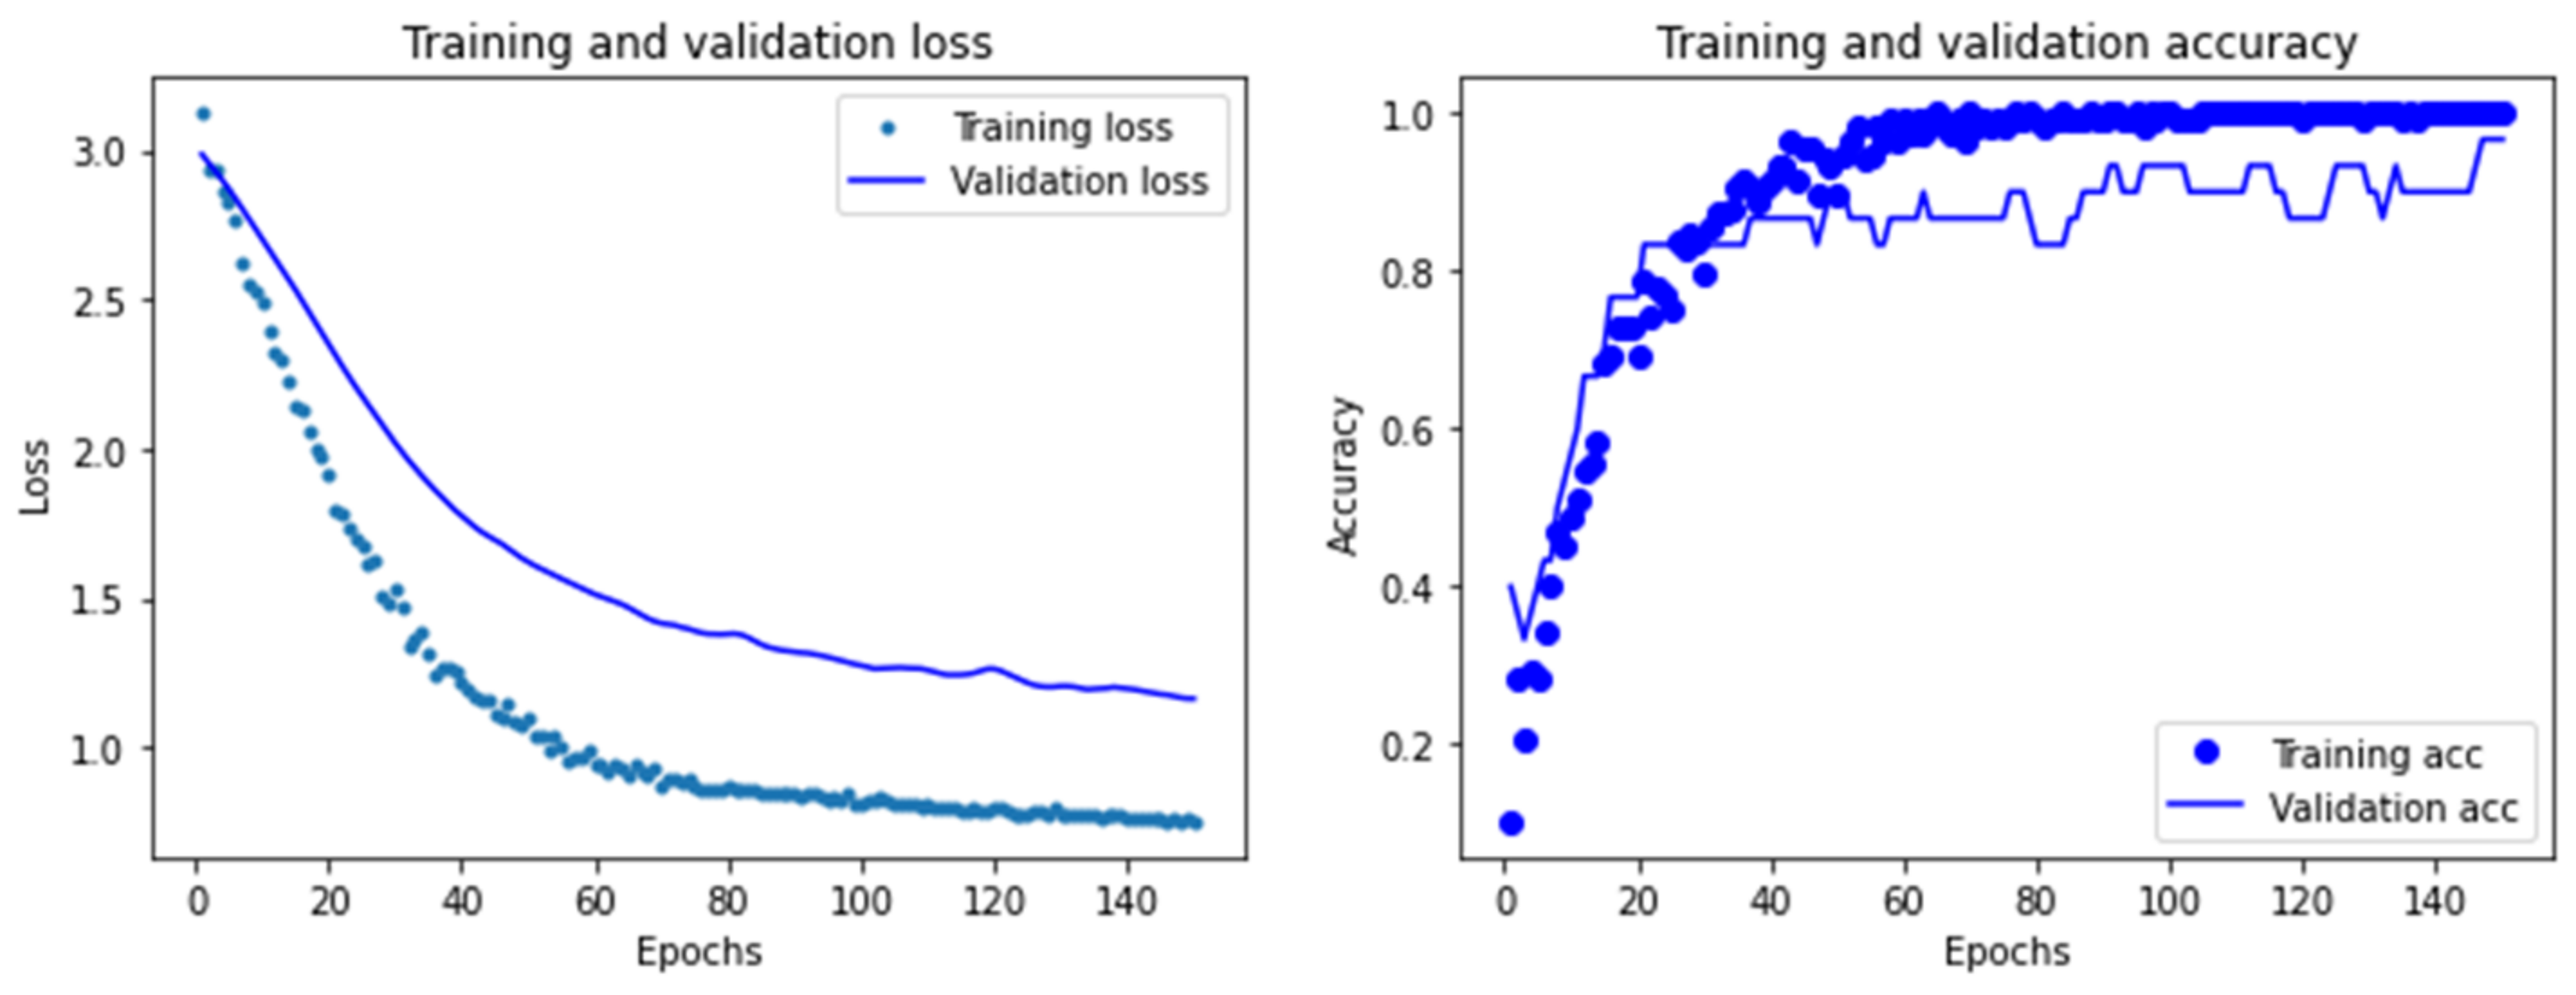
The improved VGG16 network proposed in this paper is the network used in this section, and the activation function is further adjusted in accordance with 5.2. We used the same experimental setting as in Section 5.2 to experiment, and the results are displayed in Figure 19. According to the data, the new VGG16 network achieves 96.67% classification accuracy on the test set after structural optimization and hyperparameter tuning. The classification accuracy of the new VGG16 network stabilizes from 93.33% to 96.67% in the last third of the training process. The fault classification task in this paper can be successfully completed by the VGG16 network. The model on the test set has a loss function convergence value of 1.1627, which is 0.2674 lower than it was before hyperparameter tuning.
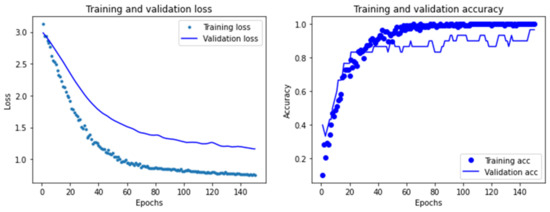
Figure 19.
Training results of the improved VGG16 network.
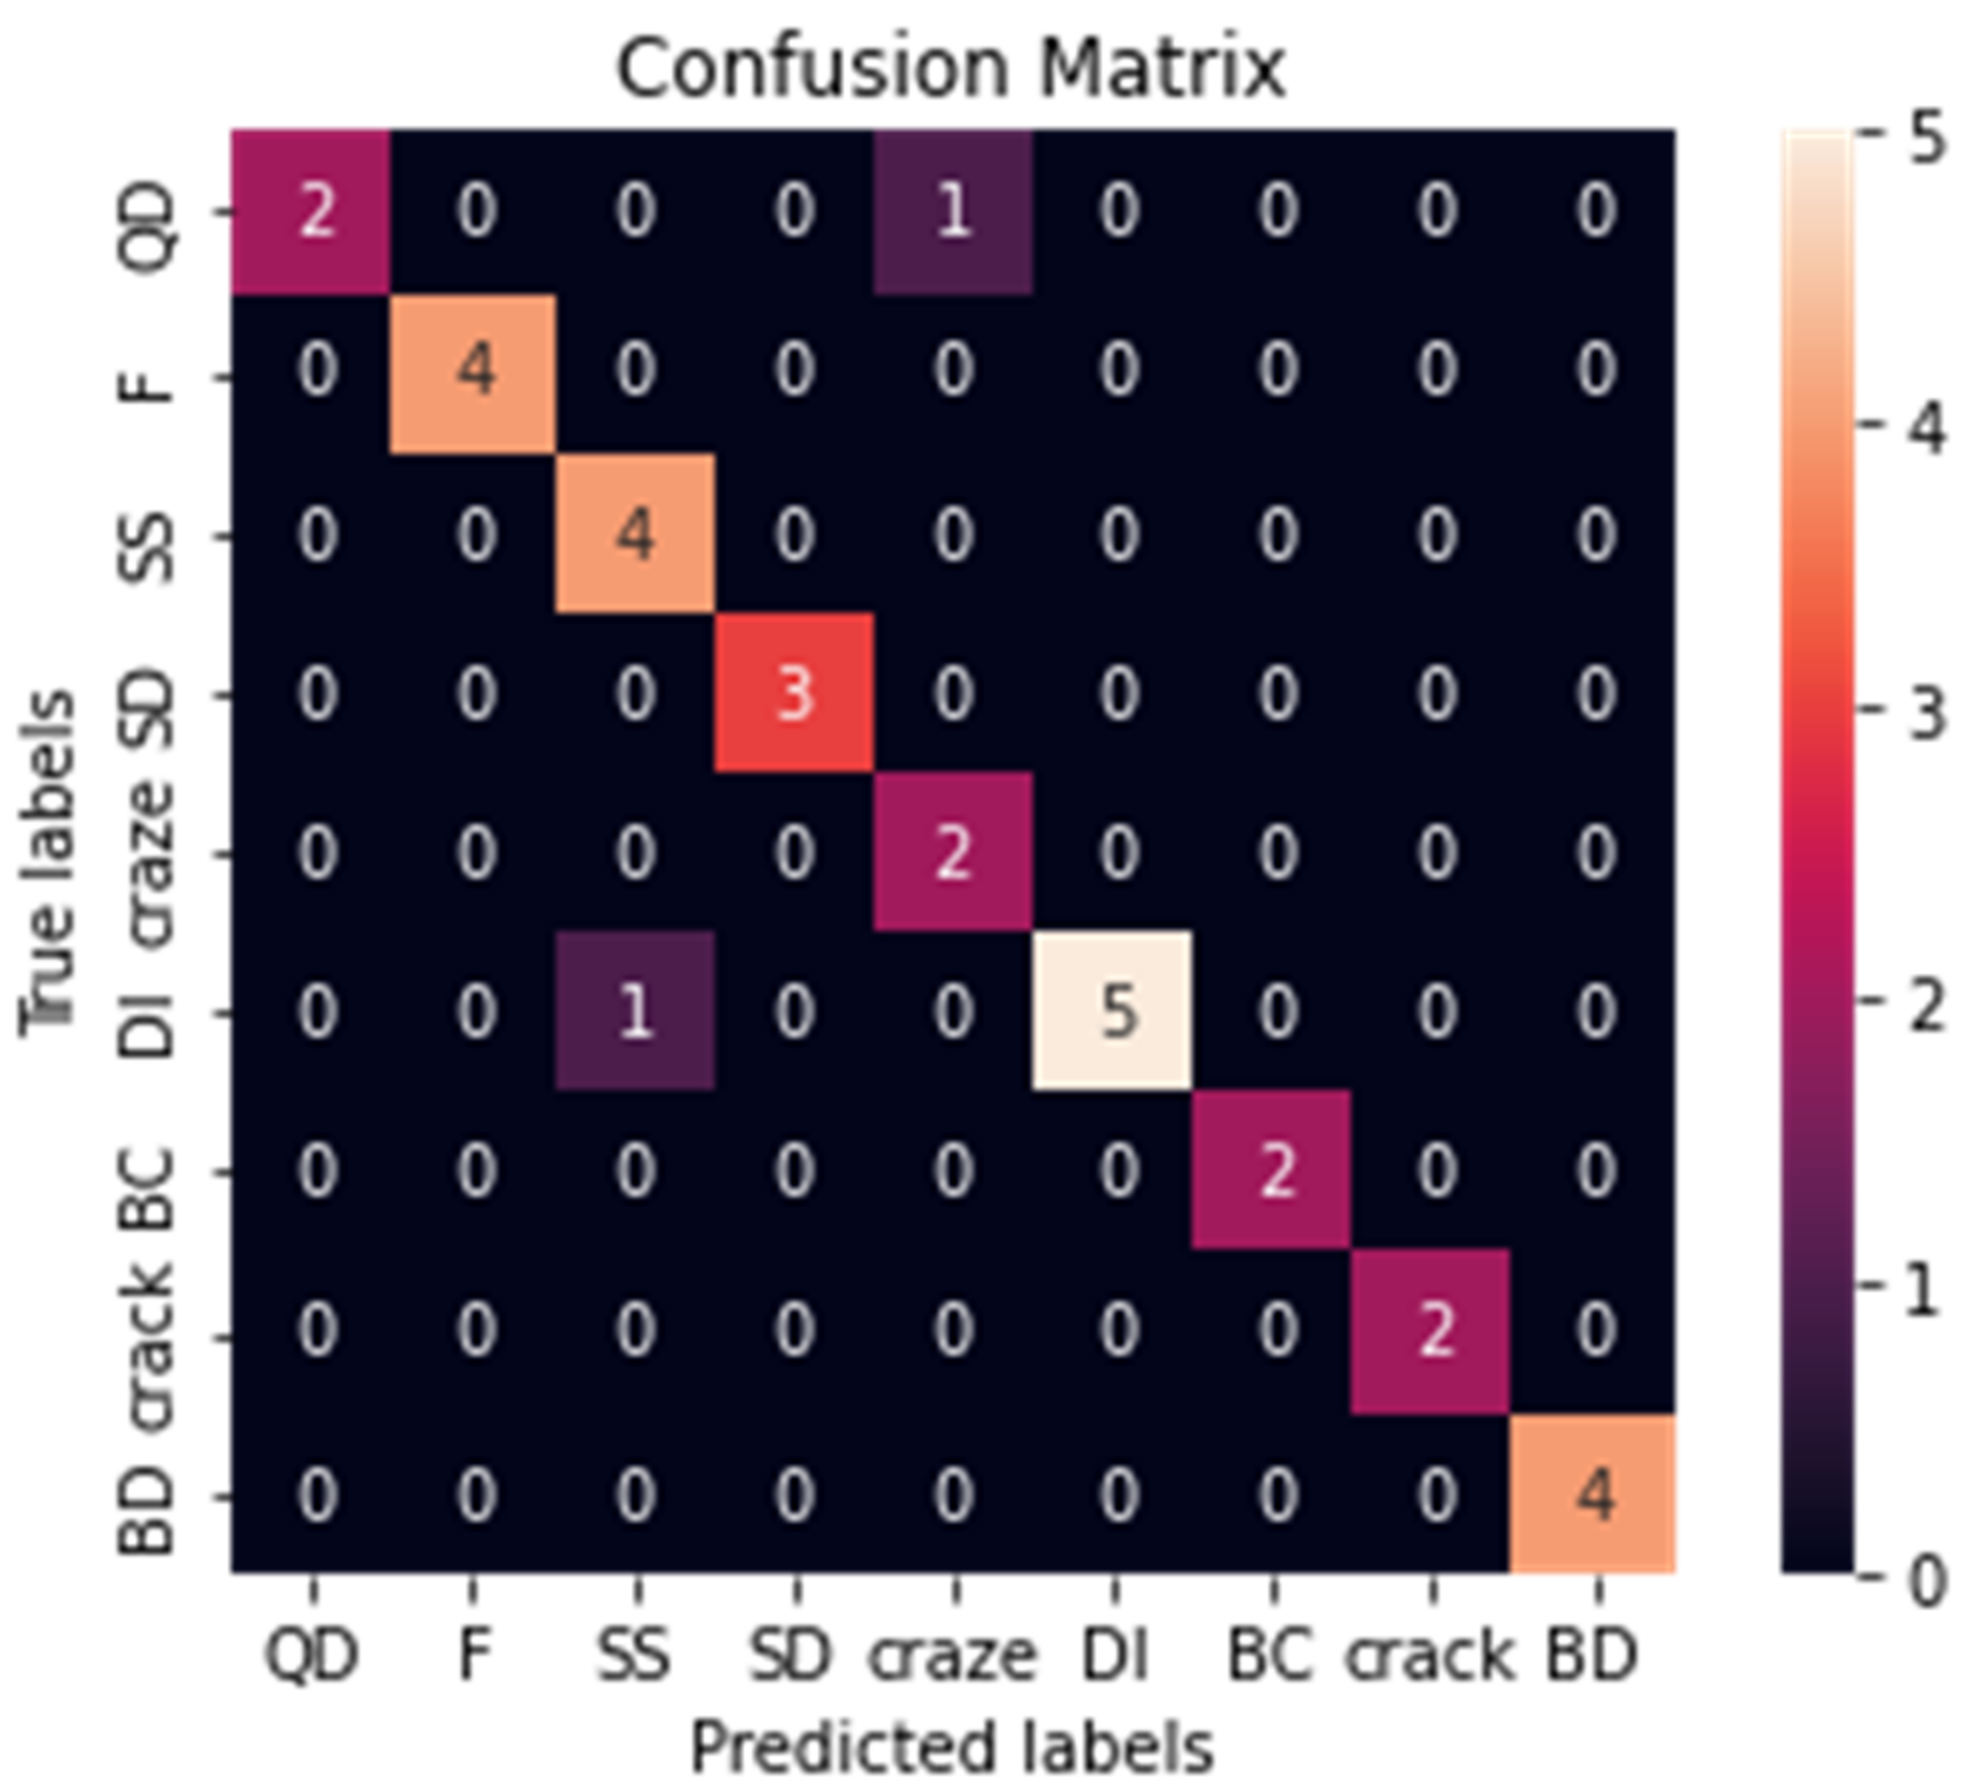
The network exhibits good robustness in the classification and prediction of eight types of defect images and qualified images of plastic components, Figure 20 shows the final classification results. The improved VGG16 does not mistakenly classify original defective plastic components as qualified plastic components, allowing for high-quality mold fault diagnosis. This is revealed through the analysis of the confusion matrix created by this most recent network.
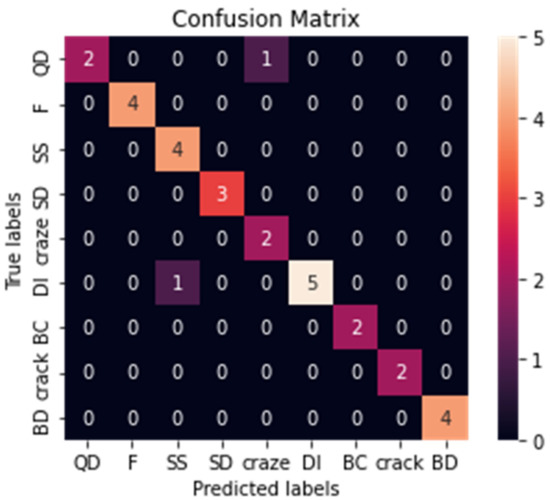
Figure 20.
The final multivariate confusion matrix of the improved VGG16 network classification results proposed in this paper.
6. Discussion and Conclusions
6.1. Discussion
This paper traces the causes of injection molding machine and mold failure from failed plastic components and has wide application value. Further study should focus on the following points:
- (1)
- Strengthen innovative research on image processing algorithms. Further research should focus on more efficient and comprehensive fuzzy image recovery algorithms and feature extraction algorithms with stronger resistance to noise interference. To increase matching accuracy and the classification efficiency of convolutional neural networks, it is crucial to build robust features that are more suited to matching.
- (2)
- Introducing a fresh method of template matching that considers multiple variables. After satisfying the dimensional invariance of imagerotation, translation, and scaling in this paper’s template matching method, which is still based on conventional machine vision, it does not account for environmental factors that may be present while taking photos for actual production. Further work should introduce a new approach to template matching that considers multiple variables, where the arbitration function should be a multivariate function.
- (3)
- Additional VGG16 network optimization about residual connections. Deep learning’s classification effectiveness can be somewhat increased through network topology optimization and hyperparameter tuning, but recent research has shown that residual connection structure can further resolve the gradient disappearance problem, leading to an essential improvement in the classification effectiveness of the model. This paper used deep learning algorithms to classify the defective images of plastic components. Residual connectivity will be the further prospect of the classification algorithm in this work.
- (4)
- The convergence trend and value of loss function should be further optimized. The convergence of the loss function of the model in this study is insufficient to pursue the generalizability of the model, and the convergence value of the loss function of the final accepted network structure is 1.1627. Further study can pay attention to ways to maintain classification accuracy while progressively reducing convergence value of the loss function.
6.2. Conclusions
With the advent of Industry 4.0, the production methods of the manufacturing industry are undergoing deep changes [41,42]. This paper proposes an integrated idea of “processing–matching–classification–diagnosis” based on machine vision and deep learning. Additionally, this paper realizes the automation and intelligence of fault diagnosis for injection molding machines. It also builds an intelligent system for defect detection and fault diagnosis in injection molding.
- (1)
- This paper summarized a theoretical system for processing fault classification for plastic part failure to address the issue of processing an image dataset of injection-molded plastic components. This system emphasized the theoretical connection between the eight primary types of plastic part defects and the types of injection molding system failure. The dataset was sorted into nine categories using this theoretical framework (eight defective categories and one qualified category). The image dataset processing provides a realistic foundation for subsequent matching and detection operations. To fully recover fuzzy images, this paper firstly established an image degradation model in this study using a blind deconvolution approach. The gamma transform method was used to process the dataset in greyscale, the random noise of the dataset was removed by using a median filtering algorithm, and the geometric contour data were retrieved by the Canny algorithm for the subsequent matching procedure.
- (2)
- A matching mechanism between the images to be tested and the standard template was proposed for the detection of flaws in plastic components. The template matching method for plastic components was established by providing an arbitration function with the aid of the dimensional invariance of Hu moments such as rotation, translation, and scaling. This matching mechanism was inspired by conventional machine vision. It is possible to identify and initially classify problematic images of plastic components in the dataset using scientific methods. The plastic components were divided into two groups after being checked by this mechanism: qualifying and faulty.
- (3)
- To address the issue of fault diagnosis in plastic components, this paper began with the matching mechanism, classified the initially discovered defect images using the convolutional neural network method in deep learning, and determined the causes of each type of defect in conjunction with the processing fault classification theoretical system. This paper proposed an improved VGG16 network from the conventional VGG16 convolutional neural network by adjusting its network topology and hyperparameters. The improved VGG16 achieved defect image classification and fault diagnosis with a high quality of 96.67% classification accuracy.
Author Contributions
Conceptualization, Z.H. and L.Q.; data curation, Z.Y.; formal analysis, Z.Y. and L.Q.; funding acquisition, L.Q.; investigation, Z.H.; methodology, Z.H. and L.Q.; project administration, L.Q.; resources, L.Q.; software, Z.H. and Z.Y.; validation, Z.H., Z.Y. and L.Q.; visualization, Z.H.; writing—original draft, Z.H. and Z.Y.; writing—review & editing, Z.H., Z.Y. and F.X.; All authors have read and agreed to the published version of the manuscript.
Funding
This research was funded by the national key research and development program (No. 2018YFC0808405) and 2020’WHDZ TALENTS project (1219-4).
Institutional Review Board Statement
Not applicable.
Informed Consent Statement
Not applicable.
Data Availability Statement
The data were obtained from the following: https://www.kaggle.com/datasets/leonardhuuu/mold-data (accessed on 31 May 2022). Camera parameters, geometry size of plastic components, light intensity, and ambient noise all affected the test results.
Conflicts of Interest
The authors declare no conflict of interest.
References
- Zhou, J.; Li, P.; Zhou, Y.; Wang, B.; Zang, J.; Meng, L. Toward new-generation intelligent manufacturing. Engineering 2018, 4, 11–20. [Google Scholar] [CrossRef]
- Dang, X.P. General frameworks for optimization of plastic injection molding process parameters. Simul. Model. Pract. Theory 2014, 41, 15–27. [Google Scholar] [CrossRef]
- Kurt, M.; Kamber, O.S.; Kaynak, Y.; Atakok, G.; Girit, O. Experimental investigation of plastic injection molding: Assessment of the effects of cavity pressure and mold temperature on the quality of the final products. Mater. Des. 2009, 30, 3217–3224. [Google Scholar] [CrossRef]
- Scime, L.; Beuth, J. Anomaly detection and classification in a laser powder bed additive manufacturing process using a trained computer vision algorithm. Addit. Manuf. 2018, 19, 114–126. [Google Scholar] [CrossRef]
- Park, C.H.; Kim, N.H. Precise and reliable positioning based on the integration of navigation satellite system and vision system. Int. J. Automot. Technol. 2014, 15, 79–87. [Google Scholar] [CrossRef]
- Zhou, Y.; Pei, Y.; Li, Z.; Fang, L.; Zhao, Y.; Yi, W. Vehicle weight identification system for spatiotemporal load distribution on bridges based on non-contact machine vision technology and deep learning algorithms. Measurement 2020, 159, 107801. [Google Scholar] [CrossRef]
- Taweelerd, S.; Chang, C.; Tzou, G. Vision system based on deep learning for product inspection in casting manufacturing: Pump impeller images. In Proceedings of the Journal of Physics: Conference Series. Taiwan, China, 21–23 May 2021. [Google Scholar]
- Geronimo, D.; Lopez, A.M.; Sappa, A.D.; Graf, T. Survey of pedestrian detection for advanced driver assistance systems. IEEE Trans. Pattern Anal. Mach. Intell. 2009, 32, 1239–1258. [Google Scholar] [CrossRef]
- Habib, M.T.; Majumder, A.; Jakaria, A.; Akter, M.; Uddin, M.S.; Ahmed, F. Machine vision based papaya disease recognition. J. King Saud Univ.-Comput. Inf. Sci. 2020, 32, 300–309. [Google Scholar] [CrossRef]
- Liu, G.; Shen, W.; Gao, L.; Kusiak, A. Knowledge transfer in fault diagnosis of rotary machines. IET Collab. Intell. Manuf. 2022, 4, 17–34. [Google Scholar] [CrossRef]
- Liu, Q.; Dong, R.; Liu, H.; Wang, F.; Tian, Y.; Hu, D.; Ding, C. A detection method of weak and small defects based on fluo-rescence imaging technology. In Proceedings of the Pacific Rim Laser Damage 2021: Optical Materials for High-Power Lasers, Hangzhou, China, 9 August 2021. [Google Scholar]
- Torres, F.; Sebastian, J.M.; Aracil, R.; Jiménez, L.M.; Reinoso, O. Automated real-time visual inspection system for high-resolution superimposed printings. Image Vis. Comput. 1998, 16, 947–958. [Google Scholar] [CrossRef]
- Li, D.; Liang, L.Q.; Zhang, W.J. Defect inspection and extraction of the mobile phone cover glass based on the principal components analysis. Int. J. Adv. Manuf. Technol. 2014, 73, 1605–1614. [Google Scholar] [CrossRef]
- Scime, L.; Beuth, J. A multi-scale convolutional neural network for autonomous anomaly detection and classification in a laser powder bed fusion additive manufacturing process. Addit. Manuf. 2018, 24, 273–286. [Google Scholar] [CrossRef]
- Scime, L.; Beuth, J. Using machine learning to identify in-situ melt pool signatures indicative of flaw formation in a laser powder bed fusion additive manufacturing process. Addit. Manuf. 2019, 25, 151–165. [Google Scholar] [CrossRef]
- Scime, L.; Siddel, D.; Baird, S.; Paquit, V. Layer-wise anomaly detection and classification for powder bed additive manufacturing processes: A machine-agnostic algorithm for real-time pixel-wise semantic segmentation. Addit. Manuf. 2020, 36, 101453. [Google Scholar] [CrossRef]
- Dauphin, Y.N.; Fan, A.; Auli, M.; Grangier, D. Language modeling with gated convolutional networks. In Proceedings of the International Conference on Machine Learning, Sydney, Australia, 6–11 August 2017. [Google Scholar]
- Gehring, J.; Auli, M.; Grangier, D.; Yarats, D.; Dauphin, Y.N. Convolutional sequence to sequence learning. In Proceedings of the International Conference on Machine Learning, Sydney, Australia, 6–11 August 2017. [Google Scholar]
- Zhang, X.; Zhao, J.; LeCun, Y. Character-level convolutional networks for text classification. In Proceedings of the Annual Conference on Neural Information Processing Systems (NIPS), Montreal, Canada, 7–12 December 2015. [Google Scholar]
- Chen, C.; Seff, A.; Kornhauser, A.; Xiao, J. DeepDriving: Learning Affordance for Direct Perception in Autonomous Driving. In Proceedings of the IEEE International Conference on Computer Vision (ICCV), Santiago, Chile, 11–18 December 2015. [Google Scholar]
- Hinton, G.E.; Salakhutdinov, R.R. Reducing the dimensionality of data with neural networks. Science 2006, 313, 504–507. [Google Scholar] [CrossRef]
- LeCun, Y.; Boser, B.; Denker, J.; Henderson, D.; Howard, R.; Hubbard, W.; Jackel, L. Handwritten digit recognition with a back-propagation network. In Proceedings of the 2nd International Conference on Neural Information Processing Systems, Cambridge, MA, USA, 1 January 1989. [Google Scholar]
- Soukup, D.; Huber-Mörk, R. Convolutional neural networks for steel surface defect detection from photometric stereo images. In Proceedings of the International Symposium on Visual Computing, Las Vegas, NV, USA, 8–10 December 2014. [Google Scholar]
- Masci, J.; Meier, U.; Fricout, G.; Schmidhuber, J. Multi-scale pyramidal pooling network for generic steel defect classification. In Proceedings of the 2013 International Joint Conference on Neural Networks (IJCNN), Dallas, TX, USA, 4–9 August 2013. [Google Scholar]
- Chen, C.C.; Su, P.L.; Lin, Y.C. Analysis and modeling of effective parameters for dimension shrinkage variation of injection molded part with thin shell feature using response surface methodology. Int. J. Adv. Manuf. Technol. 2009, 45, 1087–1095. [Google Scholar] [CrossRef]
- Song, M.; Liu, Y.; Chang, H. Development of high pressure injection technology for normal hydraulic injection molding machines. Int. Polym. Process. 2018, 33, 52–59. [Google Scholar] [CrossRef]
- Zhao, N.y.; Lian, J.y.; Wang, P.f.; Xu, Z.b. Recent progress in minimizing the warpage and shrinkage deformations by the optimization of process parameters in plastic injection molding: A review. Int. J. Adv. Manuf. Technol. 2022, 120, 85–101. [Google Scholar] [CrossRef]
- Büttner, H.; Maradia, U.; Suarez, M.; Stirnimann, J.; Wegener, K. Development of Process Chain for Micro-Injection Molding. Procedia CIRP 2020, 95, 584–589. [Google Scholar] [CrossRef]
- Mohan, M.; Ansari, M.; Shanks, R.A. Review on the effects of process parameters on strength, shrinkage, and warpage of injection molding plastic component. Polym.-Plast. Technol. Eng. 2017, 56, 1–12. [Google Scholar] [CrossRef]
- Edirisinghe, M.; Evans, J. Review: Fabrication of engineering ceramics by injection moulding, II Techniques. Int. J. High Technol. Ceram. 1986, 2, 249–278. [Google Scholar] [CrossRef]
- Zhang, L.; Zhao, G.; Dong, G.; Li, S.; Wang, G. Bubble morphological evolution and surface defect formation mechanism in the microcellular foam injection molding process. RSC Adv. 2015, 5, 70032–70050. [Google Scholar] [CrossRef]
- Pei, Y.; Huang, Y.; Zou, Q.; Zhang, X.; Wang, S. Effects of image degradation and degradation removal to CNN-based image classification. IEEE Trans. Pattern Anal. Mach. Intell. 2019, 43, 1239–1253. [Google Scholar] [CrossRef] [PubMed]
- Zhu, P.; Jiang, Z.; Zhang, J.M.; Zhang, Y.; Wu, P. Remote sensing image watermarking based on motion blur degeneration and restoration model. Optik 2021, 248, 168018. [Google Scholar] [CrossRef]
- Canny, J. A computational approach to edge detection. IEEE Trans. Pattern Anal. Mach. Intell. 1986, PAMI-8, 679–698. [Google Scholar] [CrossRef]
- Adamo, F.; Attivissimo, F.; Di Nisio, A.; Savino, M. A low-cost inspection system for online defects assessment in satin glass. Measurement 2009, 42, 1304–1311. [Google Scholar] [CrossRef]
- Cha, Y.J.; Choi, W.; Büyüköztürk, O. Deep learning-based crack damage detection using convolutional neural networks. Comput.-Aided Civil Infrastruct. Eng. 2017, 32, 361–378. [Google Scholar] [CrossRef]
- Ko, B.C.; Gim, J.W.; Nam, J.Y. Automatic white blood cell segmentation using stepwise merging rules and gradient vector flow snake. Micron 2011, 42, 695–705. [Google Scholar] [CrossRef]
- Hu, M.K. Visual pattern recognition by moment invariants. IEEE Trans. Inf. Theory 1962, 8, 179–187. [Google Scholar]
- Simonyan, K.; Zisserman, A. Very deep convolutional networks for large-scale image recognition. arXiv 2014, arXiv:1409.1556. [Google Scholar]
- Sharma, S.; Sharma, S.; Athaiya, A. Activation functions in neural networks. IJEAST 2017, 6, 310–316. [Google Scholar] [CrossRef]
- Nasiri, S.; Khosravani, M.R. Faults and failures prediction in injection molding process. Int. J. Adv. Manuf. Technol. 2019, 103, 2469–2484. [Google Scholar] [CrossRef]
- Kozjek, D.; Kralj, D.; Butala, P.; Lavrač, N. Data mining for fault diagnostics: A case for plastic injection molding. Procedia CIRP 2019, 81, 809–814. [Google Scholar] [CrossRef]
Publisher’s Note: MDPI stays neutral with regard to jurisdictional claims in published maps and institutional affiliations. |
© 2022 by the authors. Licensee MDPI, Basel, Switzerland. This article is an open access article distributed under the terms and conditions of the Creative Commons Attribution (CC BY) license (https://creativecommons.org/licenses/by/4.0/).


