Abstract
The spatial separation between residences and workplaces of citizens is a challenge encountered by many, causing urban problems like long-distance commutes, traffic congestion, and environmental pollution due to the heavy usage of cars. As a result of this phenomenon, metro transportation has become an increasingly important means of transportation in metropolises. To further understand the spatial separation issues, we analyzed the spatial distribution characteristics of areas under the influence of metro transportation in metropolises, and this could provide new approaches to this challenge. This research used Guangzhou city as a case study to investigate the spatial distribution characteristics of residences and workplaces from two perspectives: accessibility, and the type of the travelers’ industries. The analysis was mainly based on (1) passengers’ travel data provided by Guangzhou Metro Group Co., Ltd. (Guangzhou, China); (2) the resident population, based on the sixth national census in China; and (3) the employed population, based on the third economic census of China. Our research resulted in three key findings. First, the spatial separation of residences and workplaces was generally noticeable in Guangzhou but was less noticeable in the area with metro stations. Second, workplaces were concentrated in the central ring while residences were concentrated in the inner suburban ring in Guangzhou. Third, there was a relative concentration of workplaces in the same service industry and the workplaces of each service industry were concentrated in separate, respective areas in Guangzhou. On the basis of these findings, we provided suggestions for policymakers to develop specific and effective actions to mitigate the negative impacts of spatial separation.
1. Introduction
Topics related to residences, workplaces, and commuting behaviors provided important content for research in economics, geography, and sociology [1]. The previous studies mainly focus on people’s options for residences, workplaces, and transportation, emphasizing the balance between commuting costs and housing costs [2,3,4,5,6], and the impacts of land use on commuting behaviors [7], and also influencing the factors of urban commuting behaviors such as urban spatial structure [8], land use [9,10], and family-life course [11,12,13,14,15,16,17,18]. Recently, the metropolis has been gaining increasing attention from the scholars researching these topics.
A metropolis is a region that consists of a densely populated urban agglomeration and its surrounding territories which share industries, commercial areas, transport networks, infrastructures, and housing [19,20]. The availability of transportation options and the capacity of residents to travel to their destinations in metropolises are typically not distributed equitably among the various social classes and geographical zones [21]. The manifestation of this phenomenon is the spatial mismatch problem, which originated from the geographical mismatch between the distributions of housing segregation and the unemployment workforce [22]. Based on the spatial mismatch hypothesis (SMH) put forward by John F. Kain [22], Zhou et al. [23] indicated that the spatial mismatch problem has resulted in an increased cost of living, rising unemployment, persistent poverty, and other social problems for the low-income group, which may also cause traffic congestion, increased commuting costs, low-skilled labor force unemployment, a widening income gap, and a series of other urban problems.
In many metropolises, the creation of suburbs can be attributed to the complex and changing process of suburbanization, which is influenced materially by the economy and the ways of life of those who live in central urban areas [24]. In recent years, mostly as a result of the populations of residential areas moving to the suburbs in metropolises, metropolitan suburbanization has become increasingly prevalent in China, while workplaces are still located in business areas in city centers [25,26]. It was estimated that the average commuting distance in China is 9 km, which takes about 30 min. In metropolises such as Beijing, Shanghai, Guangzhou, and Shenzhen, the average commuting distance is 20 km, which takes about 60 min, and this is still increasing [27,28]. As a result, the spatial separation of residences and workplaces has become common in metropolises, bringing about spatial mismatch problems such as long-distance commutes, traffic congestion, and environmental pollution due to the heavy usage of cars [27].
Since the study of the spatial separation of residences and workplaces is of great significance for the realization of high-quality urbanization [29], metro transportation is being widely applied in an increasing number of metropolises because of its high speed, punctuality, large traffic volume, and security. In mainland China, 36 cities have operating metro systems, of which Guangzhou was one of the first. Since 1997, Guangzhou has accumulated 14 operating metro lines with 257 metro stations [30]. By the end of 2018, there was a total metro-line length of 478 km, covering 54% of the area of Guangzhou, with an average daily passenger volume of 9.4959 million, ranking it third in China [30]. According to the Guangzhou Rail Transportation Network Planning (2018–2035), the proportion of public transport options operating in motorized mode should be greater than or equal to 80%, among which metro transportation should be greater than or equal to 70% [31]. Nevertheless, despite the development of metro transportation, since 2000, Guangzhou’s spatial separation of residences and workplaces has been relatively noticeable [1]. Given that metro transportation is widely applied in Guangzhou, where the spatial separation of residences and workplaces exists, Guangzhou was taken as a case study to analyze the spatial distribution characteristics of residences and workplaces under the influence of metro transportation in metropolises.
First, this research analyzed the accessibility to residences and workplaces around metro stations to further investigate whether metro transportation eases the separation of residences and workplaces. According to Geurs and van Wee [32], accessibility can be defined as the extent to which land-use and transport systems enable (groups of) individuals to reach activities or destinations by means of a (combination of) transport mode(s). Generally, it is mostly considered that metro transportation is beneficial for improving accessibility to workplaces, but accessibility to residences is ignored in many cases [33,34]. Considering this paper aims on studying the spatial separation of residences and workplaces, the accessibility to both residences and workplaces will be taken into account to make a comparison that can be used to understand their differences and similarities.
Second, this research investigated the accessibility preferences of people working in different industries regarding the use of metro transportation for travel to better understand the differences in accessibility to the workplace for different industries. In the previous studies, there is a research gap in the study of the characteristics of travelers’ industries in terms of the spatial distributions of residences and workplaces [35]. To study the commuters’ industries, this study mainly focused on travelers from the service industry. There are three reasons: firstly, in Guangzhou, the contribution rate of the service industries to economic growth was 71.1% in 2021 [36], playing a pivotal role in economic development; secondly, recent research showed that metro transportation has a significantly positive effect on the agglomeration of the service industry in Guangzhou [37]; thirdly, compared with employees from the agriculture and manufacturing industries, the dependence of employees from the service industry on metro transportation is higher.
2. Materials and Methods
2.1. Study Area
With a history of more than 2000 years, Guangzhou is considered a metropolis and has been elevating the collective voice of metropolises on the global stage and fostering global cooperation, dialogue, and the sharing of knowledge and solutions that are grounded in the experience of its members for more than 35 years [38]. It covers an area of 7434.40 square kilometers and has a population of 18.81 million [39]. Based on the routes of metro lines and the locations of metro stations, in this research, the area of Guangzhou (Figure 1) was divided into three geographic rings (Table 1) centered around Zhujiang New Town Station.
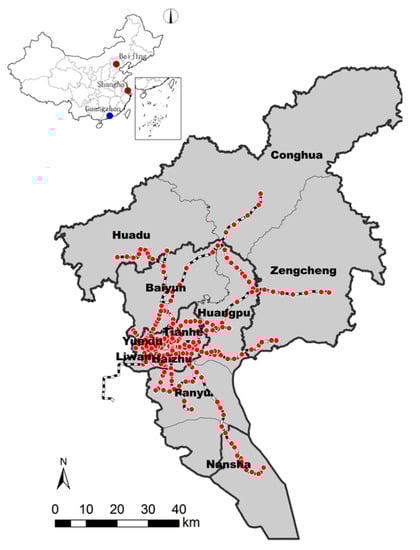
Figure 1.
Guangzhou Metro Map.

Table 1.
The three geographic rings used in this study.
2.2. Data Sources
2.2.1. Passenger Flow Data
The passenger flow data on Wednesday 24 April 2018, covering 9.49 million passengers traveling from 221 metro stations in Guangzhou, were metro card swiping data provided by Guangzhou Metro Group Co., Ltd. (Guangzhou, China). To analyze the raw data, particular settings were used in this research (shown in Table 2). First, based on the change in passenger flow at different times, the morning and evening peak periods for entering metro transportation were set to be 07:00–08:00 and 17:00–18:00, respectively, while the morning and evening peak periods for exiting metro transportation were set to be 08:00–09:00 and 18:00–19:00, respectively. Second, according to the passenger flow in and out of the metro stations during the morning and evening peak periods, two cohorts were studied: (1) people traveling to residences (number of people who entered metro stations during the morning peak periods and exited during the evening peak periods); and (2) people traveling to workplaces (number of people who exited metro stations during the morning peak periods and entered during the evening peak periods).
Table 2.
Identification of the peak periods and two cohorts.
Based on the settings mentioned above, the passenger flow data showed that 1.68 million people were traveling to residences and 1.60 million people were traveling to workplaces, accounting for 34.58% of the total passenger flow.
2.2.2. Data of the Resident and Employed Population
In this research, there were two sources for collecting data on the employed population and the resident population, respectively. In both of these two sources, the population was subdivided to the town (street) level and subdivided according to the national economic industry classification standard [40,41]. (1) The data used for studying the resident population came from the population census sample survey of China’s 1% population in 2015, which was revised based on the sixth national census in China [42]. This provides information about residents and reflects the residential characteristics of the population to a large extent. (2) The data used for studying the employed population of different industries came from the third economic census of China, which was conducted in 2012. The results may vary, with some records showing where a business is registered and others showing where the workplace actually is, but the data can reflect the employment characteristics of the population as a whole [43]. As mentioned in the introduction section of this article, this study mainly focused on the resident and employed population from the service industry. According to China’s national industry classification standard for the economy, 14 detailed service industries can be classified into four main service industry types (shown in Table 3).
Table 3.
Four main service industry types.
The resident and employed population of four main service industries were subdivided at the spatial scale of towns or streets (there was a total of 166 towns and streets in Guangzhou), from which the number of people from the service industry living in residences was 369.37 million, while the number of people from the service industry working in workplaces was 283.89 million. It seems that these two figures are different mainly because of the differences in statistical caliber: unlike the population census, the economic census mainly counts the number of employees in enterprises above the designated size. However, these two figures do not show considerable differences; therefore, they may still largely reflect the main characteristics of the population in residences and workplaces. For all metro stations studied in this research, the ratio between people traveling to residences and the number of residents practicing in the service industry was found to be 45.57%, while the ratio between people traveling to workplaces and the number of employees practicing in the service industry was 56.39%, indicating that the proportion of Guangzhou residents commuting by metro was relatively high.
2.3. Research Methods
2.3.1. The Two-Step Floating Catchment Area (2SFCA) Method
In this study, accessibility is defined as the ease and comfort of a person reaching a facility or an activity from a particular location [42]. As a result, the accessibility to residences or workplaces could be understood as the ease and comfort of a person reaching their residence or workplace from metro stations. Typically, two main approaches to the study of the spatial relationship between a residence and a workplace were used in the previous research: one is the commuting distance or time, while the other is the ratio between the population of the workplace and that of the residence. The data for these variables are relatively easy to collect and analyze, but cannot be used to express the distance-decay law of the supply-and-demand relationship between residences and workplaces [43,44,45,46].
Hence, in addition to the two approaches mentioned above, the two-step floating catchment area (2SFCA) method was proposed to improve the measuring accuracy of spatial accessibility in this study. First developed by Luo [46], the 2SFCA method model (Figure 2) is a widely used gravity-based model that addresses the supply-demand issue through the development of a spatial decomposition method [47,48,49,50]. The process for calculating the 2SFCA method is as follows [51,52]: first, determine the population that falls within the catchment of each service provider (that is, the potential population size being “served”), and second, allocate available services to populations by determining which services fall within the catchment area of each population. This paper presents an enhancement to the 2SFCA method by applying weights to differentiate travel time zones in both the first and second steps, thereby accounting for distance decay. To differentiate between the levels of accessibility within a catchment, multiple travel time zones within each catchment were assigned with different weights according to the Gaussian function [53,54].
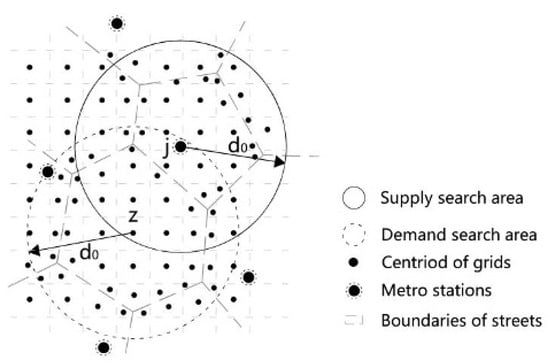
Figure 2.
The concept of the two-step floating catchment area model.
Census zones usually depend on geographic data access, and in most cases, they are consistent with administrative boundaries. However, in practice, there is often the problem of large differences in the area of administrative spatial units in Guangzhou, which complicated the calculation of accessibility. In such cases, the grid network was introduced so that the population catchment fits in the context of Guangzhou [43]. Given that this study focused on Guangzhou, which is a city with an excessive range of administrative spatial unit scales, and that the acceptable distance from a metro station to a residence or employment place is 0.5–1.5 km for travelers, a 500 × 500 m grid was used for the accessibility calculation in this study (Figure 2).
In this study, the 2SFCA method was implemented in the following two steps.
The first step was to determine the supply-to-demand ratio of each residence or workplace space:
In the formulas above, Rj is the supply-to-demand ratio of metro station j; Sj is the supply capacity of metro station j, which is determined by its passenger flow volume; dkj is the distance between metro station j and grid k; is the distance from the actual figure to the threshold, which expresses the range affected by this metro station; is the population of grid k; is the area of grid k; is the area of street z; is the population of street z (to calculate the accessibility to residences, the number of residents was adopted; to calculate accessibility to workplaces, the number of employees was adopted); and G(dkj, ) is the friction coefficient of the Gaussian distance from metro station j to grid k.
The second step was to calculate the accessibility:
In the formulas above, Ak is the accessibility of grid k and Az is the accessibility to the street.
2.3.2. Ratio
Various measurements have been proposed to describe the balance between the spatial distribution of residences and workplaces, including the ratio of jobs to housing units, commuting time or distance-based indicators, home-based job accessibility, and the worker-shift ratio [55]. In this research, the ratio of the employed population to the resident population within a given geographic area, first proposed by Cervero [56], which has been generally and widely accepted [57], was adopted as an easy measurement for studying the spatial distribution of residences and workplaces. To be more specific, we will study the ratio of the employed population to the resident population in four main service industries within a radius of 1500 m around metro stations. Similarly, to further understand the spatial separation problem, this research tried to use the ratio between the accessibility to workplaces and the accessibility to residences to study the spatial distribution of the accessibility to workplaces and the accessibility to residences.
2.3.3. Multiple Regression
The multiple regression analysis method was adopted to study the relationship between travelers’ industries and their accessibility to residences or workplaces in each ring, where the number of employees in service industries as a proportion of the total employed population was used as an independent variable and the accessibility to residences or workplaces was the dependent variable.
3. Results and Analysis
3.1. The Overall Spatial Characteristics of Residences and Workplaces
- (1)
- The spatial separation of residences and workplaces was generally noticeable.
Comparing Figure 3a,b shows that the separation of residences and workplaces existed in Guangzhou, which puts great pressure on urban traffic. As shown in Figure 3, the locations of residences were scattered, mainly in suburbs, such as Baiyun District, Huadu District, Panyu District, and Zengcheng District, where there were quite a few large-scale real-estate residential buildings. However, the locations of workplaces were mainly concentrated in the central city and in industry groups, such as Panyu District, Huadu District, Zengcheng District, and Xintang District, alongside which the metro lines run.
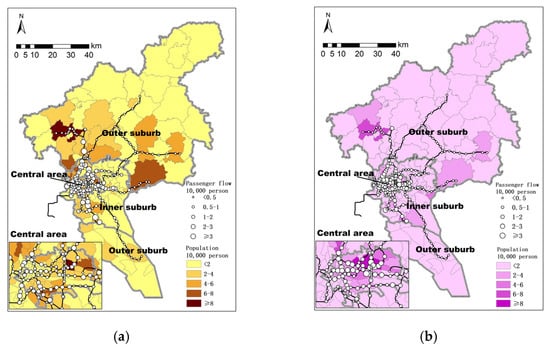
Figure 3.
(a) Spatial distribution of residents and people traveling to a residence (number of people who entered metro stations during the morning peak periods and exited during the evening peak periods). (b) Spatial distribution of employees and people traveling to a workplace (number of people who exited metro stations during the morning peak periods and entered during the evening peak periods).
- (2)
- The spatial separation of residences and workplaces was less noticeable in the area with metro stations.
Figure 4 compares the spatial distribution of two different ratios: the ratio between the accessibility to workplaces and the accessibility to residences (with metro stations around); and the ratio between the accessibility to workplaces and the accessibility to residences (without metro stations around). From Figure 4, under the influence of metro transportation, the spatial separation of residences and workplaces was less noticeable.
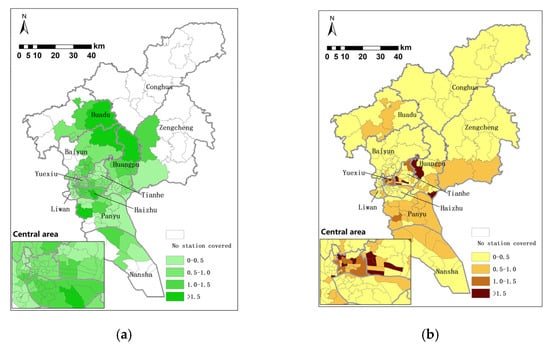
Figure 4.
(a) Ratio between the accessibility to workplaces and the accessibility to residences (with metro stations around). (b) Ratio between the accessibility to workplaces and the accessibility to residences (without metro stations around).
3.2. Different Spatial Concentration Characteristics of Workplaces and Residences
The results of the accessibility analysis showed that with metro stations around, the spatial distribution of accessibility to residences and to workplaces was similar. However, the accessibility to workplaces around metro stations (87.4 on average) was higher than that of residences around metro stations (62.4 on average). For the average ratio between the accessibility to workplaces and the accessibility to residences, one with metro stations around was 1.40, while the other without metro stations around was only 0.73, which indicated that the locations of metro stations were relatively workplace oriented. The average level of accessibility to residences or workplaces varied significantly between the central ring, inner suburban ring, and outer suburban ring, with different average commuting distances for related reasons, as discussed below (Table 4). From Table 4, workplaces were concentrated in the central ring while residences were concentrated in the inner suburban ring in Guangzhou.
Table 4.
Average accessibility, commuting distance, and reasons for differences in different rings.
From the perspective of spatial distribution, the accessibility to both residences and workplaces indicated the characteristic of centralization in the central ring of Guangzhou (Figure 5). Most of the streets with high accessibility were located in the CBD area of Zhujiang New Town, for example, Xiancun Street, Lieide Street, Tianhe South Street, and Shipai Street. In addition, other streets in the central ring had high accessibility, especially in Haizhu District, where a large number of commercial, financial, cultural, and entertainment industries were located nearby dense metro stations with large passenger flows. It was found that with metro transportation, the attraction of the central area was strengthened.
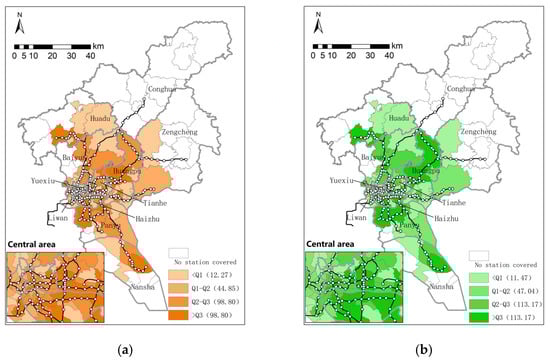
Figure 5.
(a) Accessibility to residences in Guangzhou. (b) Accessibility to workplaces in Guangzhou.
3.3. Spatial Characteristics of Residences and Workplaces for People in the Same Industries
- (1)
- There was a relative concentration of workplaces in the same service industry.
Table 5 shows the ratio of the employed population to the resident population in four main service industries within a radius of 1500 m around metro stations, from which the following findings were obtained. First, the ratio of workplaces related to traditional service industries was relatively low overall and decreased from the center to the outer ring, which showed that more traditional service industry workplaces were distributed in the central ring. Second, the ratios of modern service industry and science and technology service industry workplaces were greater than 1, where modern service industry workplaces were found at a higher level in the central ring, while science and technology service industry workplaces were found at a higher level in the central and inner suburban rings. This showed that the locations of modern service industry and science and technology workplaces were centrally oriented but modern service industry workplaces were more centrally oriented than science and technology service industry workplaces. Third, the ratio of public service industry workplaces was close to 1, and the ratios were similar in the different rings, which showed that the workplaces and residents in this industry were relatively well-balanced and dispersed.
Table 5.
Ratios of the employed population to the resident population in different industrial sectors.
- (2)
- The workplaces of each service industry were concentrated in separate, respective areas of Guangzhou. There was a certain relationship between accessibility to residences or workplaces and the distance from the center in each ring for people in the same industry, as shown in Table 6.
Table 6. Regression coefficients of accessibility to residences or workplaces and populations for four different service industry types.
In terms of the traditional service industry, people’s accessibility to residences or workplaces was found to decrease from the center to the outside, and their impact coefficients were similar, which showed that the distance between the residence and workplace of traditional service workers was relatively small and that the possibility of choosing the metro as the form of commuting was high but gradually decreased from the center to the outside.
In terms of the modern service industry and people’s accessibility to residences, a strong positive correlation with distance from the center in the inner suburban ring was shown, whereby the closer to the center of the inner suburban ring a residence was, the higher the accessibility was. However, in the central ring and outer suburban ring, there was a small or negative correlation between people’s accessibility to residences and the commuting distance between the central ring and the outer suburban ring. People’s accessibility to workplaces was strongly positively correlated with the distance from the center in the central ring. This gradually weakened moving outward and became negatively correlated with the distance from the center in the outer suburban ring. The following conclusions were drawn. First, the spatial separation of the workplaces and residences of people working in the modern service industry was prominent. Their residences were more concentrated in the suburban rings, and their workplaces were more concentrated in the central ring. Second, people living in the outer suburban ring had a higher probability of commuting by metro, but those living in the central and outer suburban rings had a lower probability of commuting by metro. Third, people who worked in the central ring had a higher probability of commuting by metro, but those who were employed in the suburban ring had a lower probability of commuting by metro.
In terms of science and technology services, regarding people’s accessibility to residences, a negative correlation between the commute distance in the central ring was found. However, regarding people’s accessibility to workplaces, there was a strong positive correlation with the commute distance in the central and inner suburban rings and a negative correlation with the commute distance in the outer suburban ring. It can be seen that the spatial separation of science and technology service employees’ workplaces and residences was prominent, and commuting mainly took place between the outer suburban ring and the inner suburban ring or between the outer suburban and the central ring. People living in the outer suburban ring and the inner suburban ring were more likely to choose the metro for commuting, and those working in the inner suburban ring and the central ring were more likely to choose the metro for commuting.
In terms of public service workplaces, people’s accessibility to residences was found to be positively correlated with the commute distance in the central ring and inner suburban ring but negatively correlated or not correlated with the commute distance in the outer suburban ring. This showed that public service employees were more concentrated in the central ring (where there were more government public departments) and the outer suburban ring (where there were more public departments in the original outer-suburban county-level urban areas, while the current outer suburban ring was mostly composed of new urban areas that developed from the combination of urban and rural areas). Public service employees were mainly short-distance commuters within the central ring or the outer suburban ring.
4. Conclusions
Recent research showed that the spatial separation in three metropolises (Beijing, Guangzhou, Shanghai) in China is relatively noticeable [58]. With the further development of metropolises, the urban structure, spatial layout, and urban functions are all changing, and the relationship between residences and workplaces has also undergone new changes [58], which requires related specific perspectives to study different cities’ situations.
Taking Guangzhou as a case, based on influence of metro transportation, this research assessed the spatial distribution of residences and workplaces by considering the urban resident and employed population that engages in metro transportation. We showed (1) the spatial distribution characteristics of residences and workplaces according to the different levels of accessibility to residences and workplaces; (2) the spatial distribution characteristics of service industry workplaces according to the commute characteristics of people from different service industries. This expanded the study of urban spatial distribution from the innovative perspective of accessibility and travelers’ industries.
There were three key findings from this research. First, future metro transportation route planning can be optimized by analyzing the spatial distribution characteristics of residences and different industries’ employee populations based on the existing metro transport network. Second, workplaces were concentrated in the central ring while residences were concentrated in the inner suburban ring in Guangzhou. Third, there was a relative concentration of workplaces in the same service industry and the workplaces of each service industry were concentrated in separate, respective areas of Guangzhou (Table 7).
Table 7.
Spatial distribution characteristics of service industries in Guangzhou.
The conclusions of this research could be used in practice to develop suggestions for optimizing the organization of urban metro transportation systems and the planning of workplace or residence locations. First, future metro transportation route planning can be optimized by analyzing the spatial distribution characteristics of residences and the type of employee population based on the existing metro transport network. Second, the spatial distribution of workplaces can be adjusted to relieve traffic stress. For example, (1) the backward traditional service industry (such as some old wholesale markets located in Guangzhou’s central areas) can be encouraged to transfer to the suburbs; (2) the modern service industry, which is excessively concentrated (as with the many financial industries concentrated in Zhujiang New Town, for example) can be encouraged to transfer to suburban areas where the new secondary center is; and (3) a flexible working system can be set up for the technology service industry.
5. Limitations
There are still some limitations in this research that need to be further improved upon in follow-up studies.
First, due to a lack of consideration of the commute direction, distance, time, speed, traffic transfer, and other factors, the accuracy of the research conclusion was affected. Taking the metro stations as the connection points between residences and workplaces to compare the accessibility to residences and workplaces around metro stations can only reflect the influence of metro transportation on the spatial distribution of residences and workplaces to a certain extent. With sufficient data, the influences of internal variables on metro transportation in the urban spaces of residences and workplaces could be further studied.
Second, there was a lack of consideration of other forms of transportation, such as private cars and public buses, which are largely complementary to metro transportation. In addition, there was a lack of consideration of aboveground rail transportation lines, such as trams, which can also affect the accurate evaluation of metro transportation in easing the spatial separation of residences and workplaces.
Third, the data used in this study were not comprehensive enough since only one day’s worth of metro card swiping data was studied in this research; therefore, the commute analysis was not comprehensive or sufficient enough to accurately distinguish the passengers’ destinations (residence or workplace). The distance threshold of 1500 m from metro stations failed to take into account the differences in using buses, bicycles, and other means of transportation. In fact, for travelers, it is normal and common that they use other forms of transportation on the ground before or after using metro transportation to reduce their travel costs, improving travel efficiency. However, this research only considers the influence of metro transportation.
Author Contributions
Conceptualization, C.Y. and Q.H.; methodology, C.Y.; software, Q.H. and H.M.; validation, C.Y., Q.H., W.H. and H.M.; formal analysis, W.H.; investigation, W.H.; resources, C.Y.; data curation, Q.H.; writing—original draft preparation, Q.H.; writing—review and editing, W.H. and H.M.; visualization, Q.H.; supervision, C.Y. and H.M.; project administration, W.H. and H.M.; funding acquisition, C.Y. All authors have read and agreed to the published version of the manuscript.
Funding
This research was funded by the National Natural Science Foundation of China under the title of “The impact and evolution processes of urban renewal on social equity of public space from supply-demand perspective”, grant number 41871156.
Institutional Review Board Statement
Not applicable.
Informed Consent Statement
Not applicable.
Data Availability Statement
The data used in the study are available from the authors and can be shared upon reasonable requests.
Conflicts of Interest
The authors declare no conflict of interest.
References
- Liu, W.; Hou, C. Urban residents’ home-work space and commuting behavior in Guangzhou. Sci. Geogr. Sin. 2014, 34, 272–279. [Google Scholar]
- Alonso, W. Location and Land Use; Harvard University: Cambridge, MA, USA, 1964. [Google Scholar]
- Muth, R.F. The spatial structure of the housing market. Pap. Reg. Sci. 1961, 7, 207–220. [Google Scholar] [CrossRef]
- Guest, A.M.; Cluett, A. Workplace and residential location: A push-pull model. J. Reg. Sci. 1976, 16, 400–410. [Google Scholar] [CrossRef]
- White, J.W. A model of residential location choice and commuting by men and women workers. J. Reg. Sci. 1977, 17, 41–52. [Google Scholar] [CrossRef] [PubMed]
- Rouwendal, J.; Meijer, E. Preferences for housing, jobs and commuting: A mixed logit analysis. J. Reg. Sci. 2001, 41, 475–505. [Google Scholar] [CrossRef]
- Horner, M.W. Spatial dimensions of urban commuting: A review of major issues and their implications for future geographic research. Prof. Geogr. 2004, 56, 160–173. [Google Scholar]
- Sultana, S. Some effects of employment centers on commuting times in the Atlanta metropolitan area. Southeast. Geogr. 2000, 41, 225–233. [Google Scholar] [CrossRef]
- David, M.L. Accessibility and the journey to work. J. Transp. Geogr. 1998, 6, 11–21. [Google Scholar]
- Giuliano, G.; Small, K.A. Is the journey to work explained by urban structure? Urban Stud. 1993, 30, 1485–1500. [Google Scholar] [CrossRef]
- Giuliano, G. Information technology, work patterns and intra-metropolitan location: A case study. Urban Stud. 1998, 35, 1077–1095. [Google Scholar] [CrossRef]
- White, M.J. Sex difference in urban commuting patterns. Am. Econ. Rev. 1986, 76, 368–372. [Google Scholar]
- Blumen, O.; Kellerman, A. Gender differences in commuting distance, residence, and employment location; Metropolitan Haifa, 1972 and 1983. Prof. Geogr. 1990, 42, 54–71. [Google Scholar] [CrossRef]
- Blumen, O. Gender differences in the journey to work. Urban Geogr. 1994, 15, 223–245. [Google Scholar] [CrossRef]
- Camstra, R. Commuting and gender in a lifestyle perspective. Urban Stud. 1996, 33, 283–300. [Google Scholar] [CrossRef]
- Sermons, M.W.; Koppelman, F.S. Representing the differences between female and male commute behaviors in the residential location choice model. J. Transp. Geogr. 2001, 9, 101–110. [Google Scholar] [CrossRef]
- Lee, B.S.; McDonald, J.F. Determinants of commuting time and distance for Seoul residents: The impact of family status on the commuting of women. Hous. Stud. 2003, 40, 1283–1302. [Google Scholar] [CrossRef]
- Shen, Q. Spatial and social dimensions of commuting. J. Am. Plan. Assoc. 2000, 66, 68–82. [Google Scholar] [CrossRef]
- Loibl, W.; Etminan, G.; Gebetsroither-Geringer, E.; Neumann, H.M.; Sanchez-Guzman, S. Characteristics of urban agglomerations in different continents: History, patterns, dynamics, drivers and trends. Urban Agglom. 2018, 21, 29–63. [Google Scholar]
- Squires, G.D. Urban Sprawl: Causes, Consequences, & Policy Responses; The Urban Institute: Washington, DC, USA, 2002. [Google Scholar]
- Mohammed, M.; Senadheera, S. Public transport affordability evaluation for Addis Ababa city. Sustainability 2022, 14, 6883. [Google Scholar] [CrossRef]
- Kain, J. Housing segregation, negro employment, and metropolitan decentralization. Q. J. Econ. 1968, 82, 175–197. [Google Scholar] [CrossRef]
- Zhou, C.S.; Ye, C.D. Features and causes of urban spatial growth in Chinese metropolises. Acta Geogr. Sin. 2013, 68, 728–738. [Google Scholar]
- Woodbury, C. Suburbanization and Suburbia. Am. J. Public Health Nations Health 1955, 45, 1–10. [Google Scholar] [CrossRef] [PubMed]
- Lyu, P.; Yu, M.; Hu, Y. Contradictions in and improvements to urban and rural residents’ housing rights in China’s urbanization process. Habitat Int. 2020, 97, 102101. [Google Scholar] [CrossRef]
- Wen, J.; Wang, X.; Lian, X. A study on commuting characteristics in Beijing—Based on over 1000 Questionnaires. Hum. Geogr. 2012, 27, 62–68. Available online: http://en.cnki.com.cn/Article_en/CJFDTOTAL-RWDL201205010.htm (accessed on 17 June 2022).
- Jiang, H.; Li, Y.; Chen, L. Spatial pattern evolution of Beijing employment accessibility under influence of subway. Remote Sens. Inf. 2018, 33, 122–127. Available online: http://en.cnki.com.cn/Article_en/CJFDTotal-YGXX201804019.htm (accessed on 26 July 2022).
- Meng, B.; Huang, S.; Yin, Q. Spatial and temporal distribution characteristics of residents’ depart times elasticity in Beijing. J. Geo-Inf. Sci. 2019, 21, 107–117. [Google Scholar] [CrossRef]
- Zhang, H.; Zhao, H.; Meng, S.; Zhang, Y. Research on the jobs-housing balance of residents in peri-urbanization areas in China: A case study of Zoucheng county. Sustainability 2022, 14, 7921. [Google Scholar] [CrossRef]
- Guangzhou Metro Group Co., Ltd. Annual Report 2020. 2022. Available online: https://www.gzmtr.com/ygwm/gsgk/qynb/202106/t20210617_72328.html (accessed on 4 August 2022).
- Guangzhou Municipal Planning and Natural Resources Bureau. 2022. Available online: https://www.gzmtr.com/ygwm/gsgk/gs/202208/t20220802_76350.html (accessed on 12 August 2022).
- Geurs, K.T.; van Wee, B. Accessibility evaluation of land-use and transport strategies: Review and research directions. J. Transp. Geogr. 2004, 12, 127–140. [Google Scholar] [CrossRef]
- Hu, L. Changing job access of the poor: Effects of spatial and socioeconomic transformations in Chicago, 1990–2010. Urban Stud. 2014, 51, 675–692. [Google Scholar] [CrossRef]
- Bunel, M.; Tovar, E. Key issues in local job accessibility measurement: Different models mean different results. Elisabeth Tovar 2014, 51, 1322–1338. [Google Scholar] [CrossRef]
- Sun, T. Spatial mismatch between residences and jobs by sectors in Beijing and its explanations. Geogr. Res. 2015, 34, 351–363. [Google Scholar] [CrossRef]
- Guangzhou Municipal Bureau of Statistics. The 2021 Guangzhou National Economic and Social Development Statistical Bulletin; Guangzhou Municipal Bureau of Statistics: Guangzhou, China, 2022.
- Zhu, H.; Zhu, W.; Zheng, R. The influence of Subways on Service Industry Agglomeration: Taking Guangzhou as an Example. Trop. Geogr. 2021, 41, 114–123. [Google Scholar]
- Metropolis. 2022. Available online: https://www.metropolis.org (accessed on 8 July 2022).
- Guangzhou Statistics Bureau. Conditions of Guangzhou. 2021. Available online: http://tjj.gz.gov.cn/gzsq/content/post_8185652.html (accessed on 20 July 2022).
- National Bureau of Statistics of China. The Sixth National Census in China. 2011. Available online: http://www.stats.gov.cn/tjsj/pcsj/rkpc/6rp/indexch.htm (accessed on 20 May 2022).
- National Bureau of statistics of China. The Third Economic Census of China. 2014. Available online: http://www.stats.gov.cn/tjsj/zxfb/201412/t20141216_653657.html (accessed on 26 May 2022).
- Kanuganti, S.; Sarkar, A.K.; Singh, A.P. Quantifying accessibility to health care using two-step floating catchment area method (2SFCA): A case study in Rajasthan. Transp. Res. Procedia 2016, 17, 391–399. [Google Scholar] [CrossRef]
- Ye, C.; Hu, L.; Li, M. Urban green space accessibility changes in a high-density city: A case study of Macau from 2010 to 2015. J. Transp. Geogr. 2018, 66, 106–115. [Google Scholar] [CrossRef]
- Zhang, C.; Chengdong, Y.; Yan, S. Characteristics of Job-Housing Spatial Relationship and Changes in Beijing: An Empirical Study Based on Data from the 5th, 6th Population Census and Economy Census in 2001 and 2008. City Plan. Rev. 2016, 40, 59–64. Available online: http://en.cnki.com.cn/Article_en/CJFDTotal-CSGH201610010.htm (accessed on 6 May 2022).
- Sheng, W.; Hai-Tao, M. A Comparative Analysis on the Phenomenon of HSR Commuting in China. Urban Probl. 2017, 52–59. Available online: http://en.cnki.com.cn/Article_en/CJFDTOTAL-CSWT201706006.htm (accessed on 24 May 2022).
- Luo, W. Using a GIS-based floating catchment method to assess areas with shortage of physicians. Health Place 2004, 10, 1–11. [Google Scholar] [CrossRef]
- Luo, W.; Qi, Y. An enhanced two-step floating catchment area (E2SFCA) method for measuring spatial accessibility to primary care physicians. Health Place 2009, 15, 1100–1107. [Google Scholar] [CrossRef]
- Chih-Hao, W.; Chen, N. A GIS-based spatial statistical approach to modeling job accessibility by transportation mode: Case study of Columbus, Ohio. J. Transp. Geogr. 2015, 45, 1–11. [Google Scholar] [CrossRef]
- Fransen, K.; Neutens, T.; De Maeyer, P.; Deruyter, G. A commuter-based two-step floating catchment area method for measuring spatial accessibility of daycare centers. Health Place 2015, 32, 65–73. [Google Scholar] [CrossRef]
- Gharani, P.; Stewart, K.; Ryan, G.L. An enhanced approach for modeling spatial accessibility for in vitro fertilization services in the rural midwestern United States. Appl. Geogr. 2015, 64, 12–23. [Google Scholar] [CrossRef]
- Luo, W.; Wang, F. Measures of spatial accessibility to health care in a GIS environment: Synthesis and a case study in the Chicago region. Environ. Plan. B Plan. Des. 2003, 30, 865–884. [Google Scholar] [CrossRef] [PubMed]
- Wang, F.; Luo, W. Assessing spatial and nonspatial factors for healthcare access: Towards an integrated approach to defining health professional shortage areas. Health Place 2005, 11, 131–146. [Google Scholar] [CrossRef] [PubMed]
- Kwan, M. Space-time and integral measures of individual accessibility: A comparative analysis using a point-based framework. Geogr. Anal. 1998, 30, 191–216. [Google Scholar] [CrossRef]
- Wang, L. Immigration, ethnicity, and accessibility to culturally diverse family physicians. Health Place 2007, 13, 656–671. [Google Scholar] [CrossRef]
- Xu, C.; Li, H.; Zhao, J.; Chen, J.; Wang, W. Investigating the relationship between jobs-housing balance and traffic safety. Accid. Anal. Prev. 2017, 107, 126–136. [Google Scholar] [CrossRef]
- Cervero, R. Jobs-housing balancing and regional mobility. J. Am. Plan. Assoc. 1989, 55, 136–150. [Google Scholar] [CrossRef]
- Zheng, Z.; Zhou, S.; Deng, X. Exploring both home-based and work-based jobs-housing balance by distance decay effect. J. Transp. Geogr. 2021, 93, 103043. [Google Scholar] [CrossRef]
- Jia, X.; Wang, F.; Meng, B.; Guo, D. An analysis of job-housing space in China’s megacities—Taking Beijing, Shanghai, and Guangzhou as examples. China Econ. Trade Her. 2021, 5, 158–159. [Google Scholar]
Publisher’s Note: MDPI stays neutral with regard to jurisdictional claims in published maps and institutional affiliations. |
© 2022 by the authors. Licensee MDPI, Basel, Switzerland. This article is an open access article distributed under the terms and conditions of the Creative Commons Attribution (CC BY) license (https://creativecommons.org/licenses/by/4.0/).