Abstract
In the 21st century, global climate change is a key concern for countries all over the world as, in the future, crops will face several extreme events, including an increase of 2–4 °C in the mean temperature with a possible consequent reduction in yield. Wheat (Triticum durum Desf) is one of the most important foods as it provides 20% of the protein for the world population. Since temperature is one of the most limiting factors of crop development, the aim of this trial was to verify the agronomic response of durum wheat to a temperature increase of about 1.5–2.0 °C through the use of short-time adjustment techniques, such as sowing time and variety choice. The experiment foresaw the comparison between two different temperature conditions (ordinary, OT—in the open field, and high, HT—under a polyethylene tunnel), two sowing times (ordinary—OS, and delayed—DS), and three varieties (Ofanto, modern variety; Cappelli, traditional variety; and a mix of the two). HT conditions caused a decline in the wheat yield (−52.5%), but without differences between the two sowing times. The grain quality resulted positively when affected by late sowing times with an increase in 1000 seeds weight and protein percentages and a decrease in shrunken grains. Therefore, it seems that in areas characterized by high temperatures, delayed sowing can improve grain quality without reducing yield quantity compared to ordinary sowing times.
1. Introduction
Durum wheat (Triticum durum Desf) is one of the most important foods for about 35% of the world population [1] as it provides 20% of the total protein [2]. Around the world, durum wheat is cultivated on 17 million ha with a production of 36 million tons [3]. In Italy, in 2021, durum wheat has been cultivated on 1.23 million ha with a production of about 4.0 MT [4].
Temperature is one of the most limiting factors of crop development; in particular, wheat, in the literature, is reported as being extremely sensitive to high temperatures. Temperature severely influences the development and productivity of crops. For each phenological phase, there is an optimal range of temperature, over which the physiological processes are negatively affected. Hay and Walker [5] report that temperature influences the rate of seed germination, seedling growth, and the processes that determine the production of biomass, fruits, and grain. When average “seasonal” temperatures increase, long periods of drought may be encountered, causing decreases in photosynthetic rates with consequent reductions in light interception. For wheat anthesis and grain filling, the optimum temperature ranges between 12–22 °C and when temperatures exceed 30 °C a reduction in wheat grain filling occurs, thereby decreasing yields and quality [6]. Indeed, delayed sowing can cause problems at the grain filling stage with a decreased production [7,8]. In an experiment carried out in India, the findings clearly demonstrated that delayed sowing increases the probability of occurring terminal heat stress during the grain-filling stage, which significantly reduces grain yield [9].
Since 1950, the mean global temperature has increased by 0.72 °C [10] and the climate projections show a further increasing trend with a higher frequency of heat waves and changes in rainfall patterns [10]. On the basis of the expected temperature increase, in order to assure sufficient food production for feeding the increasing world population, it is very important to individuate strategies of food crop adjustment. From future forecasts, the temperatures will increase up to 2.0–2.2 °C by 2100, 3.6 °C in 2200, and 4.6 °C in 2500 [11]. To date, climate change plays a key role in global food security [12].
In the Mediterranean, statistical models assume that warming will exceed the global rate of 20% [11]. However, already now in Mediterranean environments, during the reproductive and grain filling phase that occurs in the summer season, wheat grows with rainfall being low and with heat waves [11]. As said, with climate change, seasonal rainfall will be reduced and extreme climatic events will have greater impacts causing reduced production [13] and quality of grains [14].
A severe challenge in order to fulfill future food demands of a growing population is to mitigate the uncertain climatic variations [15]. All over the world in the past few decades, extreme temperature events have significantly increased [16,17]. On the other hand, a reduction in the length of winter has been observed in many world regions due to global warming [17].
To cope with climate change, it was thought to use old typical wheat varieties or a mix of them with modern varieties. In Italy, until the Green Revolution around the 1970s, old wheat cultivars were the only ones used and they were part of a rural economy aimed at self-sufficiency and satisfying the needs of families. Subsequently, the plant breeding of wheat was carried out by modifying some morphological and physiological traits to satisfy the increased food needs and adapt to new agricultural practices [18,19,20]. The modified traits were: (i) loss of seeds at the time of harvest; (ii) increase in seed size; (iii) decrease in height; and (iv) higher production. However, the old wheat varieties have the characteristic of being more resilient and, therefore, more adaptable to low-input cultivation with a consequent high environmental sustainability; in addition, they also assure a wide genetic variability. In fact, Guarda et al. [21] reported that, since old grains require a low nitrogen requirement, they are a valid choice for rotation with legumes and are suitable for cultivation in Mediterranean environments when organic or low-input farming methods are adopted. It is important to remember that they cannot benefit from high sowing rates and high nitrogen fertilization rates due to their susceptibility to lodging [22] and they are generally later in flowering than modern ones [23].
The aim of this study was to verify the agronomic response of durum wheat to a temperature increase of about 1.5–2.0 °C through the use of short time-adjustment techniques, such as sowing time and variety choice.
2. Materials and Methods
2.1. Experimental Site and Design, and Crop Management
The test was carried out from autumn 2017 to spring 2018 at the experimental site of the Department of Agricultural Science, in Portici (Naples, Italy; lat. 40°49′ N; long. 14°20′ E).
The durum wheat seeds were sowed in 0.21 cm−2 plastic pots, filled with loamy-sand soil (USDA) with the physical and chemical properties reported in Table 1. The sowing density was 400 seeds per square meter corresponding to 84 seeds per pot distributed in five rows.

Table 1.
Physical and chemical properties of the test soil.
The experimental design was a split–split plot with the growth conditions as the main factor, the sowing time as the secondary factor, and varieties as the third one. In particular, the two different temperature conditions were (i) ordinary temperature–in open field (OT) and (ii) high temperature—under a polyethylene tunnel (HT). The two sowing times were: (i) ordinary sowing (OS), made on 7 December 2017, and delayed sowing (DS) on 11 January 2018. Finally, the tested varieties were: (1) Ofanto, “low-size” modern variety; (2) Cappelli, “high-size” traditional variety, and (3) a mix of the two ones (50% Ofanto + 50% Cappelli).
The treatments were replicated four times for a total of 24 pots per environment and distributed in a randomized complete-block design.
Nitrogen (N) was given, as calcium nitrate (26%), at a rate corresponding to 120 kg ha−1 two times: 70% of total, at the end of tillering, and the remaining 30%, at the flowering. The plants’ water demand was satisfied by rainfalls (519 mm during the cycle) and for plants grown under the tunnel a quantity of water corresponding to rainfalls was given. The harvest was made on 13 June for ordinary sowing plants and 25 June for delayed sowing plants.
During the whole cycle, the inside and outside temperatures were continuously monitored using a weather station (Vantage Pro, Davis).
2.2. Crop Growth and Yield Measurements, and Nitrogen Content Determination
During the cycle, the crop growth was monitored using biometric samplings to measure the following parameters: total dry matter (a sample for each treatment and replicate was oven-dried at 60 °C until reaching a constant weight), the height of the plants, and leaf area, which was measured with an electronic leaf area meter (Li-Cor3000, Li-Cor, Lincoln, NE, USA) and reported as Leaf Area Index-LAI (m2 m−2).
At the harvest, the biomass was cut and its components (culms, leaves, and spikes) were separately weighed for determining the fresh and dry weight after oven drying at 60 °C. The plant height and number of spikes per square meter were also recorded. The three samples of 100 seeds per each treatment and replicate, the 1000 kernels weight, and the percentage of vitreous kernels were evaluated by a visual inspection. In addition, the hectolitre weight (kg hL−1), which is a measure of grain ripening, was determined using an automatic analyzer NIR Control Plus (ISOELECTRIC, Electronic Instruments).
Moreover, the dried seeds nitrogen content was determined using the Kjeldhal method and, subsequently, the protein content of kernels was determined by multiplying the nitrogen content by the factor of 6.25.
2.3. Statistical Analysis
All data were subjected to the analysis of variance (two ways-ANOVA), using a general linear model using the SPSS software package (SPSS version 22, Chicago, IL, USA). Means were separated according to the Tukey test at p ≤ 0.05.
3. Results
3.1. Climate Characteristics of Experimental Site
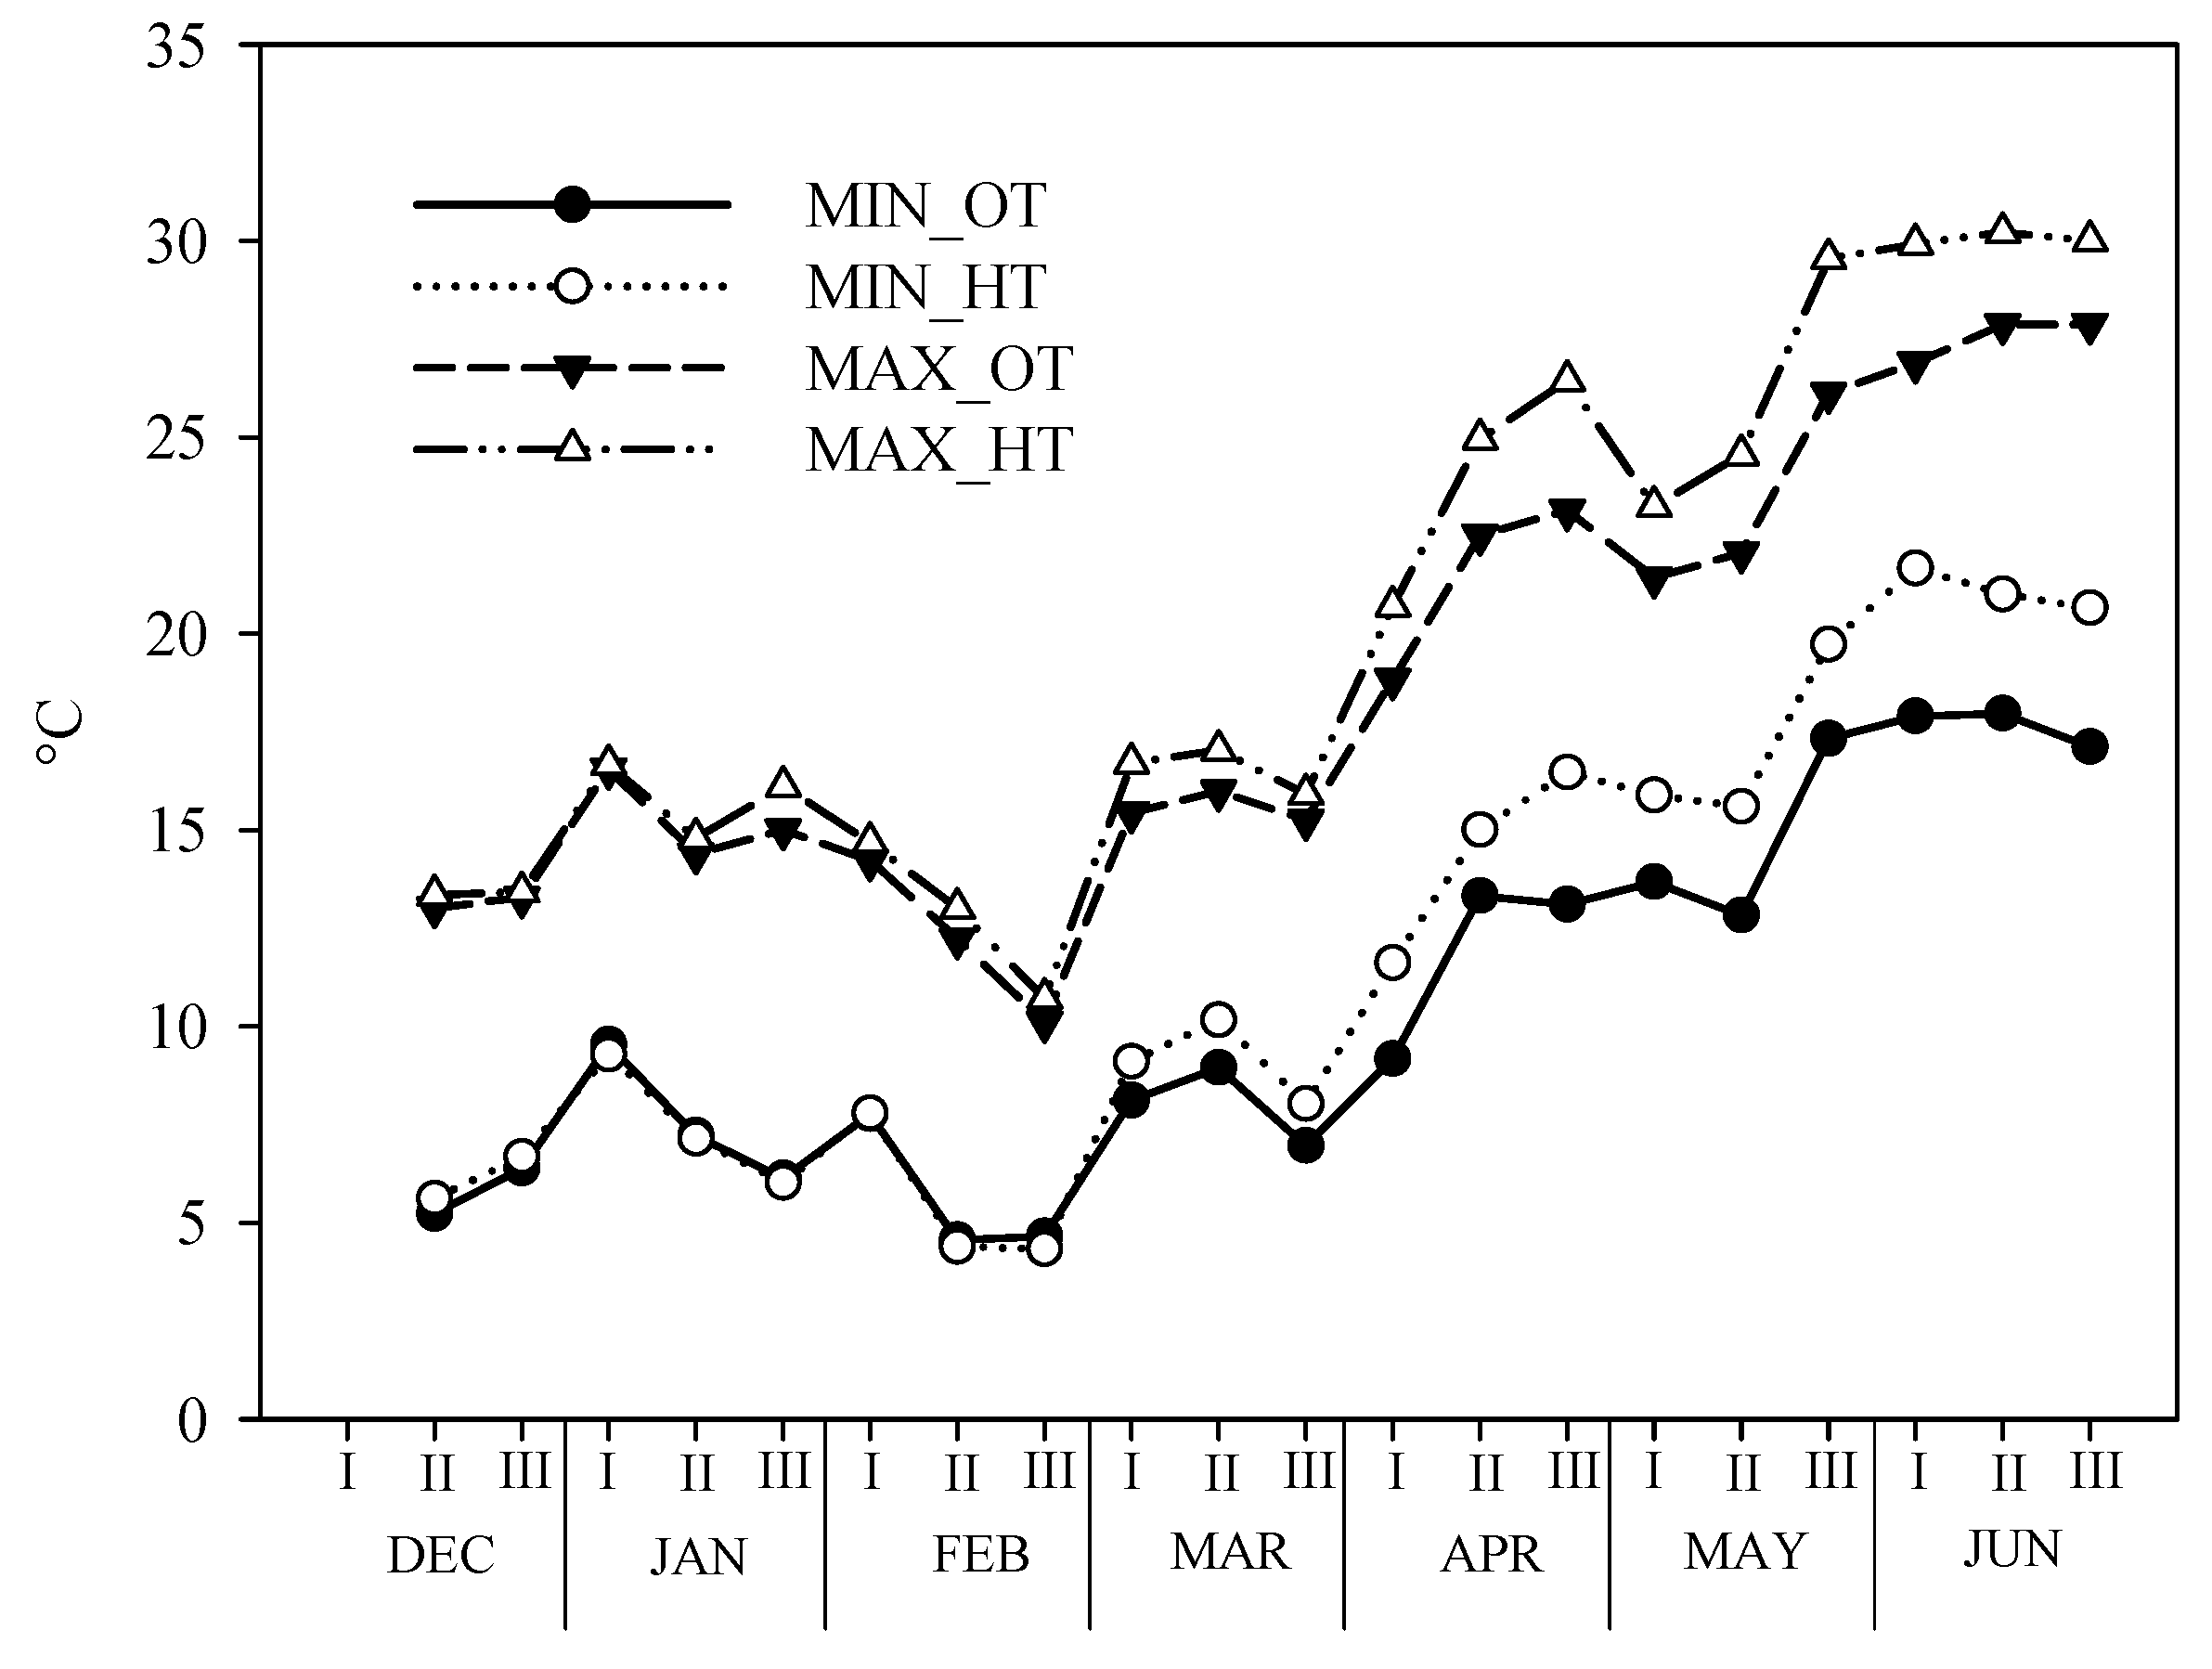
During the test period, in the two environments (OT and HT), the maximum and minimum temperature were recorded and the data are reported in Figure 1.
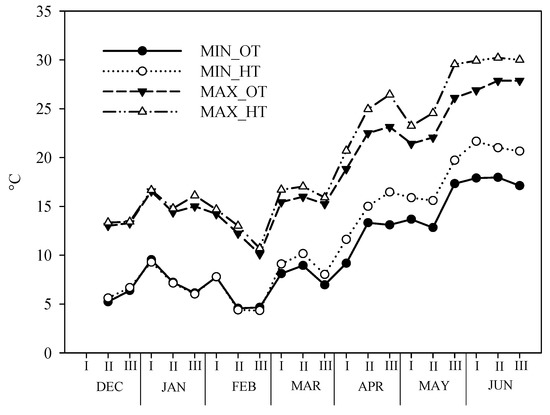
Figure 1.
Maximum and minimum temperature trends open and tunnel during the test period in the two environmental conditions: Ordinary temperature (OT) and High temperature (HT) conditions.
As expected, the inside temperatures were higher, about 1.5 °C, than the outside temperatures. In the winter months, the differences between the two environments were almost nil; in particular, the minimum temperatures began to differentiate after the first ten days of March, while the maximum temperatures at the end of January. The lowest temperatures were recorded in the second half of February when there also was a snowy event (about 5 cm). The minimum temperature, for both environments, was never below 4 °C. The maximum temperatures reached peaks at the end of May and in the second ten days of June, in the HT (30 °C) and OT (28 °C), respectively.
As for the rain, about 435.0 mm was recorded in the winter months and 84 mm in the spring period.
3.2. Growth Parameters as Affected by Temperature
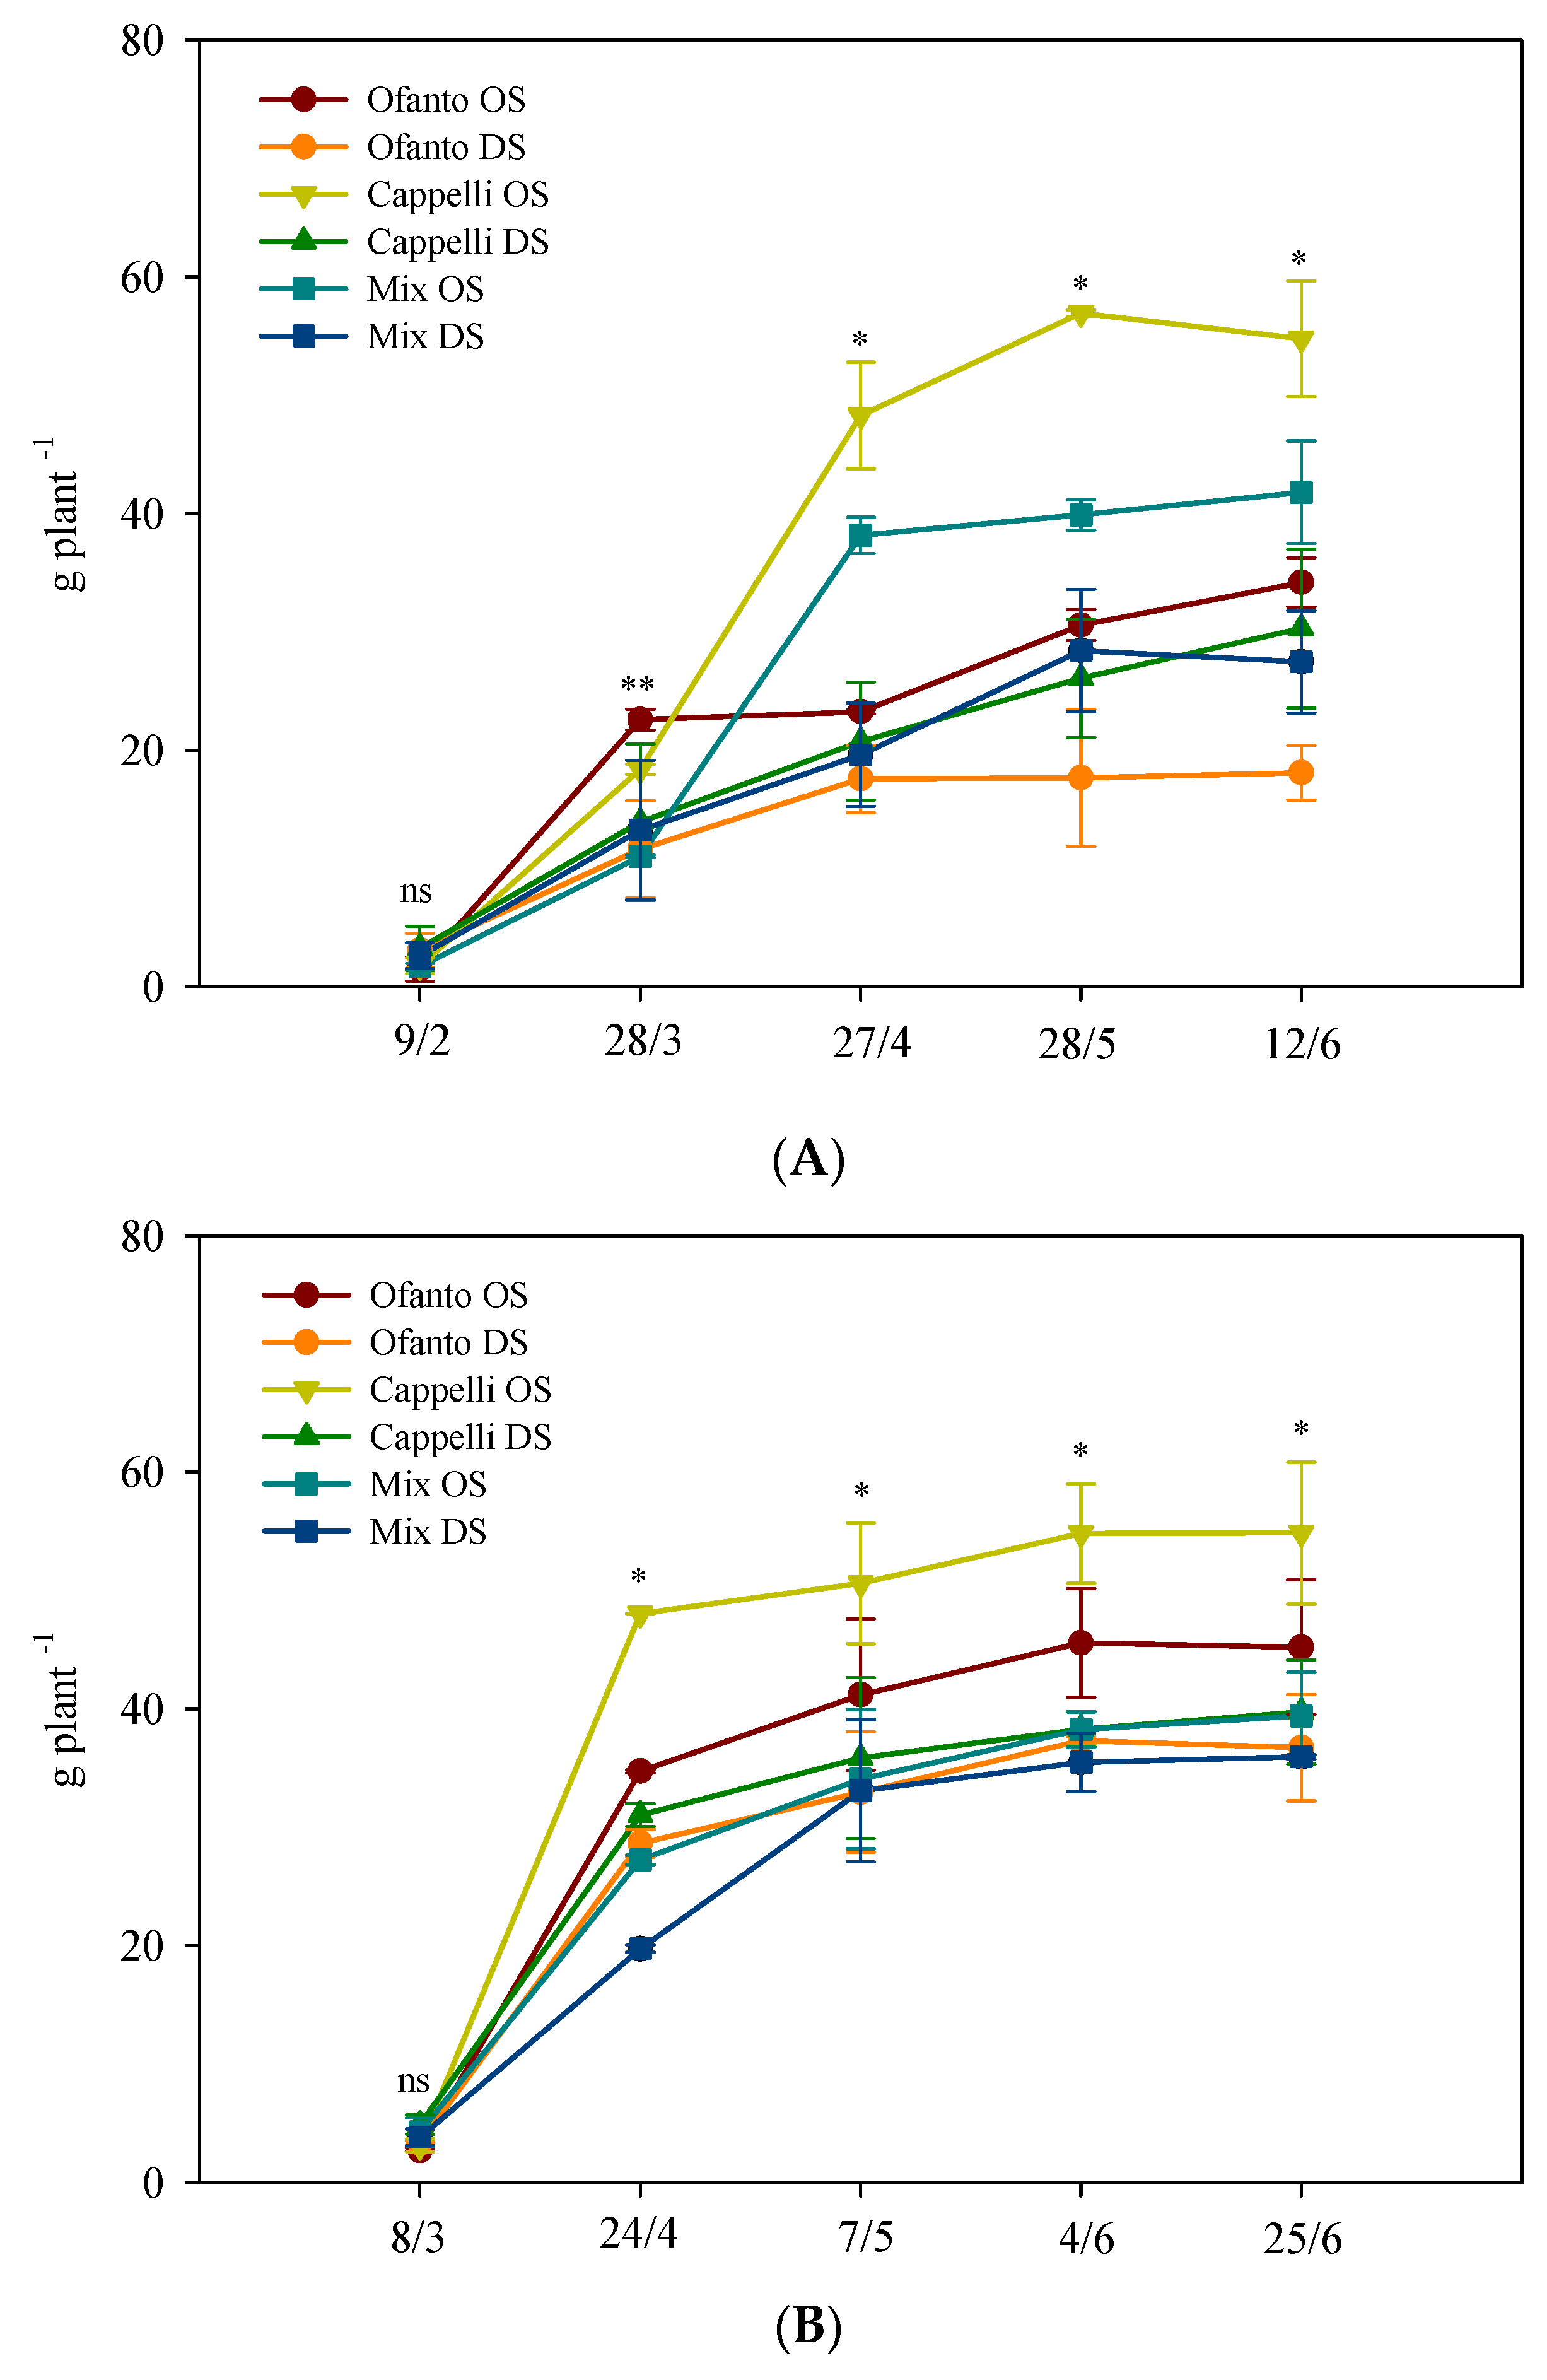
The accumulation of total dry matter (Figure 2) always showed an increasing trend, but at the end of the cycle the average values of the HT plants were higher, about +22.0% than OT plants (Figure 2). In particular, under both conditions, the delayed sowing triggered lower dry matter accumulation and, for both sowing times, Cappelli always showed the best performance (Figure 2).
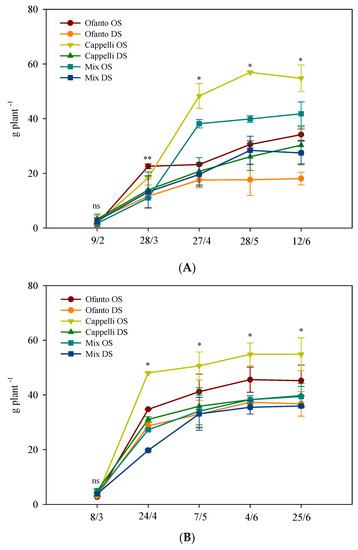
Figure 2.
Accumulation of total dry matter during the crop cycle as affected by two sowing times: ordinary (OS) and delayed (DS) in the two environmental conditions ((A) ordinary temperatures, and (B) high temperatures). Vertical bars indicate standard error; ns, *, and **: not significant or significant at p ≤ 0.05 and 0.01, respectively.
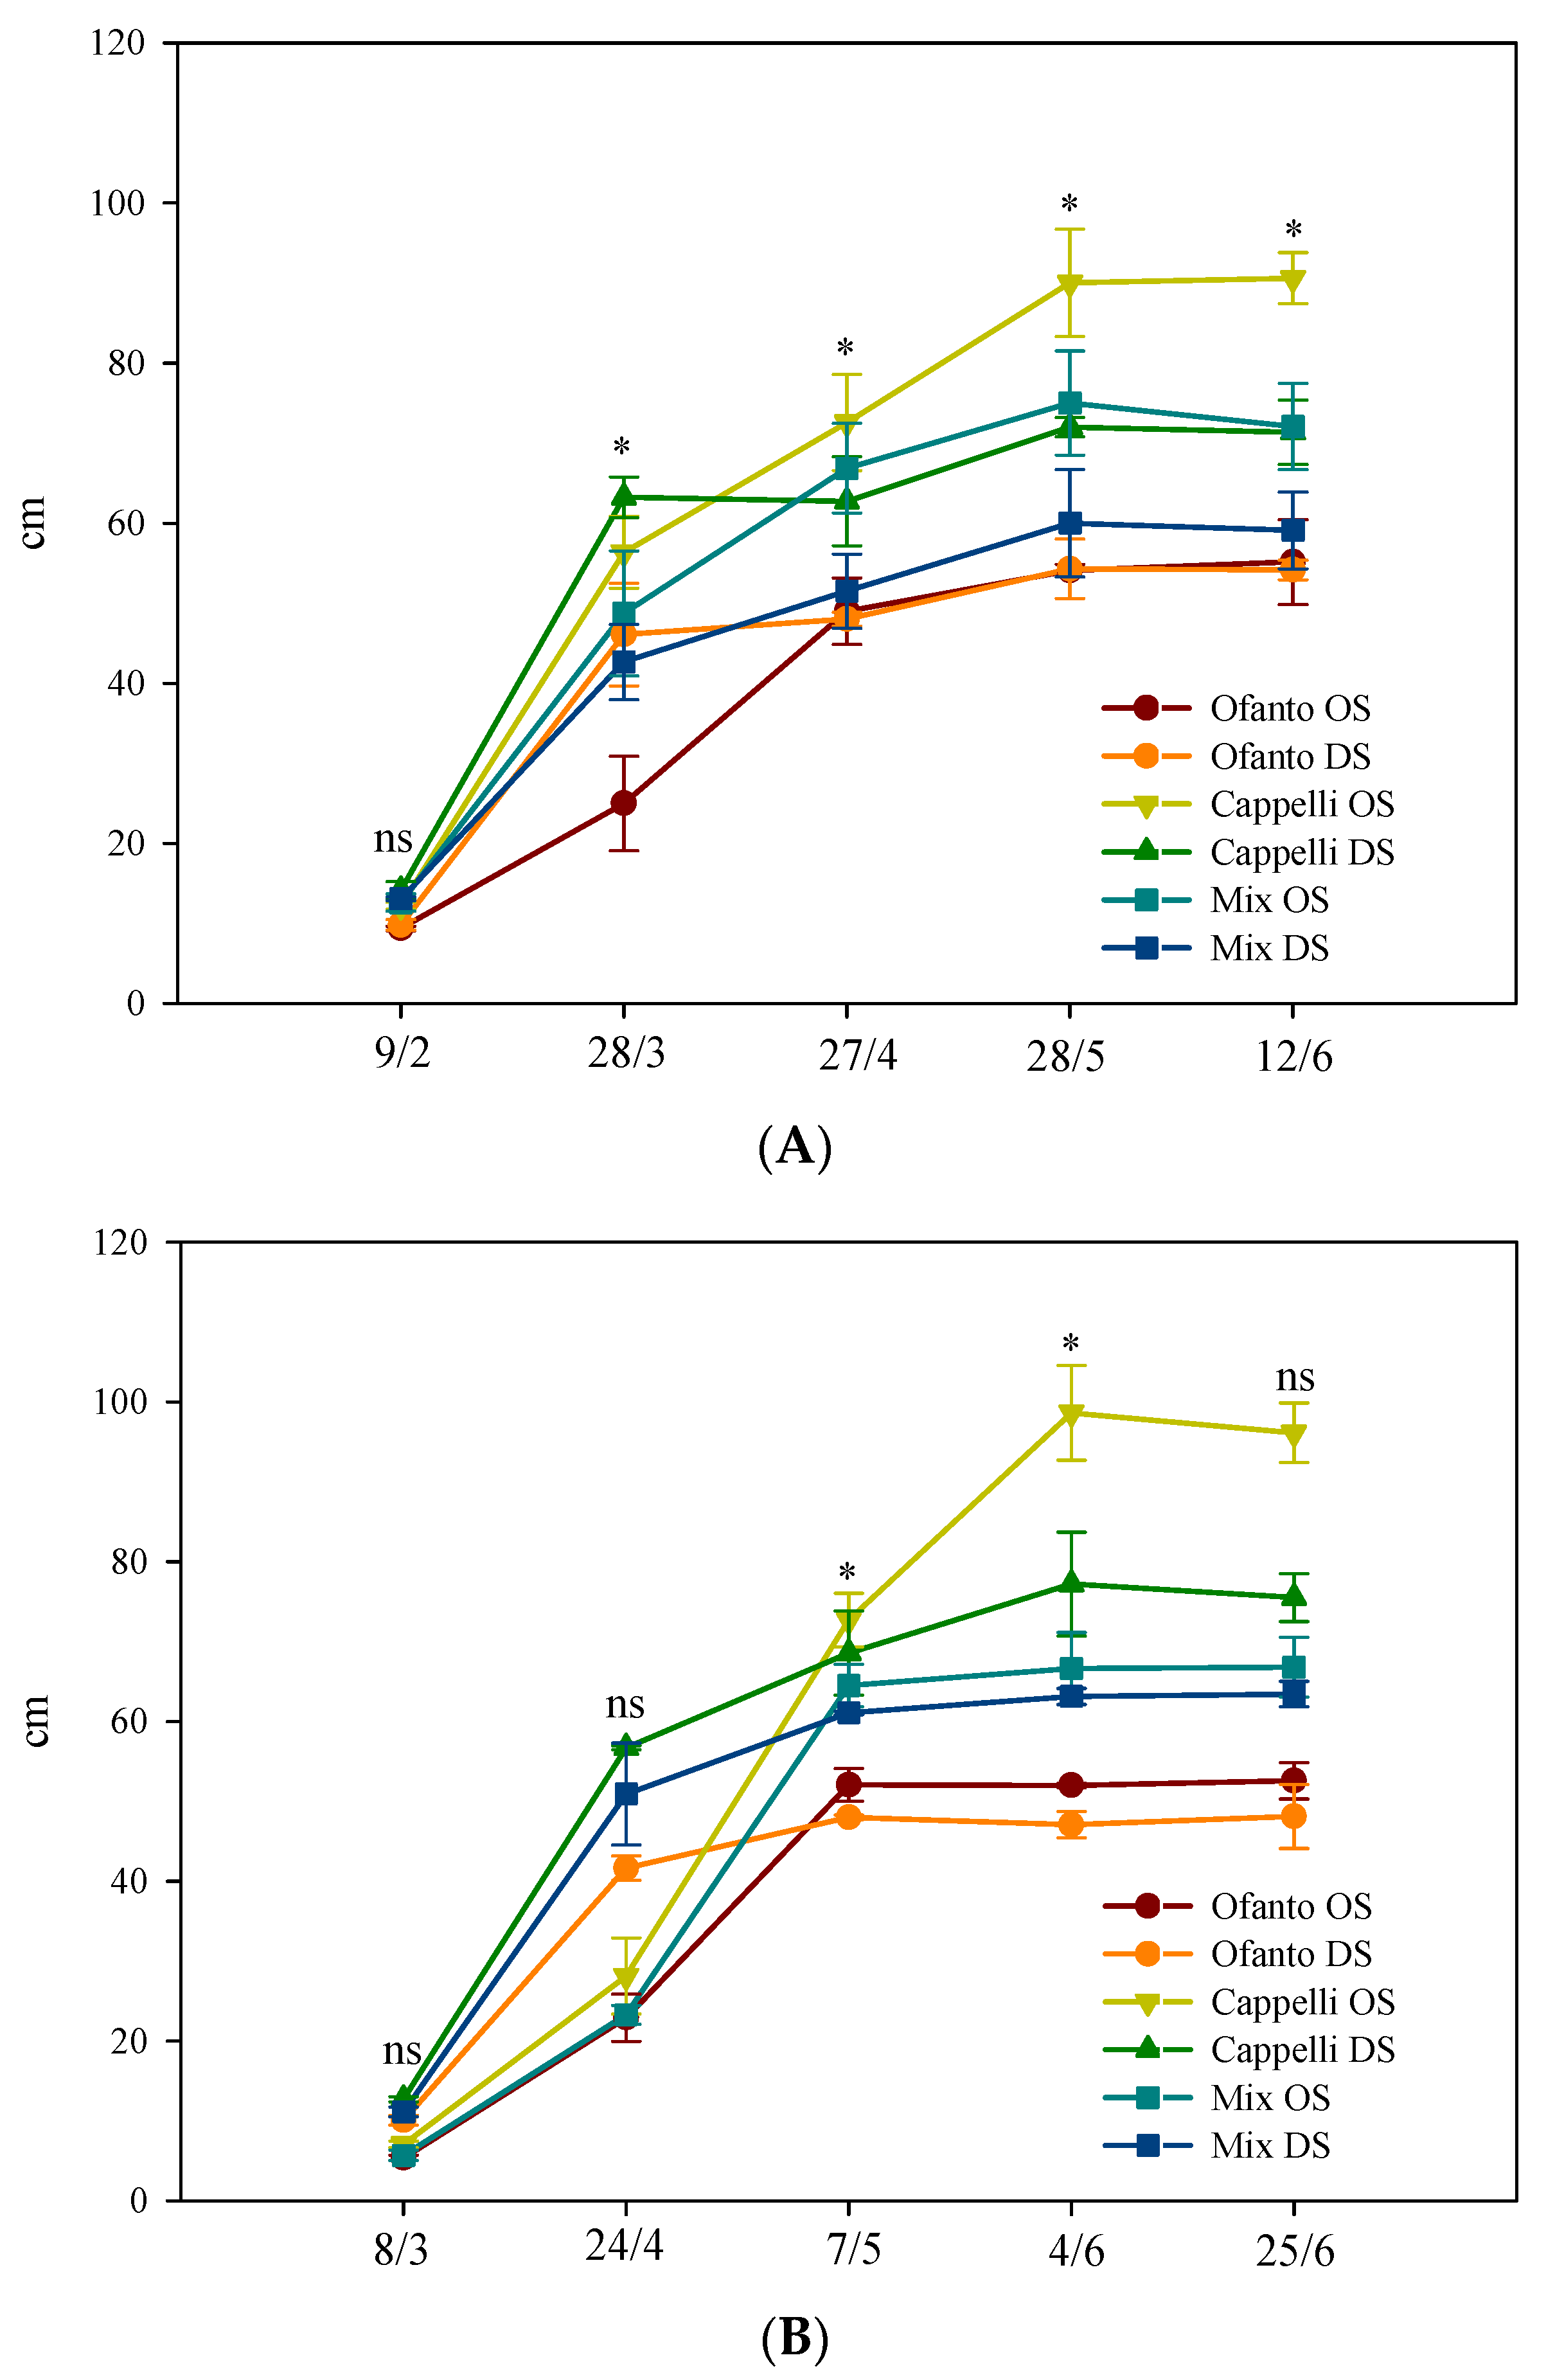
Irrespective of sowing times and wheat variety, at the end of the cycle, no difference was found among the plants grown under the two environmental conditions: the mean value of plant height was 67.1 cm (Figure 3). The ordinary sowing elicited values of plant heights slightly higher (50.1 cm vs. 48.6 cm of DS). Finally, among the varieties, Cappelli reached the highest values, overcoming 90.0 cm with ordinary sowing and 70.0 cm with delayed sowing, but under OT conditions, it was not different from the OS-Mix (Figure 3).
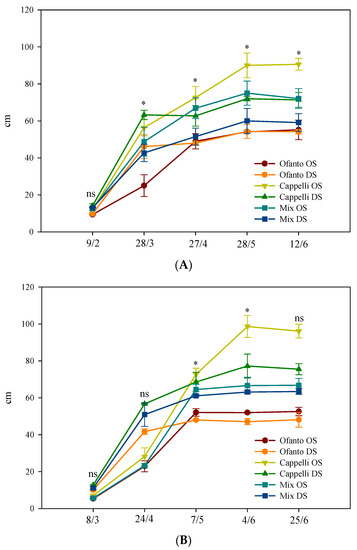
Figure 3.
Plant height during the crop cycle as affected by two sowing times: ordinary (OS) and delayed (DS) in the two environmental conditions ((A) ordinary temperatures, and (B) high temperatures). Vertical bars indicate standard error; ns, and *: not significant or significant at p ≤ 0.05, respectively.
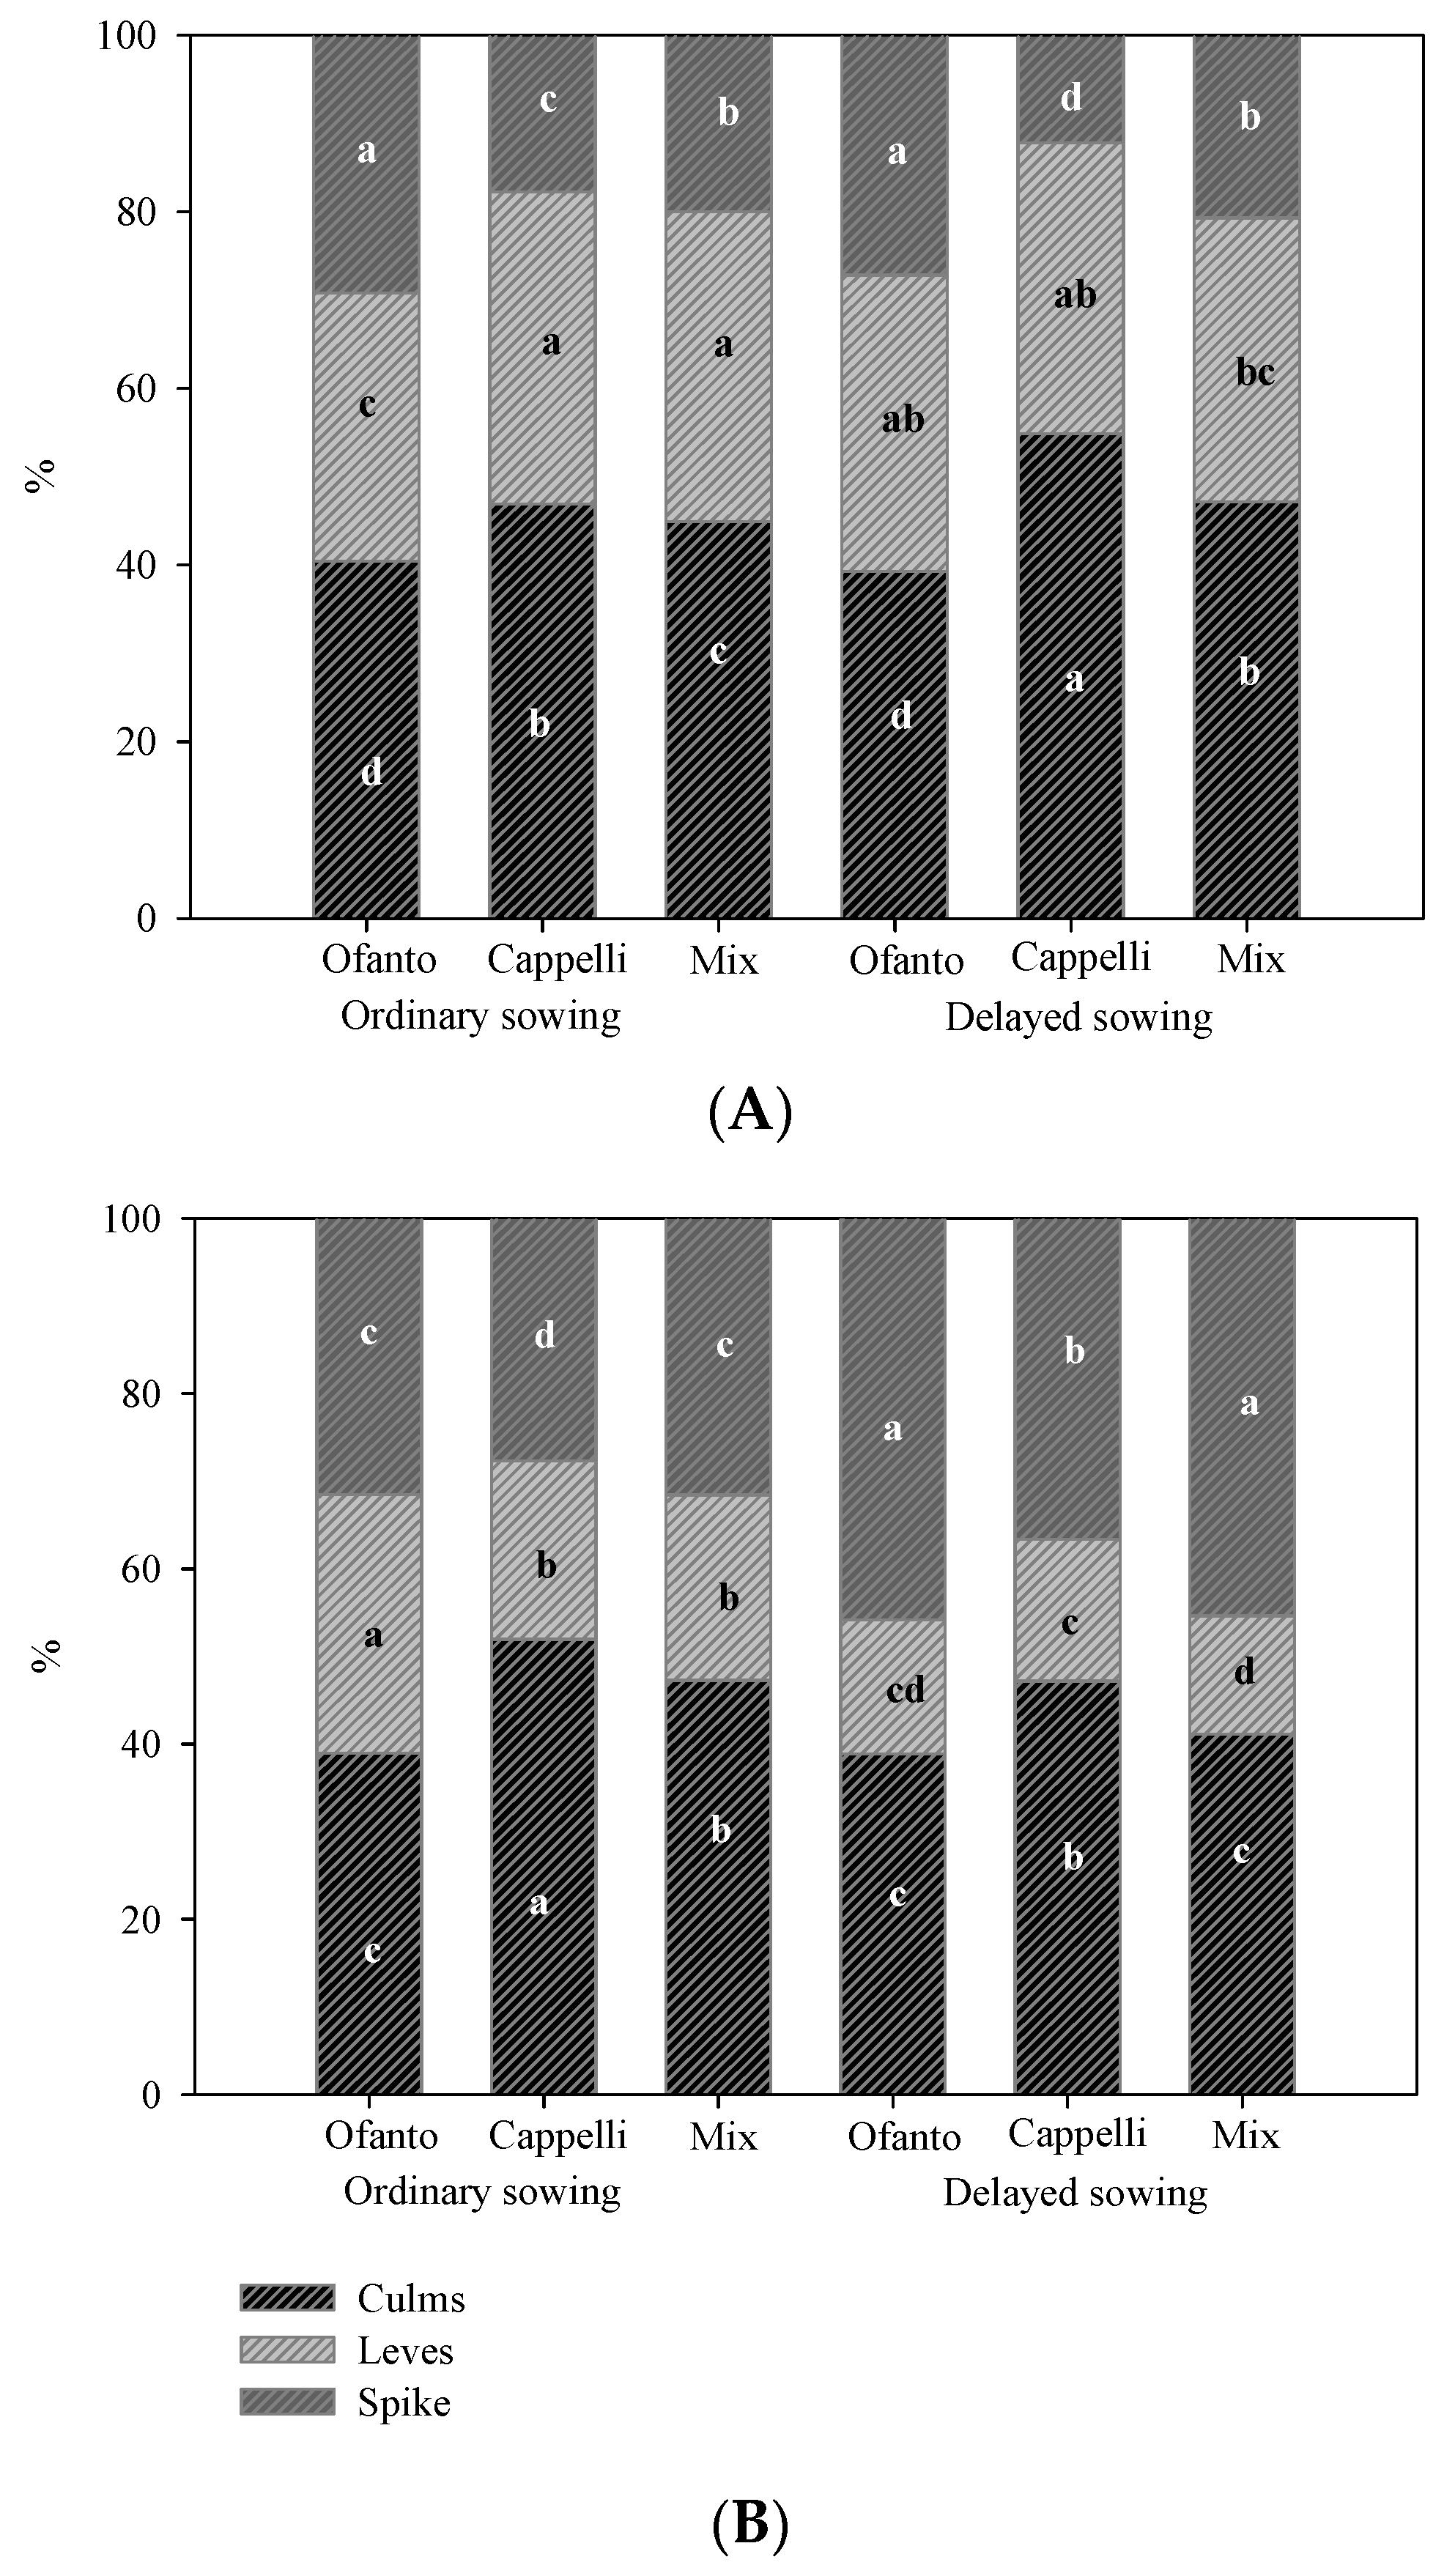
The interaction between sowing time and variety significantly affected the percentage accumulation of dry matter between the parts of the plant in both environments (Figure 4). Under high temperatures (HT), Ofanto showed the highest percentage incidence of spikes in both sowing times due to its reduced size, typical of the modern varieties (Figure 4A). Instead, the variety Cappelli, a high-size traditional variety, produced a greater quantity of biomass, with the consequent lowest incidence of spikes.
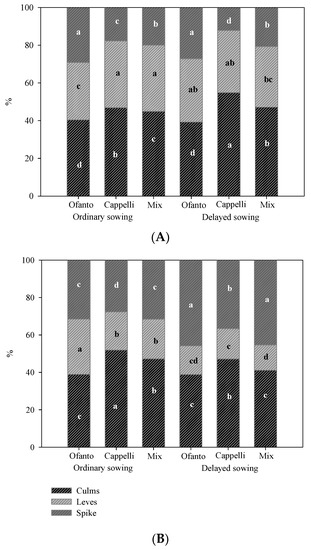
Figure 4.
Percentage incidence of different parts of plants on total dry matter for the two sowing times: ordinary (OS) and delayed (DS) in the two environmental conditions (HT = high temperatures (A), and OT = ordinary temperatures (B)). Different letters indicate significant differences according to Tukey test (p < 0.05).
In open air, interestingly all three varieties of delayed sowing had a significantly higher incidence of spikes than that recorded for the ordinary sowing, again Cappelli showed the highest values of biomass (Figure 4B).
The effects of the interaction between the environmental conditions (the two sowing times) and the three varieties on leaves number, leaf area index (LAI), and average leaf area at flowering are reported in Table 2.

Table 2.
Interaction between environmental conditions (HT = high temperatures and OT = ordinary temperatures), sowing times (ordinary—OS, and delayed—DS) and variety (Ofanto, Cappelli, Mix) on leaves number, LAI (Leaf Area Index), and ALA (average leaf area) at flowering.
The highest number of leaves per plant was recorded for Cappelli with ordinary sowing under high temperature conditions and it was different from all other treatments except Mix under the same conditions (HT-OS). Interestingly, under high temperature conditions, the ordinary sowing elicited a 23.7% increase in leaves number over the delayed sowing. Instead, the trend was the opposite under ordinary temperatures conditions: the delayed sowing elicited a 12.8% increase over OS. Finally, the mean value of leaves number per plant were similar in the two environments (4.2 vs. 4.1 n° pt−1).
Higher values of LAI were observed under high temperature conditions (4.7 vs. 3.6 m2 m−2, for HT and OT, respectively). In particular, the statistically higher values were recorded in all three varieties with ordinary sowing under HT conditions, while the lowest values in all three varieties were with delayed sowing under OT conditions and in the OS-Ofanto and DS-Mix under HT.
3.3. Yield and Yield Components
The third-degree interaction (environment x sowing time x variety) significantly affected yield and its components (Table 3). In ordinary temperature conditions, the grain yield was higher than the HT conditions: 0.40 vs. 0.19 kg m−2, respectively, and the best performance was recorded for ordinary sowing plants (0.58 vs. 0.23 kg m−2 of DS plants). Instead, the differences between the sowing times under HT were not evident; for both, the yield value was 0.19 kg m−2. However, in these conditions, the differences between the varieties were marked: Ofanto-OS reached the highest value while Mix-OS showed the lowest value. Finally, under OT-OS conditions, the yield of all three varieties were not different between them.

Table 3.
Interaction between environmental conditions (HT = high temperatures and OT = ordinary temperatures), sowing times (ordinary—OS, and delayed—DS), and variety (Ofanto, Cappelli, Mix) on plant height, stems number, spikes number, biomass, harvest index (HI), and yield.
The lower yield of HT plants was probably due to the lower number of spikes: 244.3 vs. 319.7 of OT conditions. The OT-OS-Mix treatment had the highest number of spikes per square meter, but it was not statistically different from the Ofanto-OS grown under both temperature conditions. Regarding the two sowing times, the number of spikes were higher in ordinary sowing (295.1 vs. 268.9 of DS), especially under ordinary temperatures conditions.
In high temperature conditions, the biomass was higher than in the ordinary conditions (on average 1.45 vs. 1.21 kg m−2); in both conditions, the variety Cappelli showed values significantly higher than all other treatments. The highest value of HI was recorded in open field (OT): 36.0% vs. 13.6% of HT. Notably, the higher and statistically different values were recorded for Ofanto under OT conditions and for both sowing times.
All treatments under high temperature (HT) showed the highest number of stems per square meter (520 vs. 414 n° m−2 of OT) without significant differences among them; only Ofanto-OT-OS was not statistically different from them.
Regarding the height of plants, irrespective of temperature conditions, the plants of the Cappelli-OS variety were significantly higher than all other treatments (Table 3); instead, Ofanto under OT conditions had the lowest values. Between the two environments, no significant differences were recorded (69.66 cm HT vs. 67.8 cm OT). Regarding the two sowing times, a decrease in height was observed in the delayed sowing (65.3 cm vs. 72.2 cm of OS).
As regards the quality parameters of grain, the third degree interaction was again significant (Table 4). The 1000 seeds weight were an average of 54.4 g; the difference between OT and HT conditions was minimal (54.0 vs. 54.8 g, respectively), the delayed sowing showed the highest value (56.4 vs. 52.4), and, among the three varieties, Cappelli showed significantly higher values (57.0 vs. 53.1 g of the other two varieties). The best performance was achieved by Cappelli and Mix with delayed sowing and grown under high-temperature conditions (Table 4). The grain humidity was always lower than 10.0%, except for all three varieties under ordinary sowing and temperature conditions (Table 4).

Table 4.
Interaction between environmental conditions (HT = high temperatures and OT = ordinary temperatures), sowing times (ordinary—OS, and delayed—DS), and variety (Ofanto, Cappelli, Mix) on 1000 seeds weight, shrinking, vitreousness, humidity, and protein contents.
Irrespective of varieties and sowing times, the high temperatures determined higher values of shrunken kernels, about 5.5% vs. 2.4% of OT plants (Table 4). The percentage of shrunken kernels was statistically higher for all varieties with ordinary sowing and grown under high temperature conditions.
The percentage of vitreous kernels had been always higher than 91%, with the maximum value (96.5%) for the OS-Mix plants grown under high temperatures conditions (Table 4). The percentage protein content of the grain was high in all treatments; the maximum value was recorded in the OS-Mix plants grown under HT conditions.
4. Discussion
In order to cope with the expected increase in the global average temperature, it is necessary to provide adaptation strategies for food crops to assure sufficient food production for the world’s population. Sowing time can be considered a strategy for adjusting to temperature increase; indeed, by selecting the optimum sowing time, it is possible to avoid stress from high temperatures during the flowering and grain filling that determine yield reductions.
Overall, our results highlighted that a higher DM accumulation was recorded under high-temperature conditions (+22.0% over OT) and, generally, the delayed sowing determined a lower dry matter accumulation, probably due to the shorter duration of cycle. Among the varieties, Cappelli reached the highest values of DM accumulation but also of height and biomass production. On the other hand, one of the main characteristics of traditional varieties is the high size, with a consequent high risk of lodging and biomass production.
Additionally, plant height was affected by the sowing times; indeed, we observed a 3.0% decrease under delayed sowing. Similarly, other researchers reported that, with ordinary sowing (mid-November), plant height was greater than with delayed sowing [24,25]. In their research, [9] reported that the plant height decreased under late sowing conditions compared with normal sowing, stating that this effect is probably due to the shortening of the crop cycle of the crops, in turn, caused by higher temperatures during the growing period.
On the other hand, the crop cycle duration also affected yield. Indeed, the grain yield as well as number of spikes per square meter were higher under ordinary temperatures by about double and +30.9% compared to the high temperature conditions, respectively. Notably, under high temperature conditions, no differences were recorded between the sowing times; instead, the delayed sowing caused a 60.3% reduction in yield under ordinary temperatures conditions, but it did not affect the productive response of wheat under high temperatures. Additionally, [26] highlighted a decline of approximately 0.7% of the wheat production cultivated in China for each one–day delay beyond the ordinary sowing date. These losses could be due to the shortening of the main phenological phases with consequent poor yield performance [27,28,29]. Furthermore, delayed sowing increases the probability of the grain being exposed to higher air temperatures during the grain filling, causing stress and, therefore, a decrease in production [30]. Indeed, for example, we also recorded higher values of shrunken grains under high temperature conditions. In a test carried out in Bangladesh, Nahar et al. [31] reported a grain yield reduction of 53–73% under heat-stress conditions due to late wheat sowing. On the other hand, in Kansas (USA), when applying thermal stress with the use of “thermal tents”, some authors observed a 2–27% reduction in grain yield [32]. Additionally, in China, Feng et al. [33] measured a 6–11% reduction in grain yield under thermal stress produced by the means of white polythene plastic film. Finally, many researchers have observed that even a short heat phase with maximum temperatures above 35 °C during the grain filling may cause a reduction in grain yield ranging from 5.4% to 30% [13,34,35]. In addition, several authors reported a yield variability when different environmental conditions occur [13,36,37]. From our results, the effect of the different genetic pools of the three varieties was almost nil under ordinary conditions (OT-OS); instead, under high-temperature conditions, it was observed that Ofanto with ordinary sowing reached the highest values. However, in these conditions, Cappelli and Mix showed greater stability of yield with lower differences in yield values between OS and DS. This result is also supported by Migliorini et al. [38], which reported that the old varieties’ mixtures yielded less than the modern varieties but with higher stability. In addition, in the literature it is reported that old cultivars are characterized by their lower yield compared with modern ones in both low- and high-input systems [22].
Several studies reported that high temperatures limit the growth, biomass production, and productivity and reduce the quality of harvested products [39,40,41,42,43]. Stone and Nicolas [42], in research performed in Australia, reported an estimated loss of 4% for each degree centigrade above the optimum.
The harvest index (HI), the ratio between yield and total biomass, is obviously highly correlated with the grain yield and, therefore, with the spikelet’s fertility. In our research, high temperatures reduce the HI by about 53%. The Ofanto variety showed a statistically higher value of HI in all experimental conditions, due also to reduced size (low values of biomass production). In the literature, it is reported that at high temperatures lower HI is recorded mainly due to the lower grain yield caused by the decrease in spikelet fertility, although this decrease in the spikelet fertility is cultivar-specific [44].
Comparing the old and new varieties, it was observed that HI in the new varieties was higher than the old varieties (32.4 vs. 18.9, respectively); this result was also observed by De Vita et al. [45] in a comparison between different cultivars (modern and old) of wheat. Finally, the 1000 seeds weight, protein percentages, and shrunken percentages of grains were higher under high-temperature conditions, contrary to vitreousness.
Regarding the 1000 seeds weight, the different temperature conditions did not affect this parameter, while the delayed sowing elicited a greater value than ordinary sowing. Additionally, other researchers reported a higher 1000 grain weight (60 g per 1000 kernels−1) when compared to the later sown ones [44,45,46,47]. This result is probably due to the fact that the rise in temperature makes the crop prematurely enter the next stage.
Regarding grain shrinkage, Dias and F.C. Lidon [48], in research carried out on modern grains, observed that, in wheat grown under thermal stress, grain shrinkage increases, thus implying a reduction in the weight of the individual grain. Regarding the protein percentage, Tashiro and Wardlaw [49] also observed that it tends to increase in response to elevated temperatures. Corbellini et al. [50] observed that continuous exposure to very high temperatures (>40 °C) after pollination to maturity adversely affected the properties of the wheat flour, including a significant change in the level of protein aggregation. This problem is related to the protein composition, rather than the overall protein concentration; indeed, it was observed that the composition of wheat proteins was altered by high temperatures [51]. However, as reported by De Vita et al. [45] the good grain quality in modern cultivars finds an increase in the pasta-making quality of proteins.
Findings of an Italian research report that the delayed sowing (from October to March) of some modern durum wheat cultivars determined a reduced grain yield but increased the protein percentage from 107 to 147 g kg−1 [23].
Another research, which compared old versus modern cultivars and moved the sowing date from November to March, reported that the protein percentage in the old cultivar increased by 2.7%, but in the modern cultivar increased by only 1.3%. This difference was the consequence of the grain yield reduction caused by the delayed sowing in the old cultivar (−19%) than in the modern cultivar (−7%) [52]. Similarly, in our research, under ordinary temperature conditions, we found a greater increase in the protein percentage of grain in Cappelli with delayed sowing (34.0%) compared to Ofanto, in which the protein percentage increased by about 12.3% compared to plants of ordinary sowing.
As reported by Brankovic et al. [53], the quality parameters of the grain, and especially the vitreousness, are influenced from various environmental factors such as: higher temperature for 43.4%, low precipitation for 30.9%, and sunshine hours for 5.6% during grain filling and ripening. In our research, the percentage of vitreous kernels had been always higher than 91%, with the maximum value (96.5%) for the OS-Mix plants grown in higher temperature conditions.
The late sowing of crops and high-temperature stress affects the development of plant organs and causes the reduction in quality and quantity yield components [54,55].
5. Conclusions
The projection of an increase in the world mean temperature will determine less favorable growth conditions for crops, especially for microthermal ones such as wheat. Therefore, it is necessary to individuate strategies for adapting to these changes, between which the choice is of sowing time and/or variety.
The findings of our research highlighted that durum wheat does not adapt well to higher temperature conditions, showing with a strong reduction in yield (about half of ordinary conditions). However, in these conditions, the delayed sowing results in a discrete technique of adjustment, allowing it to reach a yield value consistent with the yield of plants with ordinary sowing. Regarding the varieties, the choice of a “traditional” variety (Cappelli) was driven by the attempt to exploit its greater resilience, but our results did not highlight a higher adaptability than Ofanto, a modern variety; indeed, Cappelli showed about a 15% decrease in yield. The greater adaptability of Ofanto is probably due to the lower development of biomass with consequent lower water losses.
Interestingly, the grain quality, in particular the protein percentage, seems to be improved by higher temperature conditions, showing higher values but without a beneficial effect of delayed sowing in these conditions. Finally, the late sowing time improved the grain quality (increase in 1000 seeds weight and protein percentage and decrease in shrunken grains).
Therefore, it seems that in areas characterized by high temperatures, delayed sowing can improve grain quality without reducing yield quantity compared to ordinary sowing times.
Author Contributions
Conceptualization, M.M., L.O. and E.C.; methodology, I.D.M.; software, L.O.; validation, M.M. and I.D.M.; formal analysis, L.O.; investigation, E.C.; resources, M.M.; data curation, E.C.; writing—original draft preparation, L.O. and I.D.M.; writing—review and editing, I.D.M. and L.O.; visualization, E.C.; supervision, M.M.; project administration, M.M.; funding acquisition, M.M. All authors have read and agreed to the published version of the manuscript.
Funding
This research received no external funding.
Institutional Review Board Statement
Not applicable.
Informed Consent Statement
Not applicable.
Data Availability Statement
The datasets generated for this study are available on request to the corresponding author.
Acknowledgments
We would like to thank Sabrina Nocerino for their support in laboratory work.
Conflicts of Interest
The authors declare no conflict of interest.
References
- Prasad, P.V.V.; Bheemanahalli, R.; Jagadish, S.V.K. Field crops and the fear of heat stress—Opportunities, challenges and future directions. Field Crops Res. 2017, 200, 114–121. [Google Scholar] [CrossRef]
- Singh, A.; Singh, D.; Kang, J.S.; Aggarwal, N. Management practices to mitigate the impact of high temperature on wheat: A review. IIOAB J. 2011, 2, 11–22. [Google Scholar]
- Xynias, I.N.; Mylonas, I.; Korpetis, E.G.; Ninou, E.; Tsaballa, A.; Avdikos, I.D.; Mavromatis, A.G. Durum wheat breeding in the Mediterranean region: Current status and future prospects. Agronomy 2020, 10, 432. [Google Scholar] [CrossRef]
- ISTAT. 2021. Available online: http://dati.istat.it/Index.aspx?QueryId=33654&lang=en (accessed on 15 April 2022).
- Hay, R.K.M.; Walker, A.J. Dry Matter Partitioning. An Introduction to the Physiology of Crop Yield; Harlow and Longman Scientific & Technical: Harlow, UK, 1989; pp. 107–156. [Google Scholar]
- Porter, J.R.; Gawith, M. Temperatures and the growth and development of wheat: A review. Eur. J. Agron. 1999, 10, 23–36. [Google Scholar] [CrossRef]
- Pandey, G.C.; Mamrutha, H.M.; Tiwari, R.; Sareen, S.; Bhatia, S.; Siwach, P.; Tiwari, V.; Sharma, I. Physiological traits associated with heat tolerance in bread wheat (Triticum aestivum L.). Physiol. Mol. Biol. Plants 2015, 21, 93–99. [Google Scholar] [CrossRef] [PubMed]
- Joshi, A.K.; Mishra, B.; Chatrath, R.; Ferrara, G.O.; Singh, R.P. Wheat improvement in India: Present status, emerging challenges and future prospects. Euphytica 2007, 157, 431–446. [Google Scholar] [CrossRef]
- Dubey, R.; Pathak, H.; Singh, S.; Chakravarti, B.; Thakur, A.K.; Fagodia, R.K. Impact of Sowing Dates on Terminal Heat Tolerance of Different Wheat (Triticum aestivum L.) Cultivars. Natl. Acad. Sci. Lett. 2019, 42, 445–449. [Google Scholar] [CrossRef]
- Hartmann, D.L.; Klein Tank, A.M.G.; Rusticucci, M.; Alexander, L.V.; Brön-nimann, S.; Charabi, Y.; Dentener, F.J.; Dlugokencky, E.J.; Easterling, D.R.; Kaplan, A.; et al. Observations: Atmosphere and surface. In Climate Change 2013 The Physical Science Basis. Contribution of Working Group I to the Fifth Assessment Report of the Intergovernmental Panel on Climate Change; Stocker, T.F., Qin, D., Plattner, G.-K., Tignor, M., Allen, S.K., Boschung, J., Nauels, A., Xia, Y., Bex, V., Midgley, P.M., Eds.; Cambridge University Press: London, UK; New York, NY, USA, 2013; p. 159. ISSN 254. [Google Scholar] [CrossRef]
- Lyon, C.; Saupe, E.E.; Smith, C.J.; Hill, D.J.; Beckerman, A.P.; Stringer, L.C.; Marchant, R.; McKay, J.; Burke, A.; O’Higgins, P.; et al. Climate change research and action must look beyond 2100. Glob. Chang. Biol. 2022, 28, 349–361. [Google Scholar] [CrossRef]
- FAO. 2020. Available online: https://www.fao.org/publications/sofi/2020/en/ (accessed on 15 April 2022).
- Asseng, S.; Ewert, F.; Martre, P.; Rotter, R.P.; Lobell, D.B.; Cammarano, D.; Kimball, B.A.; Ottman, M.J.; Wall, G.W.; White, J.W.; et al. Rising temperatures reduce global wheat production. Nat. Clim. Chang. 2015, 5, 143–147. [Google Scholar] [CrossRef]
- Panozzo, J.; Walker, C.; Partington, D.; Neumann, N.; Tausz, M.; Seneweera, S.; Fitzgerald, G. Elevated carbon dioxide changes grain protein concentration and composition and compromises baking quality. A FACE study. J. Cereal Sci. 2014, 60, 461–470. [Google Scholar] [CrossRef]
- Röder, M.; Thornley, P.; Campbell, G.; Bows-Larkin, A. Emissions associated with meeting the future global wheat demand: A case study of UK production under climate change constraints. Environ. Sci. Policy 2014, 39, 13–24. [Google Scholar] [CrossRef]
- IPCC. Climate change 2014. In Fifth Assessment Synthesis Report (Longer Report) of Intergovernmental Panel on Climate Change; Cambridge University Press: Cambridge, UK; New York, NY, USA, 2014. [Google Scholar]
- IPCC. Summary for Policymakers of IPCC Special Report on Global Warming of 1.5 °C Approved by Governments; Cambridge University Press: Cambridge, UK; New York, NY, USA, 2018. [Google Scholar]
- Doebley, J.F.; Gaut, B.S.; Smith, B.D. The Molecular Genetics of Crop Domestication. Cell 2006, 127, 1309–1321. [Google Scholar] [CrossRef] [PubMed]
- Dubcovsky, J.; Dvorak, J. Genome plasticity a key factor in the success of polyploidy wheat under domestication. Science 2007, 316, 1862–1866. [Google Scholar] [CrossRef] [PubMed]
- Evans, L.T. Crop Evolution, Adaptation and Yield; Cambridge University Press: Cambridge, UK, 1993. [Google Scholar]
- Guarda, G.; Padovan, S.; Delogu, G. Grain yield, nitrogen-use efficiency and baking quality of old and modern Italian bread-wheat cultivars grown at different nitrogen levels. Eur. J. Agron. 2004, 21, 181–192. [Google Scholar] [CrossRef]
- Giunta, F.; Motzo, R.; Pruneddu, G. Trends since 1900 in the yield potential of Italian-bred durum wheat cultivars. Eur. J. Agron. 2007, 27, 12–24. [Google Scholar] [CrossRef]
- Motzo, R.; Fois, S.; Giunta, F. Protein content and gluten quality of durum wheat (Triticum turgidum subsp. durum) as affected by sowing date. J. Sci. Food Agric. 2007, 87, 1480–1488. [Google Scholar] [CrossRef]
- Mukherjee, D. Effect of different sowing dates on growth and yield of wheat (Triticum aestivum) cultivars under mid-hill situation of West Bengal. Indian J. Agric. Sci. 2012, 57, 152–156. [Google Scholar]
- Singh, S.; Singh, G.; Singh, P.; Singh, N. Effect of water stress at different stages of grain development on the characteristics of starch and protein of different wheat cultivars. Food Chem. 2008, 108, 130–139. [Google Scholar] [CrossRef]
- Shah, F.; Coulter, J.A.; Ye, C.; Wu, W. Yield penalty due to delayed sowing of winter wheat and the mitigatory role of increased seeding rate. Eur. J. Agron. 2020, 119, 126120. [Google Scholar] [CrossRef]
- Kantolic, A.G.; Slafer, G. Reproductive development and yield components in indeterminate soybean as affected by post-flowering photoperiod. Field Crops Res. 2005, 93, 212–222. [Google Scholar] [CrossRef]
- Ferrise, R.; Triossi, A.; Stratonovitch, P.; Bindi, M.; Martre, P. Sowing date and nitrogen fertilisation effects on dry matter and nitrogen dynamics for durum wheat: An experimental and simulation study. Field Crops Res. 2010, 117, 245–257. [Google Scholar] [CrossRef]
- Sattar, A.; Cheema, M.A.; Farooq, M.; Wahid, M.A.; Wahid, W.; Babar, H.B. Evaluating the performance of wheat cultivars under late sown conditions. Int. J. Agric. Biol. 2010, 12, 561–565. [Google Scholar]
- Garg, D.; Sareen, S.; Dalal, S.; Tiwari, R.; Singh, R. Grain filling duration and temperature pattern influence on the performance of wheat genotypes under late planting. Cereal Res. Commun. 2013, 41, 500–507. [Google Scholar] [CrossRef]
- Nahar, K.; Ahamed, K.U.; Fujita, M. Phenological Variation and its Relation with Yield in several Wheat (Triticum aestivum L.) Cultivars under Normal and Late Sowing Mediated Heat Stress Condition. Not. Sci. Biol. 2010, 2, 51–56. [Google Scholar] [CrossRef]
- Bergkamp, B.; Impa, S.; Asebedo, A.; Fritz, A.; Jagadish, S.K. Prominent winter wheat varieties response to post-flowering heat stress under controlled chambers and field based heat tents. Field Crops Res. 2018, 222, 143–152. [Google Scholar] [CrossRef]
- Feng, B.; Liu, P.; Li, G.; Dong, S.T.; Wang, F.H.; Kong, L.A.; Zhang, J.W. Effect of Heat Stress on the Photosynthetic Characteristics in Flag Leaves at the Grain-Filling Stage of Different Heat-Resistant Winter Wheat Varieties. J. Agron. Crop Sci. 2014, 200, 143–155. [Google Scholar] [CrossRef]
- Stone, P.; Nicolas, M. A survey of the effects of high temperature during grain filling on yield and quality of 75 wheat cultivars. Aust. J. Agric. Res. 1995, 46, 475–492. [Google Scholar] [CrossRef]
- Talukder, A.; McDonald, G.K.; Gill, G.S. Effect of short-term heat stress prior to flowering and at early grain set on the utilization of water-soluble carbohydrate by wheat genotypes. Field Crops Res. 2013, 147, 1–11. [Google Scholar] [CrossRef]
- Rossini, F.; Provenzano, M.E.; Sestili, F.; Ruggeri, R. Synergistic Effect of Sulfur and Nitrogen in the Organic and Mineral Fertilization of Durum Wheat: Grain Yield and Quality Traits in the Mediterranean Environment. Agronomy 2018, 8, 189. [Google Scholar] [CrossRef]
- López-Bellido, L.; Fuentes, M.; Castillo, J.E.; López-Garrido, F.J.; Fernández, E.J. Long-term tillage, crop rotation, and nitrogen fertilizer effects on wheat yield under rainfed Mediterranean conditions. Agron. J. 1996, 88, 783–791. [Google Scholar] [CrossRef]
- Migliorini, P.; Spagnolo, S.; Torri, L.; Arnoulet, M.; Lazzerini, G.; Ceccarelli, S. Agronomic and quality characteristics of old, modern and mixture wheat varieties and landraces for organic bread chain in diverse environments of northern Italy. Eur. J. Agron. 2016, 79, 131–141. [Google Scholar] [CrossRef]
- Boyer, J.S. Plant Productivity and Environment. Science 1982, 218, 443–448. [Google Scholar] [CrossRef] [PubMed]
- Lobell, D.B.; Asner, G.P. Climate and management contributions to recent trends in U.S. agricultural yields. Science 2003, 299, 1032. [Google Scholar] [CrossRef]
- Peng, S.; Huang, J.; Sheehy, J.E.; Laza, R.C.; Visperas, R.M.; Zhong, X.; Centeno, G.S.; Khush, G.S.; Cassman, K.G. Rice yields decline with higher night temperature from global warming. Proc. Natl. Acad. Sci. USA 2004, 101, 9971–9975. [Google Scholar] [CrossRef] [PubMed]
- Stone, P.J.; Nicolas, M.E. Effect of timing of heat stress during grain filling on two wheat varieties differing in heat tolerance. I. Grain growth. Aust. J. Plant Physiol. 1995, 22, 927–934. [Google Scholar] [CrossRef]
- Stone, P.J.; Nicolas, M.E. Comparison of sudden heat stress with gradual exposure to high temperature during grain filling in two wheat varieties differing in heat tolerance. I. Grain growth. Aust. J. Plant Physiol. 1995, 22, 935–944. [Google Scholar] [CrossRef]
- Prasad, P.V.V.; Boote, K.J.; Allen Jr, L.H.; Sheehy, J.E.; Thomas, J.M.G. Species, ecotype and cultivar differences in spikelet fertility and harvest index of rice in response to high temperature stress. Field Crops Res. 2006, 95, 398–411. [Google Scholar] [CrossRef]
- De Vita, P.; Nicosia, O.L.D.; Nigro, F.; Platani, C.; Riefolo, C.; Di Fonzo, N.; Cattivelli, L. Breeding progress in morpho-physiological, agronomical and qualitative traits of durum wheat cultivars released in Italy during the 20th century. Eur. J. Agron. 2007, 26, 39–53. [Google Scholar] [CrossRef]
- Jat, L.K.; Singh, S.K.; Latare, A.; Singh, R.S.; Patel, C. Effect of date of sowing and fertilizer on growth and yield of wheat in an inceptisol of varanasi. Indian J. Agron. 2014, 58, 611–614. [Google Scholar]
- Haj, H.M.; Mohamed, H.A.; Eltayeb, E.I. Effect of sowing date and irrigation interval on growth and yield of wheat and its thermal time requirement under New Halfa. J. Sci. Technol. 1990, 8, 1–4. [Google Scholar]
- Dias, A.S.; Lidon, F.C. Evaluation of grain filling rate and duration in bread and durum wheat, under heat stress after anthesis. J. Agron. Crop Sci. 2009, 195, 137–147. [Google Scholar] [CrossRef]
- Tashiro, T.; Wardlaw, I. The Response to High Temperature Shock and Humidity Changes Prior to and During the Early Stages of Grain Development in Wheat. Aust. J. Plant Physiol. 1990, 17, 551–561. [Google Scholar] [CrossRef]
- Corbellini, M.; Canevar, M.G.; Mazza, L.; Ciaffi, M.; Lafiandra, D.; Borghi, B. Effect of the duration and intensity of heat shock during grain-filling on dry matter and protein accumulation, technological quality and protein composition in bread and durum wheat. Aust. J. Plant Physiol. 1997, 24, 245–260. [Google Scholar] [CrossRef]
- Ashraf, M. Stress-Induced Changes in Wheat Grain Composition and Quality. Crit. Rev. Food Sci. Nutr. 2014, 54, 1576–1583. [Google Scholar] [CrossRef] [PubMed]
- Fois, S.; Schlichting, L.; Marchylo, B.; Dexter, J.; Motzo, R.; Giunta, F. Environmental conditions affect semolina quality in durum wheat (Triticum turgidum ssp. durum L.) cultivars with different gluten strength and gluten protein composition. J. Sci. Food Agric. 2011, 91, 2664–2673. [Google Scholar] [PubMed]
- Branković, G.R.; Dodig, D.; Zorić, M.Z.; Šurlan-Momirović, G.G.; Dragičević, V.; Đurić, N. Effects of climatic factors on grain vitreousness stability and heritability in durum wheat. Turk. J. Agric. For. 2014, 38, 429–440. [Google Scholar] [CrossRef]
- GRIS. Genetic Resources Information System for Wheat and Triticale. Available online: http://wheatpedigree.net (accessed on 13 May 2022).
- Aprile, A.; Sabella, E.; Vergine, M.; Genga, A.; Siciliano, M.; Nutricati, E.; Rampino, P.; De Pascali, M.; Luvisi, A.; Miceli, A.; et al. Activation of a gene network in durum wheat roots exposed to cadmium. BMC Plant Biol. 2018, 18, 238. [Google Scholar] [CrossRef] [PubMed]
Publisher’s Note: MDPI stays neutral with regard to jurisdictional claims in published maps and institutional affiliations. |
© 2022 by the authors. Licensee MDPI, Basel, Switzerland. This article is an open access article distributed under the terms and conditions of the Creative Commons Attribution (CC BY) license (https://creativecommons.org/licenses/by/4.0/).

