Article

Exploration of Urban Emission Mitigation Pathway under the Carbon Neutrality Target: A Case Study of Beijing, China

1
Management School, University of Liverpool, Liverpool L69 7ZH, UK
2
School of Economics and Management, North China Electric Power University, Beijing 102206, China
3
School of Economics and Management, North China Electric Power University, Baoding 071003, China
*
Author to whom correspondence should be addressed.
Sustainability 2022, 14(21), 14016; https://doi.org/10.3390/su142114016
Submission received: 19 August 2022 / Revised: 1 October 2022 / Accepted: 24 October 2022 / Published: 27 October 2022

Abstract

:
Exploring the urban carbon neutrality pathway is crucial to the overall achievement of the net-zero emissions target in China. Therefore, taking Beijing as a case study, this paper firstly analyzes the CO2 emission drivers by combining the Stochastic Impacts by Regression on Population, Affluence, and Technology (STIRPAT) and partial least squares (PLS) methods. Subsequently, based on the optimized extreme learning machine (ELM) model, this paper projects the CO2 emissions of Beijing during 2021–2060 under different scenarios. The results show that controlling the total energy consumption and increasing the proportion of non-fossil energy consumption and electrification level should be the key measures to implement emission reduction in Beijing. Particularly, the proportion of non-fossil energy consumption and electrification level should be increased to 65% and 73%, respectively, in 2060. In addition, more stringent emission reduction policies need to be implemented to achieve the carbon neutrality target. Under the H−EPS scenario, Beijing’s CO2 emissions peaked in 2010 and will be reduced by a cumulative 109 MtCO2 during 2021–2060. Along with executing emission mitigation policies, Beijing should actively increase carbon sinks and develop carbon capture, utilization, and storage (CCUS) technology. Especially after 2040, the emission reduction produced by carbon sinks and CCUS technology should be no less than 20 MtCO2 per year.

1. Introduction

To cope with the increasingly severe climate change situation and achieve sustainable development, China proposed to achieve carbon peaking by 2030 and carbon neutrality by 2060 on 22 September 2020 [1]. Under the constraint of the carbon neutrality target, all provinces and cities in China shoulder important responsibilities for emission abatement. However, there are significant differences in resource endowments and economic development levels in different urban areas, so it is necessary to formulate targeted emission reduction policies and explore feasible carbon neutrality pathways. Beijing, the capital of China and a low-carbon pilot city, should play a demonstrative and leading role in achieving the carbon neutrality target. Therefore, taking Beijing as an example, this paper examines the driving factors of CO2 emissions and investigates the best pathway to achieve the goal of net-zero emissions.
With the proposal of the carbon neutrality target, scholars have performed an in-depth exploration into the realization pathway of carbon neutrality. Some studies have analyzed China’s overall carbon neutrality pathway and put forward targeted policy measures. For instance, Zhang and Chen suggested that to achieve carbon neutrality, China needs to increase the electrification rate and the proportion of renewable energy, and accelerate technological breakthroughs [2]. He et al., analyzed the carbon emission pathways in six long-term development scenarios under the condition of the carbon neutrality goal and the temperature rise constraints required by the Paris Agreement [3]. Some scholars discussed the carbon neutrality target at the regional or city level. Combined with the experience of low-carbon pilot provinces, Li et al., put forward feasible measures to achieve the carbon neutrality goal from the perspectives of policy, industrial structure, population, and carbon absorption [4]. In particular, several literature studies explored the carbon neutrality pathway in Beijing. For example, Hu et al., constructed an energy structure optimization model and projected the carbon emission reduction pathway of Beijing [5]. This study reveals that residents and transportation sectors will be the main sources of emissions in the future. Huang et al., explored the key areas and methods of carbon emission reduction in Beijing from 2015 to 2060 under six different policy scenarios [6]. The above-mentioned studies analyzed the future emission reduction pathway of Beijing from the perspective of sectors, while the carbon neutrality pathway in Beijing is evaluated in this paper from an overall perspective. In addition, this paper introduces the proportion of non-fossil energy consumption and electrification that represent the policy orientation of carbon neutrality, and designs more possible scenarios. This can help achieve a more comprehensive exploration of Beijing’s future carbon emission trajectory.
The Logarithmic mean Divisia index (LMDI) model [7,8,9], the Stochastic Impacts by Regression on Population, Affluence, and Technology (STIRPAT) model [10,11,12], and the input–output approach [13,14] are commonly used methods to study the impact factors of CO2 emissions. It should be emphasized that the STIRPAT model is derived from the impact, population, affluence, and technology (IPAT) model and has been extended and enriched by scholars based on three important aspects: Population, wealth, and technology. For instance, Shuai et al., adopted the STIRPAT model to identify five key factors affecting China’s carbon emissions, including real per capita GDP, the urbanization rate, the ratio of tertiary to secondary industry, renewable energy share, and fixed asset investment [15]. Based on the provincial panel data from 2005–2016, Li et al., analyzed the influencing factors of carbon emissions through the STIRPAT model. It is found that the technical level and government environmental supervision could restrain the increase in carbon emissions. In contrast, population, affluence, energy intensity, industrial structure, urbanization level, and investment in fixed assets play a role in promoting carbon emissions [16]. Many studies indicate that the STIRPAT model has the advantage of flexible indicator selection, which facilitates the inclusion of more influencing factors. Therefore, this paper intends to adopt the STIRPAT method to quantitatively analyze the impact of selected factors on CO2 emissions in Beijing. For the selection of influencing factors, besides the common indicators such as population, per capita GDP, total energy consumption, and energy intensity, the proportion of non-fossil energy consumption and electrification rate will also be included. Under the constraints of the carbon neutrality target, improving the electrification level is an effective way to reduce fossil energy consumption and curb carbon emissions [17]. Several studies have concluded that electrification makes a significant contribution to controlling carbon emissions [18,19]. The impact of non-fossil energy consumption proportion, electrification, and other indicators on Beijing’s carbon emissions needs to be further discussed. In addition, in order to achieve Beijing’s carbon neutrality target, how to set the future target values of each indicator should be further studied.
In terms of carbon emission forecast models, intelligent algorithms such as the backpropagation neural network (BPNN) and ELM have been widely applied in recent years because of their superior prediction accuracy. For example, Lu et al., employed the optimized BPNN model to project carbon emissions for China’s heavy chemical industry and verified the effectiveness of the constructed model [20]. Wang et al., predicted the carbon emissions of China, the United States, and India based on the improved BPNN model, and the results revealed that the forecast model displayed good prediction performance [21]. Han et al., applied the improved ELM model to analyze and predict the energy and carbon emissions of petrochemical systems [22]. Additionally, a previous study has shown that an extreme learning machine (ELM) network exhibits a robust performance in projecting carbon emissions [23]. Therefore, the ELM is selected as the simulation model in this paper, and the pelican optimization algorithm (POA), newly developed in 2022, is used to optimize the ELM network.
Generally, scholars mostly focus on the Beijing–Tianjin–Hebei region, exploring its carbon emission influencing factors and emission reduction pathways [24,25,26]. However, Beijing has a special political status, and its economic level and innovation ability are in a leading position in China. Consequently, a series of emission reduction measures in Beijing also deserve special attention. More importantly, Beijing is shouldering the important task of taking the lead in achieving the goal of carbon neutrality. Based on this, this paper takes Beijing as a case study to explore the possible carbon neutrality pathway. The contribution of this paper is to construct the research framework for the realization pathway of urban carbon neutrality and provide a reference for Beijing to formulate feasible and targeted emission reduction measures. It is also useful for exploring the pathway of emission reduction in other cities. Furthermore, this paper combines the POA technique with the ELM model, which can further expand the application of both algorithms. Furthermore, it can provide a new research method for projecting the future trajectory of CO2 emissions.

2. Materials and Methods

2.1. Study Area

Beijing is located at 39°56′ N and 116°20′ E at the northern end of the North China Plain. As the capital of China, Beijing is in a leading position in terms of economic development and technological innovation. In 2020, Beijing’s per capita GDP reached 164,889 Yuan per person, and the urbanization rate was 87.55% [27]. However, along with the rapid expansion of thee social economy and modern industry, Beijing is facing severe air pollution issues [28]. In response to the pressure on resources and the environment, Beijing has formulated a series of energy-saving and emission-reduction measures, which have achieved remarkable results. In particular, the share of coal in the city’s energy consumption was reduced from 13.1% in 2015 to 1.5% in 2020. During the 13th Five-Year Plan period (2016–2020), the cumulative energy consumption per unit of gross regional product dropped by 24% [29]. In the context of the proposed carbon neutrality target, Beijing, as a low-carbon pilot city and a demonstration city for energy conservation and emission reduction, has announced to take the lead in achieving carbon peaking and conducting research on carbon neutrality pathways [30].

2.2. STIRPAT Model

The original IPAT model holds that the impact of human activities on the environment is determined by the population, per capita wealth, and technological level [31]. The STIRPAT model is developed from the IPAT model [32], and its basic form is expressed as Equation (1). To eliminate the possible heteroscedasticity effect of the model and estimate the coefficient, Equation (1) is usually converted into logarithmic form, as displayed in Equation (2). With the aim of exploring the influence of more factors on CO2 emissions, the STIRPAT model is expanded, as shown in Equation (3).
I = a P b A c T d e
ln I = a + b ln P + c ln A + d ln T + e
where I indicates the environmental pressure; P, A, and T refer to population size, affluence scale, and technological level, respectively; b, c, and d are the elastic coefficients of the above indicators, respectively; and a and e represent the constant term and error term of the model, respectively.
ln C D E = β 0 + β 1 ln P O P + β 2 ln G D P + β 3 l n T E C + β 4 l n N E C P + β 5 l n E I + β 6 l n E L E + e
where β 1 β 6 respectively represent the elastic coefficients of the corresponding variables; β 0 refers to the constant term and e represents the residual error. The descriptions of variables in Equation (3) are shown in Table 1.
To solve a multiple regression equation such as Equation (3), the ordinary least square (OLS) method is usually used. However, Table 2 reveals that the variance inflation factor (VIF) values of all independent variables are greater than 10, indicating a multicollinearity problem, and thus the OLS method cannot be adopted. Consequently, the partial least squares (PLS) method is introduced, which incorporates principal component analysis, typical correlation analysis, and multiple linear regression analysis [33]. In addition, the variable importance for the projection (VIP) value is calculated to measure the explanatory power of independent variables to dependent variables, as expressed in Equation (4). Generally, if the VIP value of the independent variable is greater than 0.8, it is a significant influencing factor [34].
V I P v = u f = 1 M r f 2 f = 1 M r f 2 ω f v 2
where u refers to the number of independent variables and v represents the v-th independent variable; r f 2 is the explanatory ability of the f-th component of the dependent variable and f = 1 M r f 2 is the cumulative explanatory power of the PLS model; ω f v 2 denotes the f-th component of the ω v axis, which is used to measure the marginal contribution of the variable to the component; f = 1 M r f 2 ω f v 2 is the accumulative explanatory power of the principal component to the dependent variable.

2.3. POA-ELM Model

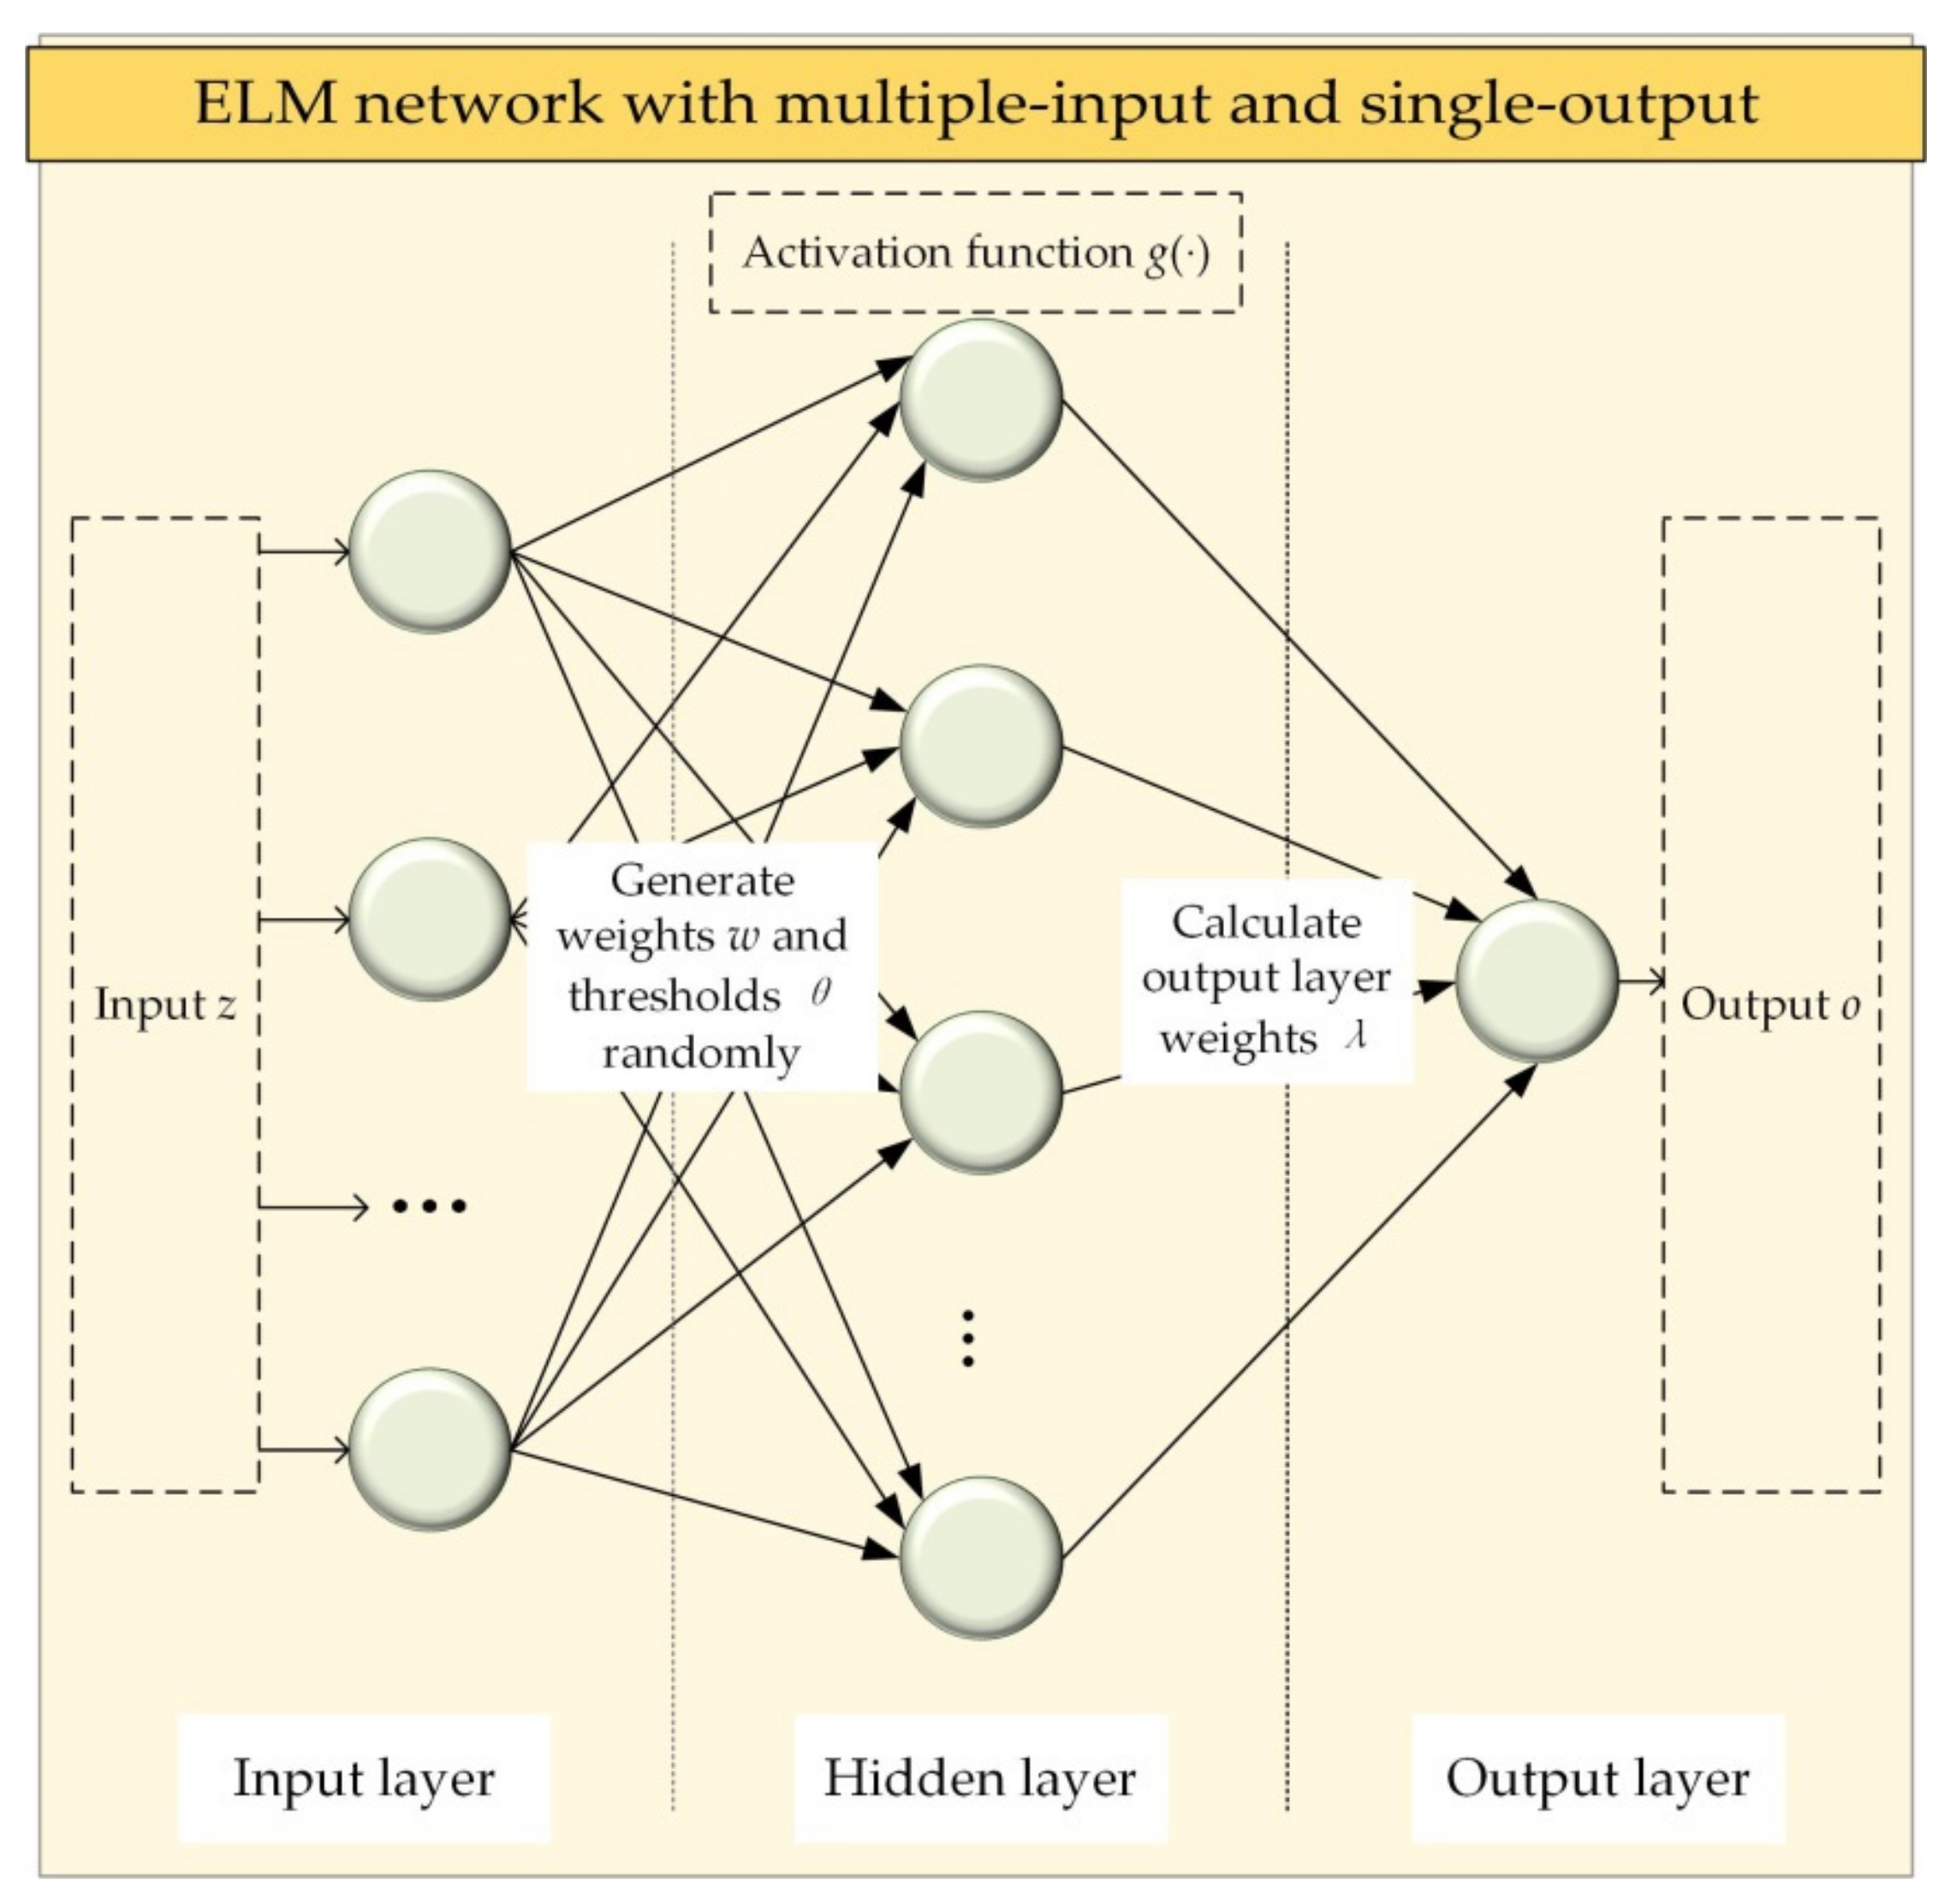
2.3.1. Extreme Learning Machine (ELM)

As a typical single-hidden layer forward network, the ELM model has the advantages of fast operation and high generalization performance [35]. Since there is only a single predicted variable in this paper, the structure of the ELM network with multiple inputs and a single output is introduced, as depicted in Figure 1. In this study, the influencing factors specified by the STIRPAT model are used as the input variables of the ELM model, and the CO2 emission in Beijing is considered the output variable. The imported data set (from 2000 to 2020) is first divided into a training set (from 2000 to 2017) and a testing set (from 2018 to 2020). Assuming that the training set sample is marked as z k , a k | k = 1.2 , , S , the output o k based on the ELM network is expressed as follows:
o k = q = 1 h λ q g w q z k + θ q ,   k = 1 , 2 , , S
where h is the number of neurons in the hidden layer, which is initially determined to be 10 through multiple trials; w q refers to the connection weight between the input and hidden layers, and θ q denotes the threshold of the hidden layer; g is the activation function, and λ q is the weight vector between the hidden and output layers.
The ELM model is characterized in that the weight w q and the threshold θ q can be generated randomly [36,37]. Besides, the connection weight λ q is estimated by the least square method to minimize the error between the output value o k and the actual value a k , instead of being determined by multiple iterations [38]. Notably, to further improve the prediction performance of the ELM model, the POA technique is introduced to provide the optimal weight and threshold.

2.3.2. Pelican Optimization Algorithm (POA)

The population-based algorithm POA simulates the behaviors of pelicans when attacking and hunting prey. The hunting behavior includes the exploration phase and exploitation phase [39]. The exploration stage simulates the activity of moving towards the prey, while the exploitation phase emulates the behavior of winging on the water surface and catching prey [40]. The mathematical principle of POA is introduced as follows.
Firstly, the pelican population is initialized, as expressed in Equation (6).
x i , j = L j + r a n d U j L j , i = 1 , 2 , , N ,   j = 1 , 2 , , m
where x i , j refers to the value of the j-th variable designated by the i-th candidate solution; rand is a random number in the range of [0,1]; N and m represent the number of population members and the number of problem variables, respectively; L j and U j are the j-th lower bound and the j-th upper bound of problem variables. Particularly, each population member X i is considered a candidate solution to the given problem. Besides, the objective function value of the i-th candidate solution is marked as F i . Particularly, the population number is assigned to 30. The lower and upper bounds are 0 and 1, respectively.
During the exploration phase, the pelicans move towards the identified location of the prey, as indicated in Equation (7).
x i , j P 1 = x i , j + r a n d p j I x i , j ,   F P < F i x i , j + r a n d x i , j p j ,     e l s e
where x i , j P 1 represents the new status of the i-th pelican in the j-th dimension during the exploration phase; p j denotes the location of prey in the j-th dimension and   F P refers to the objective function value corresponding to the prey; I refers to the adjustment parameter of a pelican’s exploration ability, which is a random number equal to 1 or 2.
Subsequently, the candidate solution is updated when the objective function value is improved in that position, which can be shown using Equation (8).
X i = X i P 1 ,   F i P 1 < F i X i ,     e l s e
where X i P 1 denotes the new position of the i-th pelican and   F i P 1 represents the objective function value in the exploration phase.
During the exploitation phase, the pelicans capture more prey in the hunting area. This behavior could drive the proposed algorithm to converge to a better solution, which is modeled in Equation (9).
x i , j P 2 = x i , j + R 1 t m i 2 r a n d 1 x i , j
where x i , j P 2 refers to the new status of the i-th pelican in the j-th dimension during the exploitation phase;   R is a constant equal to 0.2; t and m i denote the iteration counter and the maximum number of iterations, respectively; the item R 1 t m i indicates the neighborhood radius of the population members to be searched locally, which makes each member converge to a better solution nearby.
Similarly, the new position is accepted if the objective function is improved, as illustrated in Equation (10).
X i = X i P 2 ,   F i P 2 < F i X i ,     e l s e
where X i P 2 indicates the new position of the i-th pelican and   F i P 2 denotes the objective function value in the exploitation phase.
The update process based on two phases will be repeated until the termination condition is met. The maximum number of iterations is 100. Finally, the best candidate solution is obtained, which represents the best weights and thresholds of the ELM network in this paper. Figure 2 shows the flow chart of the ELM model optimized by the POA algorithm.
Especially, to evaluate the reliability of the improved ELM model, several metrics are introduced, including the mean absolute error (MAE), the mean absolute percentage error (MAPE), the root mean square error (RMSE), and the determination coefficient (R2). The calculation formulas are shown in Equations (11)–(14).
M A E = 1 n ε = 1 n y p v y a v
M A P E = ε = 1 n y p v y a v y a v 100 %
R M S E = 1 n ε = 1 n y p v y a v 2
R 2 = 1 ε = 1 n y a v y p v 2 ε = 1 n y a v y ¯ 2
where n denotes the number of samples in the test set; y a v and y p v represent the actual values and predicted values, respectively, and y ¯ is the average of actual values.

2.4. Date Source

In this paper, the direct CO2 emissions from energy consumption are estimated using Equation (15).
C D E = l = 1 8 E C l N C V l C C l O R l 44 12
where l (l=1,2,…,8) stands for the variety of energy, which refers to coal, coke, crude oil, fuel oil, gasoline, kerosene, diesel, and natural gas, respectively; C D E is the energy-related CO2 emissions in Beijing; E C l and N C V l refer to the consumption and net calorific value of the energy source e, respectively, and their data are all obtained from the China Energy Statistical Yearbook (2001–2021) [41]; C C l and O R l represent the carbon content per unit calorific value and the carbon oxidation rate, respectively. The above data come from the Guidelines for the Compilation of Provincial Greenhouse Gas Inventory (for Trial Implementation) [42]; 44/12 indicates the conversion factor for converting carbon to carbon dioxide.
In terms of the drivers of CO2 emissions, the data on the population and GDP are collected from the Beijing Statistical Yearbook (2001–2021) [27]. Specifically, GDP per capita is obtained by dividing the real GDP (2000 base year) by the population. The total energy consumption data come from the China Energy Statistics Yearbook (2001–2021) [41], and energy intensity is the ratio of total energy consumption to actual GDP. The proportion of non-fossil energy consumption is the ratio of total non-fossil energy consumption to total energy consumption, and the data come from the iNEMS database of the Center for Energy and Environmental Policy Research, Beijing Institute of Technology [43], and the Beijing Statistical Yearbook (2001–2021) [27]. Electrification refers to the proportion of electricity consumption to terminal consumption, and the relevant data are derived from the China Energy Statistical Yearbook (2001–2021) [41].

3. Results

3.1. Analytical Results of the STIRPAT Model

Based on the constructed STIRPAT model, PLS regression analysis is performed using SIMCA software. As illustrated in Table 3, when the number of extracted components is 4, the value of Q2 is less than the critical value and fails the significance test. Therefore, the cross-validation results show that the optimal number of components is 3. In addition, when the number of components is 3, the values of R2Y (cum) and Q2 (cum) exceed 0.9, indicating that the constructed PLS regression equation has excellent explanatory and predictive power.
In addition, SIMCA software also generates a scores scatter plot, as shown in Figure 3a. According to Hotelling’s T2 rule, observations far from the ellipse are regarded as outliers. It is obvious that the sample points are in the ellipse or near the ellipse line, and no abnormal points exist. Figure 3b displays that there is a strong linear relationship between the respective first components of the independent and dependent variables.
Table 4 demonstrates the elastic coefficient and VIP value of each variable. The variations in population, total energy consumption, the share of non-fossil energy consumption, and energy intensity contribute to CO2 emissions in Beijing. Particularly, each 1% increase in total energy consumption can lead to a 0.87% increase in CO2 emissions. In contrast, GDP per capita and electrification level are inhibitory factors for CO2 emissions, corresponding to elastic coefficients of −0.02% and −0.13%, respectively. It reveals that economic growth in Beijing is likely to have been decoupled from CO2 emissions. Furthermore, in terms of VIP values, the six variables selected are all important influencing factors of CO2 emissions in Beijing. Especially, the VIP values of total energy consumption and the share of non-fossil energy consumption are both greater than 1, which has a significant effect on CO2 emissions.

3.2. Error Evaluation Results of the POA−ELM Model

To verify the superiority of the POA−ELM model, the original ELM network is considered the comparison model. The two models are run 30 times each, and the estimation results of the average error based on test data are obtained. Figure 4 shows that the simulation value of the POA−ELM model is closer to the real data than that of the single ELM model. As revealed in Table 5, the prediction accuracy of the improved ELM model is greatly increased compared to that of the original ELM network. Specifically, the MAE and RMSE of the POA−ELM model are less than 1 MtCO2, and the MAPE is below 1%. Additionally, the goodness of fit of the improved model is higher than that of the original model. Based on this, the POA−ELM model can be used to project future CO2 emissions in Beijing.

3.3. Simulation Results Based on the POA−ELM Model

3.3.1. Scenarios Setting

As illustrated in Figure 5, three development modes of low, medium, and high for the variation of each indicator are designed in this paper, labeled “L”, “M”, and “H”, respectively. In the medium-speed pattern, the changes in various variables are referred to as the relevant formulated plans for Beijing. The low and high development modes float up and down by a certain value or proportion based on the medium-speed pattern, respectively.
Specifically, the changes in population and GDP per capita are set with reference to the Outline for the 14th Five-Year Plan for Economic and Social Development and Long-Range Objectives Through the Year 2035 in Beijing [30]. It is assumed that population growth tends to be slow or even shows a downward trend. Under the constraints of low and medium modes, the population will peak in 2040 and 2050, respectively, with peak levels of 24.4 million and 25.6 million, respectively. Conversely, the population of Beijing will continue to grow but at a slower pace under the high-speed patterns. During the period of 2021–2025, the increase rate of GDP per capita is 4%, 5%, and 6% in the three scenarios, respectively. It is supposed that the growth rate of GDP per capita will gradually decrease under different scenarios.
The changes in the other four variables are set according to Beijing’s latest energy conservation and emission reduction policies. According to Beijing’s Climate Change and Energy Conservation Plan during the 14th Five-Year Plan Period [44], the total energy consumption in Beijing should be controlled at approximately 80.5 million tons of standard coal, and the proportion of non-fossil energy consumption should be increased to 14.4% in 2025. Besides, the cumulative decline rate of energy intensity during the 14th Five-Year Plan period (2021–2025) should be 14%. It is assumed that the decline rate of energy intensity will gradually accelerate in the future scale. In addition, the increased scope of electrification is in line with Beijing’s Energy Development Plan during the 14th Five-Year Plan Period [29], and it is assumed that the electrification level will be improved faster.
In order to explore more possible trajectories of CO2 emissions in Beijing, nine scenarios are designed, as shown in Table 6. Since the different variations of TEC, NECP, EI, and ELE represent the different policy implementation, three scenarios are defined, namely, the baseline scenario, policy scenario, and enhanced policy scenario (marked as “BS”, “PS”, and “EPS”, respectively). Under the policy scenario, the changes in each variable are set according to the medium development pattern. Conversely, the baseline scenario and the enhanced policy scenario represent no policy intervention and enhanced policy implementation, respectively. In addition, various scenarios are named according to the different development patterns of each variable. For example, “L−BS” represents that the population and GDP per capita are at a low development level, while other indicators are in a mode without policy intervention.

3.3.2. Simulation Results under Different Scenarios

Figure 6 demonstrates that under different scenarios, Beijing’s CO2 emissions will not show an obvious downward trend after 2020 but will experience a plateau transition period. During the plateau period, only the maximum values of M−EPS and H−EPS scenarios will not exceed the historical peak value of 158.71 MtCO2 in Beijing. On the contrary, the peak values of other scenarios are higher than the historical peak level. Under the L−BS scenario especially, CO2 emissions will peak at 169.08 MtCO2 in 2026. Furthermore, Figure 6 also reveals that along with the increase in policy implementation, the peak value reached in the platform period will be lower, and the emission reduction achieved will be greater. Specifically, under the constraints of baseline, policy, and enhanced policy scenarios, the range of CO2 emissions in 2060 will be 113.13–112.46 MtCO2, 71.08–82.79 MtCO2, and 9.68–24.53 MtCO2, respectively.
Table 7 manifests the change rates and cumulative emissions of CO2 emissions in Beijing during the rising and declining stages in the forecast interval (2021–2060). It can be seen that in the rising stage, M−BS and H−EPS scenarios achieve the highest and lowest variations of 4.31% and 2.41%, respectively. In the descending stage, the maximum (−7.56%) and minimum (−0.85%) change rates are reflected in the L−EPS and H−BS scenarios, respectively. Furthermore, the H−EPS scenario achieves the minimum cumulative emissions of 3387.50 MtCO2. In turn, the maximum cumulative emissions of 5841.06 MtCO2 will be realized in the L−BS scenario.
From the perspective of emission reductions in different intervals shown in Figure 7, the CO2 emissions in Beijing show an increasing trend in all scenarios from 2020 to 2030. Particularly, the H−EPS achieves the lowest increase amount of 3.28 MtCO2. During the period of 2030–2040, a significant downward trend of CO2 emissions is reflected under the designed scenarios, and the emission reduction varies from 7.85 MtCO2 to 63.53 MtCO2. From 2040 to 2050, the minimum (16.69 MtCO2) and maximum (43.17 MtCO2) emission reductions are achieved under H−BS and L−EPS, respectively. Similarly, during the period of 2050–2060, the worst emission reduction effect is reflected in the H−BS scenario, while the L−EPS scenario achieves the largest emission reduction of 36.31 MtCO2. Overall, compared with 2020, the cumulative emission reduction under each scenario ranges from 11.11 MtCO2 to 123.90 MtCO2.

4. Discussion

From the perspective of influencing factors, the total energy consumption and the proportion of non-fossil energy consumption should be the primary indicators of concern for Beijing. During the research period of 2000–2020, Beijing’s energy consumption and carbon emissions show a similar development trend. This reveals that the relationship between them is closely linked. To further promote energy conservation and emission reduction, Beijing not only needs to control the growth of total energy consumption, but also needs to vigorously develop renewable energy. Several scholars have proved that the application of renewable energy is significant for Beijing to achieve the goal of carbon neutrality [6,45]. In the historical dimension, the proportion of non-fossil energy consumption could promote carbon emissions, but the corresponding elasticity coefficient is small. This is likely because the proportion of non-fossil energy consumption in Beijing is still at a low level currently. With the development and progress of technology, renewable energy will gradually replace fossil energy and be vigorously developed and applied, which will become a restraining factor of CO2 emissions in Beijing. In addition, the elasticity coefficient of per capita GDP to carbon emissions is negative, which proves that Beijing’s economic growth and carbon emissions are likely decoupled, which is consistent with previous studies [46,47]. Beijing should continue to achieve high-quality economic growth and strive to build a coordinated development relationship between energy, environment, and economy. Furthermore, given the remarkable inhibition effect of electrification on CO2 emissions, Beijing must vigorously carry out electric energy substitution and accelerate the improvement of its electrification level.
The prediction results of Huang et al., demonstrate that under the comprehensive policy scenarios, Beijing’s carbon emissions will begin to decline after 2025 [6]. The future trajectory of CO2 emissions projected in this paper is consistent with the above research. It can be speculated that the population and total energy consumption will increase rapidly between 2021 and 2025, so the CO2 emissions in Beijing show an increasing trend. Furthermore, according to the simulation results, without policy intervention, Beijing’s CO2 emissions will still be at a high level in 2060. Therefore, in order to accomplish the net-zero emissions target, Beijing should formulate more stringent emission reduction measures. More importantly, it is difficult to achieve carbon neutrality by 2060 only by reducing emissions. While implementing emission reduction, efforts should be made to expand forest carbon sinks, and carbon capture, utilization, and storage (CCUS) technology should be actively developed and applied.
In addition, according to the peak value in the plateau period and cumulative emissions, the CO2 emission trajectory under the constraint of the H−EPS scenario is considered the optimal emission reduction pathway for Beijing. Under this scenario, CO2 emissions will not be at the lowest level in 2060, which may be attributed to the increasing population and rapid economic growth. Although the emission reduction driven by policy is limited in the H−EPS scenario, the extensive application of CCUS technology in the future will provide an important guarantee for Beijing to achieve the carbon neutrality target. If Beijing pursues a steady and high-quality economic growth pattern, and the population does not continue to grow, the M−EPS scenario can be used as the optimal emission abatement pathway. Combined with the emission reductions in the optimal scenario, the abatement of CCUS technology and carbon sinks should be more than 20 MtCO2 per year, so as to achieve the carbon neutrality goal earlier.

5. Conclusions and Policy Recommendations

5.1. Conclusions

This paper aimed to explore the realization pathway of the urban carbon neutrality target by taking Beijing as an example. The driving factor research model was constructed based on the STIRPAT and PLS methods and the key factors affecting Beijing’s CO2 emissions were identified. Subsequently, a new carbon emission prediction model was developed, and the validity and superiority of the POA−ELM model were verified by error analysis and comparative analysis. Then, this paper set different development scenarios and explored the emission reduction pathway for Beijing under the carbon neutrality target constraint. The relevant conclusions are described as follows.
Firstly, the total energy consumption and the proportion of non-fossil energy consumption have a significant impact on Beijing’s CO2 emissions, which should be regarded as the key guiding indicators for Beijing to formulate energy conservation and emission-reduction policies. Upgrading the electrification level has a dampening effect on CO2 emissions in Beijing. Consequently, accelerating electric energy replacement is also seen as an important emission reduction strategy. In addition, Beijing’s economic growth is likely decoupled from CO2 emissions, and efforts should be made to maintain the coordinated development of energy, the economy, and the environment in the future.
Secondly, the peak time of Beijing’s CO2 emissions is delayed to 2025 or 2026, and the carbon neutrality target cannot be achieved in 2060 under the baseline scenario without policy intervention. Beijing’s carbon emission reduction will be elevated along with the increase in policy implementation. Therefore, in order to achieve the carbon neutrality target, Beijing should formulate stricter policies on energy conservation and emission reduction.
Finally, the minimum peak level in the plateau period and the minimum cumulative emissions are achieved in the H−EPS scenario, which can be regarded as the best emission-reduction scenario. Under this scenario, Beijing’s CO2 emissions reached a peak in 2010 and reach a cumulative reduction of 109 MtCO2 during the period of 2021–2060. However, in this scenario, the realization of the carbon neutrality target depends on the support of CCUS technology and forest carbon sinks in the later stage. Consequently, driven by a combination of strict emission reduction policies, increased forest carbon sinks, and the development of CCUS technology, Beijing is likely to achieve carbon neutrality by 2060. Notably, the cumulative emission reduction of carbon sinks and CCUS technology should be greater than 20 MtCO2 per year after 2040.

5.2. Policy Recommendations

Based on the above conclusions, policy recommendations are proposed to promote the realization of Beijing’s carbon neutrality goal.
Firstly, importance should be attached to the policy of “double control” of the total energy consumption and energy consumption intensity. Beijing should strictly control the total energy consumption, and especially strengthen the monitoring and management of energy consumption in high-energy-consuming industries such as petrochemical and cement. Beijing’s total energy consumption is required to reach its peak around 2030 and reduce to 74.5 million tons of standard coal by 2060. Meanwhile, Beijing should strive to improve energy efficiency and promote the rapid decline of energy intensity. During the 14th Five-Year Plan period, the cumulative decrease rate of energy intensity should reach more than 16%, and by 2060, the energy intensity should decrease by more than 80% compared with 2020.
Secondly, efforts should be made to develop renewable energy, gradually reduce the use of fossil energy, and increase the proportion of non-fossil energy consumption. The proportion of non-fossil energy consumption should be increased to 65% in 2060. Beijing should make full use of advanced technology resources to promote the large-scale application of renewable energy technologies. In addition, Beijing needs to speed up the improvement of the electrification level and expand the scale of transferring green electricity outside while promoting the local development of green electricity. By 2060, the proportion of electricity in terminal energy consumption should be increased to 73%.
Third, Beijing should improve the coordinated development network among energy, the economy, and the environment. Beijing should strive for high-quality economic growth under the impetus of scientific and technological innovation. Under the support of the Beijing–Tianjin–Hebei development strategy, Beijing needs to strengthen scientific and technological cooperation with Tianjin and Hebei. It is necessary to develop high-tech enterprises and cultivate high-end talents.
Finally, as the capital of China, Beijing should take the lead in achieving the goal of carbon neutrality and provide a model and leading role for other provinces and cities. Other cities can learn from Beijing’s development experience and emission reduction policies and integrate their own advantages. For example, Shanghai, Guangzhou, and Shenzhen, which are also low-carbon pilot cities, can establish a close cooperative relationship with Beijing through the development of low-carbon pilot projects. Furthermore, the Yangtze River Delta region has significant potential for renewable energy development and advanced technological development level. Therefore, the Yangtze River Delta urban agglomeration should also be the pioneer to achieve the goal of carbon neutrality.

Author Contributions

Conceptualization, Z.J., S.Z. and W.L.; methodology, Z.J.; software, S.Z.; validation, Z.J. and S.Z; formal analysis, Z.J.; investigation, Z.J.; resources, S.Z.; data curation, W.L.; writing—original draft preparation, Z.J. and S.Z.; writing—review and editing, W.L. All authors have read and agreed to the published version of the manuscript.

Funding

This research received no external funding.

Institutional Review Board Statement

Not applicable.

Informed Consent Statement

Not applicable.

Data Availability Statement

The dataset is available on request.

Conflicts of Interest

The authors declare no conflict of interest.

Abbreviations

LMDILogarithmic mean Divisia index
IPATImpact, population, affluence, and technology
STIRPATStochastic Impacts by Regression on Population, Affluence and Technology
BPNNBack propagation neural network
ELMExtreme learning machine
POAPelican optimization algorithm
OLSOrdinary least square
PLSPartial least squares
VIPVariable importance for the projection
CDECarbon dioxide emission
POPPopulation
GDPGross Domestic Product per capita
TECTotal energy consumption
NECPProportion of non-fossil energy consumption
EIEnergy intensity
ELEElectrification
CCUSCarbon capture, utilization and storage
MAEMean absolute error
MAPEMean absolute percentage error
RMSERoot mean square error

References

  1. Weng, Y.; Cai, W.; Wang, C. Evaluating the use of BECCS and afforestation under China’s carbon-neutral target for 2060. Appl. Energy 2021, 299, 117263. [Google Scholar] [CrossRef]
  2. Zhang, S.; Chen, W.Y. Assessing the energy transition in China towards carbon neutrality with a probabilistic framework. Nat. Commun. 2022, 13, 87. [Google Scholar] [CrossRef] [PubMed]
  3. He, J.K.; Li, Z.; Zhang, X.L.; Wang, H.L.; Dong, W.J.; Du, E.S.; Chang, S.Y.; Ou, X.M.; Guo, S.Y.; Tian, Z.Y.; et al. Towards carbon neutrality: A study on China’s long-term low-carbon transition pathways and strategies. Environ. Sci. Ecotechnol. 2022, 9, 100134. [Google Scholar] [CrossRef] [PubMed]
  4. Li, S.; Xu, Q.; Liu, J.; Shen, L.; Chen, J. Experience learning from low-carbon pilot provinces in China: Pathways towards carbon neutrality. Energy Strategy Rev. 2022, 42, 100888. [Google Scholar] [CrossRef]
  5. Hu, Y.; Chi, Y.Y.; Zhou, W.B.; Wang, Z.Z.; Yuan, Y.K.; Li, R.Y. Research on Energy Structure Optimization and Carbon Emission Reduction Path in Beijing under the Dual Carbon Target. Energies 2022, 15, 5954. [Google Scholar] [CrossRef]
  6. Huang, R.; Zhang, S.; Wang, P. Key areas and pathways for carbon emissions reduction in Beijing for the “Dual Carbon” targets. Energy Policy 2022, 164, 112873. [Google Scholar] [CrossRef]
  7. Yang, B.Y.; Bai, Z.K.; Wang, J.M. Spatiotemporal dynamic differences of energy-related CO2 emissions and the related driven factors in six regions of China during two decades. Environ. Sci. Pollut. Res. 2022, 29, 24737–24756. [Google Scholar] [CrossRef]
  8. Lin, B.Q.; Kui, L. Using LMDI to Analyze the Decoupling of Carbon Dioxide Emissions from China’s Heavy Industry. Sustainability 2017, 9, 1198. [Google Scholar]
  9. Lisaba, E.B.F.; Lopez, N.S.A. Spatiotemporal Comparison of Drivers to CO2 Emissions in ASEAN: A Decomposition Study. Sustainability 2021, 13, 6183. [Google Scholar] [CrossRef]
  10. Su, K.; Wei, D.Z.; Lin, W.X. Influencing factors and spatial patterns of energy-related carbon emissions at the city-scale in Fujian province, Southeastern China. J. Clean. Prod. 2020, 244, 118840. [Google Scholar] [CrossRef]
  11. Hashmi, R.; Alam, K. Dynamic relationship among environmental regulation, innovation, CO2 emissions, population, and economic growth in OECD countries: A panel investigation. J. Clean. Prod. 2019, 231, 1100–1109. [Google Scholar] [CrossRef]
  12. Wang, Q.; Huang, J.J.; Zhou, H.; Sun, J.Q.; Yao, M.K. Carbon Emission Inversion Model from Provincial to Municipal Scale Based on Nighttime Light Remote Sensing and Improved STIRPAT. Sustainability 2022, 14, 6813. [Google Scholar] [CrossRef]
  13. Tian, Y.S.; Xiong, S.Q.; Ma, X.M.; Ji, J.P. Structural path decomposition of carbon emission: A study of China’s manufacturing industry. J. Clean. Prod. 2018, 193, 563–574. [Google Scholar] [CrossRef]
  14. Li, W.; Huang, Y.Y.; Lu, C. Exploring the driving force and mitigation contribution rate diversity considering new normal pattern as divisions for carbon emissions in Hebei province. J. Clean. Prod. 2020, 243, 118559. [Google Scholar] [CrossRef]
  15. Shuai, C.; Chen, X.; Wu, Y.; Tan, Y.; Zhang, Y.; Shen, L. Identifying the key impact factors of carbon emission in China: Results from a largely expanded pool of potential impact factors. J. Clean. Prod. 2018, 175, 612–623. [Google Scholar] [CrossRef]
  16. Chen, W.D.; Yang, R.Y. Evolving Temporal-Spatial Trends, Spatial Association, and Influencing Factors of Carbon Emissions in Mainland China: Empirical Analysis Based on Provincial Panel Data from 2006 to 2015. Sustainability 2018, 10, 2809. [Google Scholar] [CrossRef] [Green Version]
  17. Zhao, X.; Ma, X.; Chen, B.; Shang, Y.; Song, M. Challenges toward carbon neutrality in China: Strategies and countermeasures. Resour. Conserv. Recycl. 2022, 176, 105959. [Google Scholar] [CrossRef]
  18. Peng, Z.M.; Wu, Q.Q.; Li, M. Spatial Characteristics and Influencing Factors of Carbon Emissions from Energy Consumption in China’s Transport Sector: An Empirical Analysis Based on Provincial Panel Data. Pol. J. Environ. Stud. 2020, 29, 217–232. [Google Scholar] [CrossRef]
  19. Huo, T.F.; Ma, Y.L.; Xu, L.B.; Feng, W.; Cai, W.G. Carbon emissions in China’s urban residential building sector through 2060: A dynamic scenario simulation. Energy 2022, 254, 124395. [Google Scholar] [CrossRef]
  20. Lu, C.; Li, W.; Gao, S. Driving determinants and prospective prediction simulations on carbon emissions peak for China’s heavy chemical industry. J. Clean. Prod. 2020, 251, 119642. [Google Scholar] [CrossRef]
  21. Wang, Q.; Li, S.Y.; Pisarenko, Z. Modeling carbon emission trajectory of China, US and India. J. Clean. Prod. 2020, 258, 120723. [Google Scholar] [CrossRef]
  22. Han, Y.; Zhu, Q.; Geng, Z.; Xu, Y. Energy and carbon emissions analysis and prediction of complex petrochemical systems based on an improved extreme learning machine integrated interpretative structural model. Appl. Therm. Eng. 2017, 115, 280–291. [Google Scholar] [CrossRef]
  23. Li, W.; Zhang, S.; Lu, C. Exploration of China’s net CO2 emissions evolutionary pathways by 2060 in the context of carbon neutrality. Sci. Total Environ. 2022, 831, 154909. [Google Scholar] [CrossRef]
  24. Gu, R.D.; Li, C.F.; Li, D.D.; Yang, Y.Y.; Gu, S. The Impact of Rationalization and Upgrading of Industrial Structure on Carbon Emissions in the Beijing-Tianjin-Hebei Urban Agglomeration. Int. J. Environ. Res. Public Health 2022, 19, 7997. [Google Scholar] [CrossRef] [PubMed]
  25. Yu, X.H.; Liang, Z.F.; Fan, J.J.; Zhang, J.L.; Luo, Y.H.; Zhu, X.Y. Spatial decomposition of city-level CO2 emission changes in Beijing-Tianjin-Hebei. J. Clean. Prod. 2021, 296, 126613. [Google Scholar] [CrossRef]
  26. Yan, Q.Y.; Wang, Y.X.; Li, Z.Y.; Balezentis, T.; Streimikiene, D. Coordinated development of thermal power generation in Beijing-Tianjin-Hebei region: Evidence from decomposition and scenario analysis for carbon dioxide emission. J. Clean. Prod. 2019, 232, 1402–1417. [Google Scholar] [CrossRef]
  27. Beijing Municipal Bureau of Statistics. Beijing Statistical Yearbook (2001–2021); China Statistical Publishing House: Beijing, China, 2022. [Google Scholar]
  28. Dong, J.; Wang, Y.; Wang, L.; Zhao, W.; Huang, C. Assessment of PM2.5 exposure risk towards SDG indicator 11.6.2–A case study in Beijing. Sustain. Cities Soc. 2022, 82, 103864. [Google Scholar] [CrossRef]
  29. Beijing Municipal People’s Government Beijing’s Energy Development Plan during the 14th Five-Year Plan Period. Available online: http://www.beijing.gov.cn/zhengce/zhengcefagui/202204/t20220401_2646626.html (accessed on 3 August 2022).
  30. Beijing Municipal People’s Government Outline for the 14th Five-Year Plan for Economic and Social Development and Long-Range Objectives through the Year 2035 in Beijing. Available online: http://czj.beijing.gov.cn/ztlm/zfzqgl/202201/P020220112521349363244.pdf (accessed on 3 August 2022).
  31. Ehrlich, P.R.; Holdren, J.P. Impact of Population Growth. Science 1971, 171, 1212–1217. [Google Scholar] [CrossRef]
  32. York, R.; Rosa, E.A.; Dietz, T. STIRPAT, IPAT and ImPACT: Analytic tools for unpacking the driving forces of environmental impacts. Ecol. Econ. 2003, 46, 351–365. [Google Scholar] [CrossRef]
  33. Zhao, L.; Zhao, T.; Yuan, R. Scenario simulations for the peak of provincial household CO2 emissions in China based on the STIRPAT model. Sci. Total Environ. 2022, 809, 151098. [Google Scholar] [CrossRef]
  34. Xie, P.; Liao, J.; Pan, X.; Sun, F. Will China’s carbon intensity achieve its policy goals by 2030? Dynamic scenario analysis based on STIRPAT-PLS framework. Sci. Total Environ. 2022, 832, 155060. [Google Scholar] [CrossRef]
  35. Huang, G.-B.; Zhu, Q.-Y.; Siew, C.-K. Extreme learning machine: Theory and applications. Neurocomputing 2006, 70, 489–501. [Google Scholar] [CrossRef]
  36. Wang, Y.; Liu, J.; Han, Y. Production capacity prediction of hydropower industries for energy optimization: Evidence based on novel extreme learning machine integrating Monte Carlo. J. Clean. Prod. 2020, 272, 122824. [Google Scholar] [CrossRef]
  37. Zhang, X.-H.; Zhu, Q.-X.; He, Y.-L.; Xu, Y. A novel robust ensemble model integrated extreme learning machine with multi-activation functions for energy modeling and analysis: Application to petrochemical industry. Energy 2018, 162, 593–602. [Google Scholar] [CrossRef]
  38. Zhu, M.C.; Li, S.Q.; Wei, X.L.; Wang, P. Prediction and Stability Assessment of Soft Foundation Settlement of the Fishbone-Shaped Dike Near the Estuary of the Yangtze River Using Machine Learning Methods. Sustainability 2021, 13, 3744. [Google Scholar] [CrossRef]
  39. Trojovsky, P.; Dehghani, M. Pelican Optimization Algorithm: A Novel Nature-Inspired Algorithm for Engineering Applications. Sensors 2022, 22, 855. [Google Scholar] [CrossRef]
  40. Tuerxun, W.; Xu, C.; Haderbieke, M.; Guo, L.; Cheng, Z.M. A Wind Turbine Fault Classification Model Using Broad Learning System Optimized by Improved Pelican Optimization Algorithm. Machines 2022, 10, 407. [Google Scholar] [CrossRef]
  41. Department of Energy Statistics, National Bureau of Statistics. China Energy Statistical Yearbook (2001–2021); China Statistics Press: Beijing, China, 2022. [Google Scholar]
  42. Department of Climate Change of National Development and Reform Commission Guidelines for the Compilation of Provincial Greenhouse Gas Inventory (for Trial Implementation). Available online: http://www.cbcsd.org.cn/sjk/nengyuan/standard/home/20140113/download/shengjiwenshiqiti.pdf (accessed on 2 August 2022).
  43. Center for Energy and Environmental Policy Research. Beijing Institute of Technology Energy and Economic Data Platform. Available online: http://inems1.bit.edu.cn/C3IAM# (accessed on 20 September 2022).
  44. Beijing Municipal Ecology and Environment Bureau. Beijing Municipal Commission of Development and Reform, Beijing’s Climate Change and Energy Conservation Plan during the 14th Five-Year Plan Period; Beijing Municipal Ecology and Environment Bureau: Beijing, China, 2022. [Google Scholar]
  45. Hu, J.F.; Wu, J.; Zhao, C.; Wang, P. Challenges for China to achieve carbon neutrality and carbon peak goals: Beijing case study. PLoS ONE 2021, 16, e0258691. [Google Scholar] [CrossRef]
  46. Wu, Y.; Xu, B. When will China’s carbon emissions peak? Evidence from judgment criteria and emissions reduction paths. Energy Rep. 2022, 8, 8722–8735. [Google Scholar] [CrossRef]
  47. Shi, B.; Xiang, W.; Bai, X.; Wang, Y.; Geng, G.; Zheng, J. District level decoupling analysis of energy-related carbon dioxide emissions from economic growth in Beijing, China. Energy Rep. 2022, 8, 2045–2051. [Google Scholar] [CrossRef]
Figure 1. Basic structure of ELM network with multiple-input and single-output.
Sustainability 14 14016 g001
Figure 2. Flow chart of POA−ELM model.
Sustainability 14 14016 g002
Figure 3. Flow chart of POA-ELM model. (a) Scores scatter plot (t1 vs. t2) (also called T2 ellipse plot); (b) Scores Scatter plot (t1 vs. u1). Notes: The scores t1, t2, etc., are new variables summarizing the X−variables. The scatter plot of t1 vs. t2 shows the possible presence of outliers, groups, similarities, and other patterns in the data. The scatter plot of t1 vs. u1 displays the relationship between the first summary of all the Y−variables (u1) and the first summary of all the X−variables (t1).
Sustainability 14 14016 g003
Figure 4. Prediction results of ELM and POA-ELM models based on test group data (2018–2020).
Sustainability 14 14016 g004
Figure 5. The variations of driving factors under different scenarios from 2021 to 2060.
Sustainability 14 14016 g005
Figure 6. The future CO2 emissions in Beijing under different scenarios in 2021–2060.
Sustainability 14 14016 g006
Figure 7. Emission reduction of Beijing during different intervals under designed scenarios.
Sustainability 14 14016 g007
Table 1. Description of each variable.
VariableDescriptionUnit
CDECarbon dioxide emissionMtCO2
POPPopulation104 Person
GDPGross Domestic Product per capita104 Yuan/Person
TECTotal energy consumption104 Tce
NECPProportion of non-fossil energy consumption%
EIEnergy intensityTce/104 Yuan
ELEElectrification%
Table 2. Collinearity statistics of independent variables.
VariableToleranceVIF Value
lnPOP0.01857.020
lnGDP0.01469.795
lnTEC0.03627.578
lnNECP0.05817.212
lnEI0.000
lnELE0.006169.478
Notes: Tolerance is the inverse of VIF value. Particularly, the tolerance of lnEI reached the limit value of 0.000, and the corresponding VIF value was not displayed in SPSS software.
Table 3. Cross-validation test results of PLS model.
ComponentR2YR2Y (cum)Q2LimitQ2 (cum)Significance
10.70400.70400.66000.05000.6600R1
20.22500.92800.64600.05000.8790R1
30.04080.96900.51400.05000.9410R1
40.00230.9710−0.06060.05000.9380NS
Notes: Component refers to the number of extracted components. R2Y and R2Y (cum) indicate the fraction of Y variation modeled in the component and the cumulative R2Y up to the specified component, respectively. Q2 and Q2(cum) represent the overall cross-validated R2 for the component and the cumulative Q2 up to the specified component, respectively. Limit denotes the critical value of Q2 under which the component is insignificant according to CV rule 1 and Significance refers to CV insignificant (NS) or significant according to rule R1.
Table 4. Coefficient and VIP value of each variable.
VariableCoefficientVIP ValueSort
lnPOP0.36700.97153
lnGDP−0.01880.92614
lnTEC0.87021.26741
lnNECP0.01271.01922
LnEI0.14170.89805
lnELE−0.12960.86446
Note: The sort refers to ranking based on VIP values.
Table 5. Error estimation results for different models.
Evaluation MetricsELMPOA−ELM
MAE (MtCO2)7.67910.4606
MAPE (%)5.42030.3017
RMSE (MtCO2)9.72310.3251
R20.93900.9989
Table 6. Specific scenario settings.
ScenariosPOPGDPTECNECPEIELE
L−BSLLHLLL
L−PSLLMMMM
L−EPSLLLHHH
M−BSMMHLLL
M−PSMMMMMM
M−EPSMMLHHH
H−BSHHHLLL
H−PSHHMMMM
H−EPSHHLHHH
Table 7. Change rate and cumulative amount of Beijing’s CO2 emissions in different scenarios.
ScenariosAverage Annual Rate of Change in the
Rising Stage (%)
Average Annual Rate of Change in the
Declining Stage (%)
Cumulative CO2
Emissions (MtCO2)
L−BS3.52−1.175841.06
L−PS3.91−2.374943.78
L−EPS3.41−7.563603.50
M−BS4.13−1.045726.41
M−PS3.51−2.194800.97
M−EPS2.90−6.563423.06
H−BS3.89−0.855703.15
H−PS3.15−1.864772.01
H−EPS2.41−5.113387.50
Publisher’s Note: MDPI stays neutral with regard to jurisdictional claims in published maps and institutional affiliations.

