
Wetland Functional Area Division Method: A Correlation Analysis of Water Quality and Landscape Structure


Abstract
:1. Introduction
2. Materials and Methods
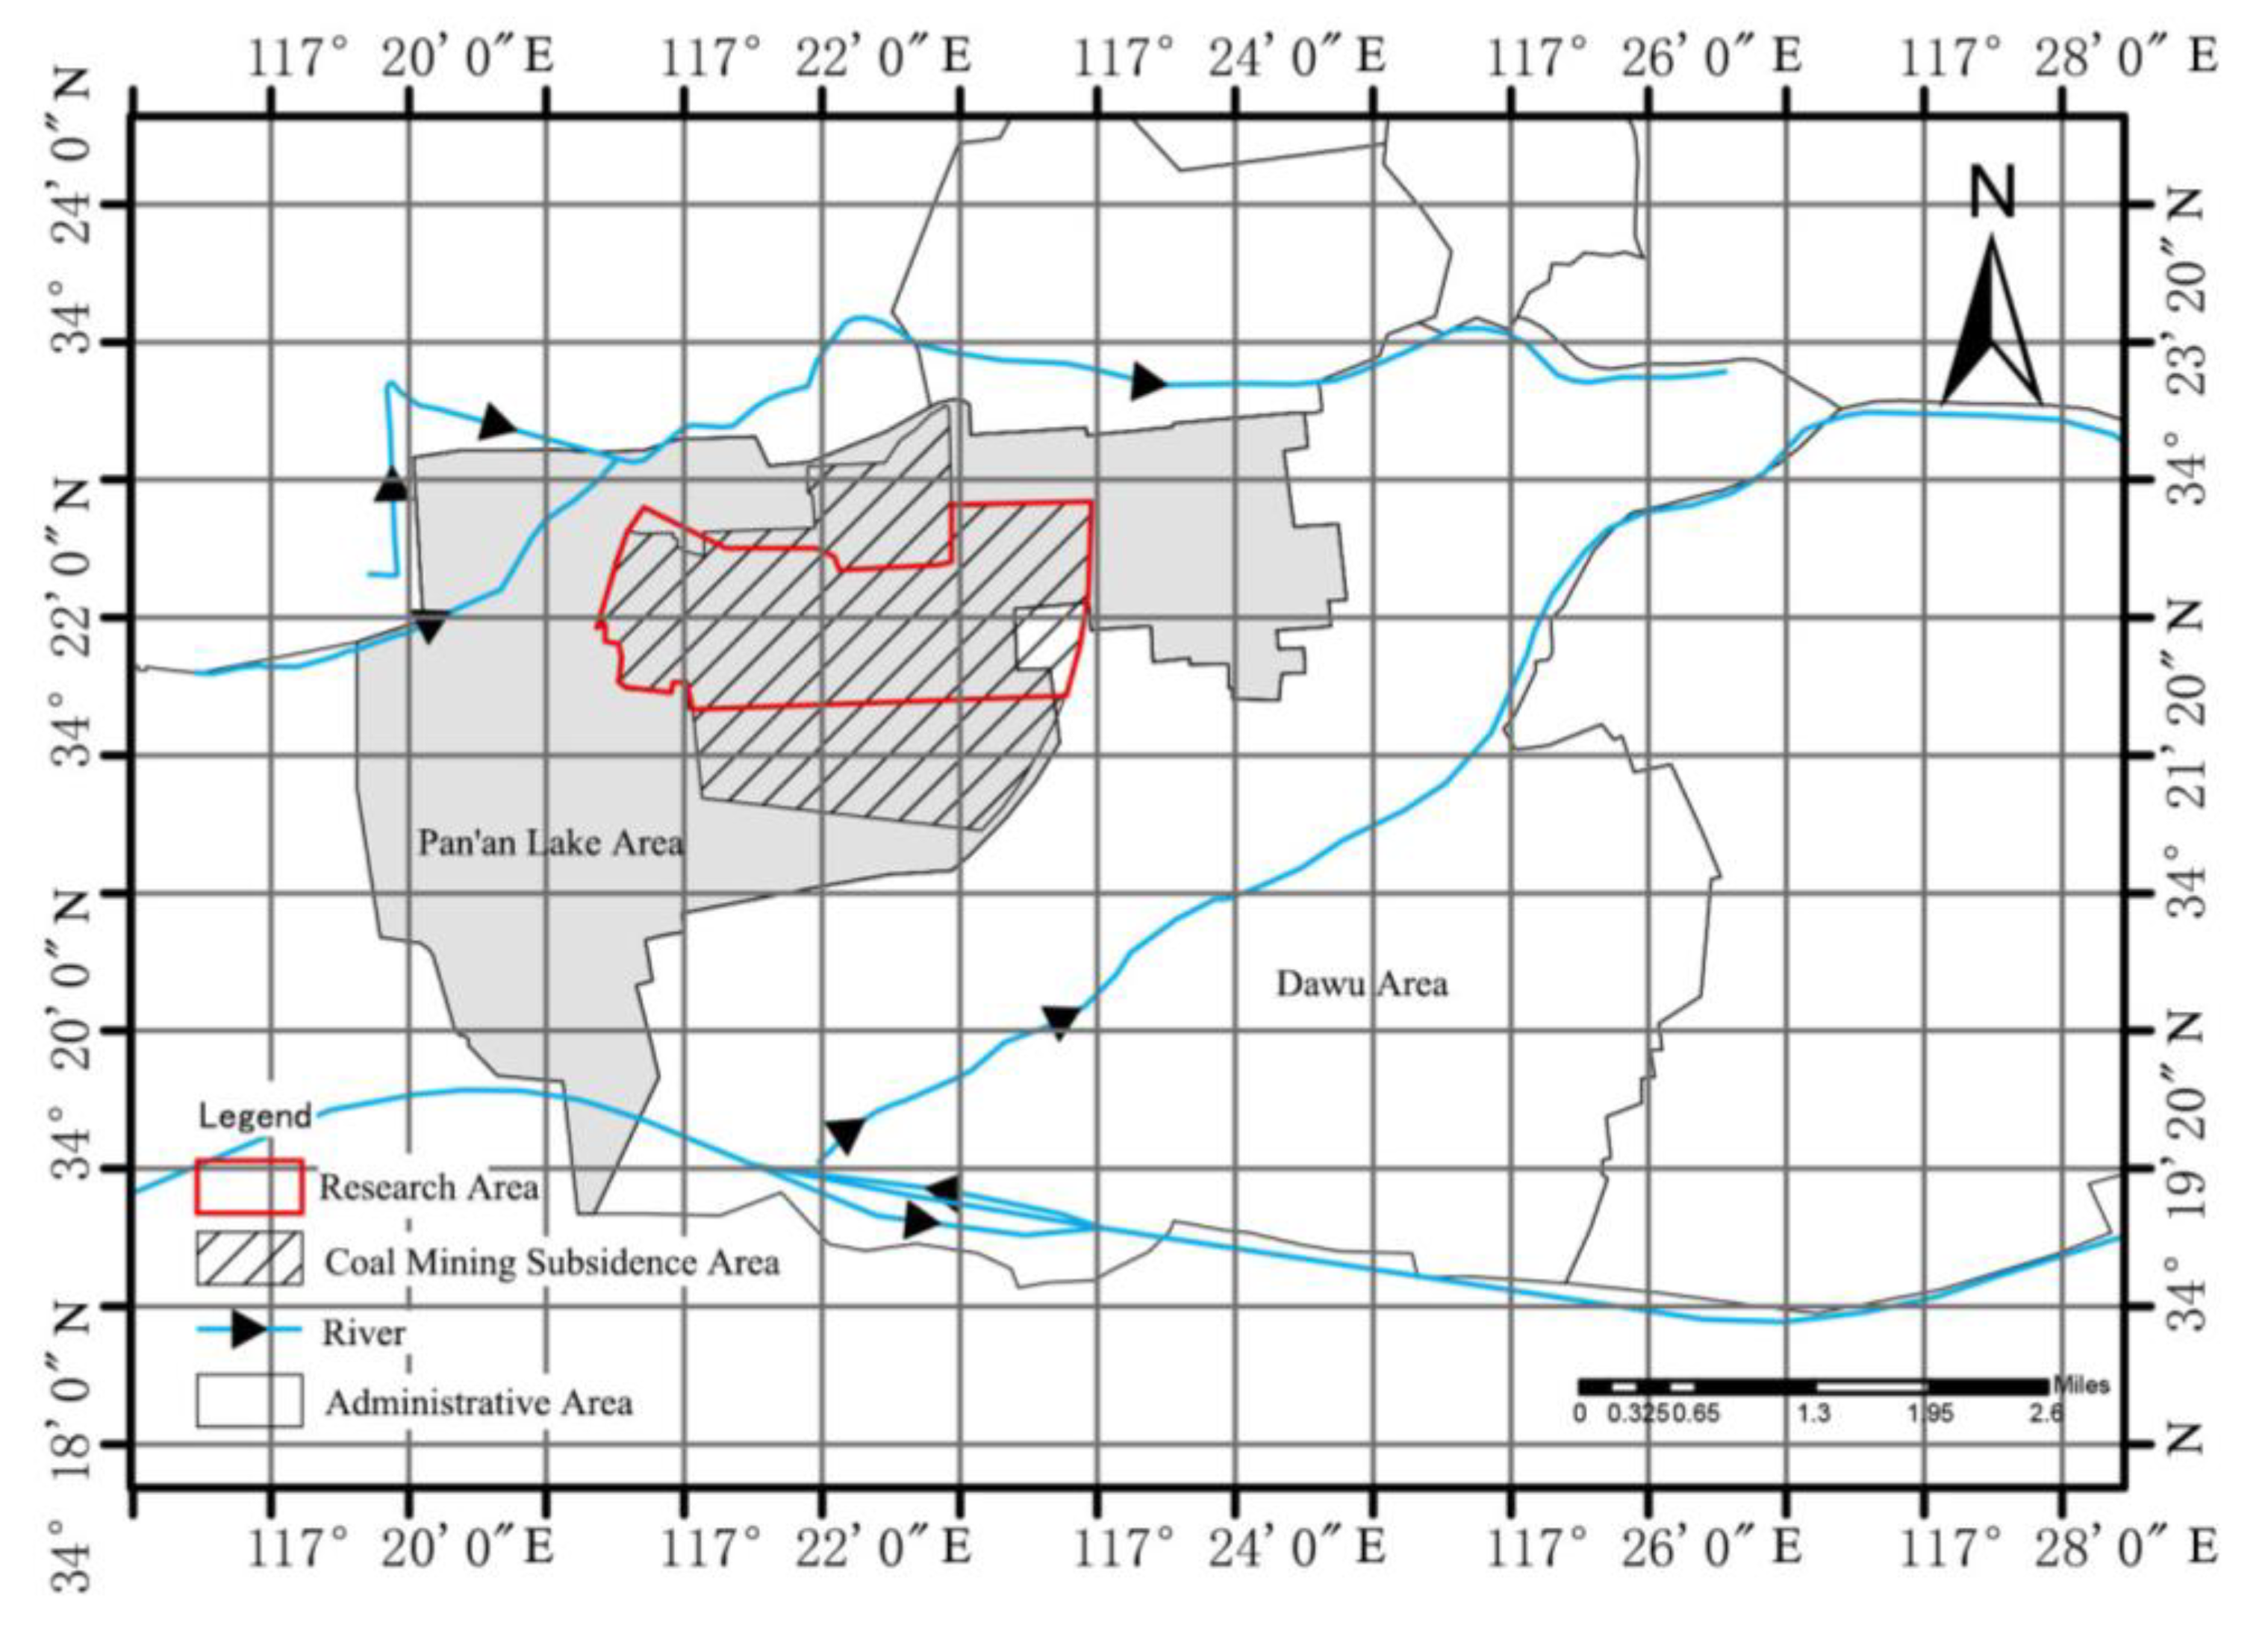
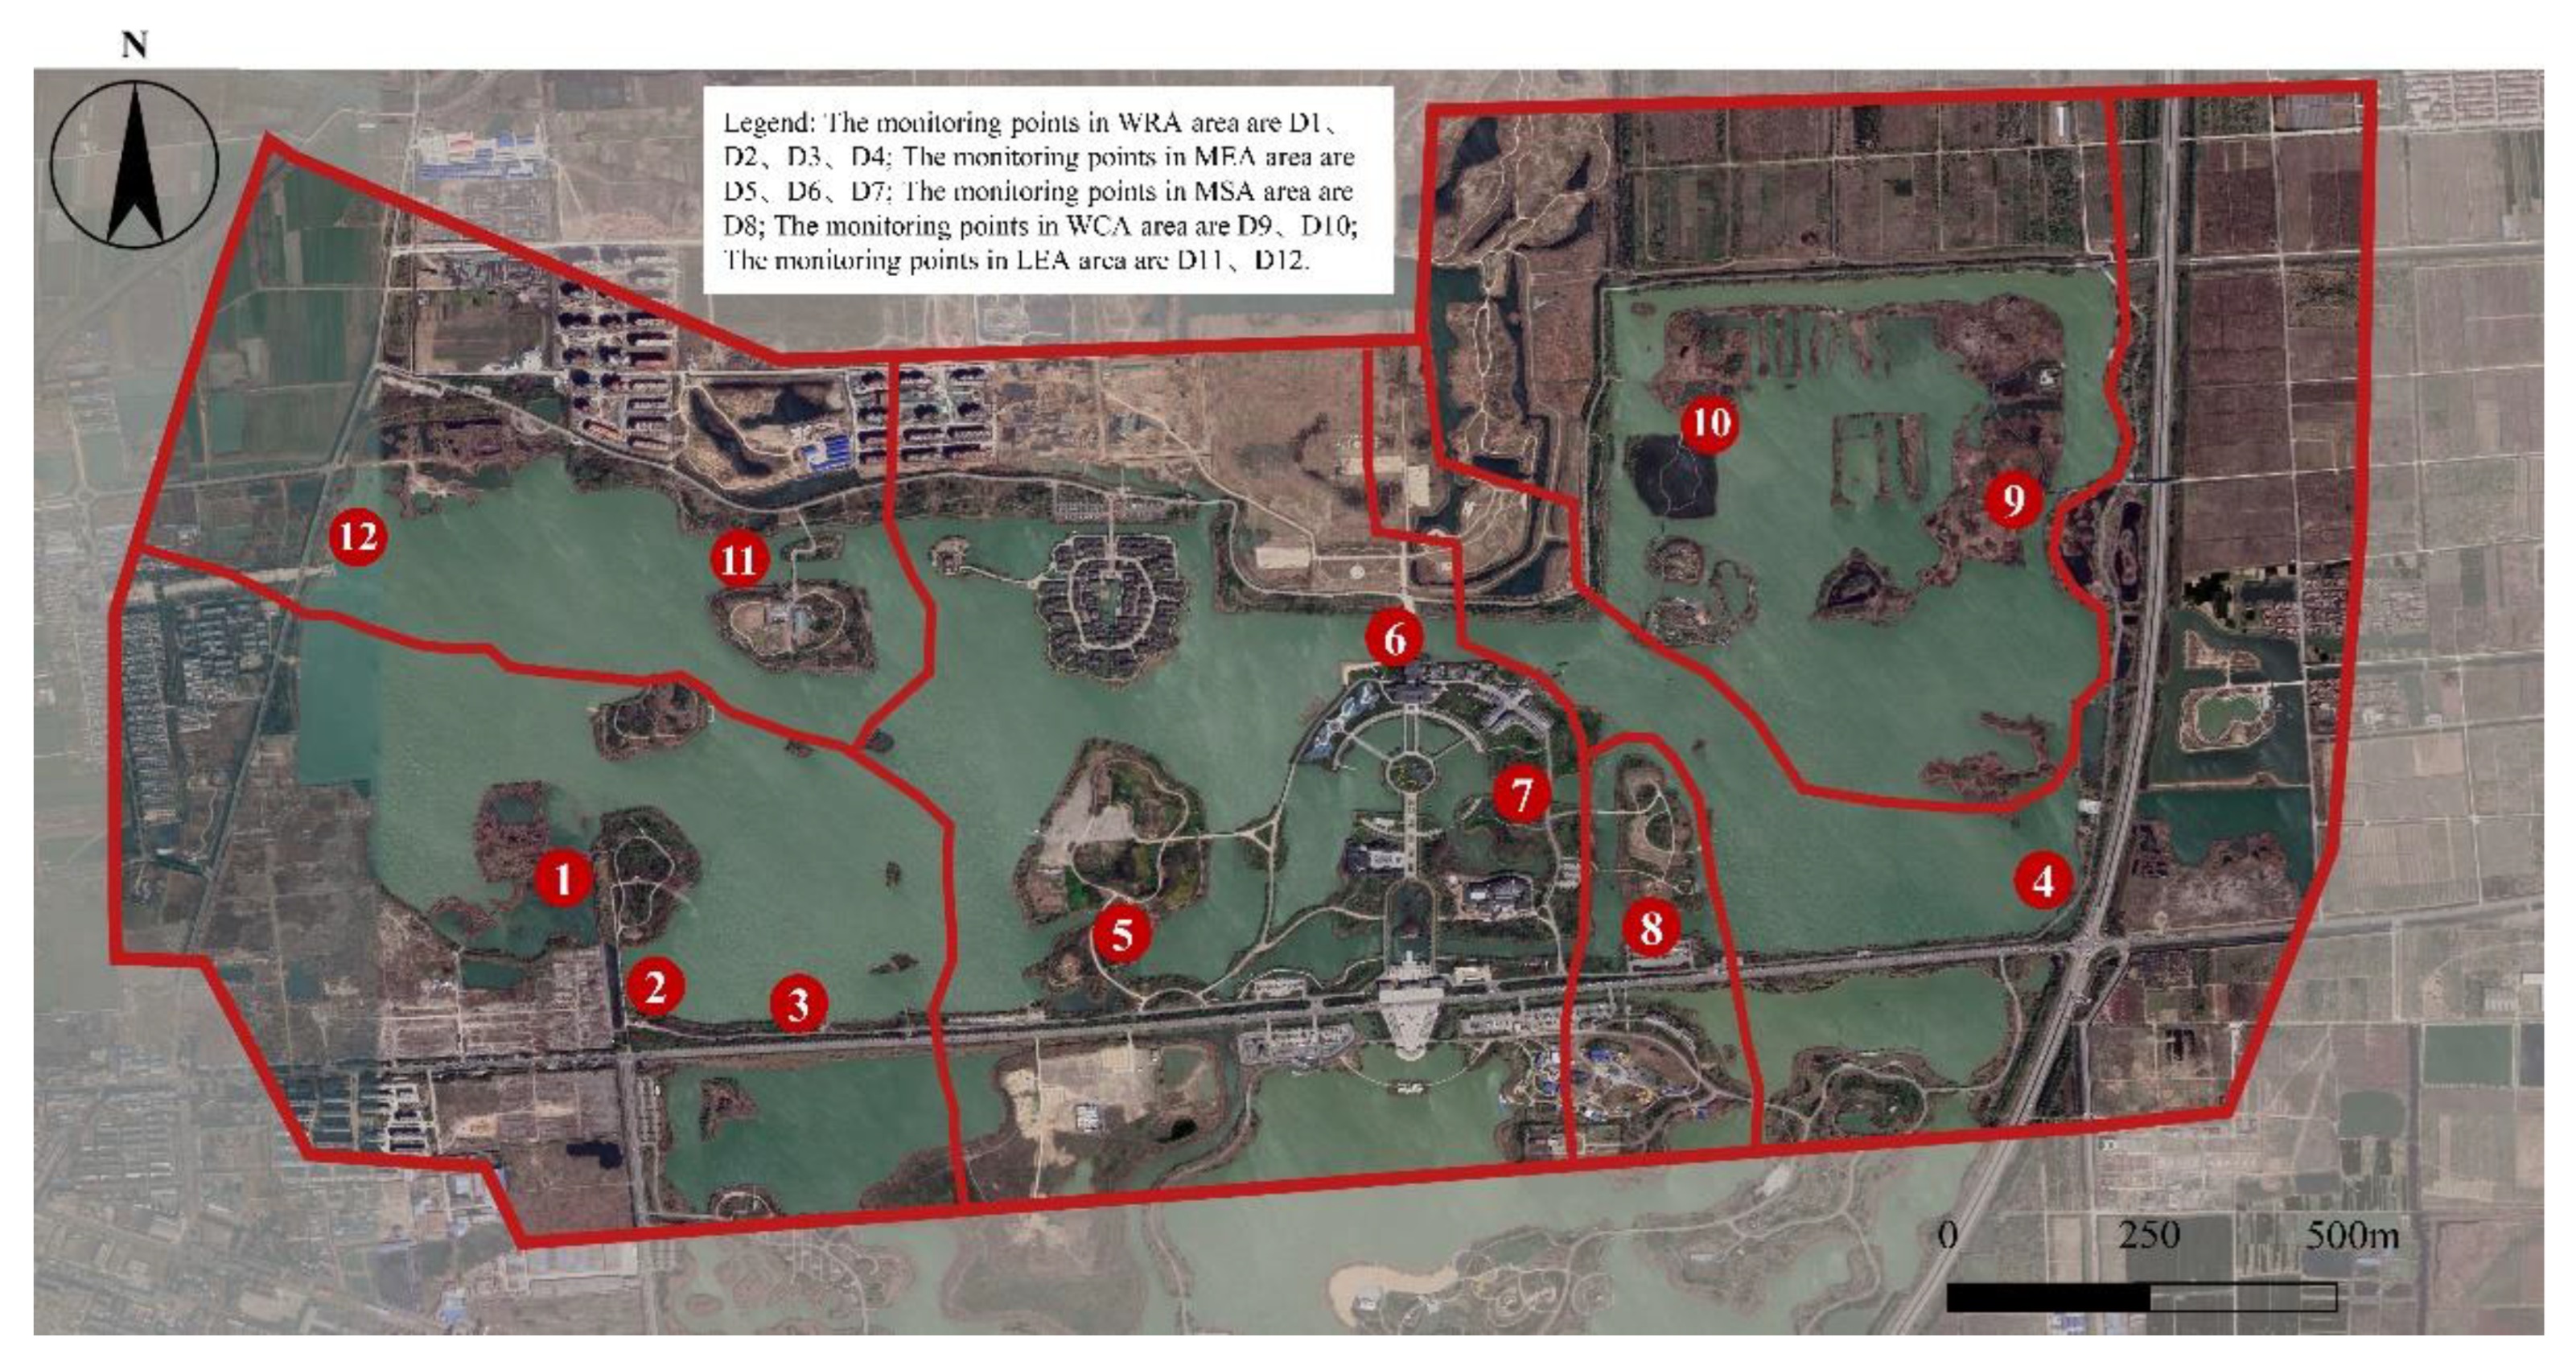
2.1. Study Area
2.2. Functional Zoning and Characteristics of Pan’an Lake Wetland
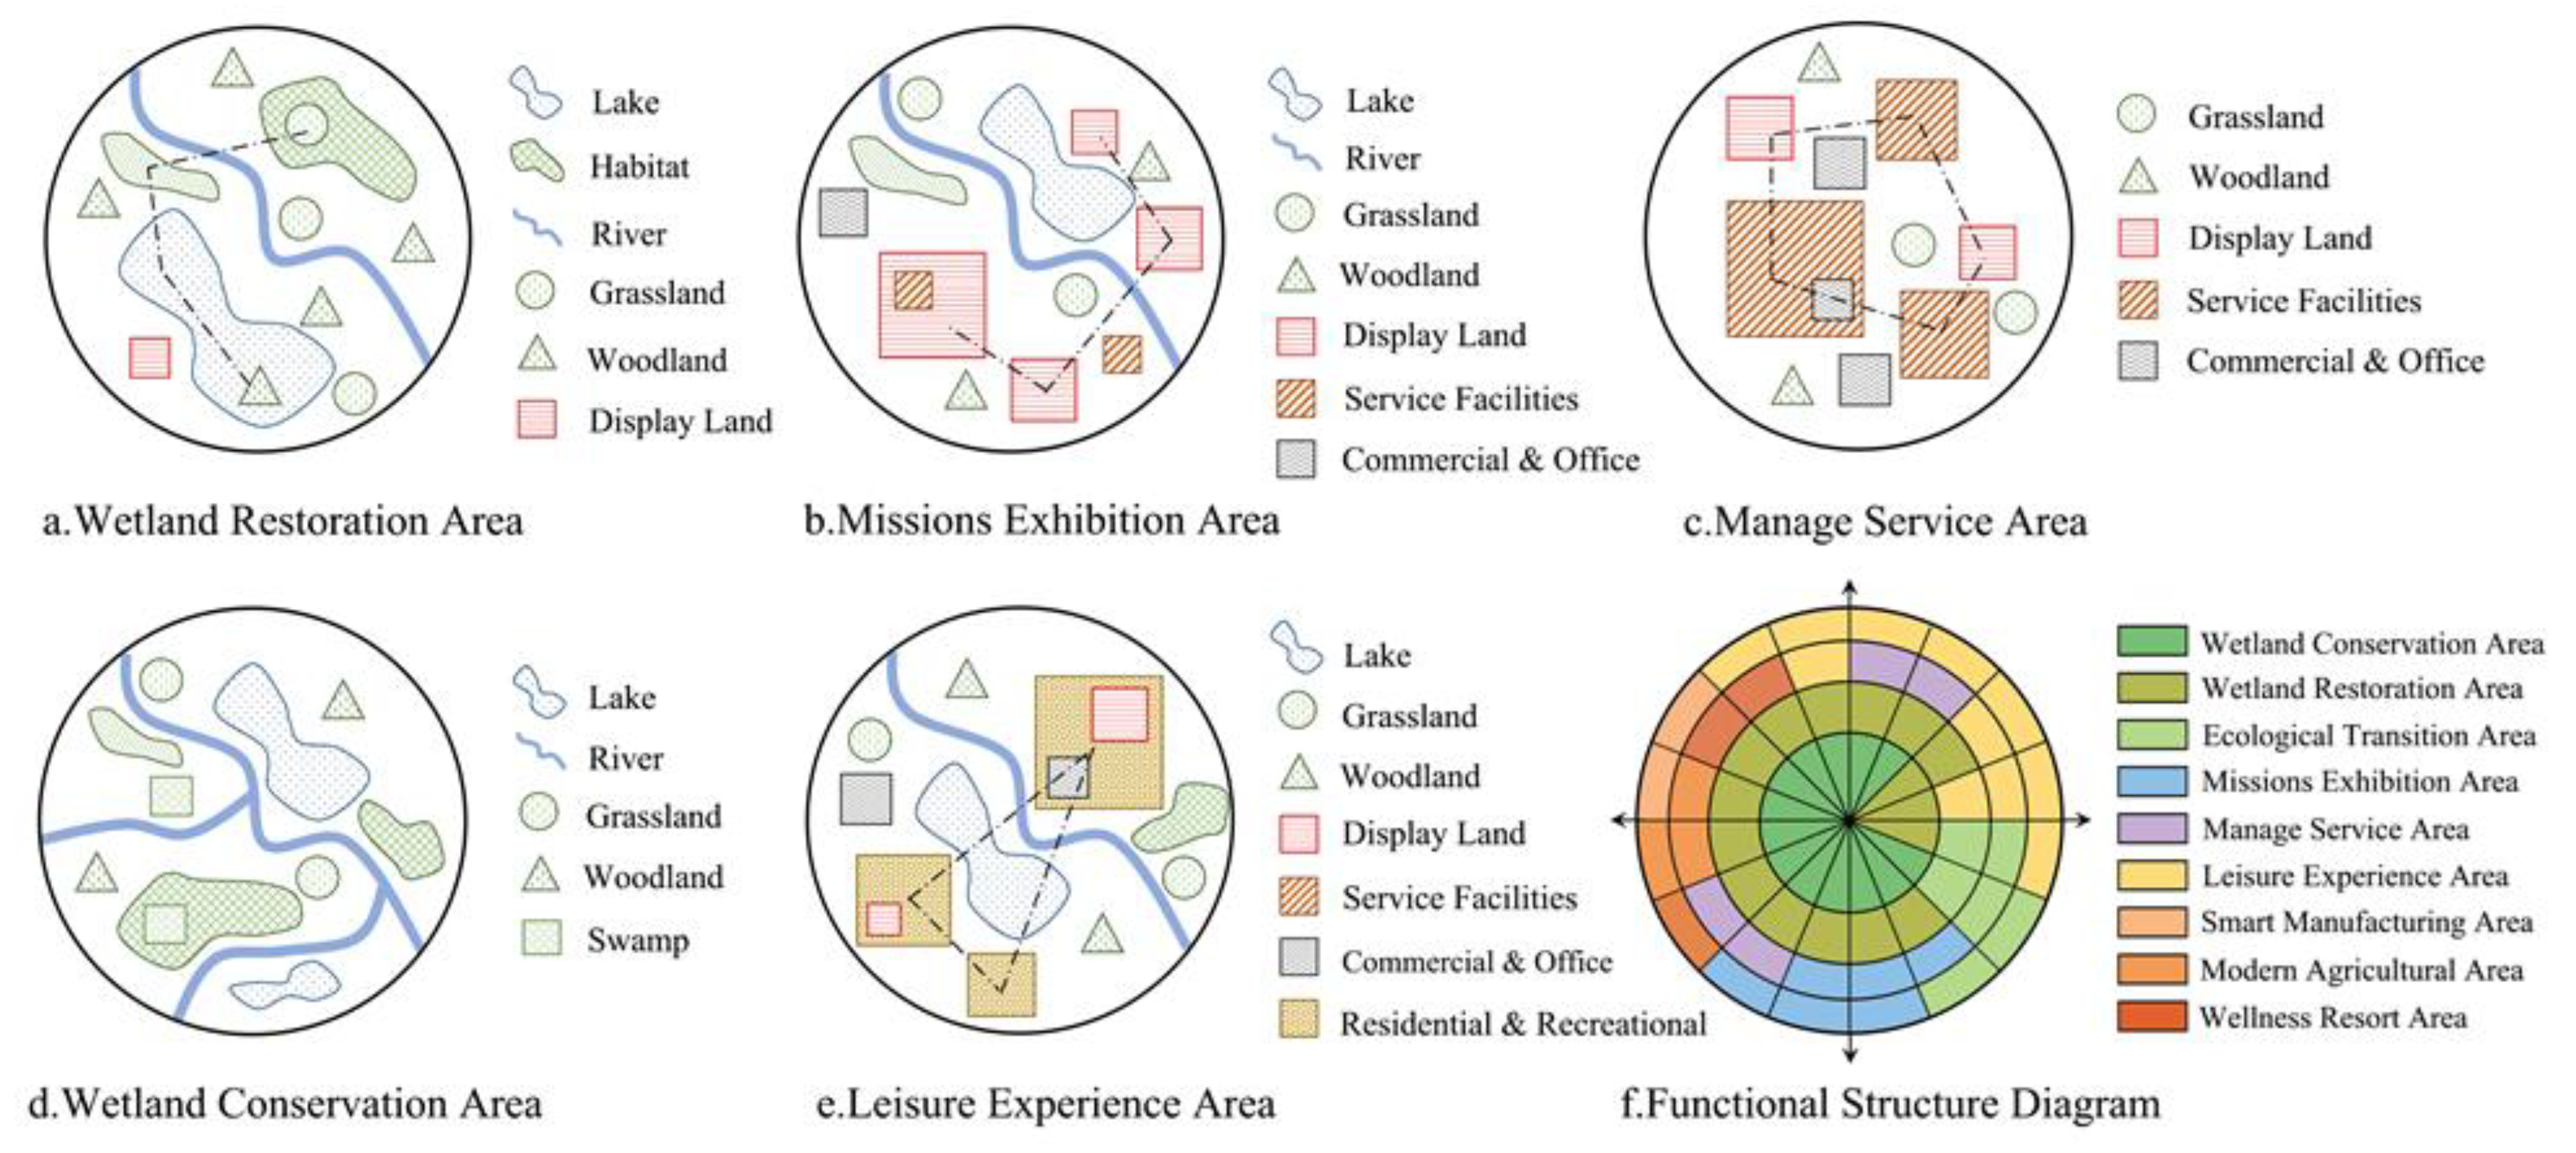
2.2.1. Function Partitions
2.2.2. Landscape Structure and Function Characteristics
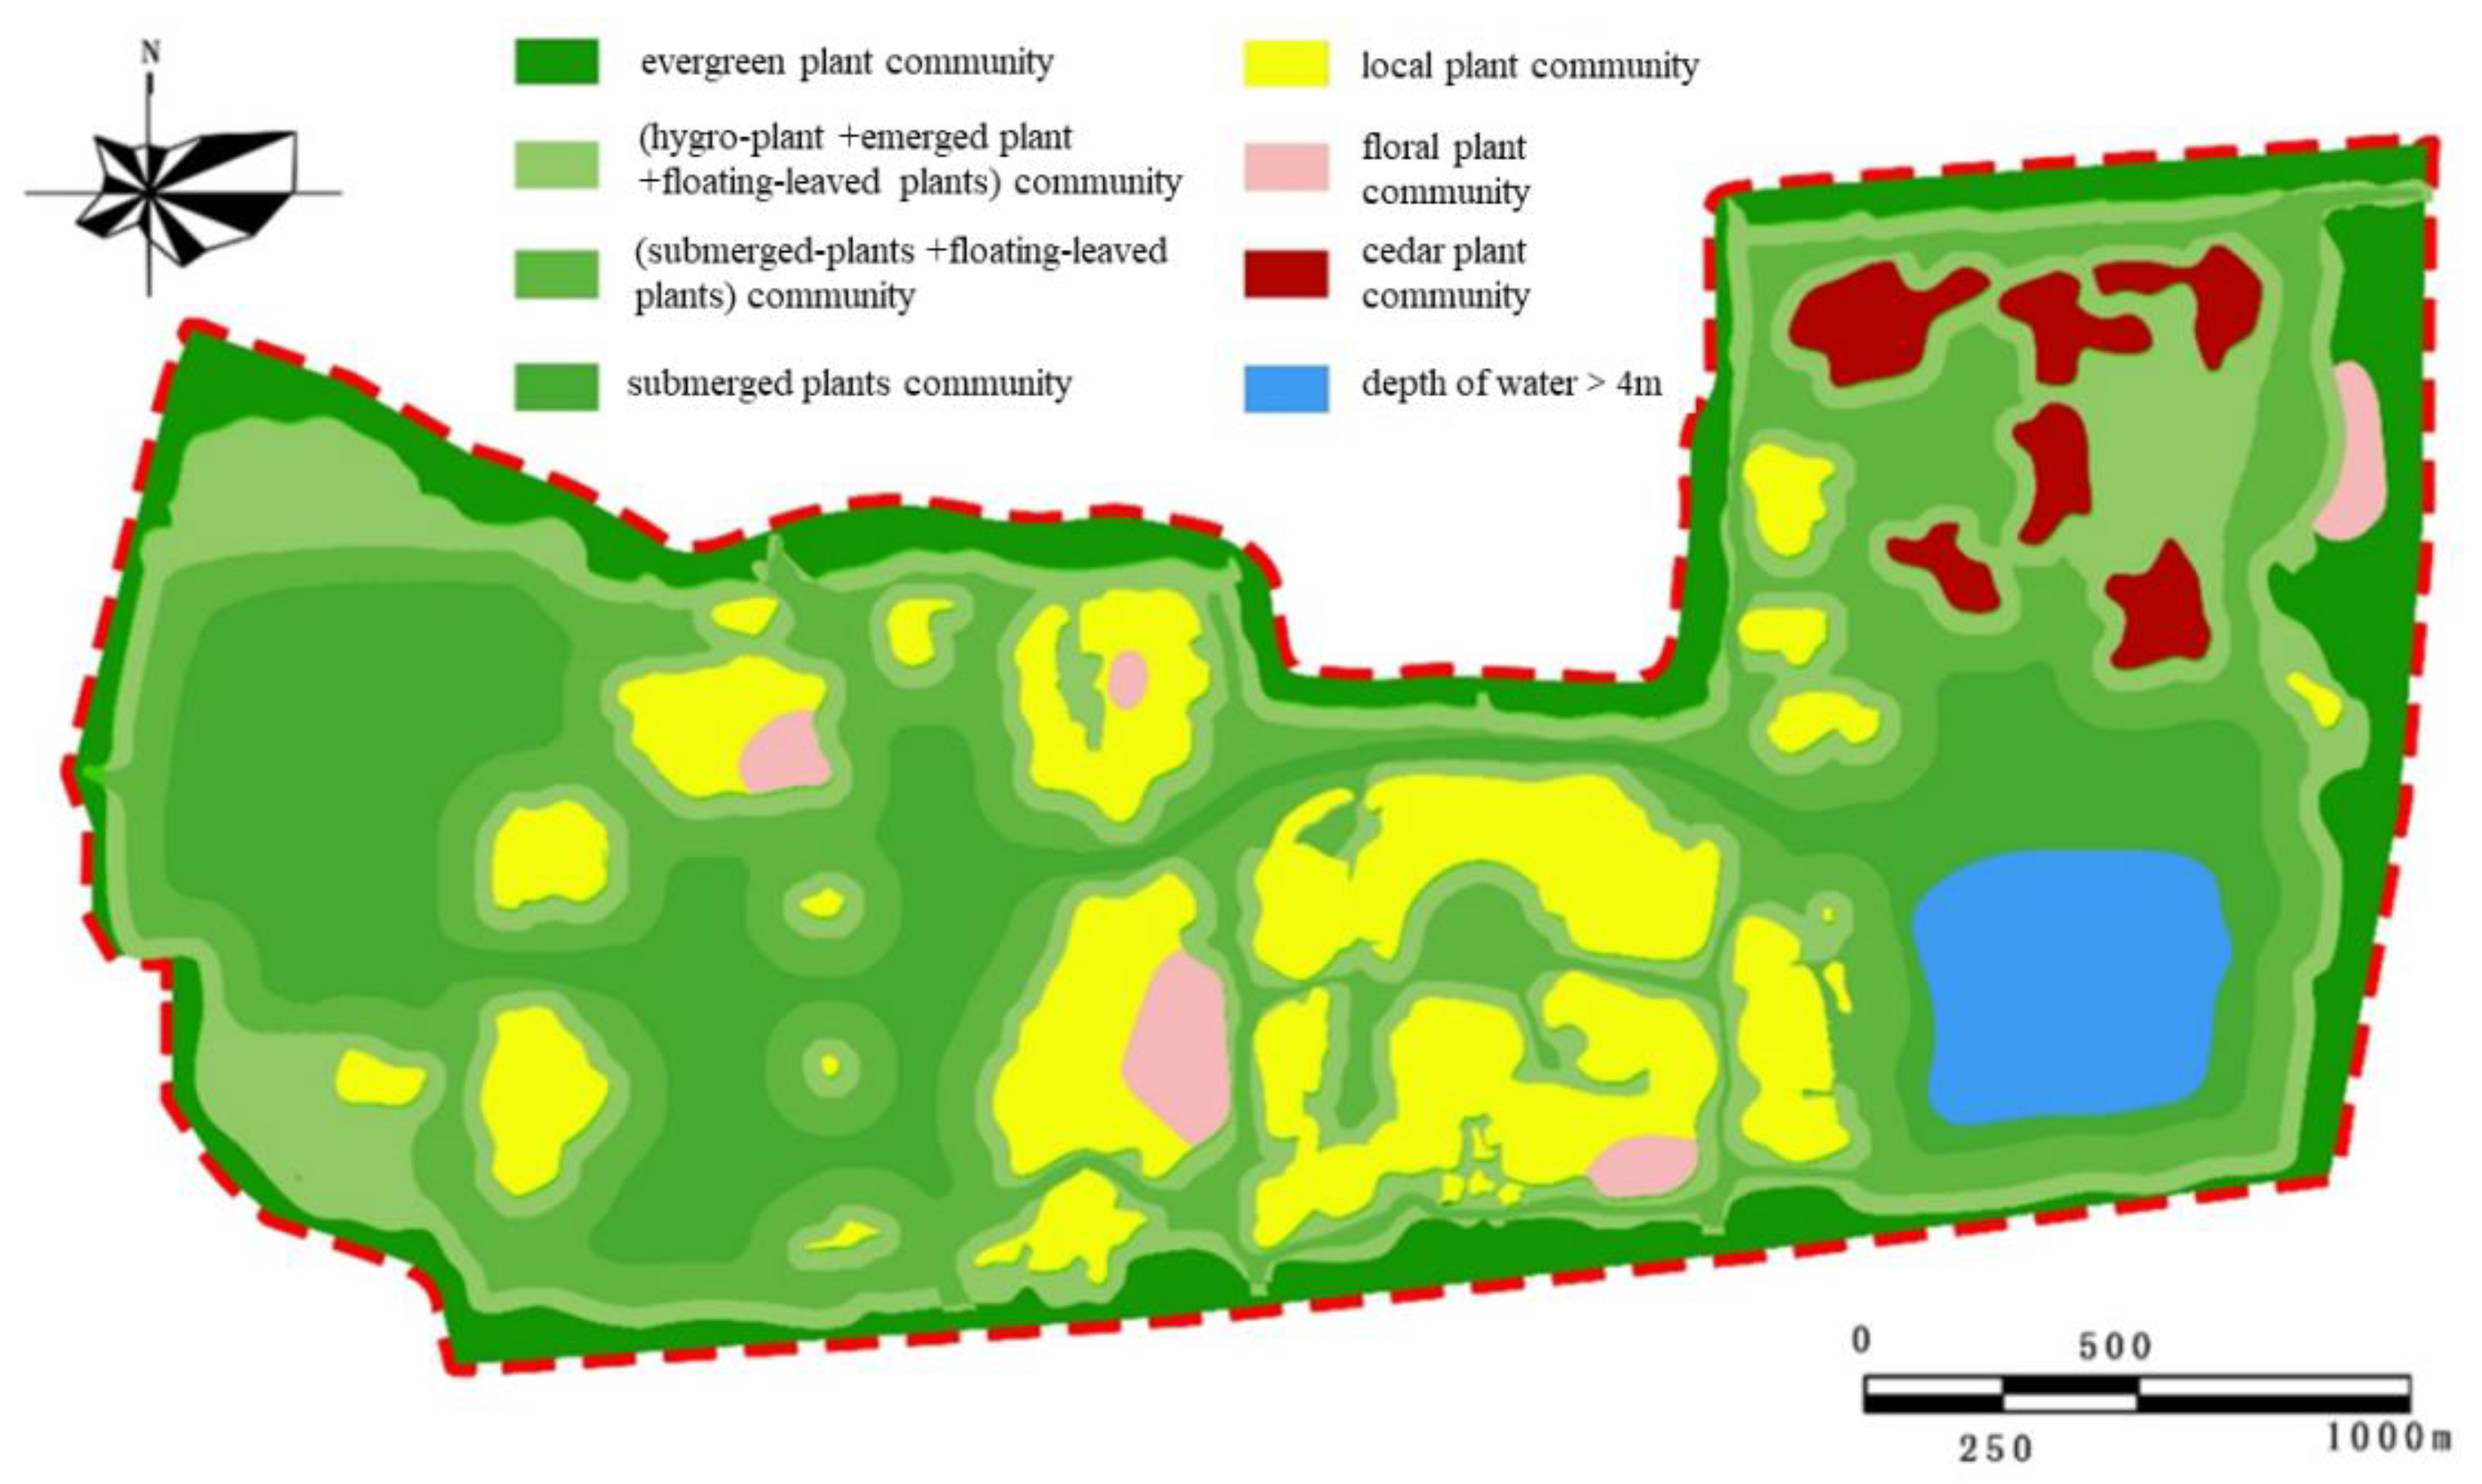
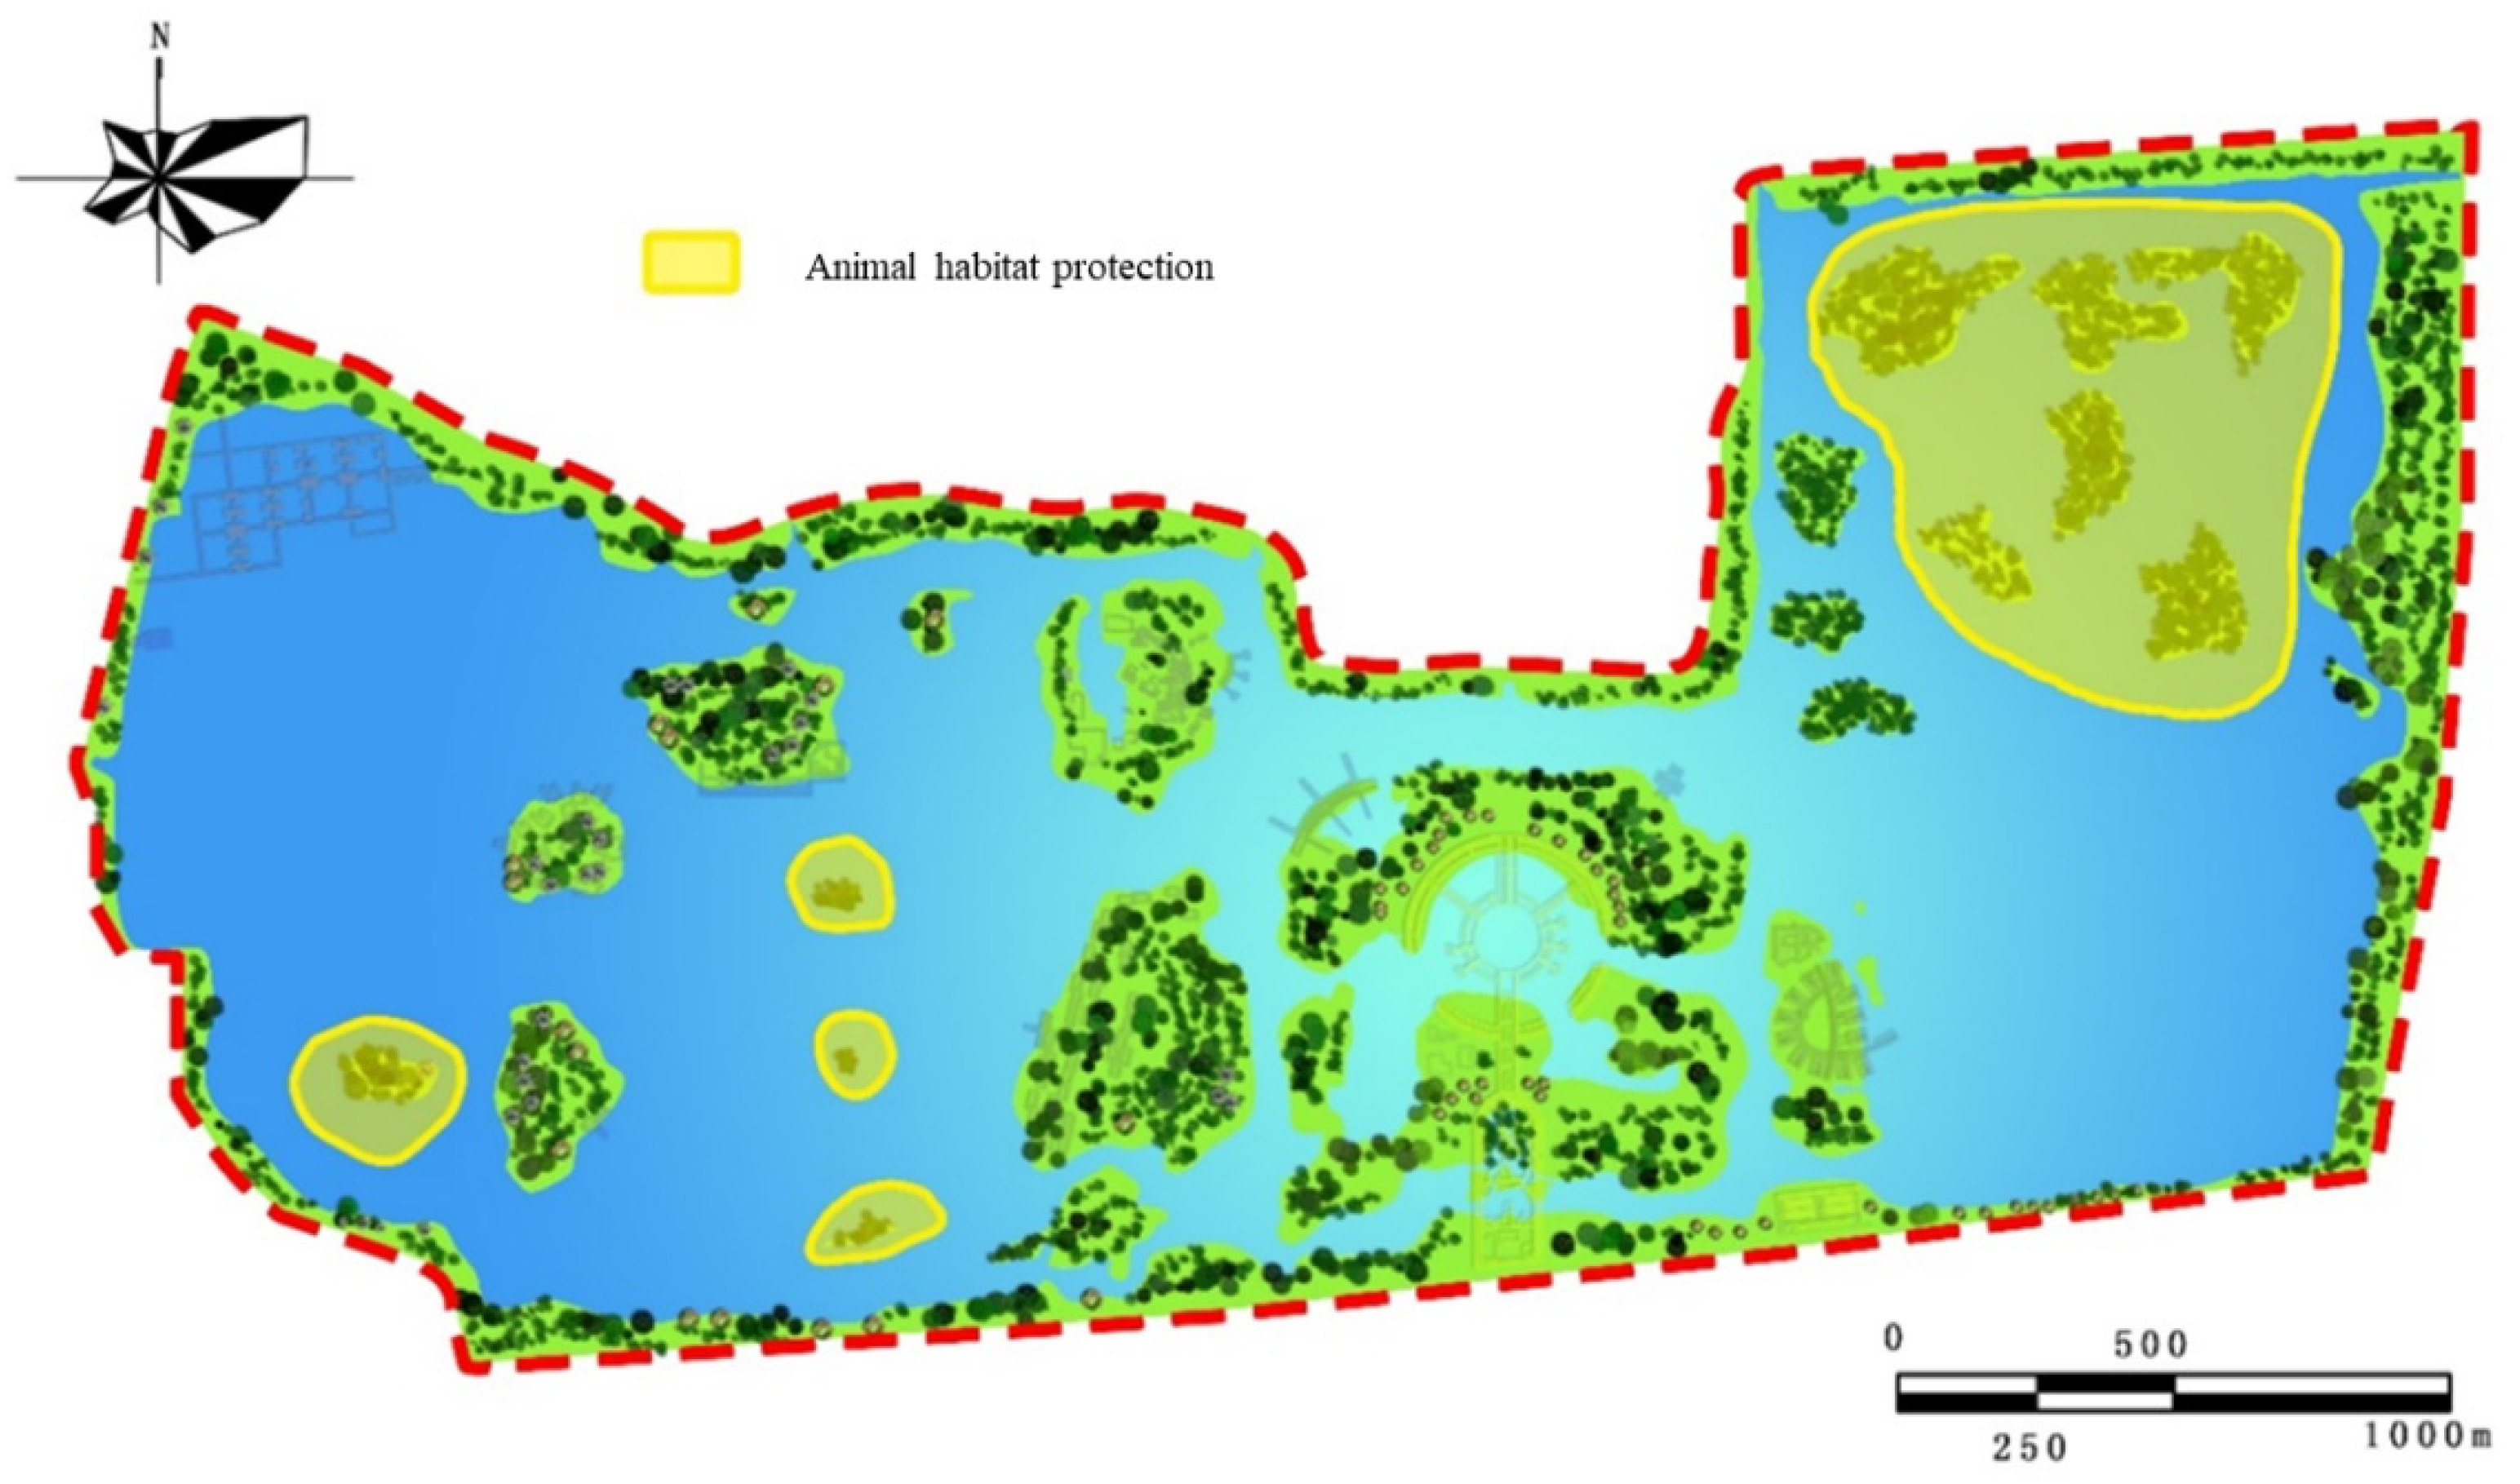
2.2.3. Characteristics and Distribution of Plant and Animal Communities
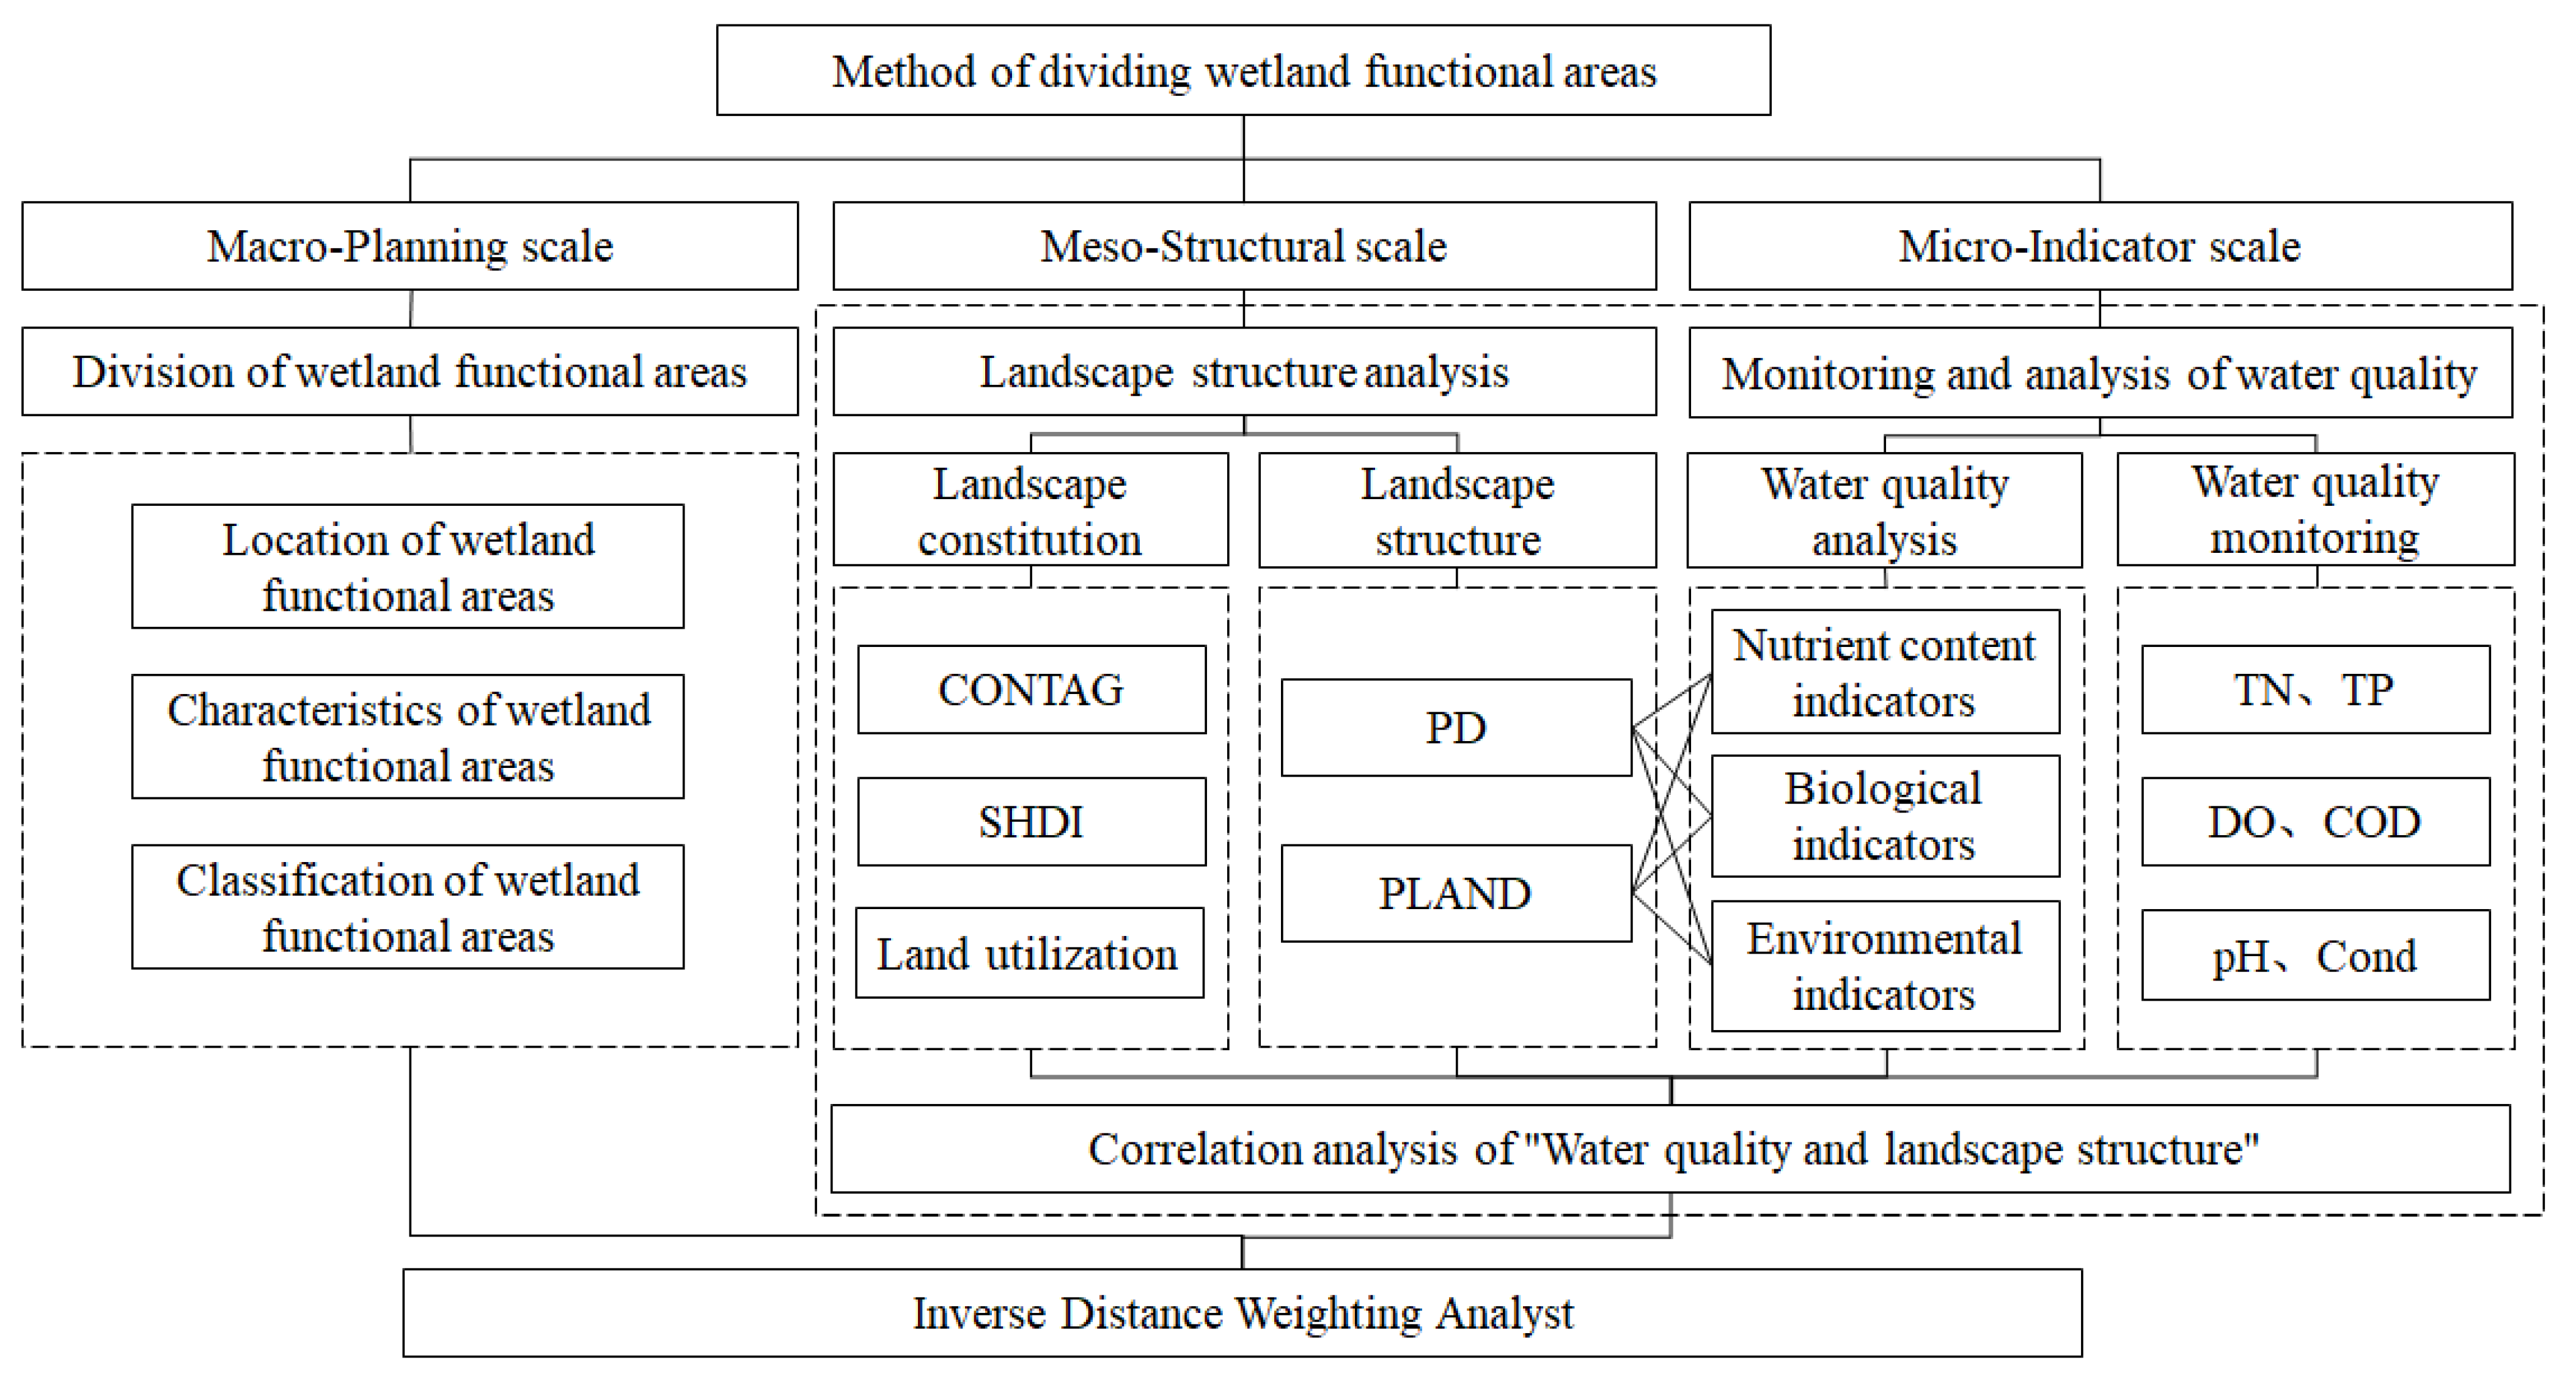
2.3. Research Methods
2.3.1. Stage 1: Determine the Land Use Composition of Each Functional Area and the Location of Monitoring Points
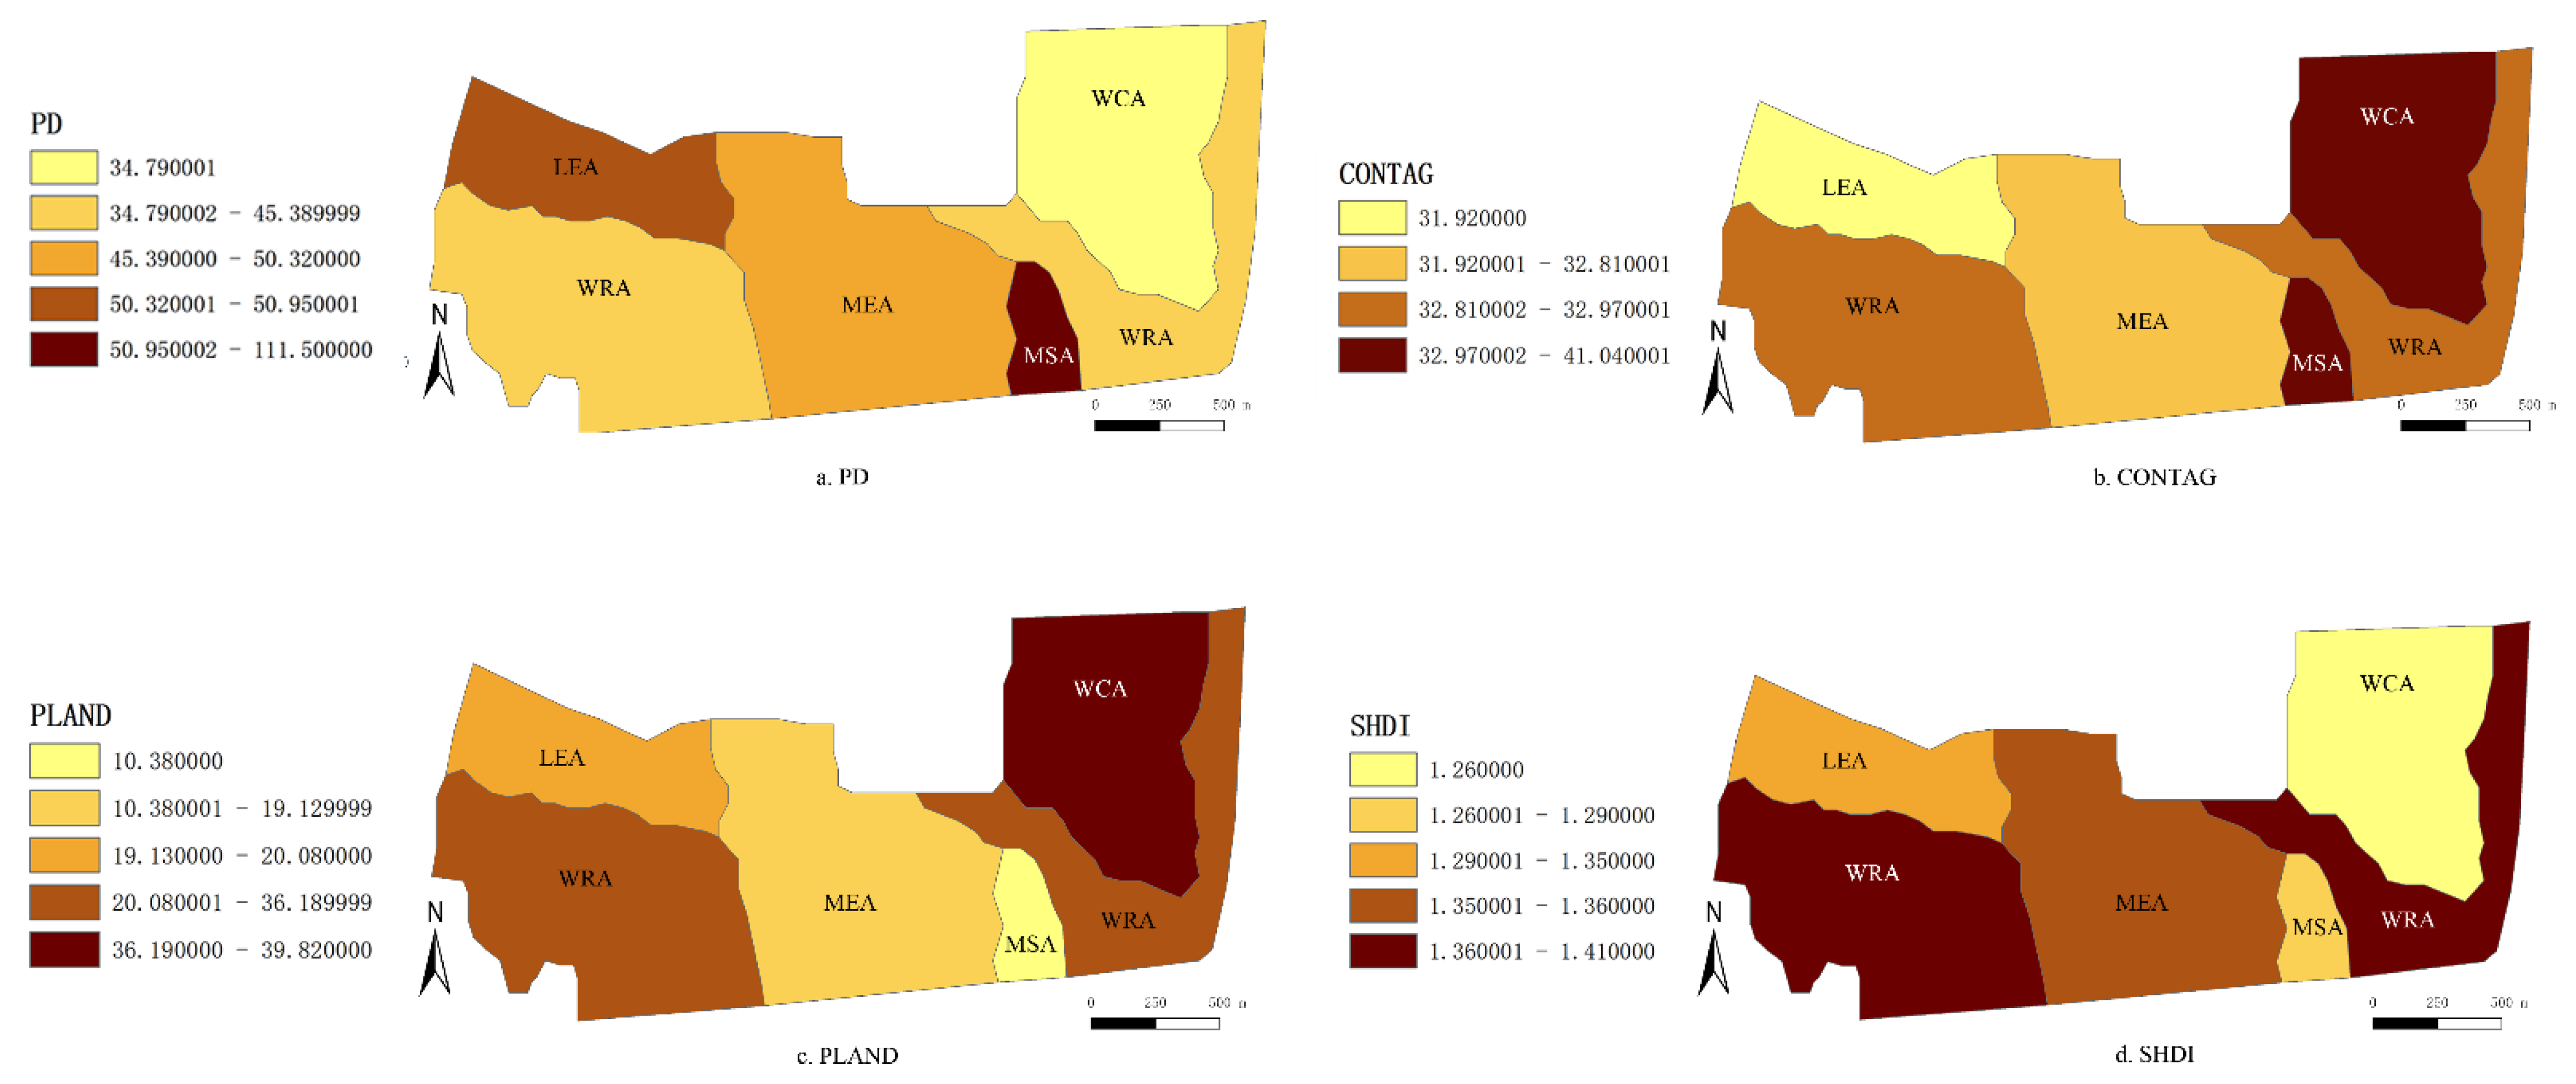
2.3.2. Stage 2: Quantitative Research on Landscape Structure of Functional Areas
- Patches Density (PD)
- 2.
- Contagion (CONTAG)
- 3.
- Percentage of Landscape (PLAND)
- 4.
- Shannon’s Diversity Index (SHDI)
2.3.3. Stage 3: Water Quality Sampling and Water Quality Assessment at Monitoring Points
- Water quality sampling.
- 2.
- Nemerov index method was used for water quality assessment.
2.3.4. Stage 4: Correlation Analysis between Landscape Structure and Water Quality in Functional Area
- Pearson’s Correlation Analysis
- 2.
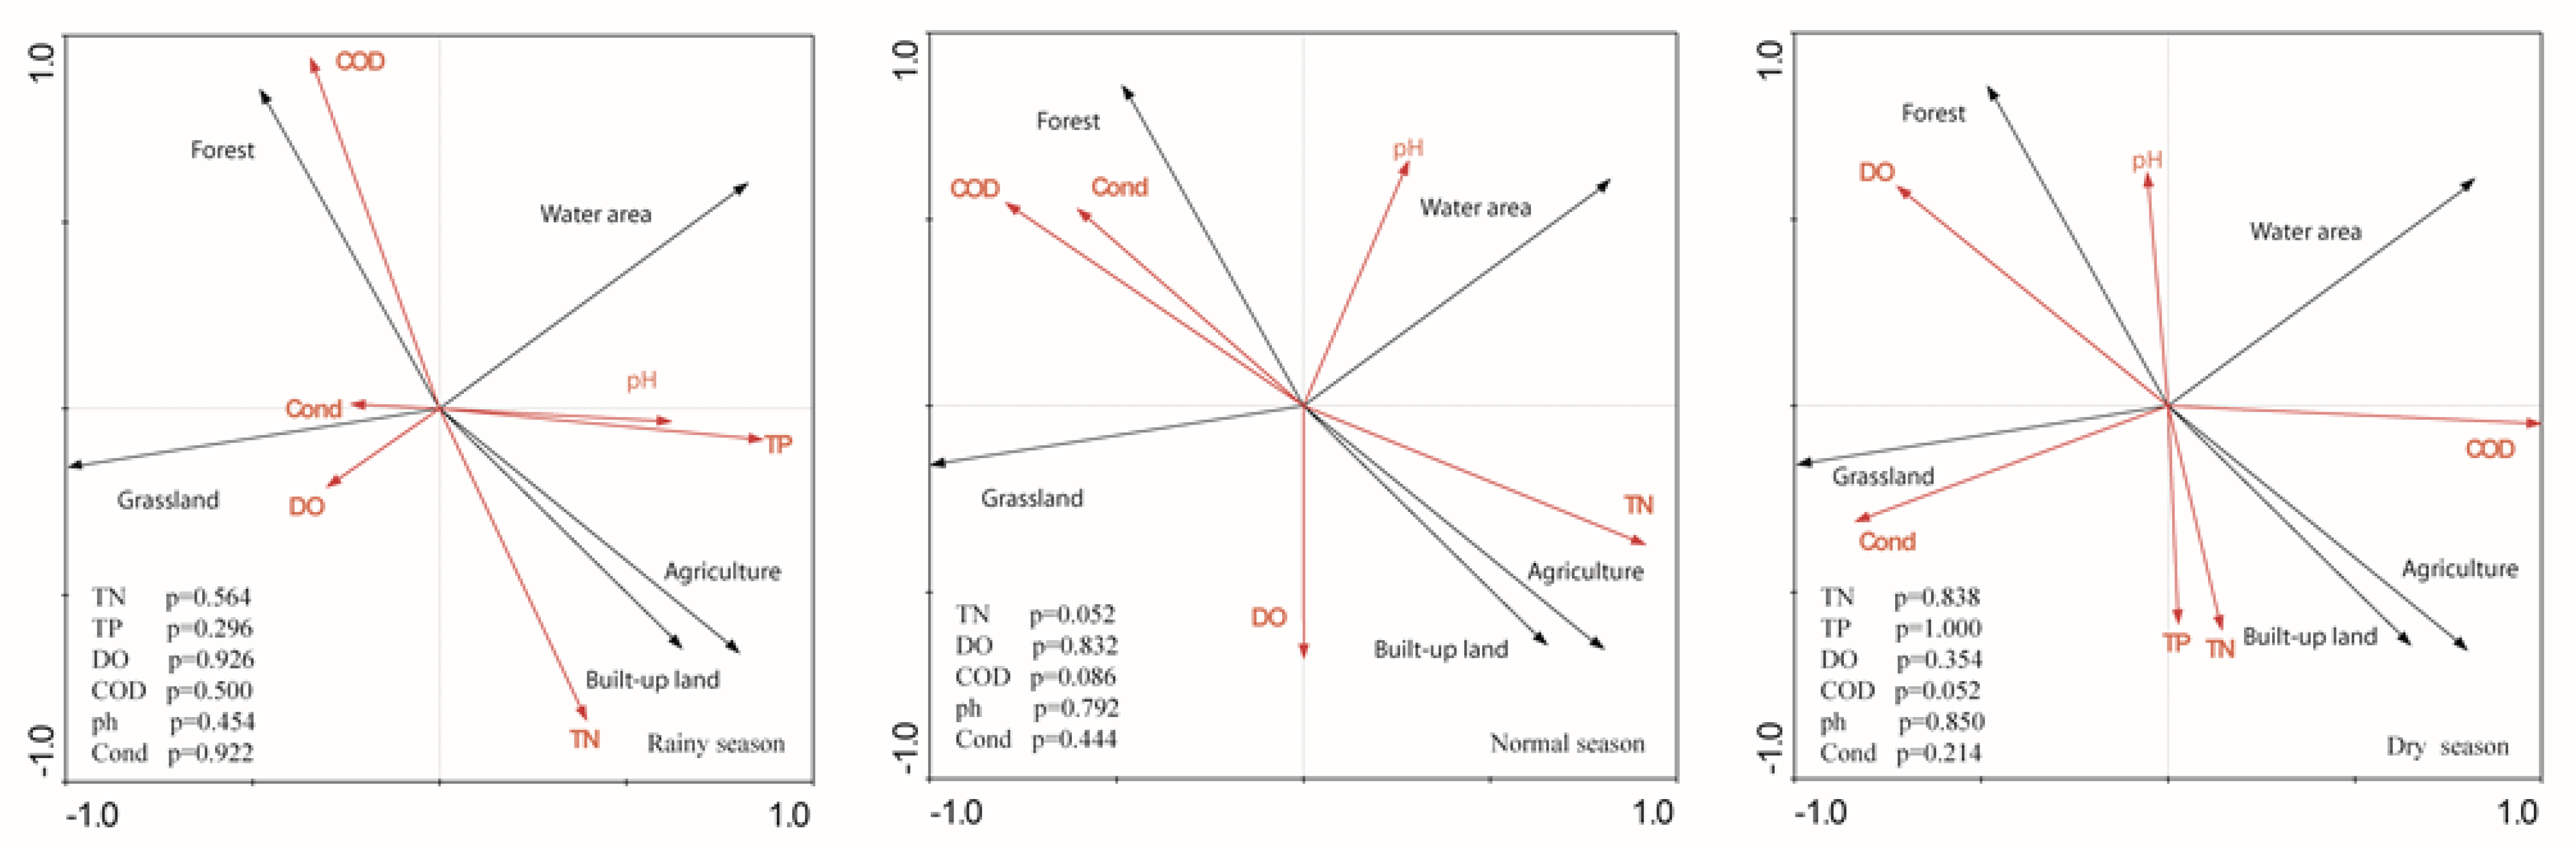
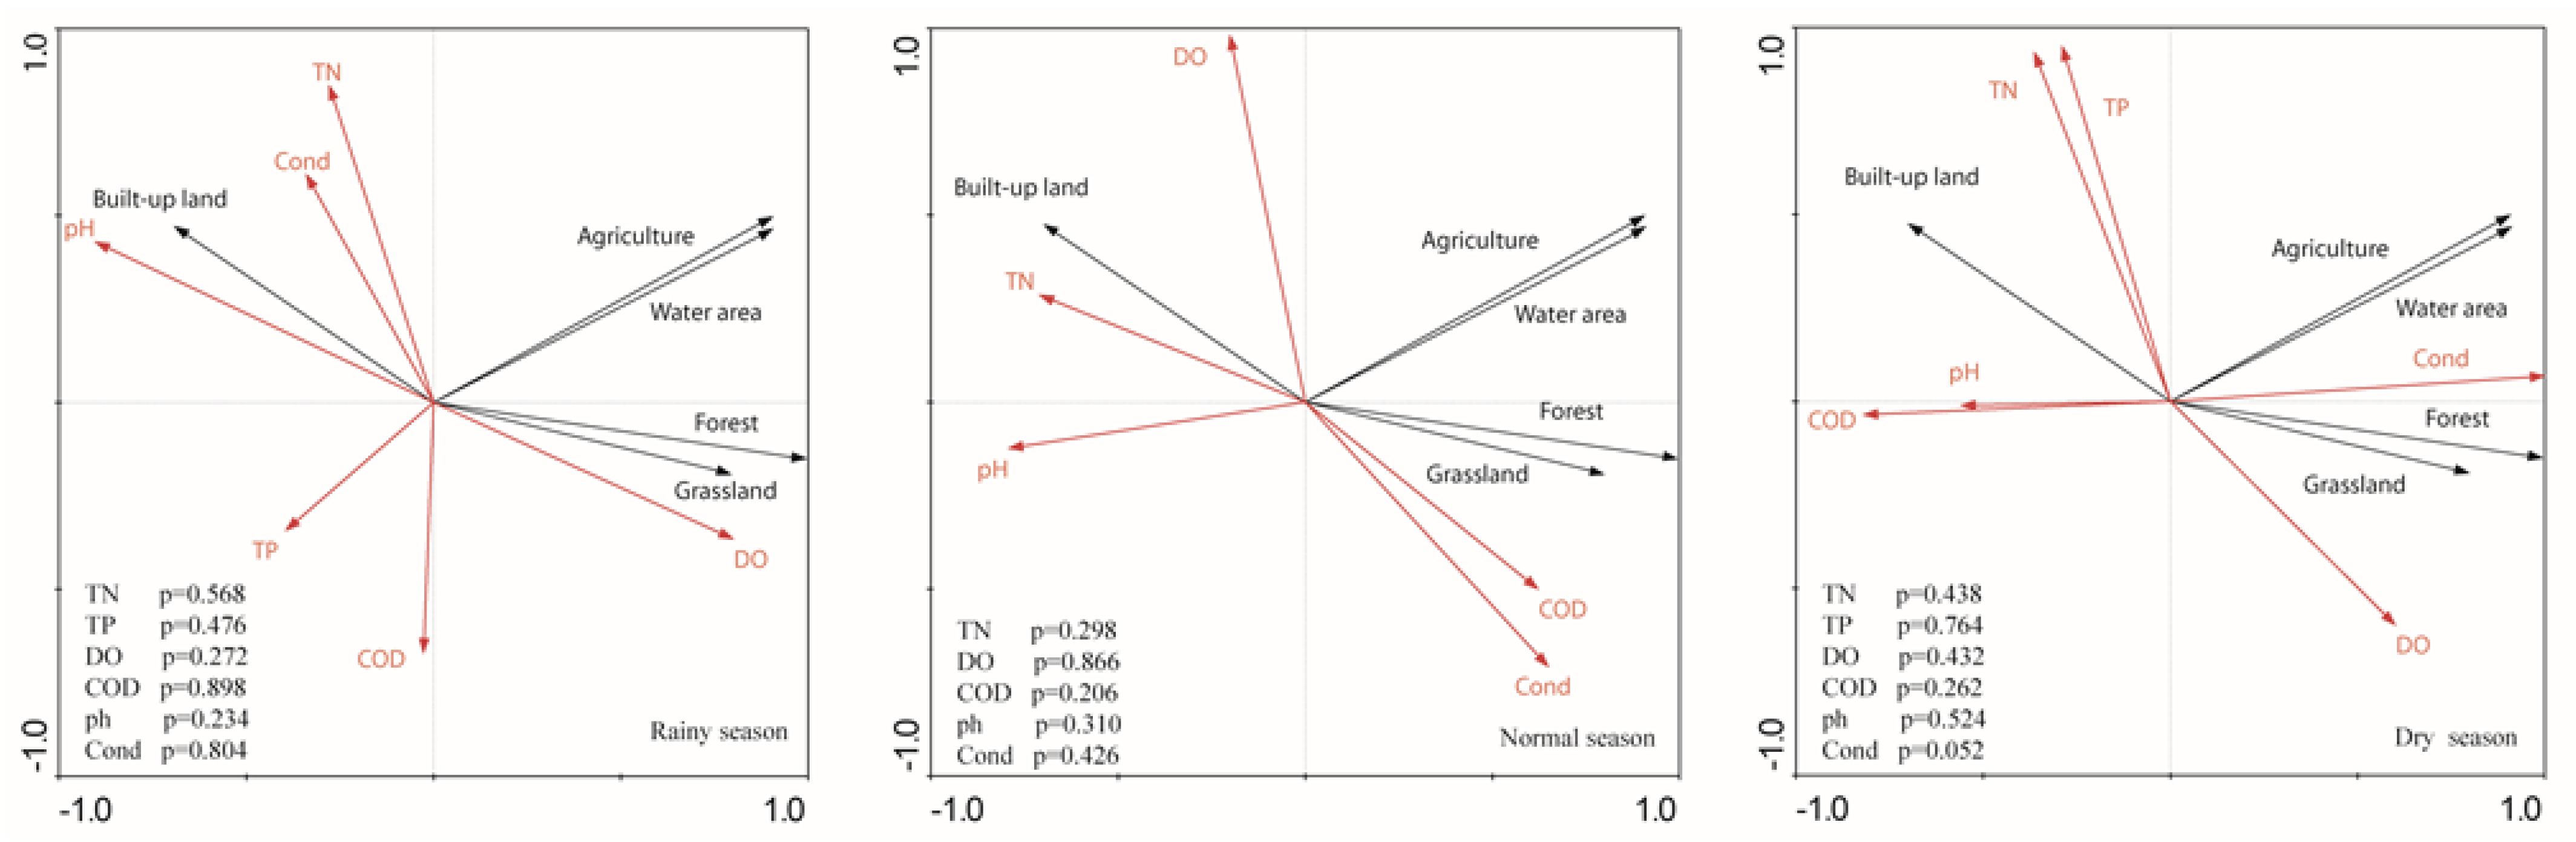
- Redundancy Analysis (RDA)
2.3.5. Stage 5: Analysis of Spatial Distribution Characteristics of Water Quality
3. Results
3.1. Landscape Structure Analysis of Pan’an Lake Wetland Functional Area
3.2. Assessment and Analysis of Water Quality in the Study Area
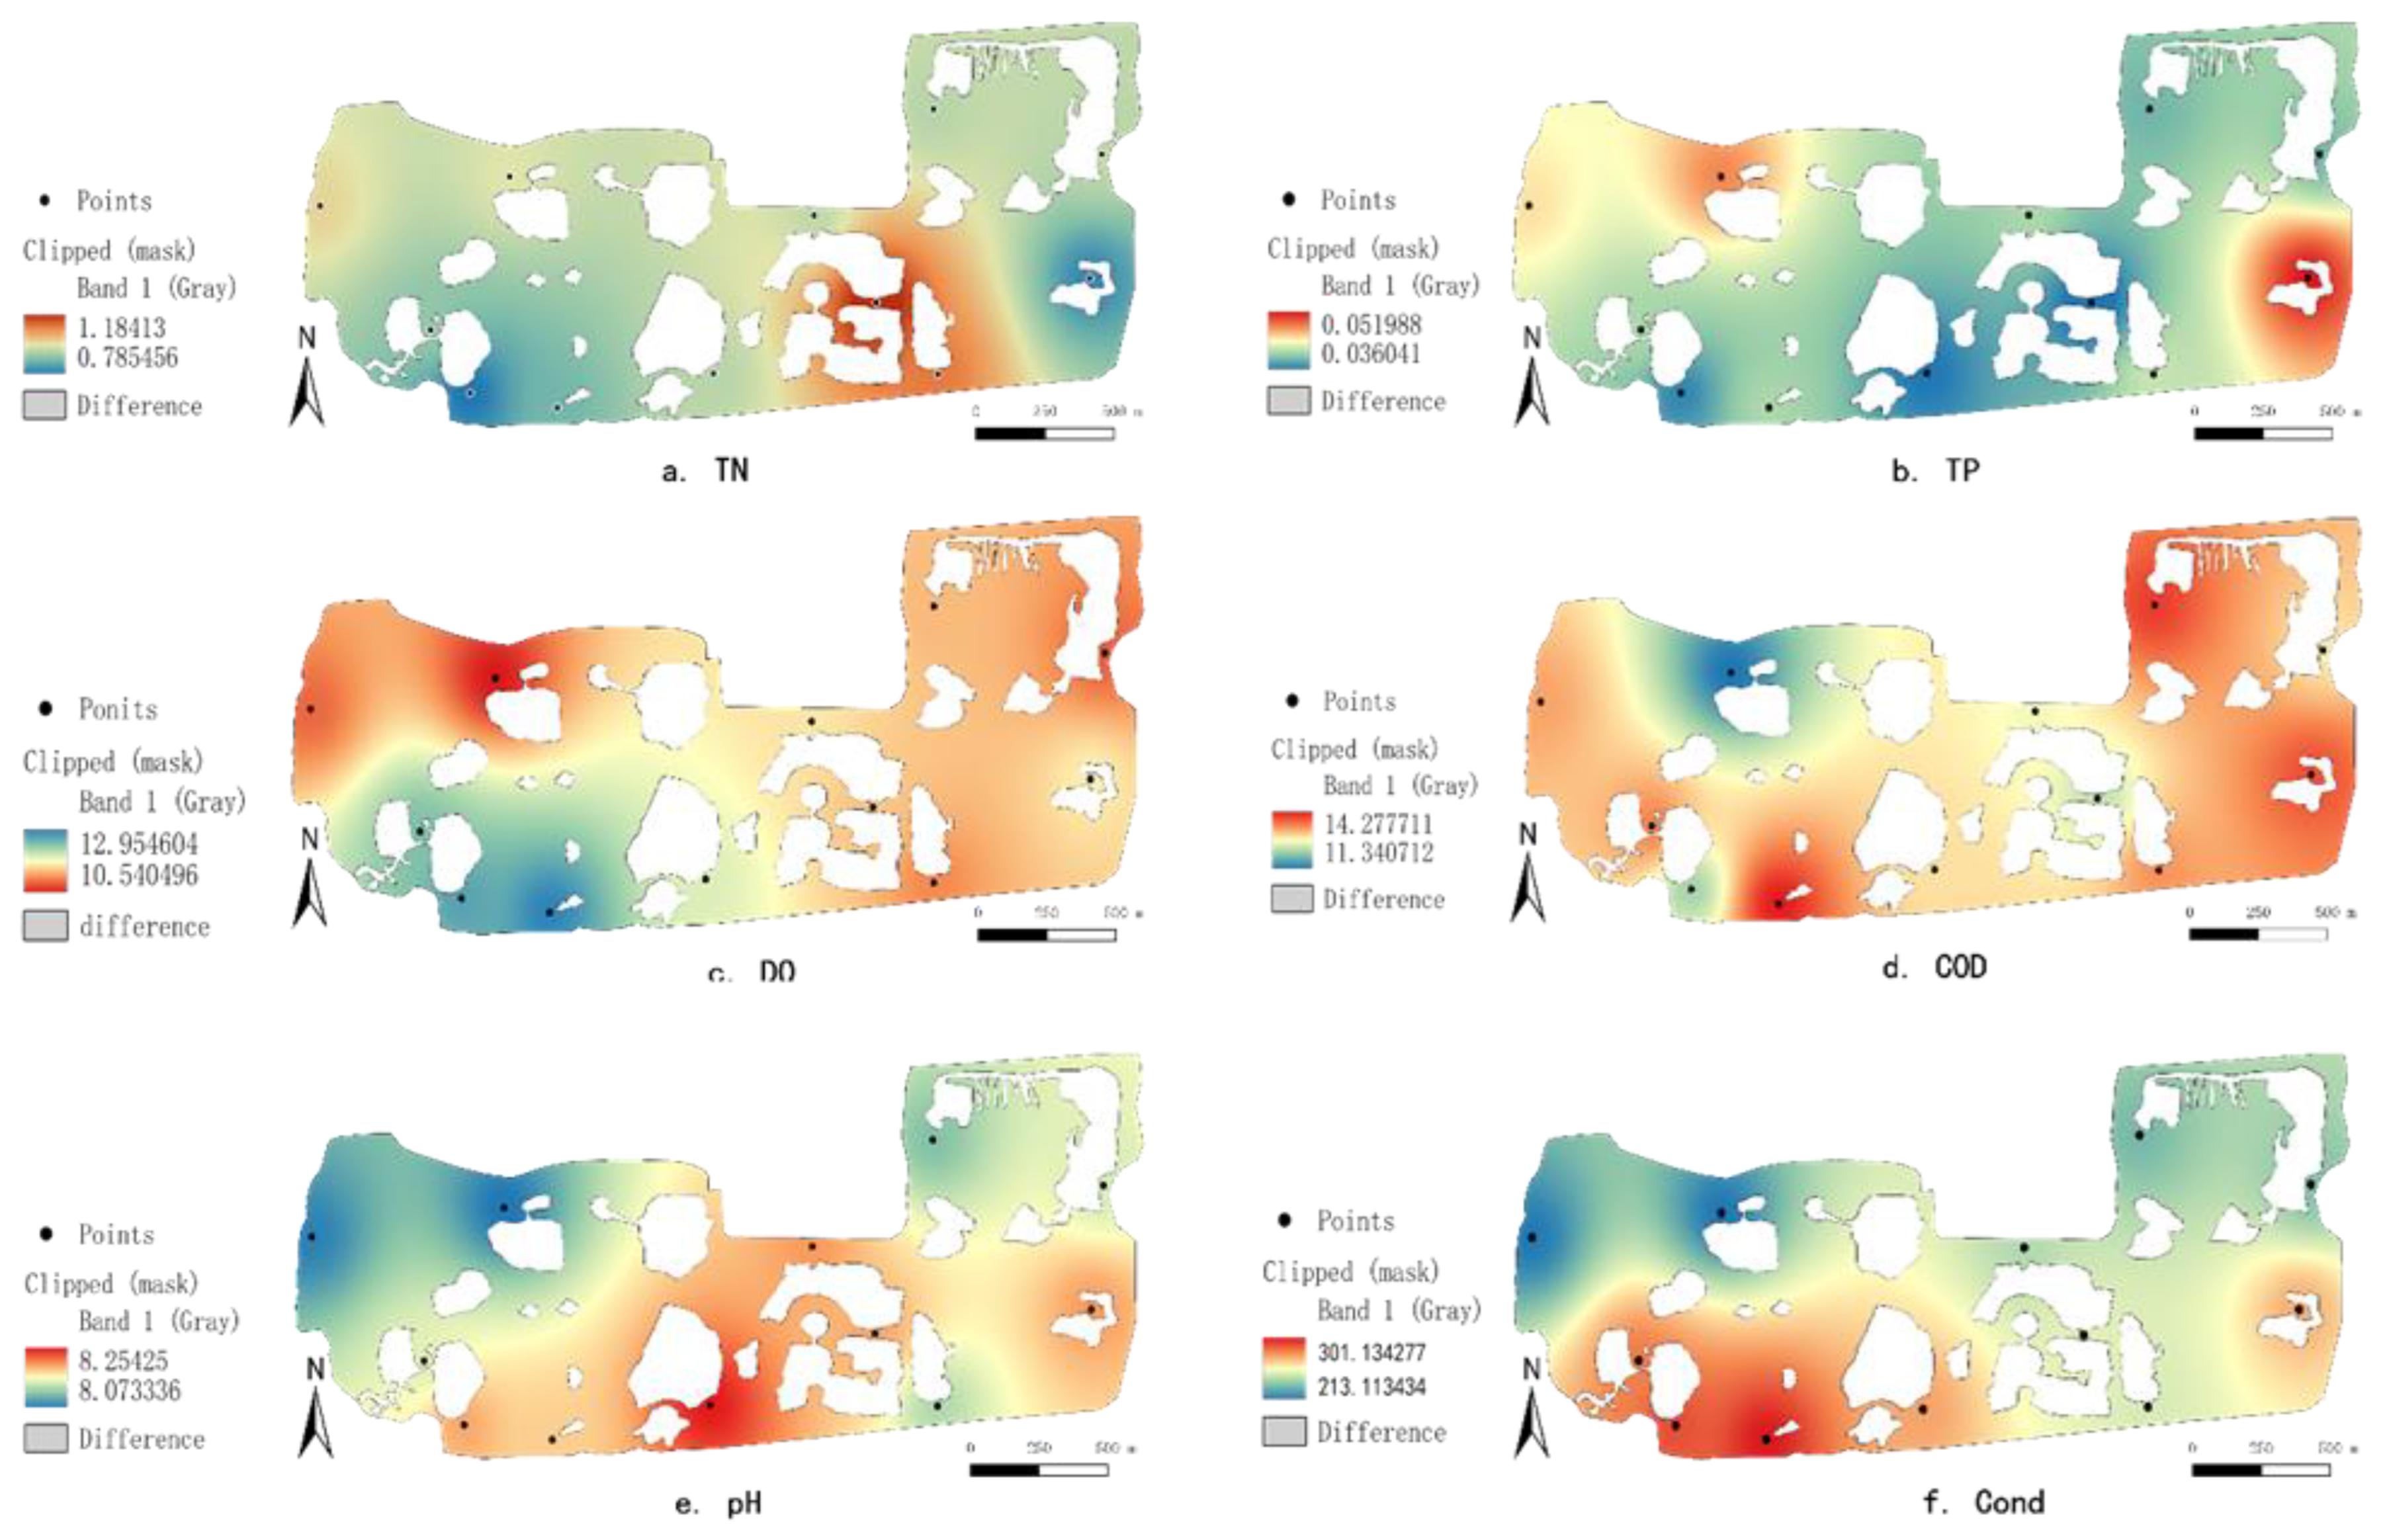
3.2.1. Evaluation of Nutrient Indexes (TN and TP)
3.2.2. Evaluation of Biological Indicators (DO and COD)
3.2.3. Evaluation of Environmental Indicators (pH and Cond)
3.3. Correlation Analysis between Landscape Structure and Water Quality
3.4. Spatial Distribution Characteristics of Water Quality in Pan’an Lake Wetland
4. Discussion
4.1. Analysis of Research Conclusions
4.2. Implications and Limitations of Research Methods
4.3. The Guiding Significance of Research Results for Decision-Makers
5. Conclusions
- (1)
- The comprehensive water quality of each functional area of Pan’an Lake wetland was WCA > WRA > LEA > MEA > MSQ from good to bad. The nutritional indexes from good to bad were WRA > WCA > MEA > MSQ, LEA. The biological indexes from good to bad were WRA > MEA > WCA > LEA, FEQ. The order of environmental indicators from good to bad is WCA > LEA > MSQ > WRA > MEA. The effect of landscape type on water quality purification from good to bad was woodland > grassland > water area > cultivated land > construction land;
- (2)
- The order of landscape fragmentation of Pan’an Lake wetland from high to low was MSQ > LEA > MEA > WRA > WCA. The order of landscape agglomeration from high to low was WCA > WRA > MEA > LEA > MSQ. Landscape dominance from high to low was WCA > WRA > LEA > MEA, MSQ. The order of landscape diversity from high to low was WRA > MEA > MSQ > WCA > LEA. Landscape diversity and aggregation should be strengthened;
- (3)
- The larger the proportion of water area in dry season, the better the ecological effect of Cond index is, and the higher the proportion of forest area in wet season, the more significant the optimization effect of TN index is, but it will aggravate the consumption of COD. The proportion of built-up land and cultivated land area had a high impact on water quality indicators in each water period, indicating that the higher the proportion of artificial patch area, the more detrimental to water quality self-purification and optimization. Especially, the increase in cultivated land patch density would increase the risk of TN and TP losing to surrounding water bodies;
- (4)
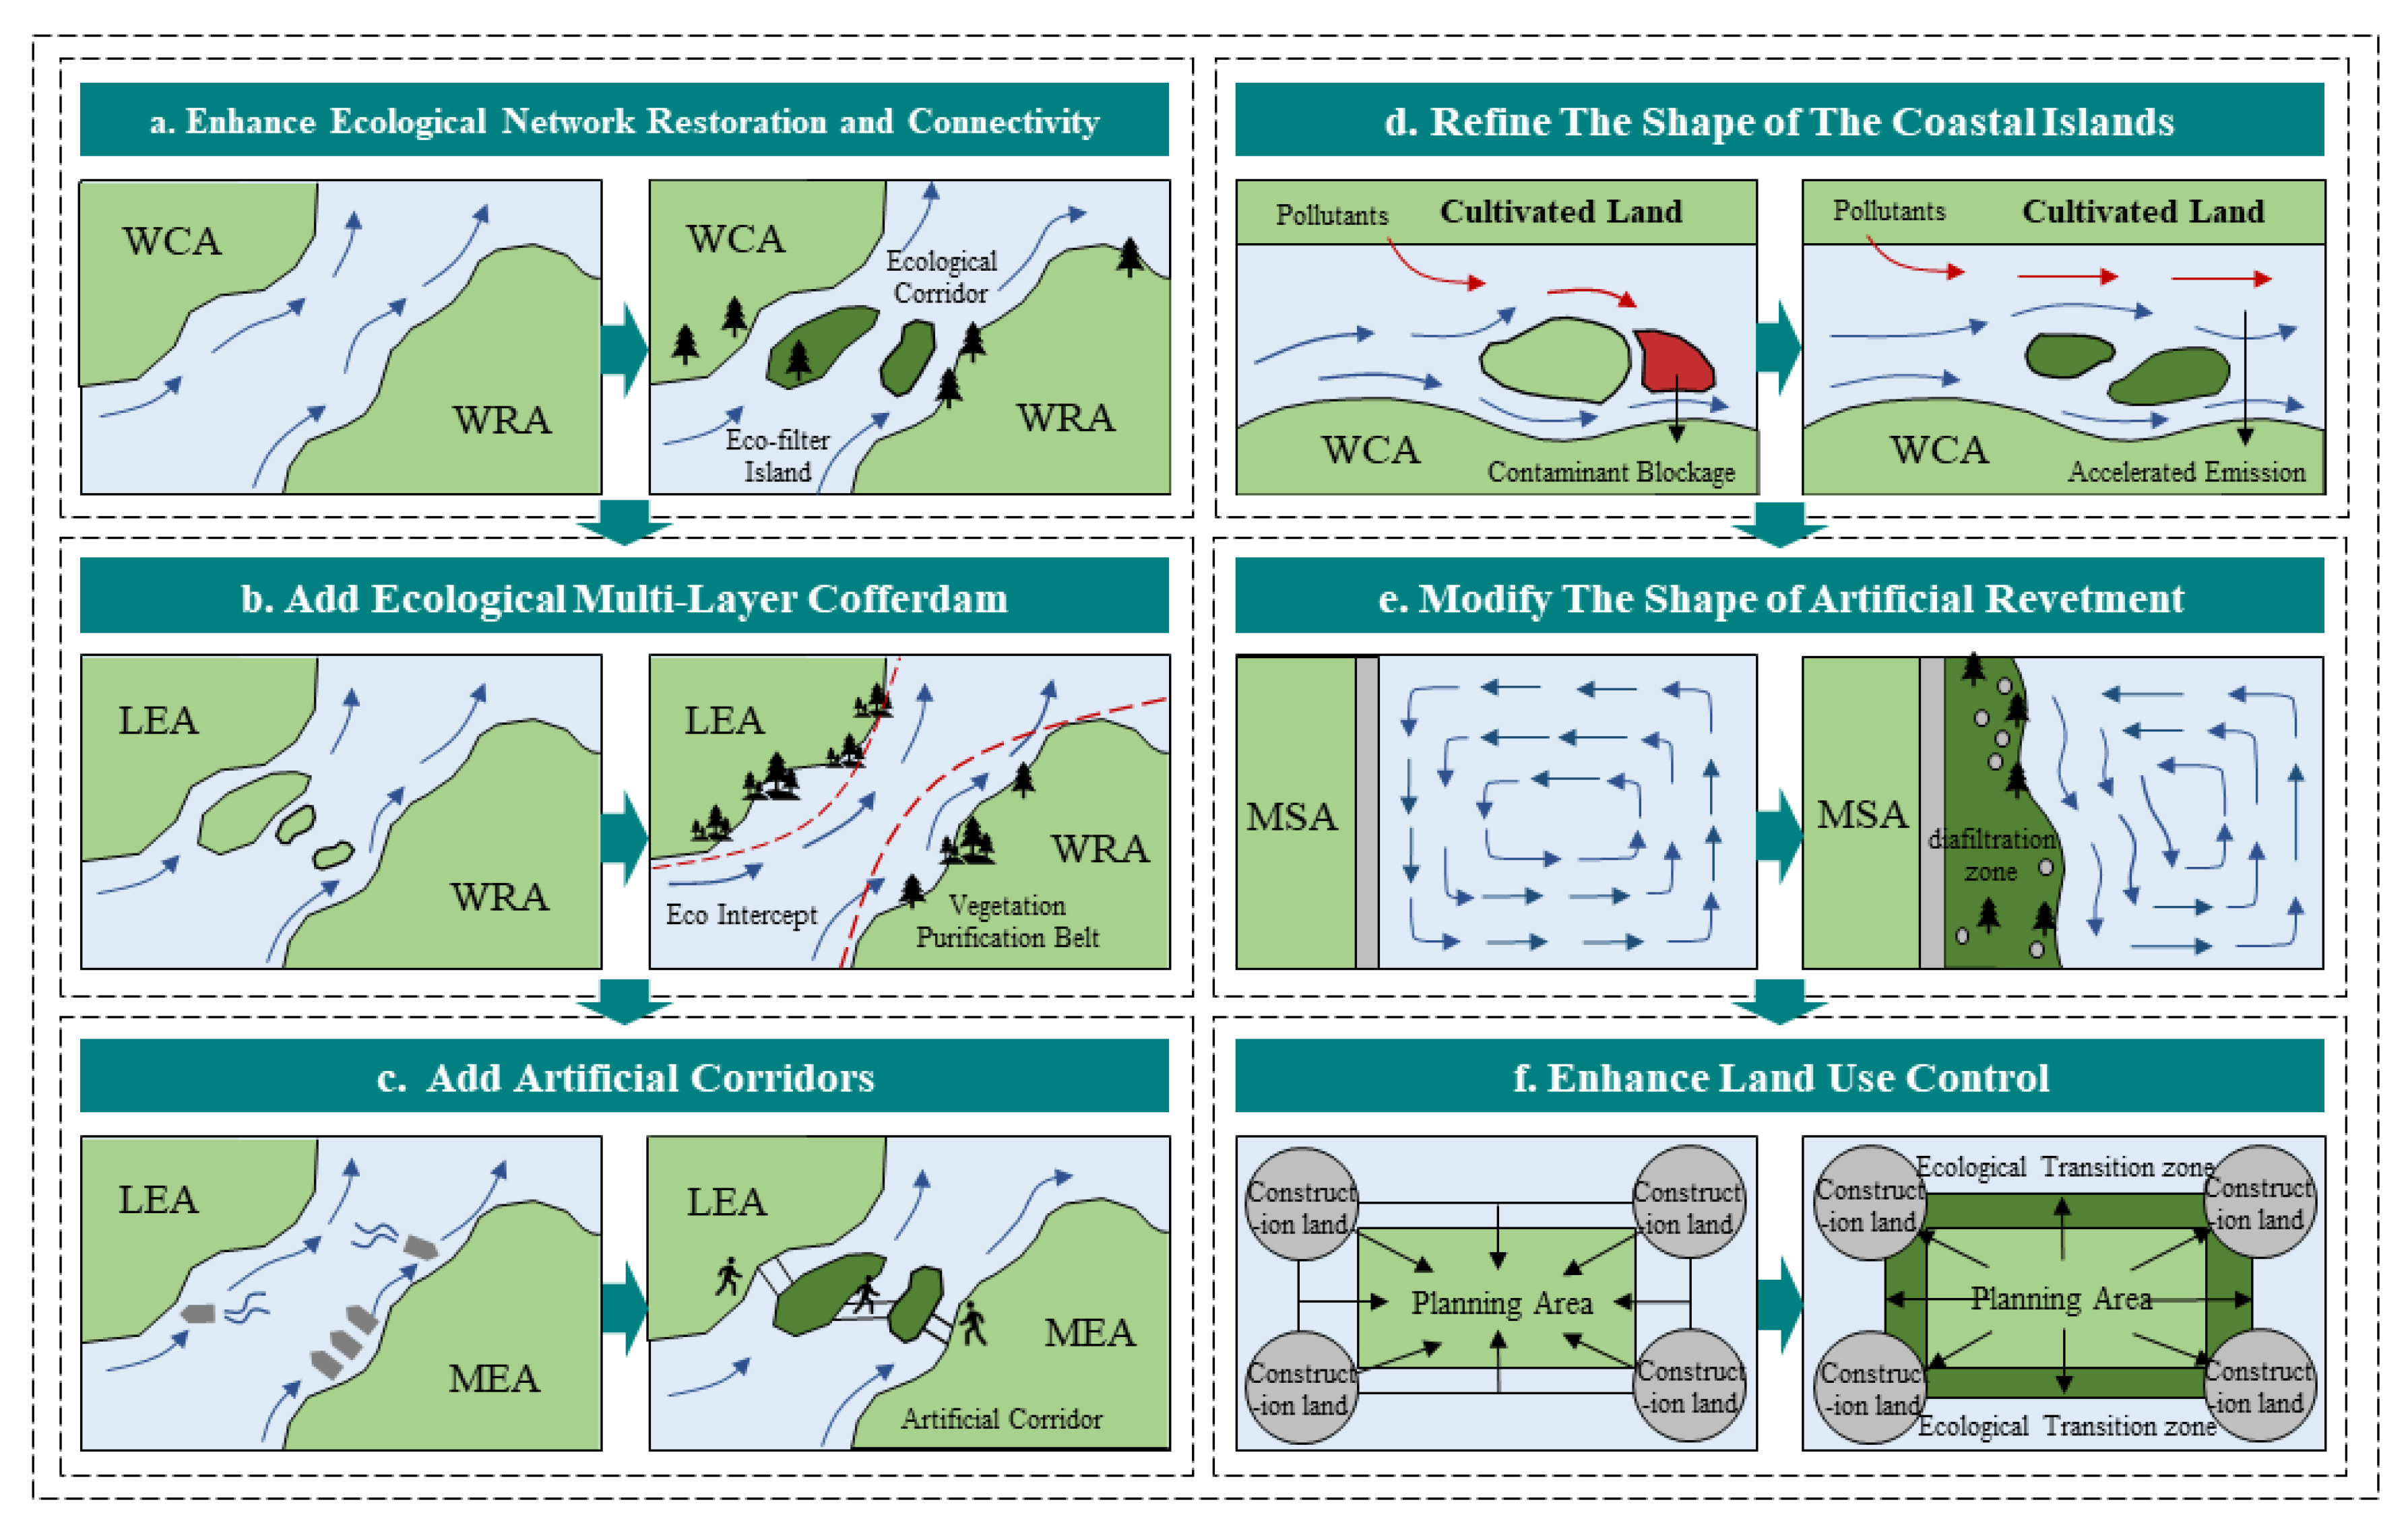
- The water quality of MSA was the worst among all functional areas, and its influence after ecological restoration should be paid more attention. WCA water environment quality fluctuated greatly under the influence of seasons, which was consistent with the seasonal natural succession of aquatic vegetation. The relationship between different adjacent functional areas should be strengthened or interference should be avoided. For example, ecological corridors should be built between WCA and WRA, artificial corridors should be built between MEA and LEA, and ecological interceptions should be set between MEA and WRA. Interference from internal and external sources is still faced in the wetland planning area. Interference sources should be identified, and buffer zones and vegetation purification belts should be set in WCA and WRA;
- (5)
- Construct a WLF research model and combine functional area optimization research with landscape structure and water quality indicators. The model takes the wetland landscape pattern as a link to provide a quantitative research method for the optimization of functional areas under water environmental quality.
Author Contributions
Funding
Institutional Review Board Statement
Informed Consent Statement
Data Availability Statement
Conflicts of Interest
Appendix A

| Index | a. WRA | b. MEA | c. MSA | d. WCA | e. LEA |
|---|---|---|---|---|---|
| TN mg/L | 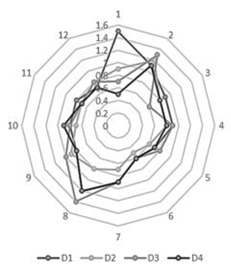 | 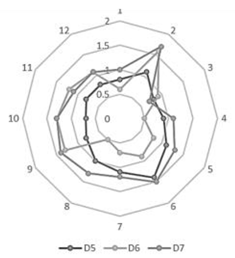 |  | 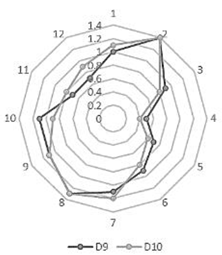 |  |
| TP mg/L | 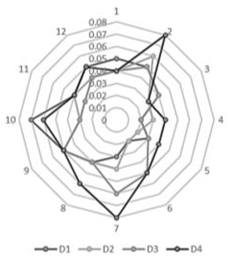 |  |  |  |  |
| DO mg/L |  |  |  |  | 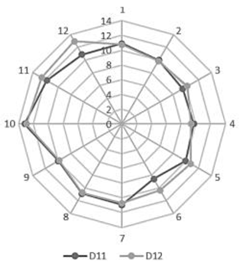 |
| COD mg/L | 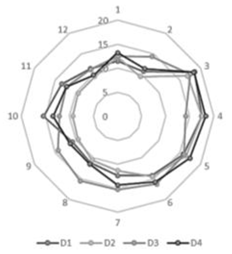 | 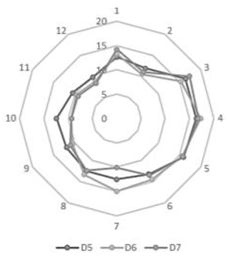 | 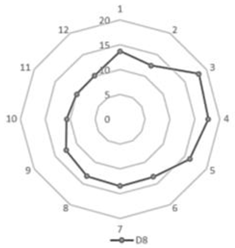 |  |  |
| pH |  |  |  |  |  |
| Cond μs/cm |  | 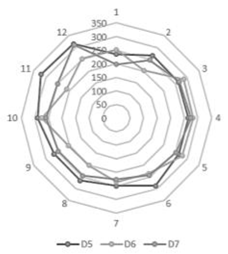 | 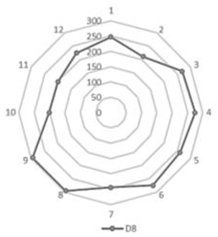 |  | 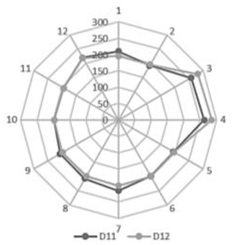 |
References
- Erwin, K.L. Wetlands and global climate change: The role of wetland restoration in a changing world. Wetl. Ecol. Manag. 2009, 17, 71–84. [Google Scholar] [CrossRef]
- Khaznadar, M.; Vogiatzakis, I.N.; Griffiths, G.H. Land degradation and vegetation distribution in Chott El Beida wetland, Algeria. J. Arid Environ. 2009, 73, 369–377. [Google Scholar] [CrossRef]
- Wang, M.; Qi, S.; Zhang, X. Wetland loss and degradation in the Yellow River Delta, Shandong Province of China. Environ. Earth Sci. 2012, 67, 185–188. [Google Scholar] [CrossRef]
- Gao, J.T.; Wang, X.Y.; Li, W.P.; Yu, L.H.; Yang, W.H.; Yin, Z.Y. Water quality assessment and analysis for rehabilitate and management of wetlands: A case study in Nanhai wetland of Baotou, China. MATEC Web Conf. 2016, 60, 2004. [Google Scholar] [CrossRef] [Green Version]
- Sun, C.; Chen, W. Fuzzy comprehensive model based on combination weighting in watershed application of ecological health assessment. IOP Conf. Ser. Earth Environ. Sci. 2019, 227, 052009. [Google Scholar] [CrossRef]
- Xu, Z. Single factor water quality identification index for environmental quality assessment of surface water. J. Tongji Univ. 2005, 33, 321–325. (In Chinese) [Google Scholar]
- Wu, T.; Wang, S.; Su, B.; Wu, H.; Wang, G. Understanding the water quality change of the Yilong Lake based on comprehensive assessment methods. Ecol. Indic. 2021, 126, 107714. [Google Scholar] [CrossRef]
- Li, Y.; Jia, X.M.; Xing, P.F.; Li, H. Evaluation of Water Environmental Quality in Feng Zi Jian Mining Area Based on Analytic Hierarchy Process; Li, H., Xu, Q., Ge, H., Eds.; Advanced Materials Research; Trans Tech Publications, Ltd.: Strafa-Zurich, Switzerland, 2013; Volume 864–867, pp. 2350–2356. [Google Scholar] [CrossRef]
- Essien, J.P.; Ikpe, D.I.; Inam, E.D.; Okon, A.O.; Ebong, G.A.; Benson, N.U. Occurrence and spatial distribution of heavy metals in landfill leachates and impacted freshwater ecosystem: An environmental and human health threat. PLoS ONE 2022, 17, e0263279. [Google Scholar] [CrossRef]
- Lu, J.; Cai, H.; Fu, Y.; Zhang, X.; Zhang, W. A study on the impacts of landscape structures on water quality under different spatial scales in the Xiangjiang River Basin. Water Air Soil Pollut. 2022, 233, 164. [Google Scholar] [CrossRef]
- Festus, O.O.; Ji, W.; Zubair, O.A. Characterizing the Landscape Structure of Urban Wetlands Using Terrain and Landscape Indices. Land 2020, 9, 29. [Google Scholar] [CrossRef]
- Lu, J.; Cai, H.; Zhang, X.; Fu, Y. Water quality in relation to land use in the Junshan Lake watershed and water quality predictions. Water Supply 2021, 21, 3602–3613. [Google Scholar] [CrossRef]
- Mirhosseini, M.; Farshchi, P.; Noroozi, A.A.; Shariat, M.; Aalesheikh, A.A. Changing Land Use a Threat to Surface Water Quality: A Vulnerability Assessment Approach in Zanjanroud Watershed, Central Iran. Water Resour. 2018, 45, 268–279. [Google Scholar] [CrossRef]
- Xu, Q.; Wang, P.; Shu, W.; Ding, M.; Zhang, H. Influence of landscape structures on river water quality at multiple spatial scales: A case study of the Yuan river watershed, China. Ecol. Indic. 2021, 121, 107226. [Google Scholar] [CrossRef]
- Smart, R.P.; Soulsby, C.; Cresser, M.S.; Wade, A.J.; Townend, J.; Billett, M.F.; Langan, S. Riparian zone influence on stream water chemistry at different spatial scales: A GIS-based modelling approach, an example for the Dee, NE Scotland. Sci. Total Environ. 2001, 280, 173–193. [Google Scholar] [CrossRef]
- Yu, S.; Xu, Z.; Wu, W.; Zuo, D. Effect of land use types on stream water quality under seasonal variation and topographic characteristics in the Wei River basin, China. Ecol. Indic. 2016, 60, 202–212. [Google Scholar] [CrossRef]
- Xu, G.; Ren, X.; Yang, Z.; Long, H.; Xiao, J. Influence of Landscape Structures on Water Quality at Multiple Temporal and Spatial Scales: A Case Study of Wujiang River Watershed in Guizhou. Water 2019, 11, 159. [Google Scholar] [CrossRef] [Green Version]
- Xiao, R.; Wang, G.; Zhang, Q.; Zhang, Z. Multi-scale analysis of relationship between landscape pattern and urban river water quality in different seasons. Sci. Rep. 2016, 6, 25250. [Google Scholar] [CrossRef] [Green Version]
- Shi, P.; Zhang, Y.; Li, Z.; Li, P.; Xu, G. Influence of land use and land cover patterns on seasonal water quality at multi-spatial scales. Catena 2017, 151, 182–190. [Google Scholar] [CrossRef]
- Ai, L.; Shi, Z.H.; Yin, W.; Huang, X. Spatial and seasonal patterns in stream water contamination across mountainous watersheds: Linkage with landscape characteristics. J. Hydrol. 2015, 523, 398–408. [Google Scholar] [CrossRef]
- Gong, Y.; Ji, X.; Hong, X.; Cheng, S. Correlation Analysis of Landscape Structure and Water Quality in Suzhou National Wetland Park, China. Water 2021, 13, 2075. [Google Scholar] [CrossRef]
- Liu, H.; Li, Y.; Cao, X.; Hao, J.; Hu, J.; Zheng, J. The Current Problems and Perspectives of Landscape Research of Wetlands in China. Acta Geogr. Sin. 2009, 64, 1394–1401. [Google Scholar]
- McKenna, O.P.; Kucia, S.R.; Mushet, D.M.; Anteau, M.J.; Wiltermuth, M.T. Synergistic Interaction of Climate and Land-Use Drivers Alter the Function of North American, Prairie-Pothole Wetlands. Sustainability 2019, 11, 6581. [Google Scholar] [CrossRef] [Green Version]
- Chen, H.-S. Establishment and Applied Research on a Wetland Ecosystem Evaluation Model in Taiwan. Sustainability 2015, 7, 15785–15793. [Google Scholar] [CrossRef] [Green Version]
- Das, S.; Pradhan, B.; Shit, P.K.; Alamri, A.M. Assessment of Wetland Ecosystem Health Using the Pressure–State–Response (PSR) Model: A Case Study of Mursidabad District of West Bengal (India). Sustainability 2020, 12, 5932. [Google Scholar] [CrossRef]
- Tian, P.; Cao, L.; Li, J.; Pu, R.; Gong, H.; Li, C. Landscape Characteristics and Ecological Risk Assessment Based on Multi-Scenario Simulations: A Case Study of Yancheng Coastal Wetland, China. Sustainability 2021, 13, 149. [Google Scholar] [CrossRef]
- Bai, Z.K.; Zhou, W.; Wang, J.; Zhao, Z.Q.; Chao, Y.G.; Zhou, Y. Restoration and Reconstruction of Ecosystem in Mining Area. China Land Sci. 2018, 32, 1–9. (In Chinese) [Google Scholar]
- LY/T 1755-2008; Specification for the Construction of National Wetland Parks. Wetland Research Center, State Forestry Administration: Beijing, China, 2008. (In Chinese)
- Jia Wang District People’s Government. Overall Planning of Pan’an Lake National Wetland Park in Xuzhou, Jiangsu; Jiangsu Forest Resources Monitoring Center: Nanjing, China, 2013. (In Chinese)
- Ali, A.; Strezov, V.; Davies, P.; Wright, I. Environmental impact of coal mining and coal seam gas production on surface water quality in the Sydney basin, Australia. Environ. Monit. Assess. 2017, 189, 408. [Google Scholar] [CrossRef]
- Yang, W.; Zhao, Y.; Wang, D.; Wu, H.; Lin, A.; He, L. Using Principal Components Analysis and IDW Interpolation to Determine Spatial and Temporal Changes of Surface Water Quality of Xin’anjiang River in Huangshan, China. Int. J. Environ. Res. Public Health 2020, 17, 2942. [Google Scholar] [CrossRef]
- Brisson, J.; Rodriguez, M.; Martin, C.A.; Proulx, R. Plant diversity effect on water quality in wetlands: A meta-analysis based on experimental systems. Ecol. Appl. 2020, 30, e02074. [Google Scholar] [CrossRef]
- Ge, Y.; Han, W.; Huang, C.; Wang, H.; Liu, D.; Chang, S.X.; Gu, B.; Zhang, C.; Gu, B.; Fan, X.; et al. Positive effects of plant diversity on nitrogen removal in microcosms of constructed wetlands with high ammonium loading. Ecol. Eng. 2015, 82, 614–623. [Google Scholar] [CrossRef]
- Zhang, Z.M.; Gao, J.F.; Cai, Y.J. The direct and indirect effects of land use and water quality on phytoplankton communities in an agriculture-dominated basin. Environ. Monit. Assess. 2020, 192, 760. [Google Scholar] [CrossRef] [PubMed]
- Huang, Y.; Mei, X.; Rudstam, L.G.; Taylor, W.D.; Urabe, J.; Jeppesen, E.; Liu, Z.; Zhang, X. Effects of Crucian Carp (Carassius auratus) on Water Quality in Aquatic Ecosystems: An Experimental Mesocosm Study. Water 2020, 12, 1444. [Google Scholar] [CrossRef]
- Wu, Z.; Wang, X.; Chen, Y.; Cai, Y.; Deng, J. Assessing river water quality using water quality index in Lake Taihu Basin, China. Sci. Total Environ. 2018, 612, 914–922. [Google Scholar] [CrossRef] [PubMed]
- HJ/T 91-2002; Technical Specification for Surface Water and Wastewater Monitoring. State Environmental Protection Administration: Beijing, China, 2002. (In Chinese)
- HJ 493-2009; Technical regulations on preservation and management of water quality samples. Ministry of Ecology and Environment: Beijing, China, 2009. (In Chinese)
- Huang, J.; Huang, Y.; Pontius, R.G., Jr.; Zhang, Z. Geographically weighted regression to measure spatial variations in correlations between water pollution versus land use in a coastal watershed. Ocean Coas. Manag. 2015, 103, 14–24. [Google Scholar] [CrossRef]
- GB3838-2002; National Environmental Protection Standard. Ministry of Ecology and Environment: Beijing, China, 2002. (In Chinese)
- McGarigal, K.; Marks, B. FRAGSTATS: Spatial Pattern Analysis Program for Quantifying Landscape Structure; US Department of Agriculture, Forest Service, Pacific Northwest Research Station: Portland, OR, USA, 1995. [Google Scholar]
- Sun, Y.; Guo, Q.; Liu, J.; Wang, R. Scale Effects on Spatially Varying Relationships Between Urban Landscape Patterns and Water Quality. Environ. Manag. 2014, 54, 272–287. [Google Scholar] [CrossRef]
- Wijesiri, B.; Liu, A.; Deilami, K.; He, B.; Hong, N.; Yang, B.; Zhao, H.; Ayoko, G.; Goonetilleke, A. Nutrients and metals interactions between water and sediment phases: An urban river case study. Environ. Pollut. 2019, 251, 354–362. [Google Scholar] [CrossRef]
- Xia, R.; Chen, Z. Integrated Water-Quality Assessment of the Huai River Basin in China. J. Hydrol. Eng. 2015, 20, 05014018. Available online: https://ascelibrary.org/doi/abs/10.1061/%28ASCE%29HE.1943-5584.0001030 (accessed on 5 September 2022). [CrossRef]
- Liu, S.; Lou, S.; Kuang, C.; Huang, W.; Chen, W.; Zhang, J.; Zhong, G. Water quality assessment by pollution-index method in the coastal waters of Hebei Province in western Bohai Sea, China. Mar. Pollut. Bull. 2011, 62, 2220–2229. [Google Scholar] [CrossRef]
- Wai, M.P.; Chem, V.; Eang, K.E.; Chhin, R.; Siev, S.; Heu, R. Accessing the Impact of Floating Houses on Water Quality in Tonle Sap Lake, Cambodia. Sustainability 2022, 14, 2747. [Google Scholar] [CrossRef]
- Xia, L.L.; Liu, R.Z.; Zao, Y.W. Correlation Analysis of Landscape Pattern and Water Quality in Baiyangdian Watershed. Procedia Environ. Sci. 2012, 13, 2188–2196. [Google Scholar] [CrossRef] [Green Version]
- Li, G.Y.; Li, L.Z.; Kong, M. Multiple-Scale Analysis of Water Quality Variations and Their Correlation with Land use in Highly Urbanized Taihu Basin, China. Bull. Environ. Contam. Toxicol. 2021, 106, 218–224. [Google Scholar] [CrossRef] [PubMed]
- Shi, F.N.; Liu, S.L.; An, Y.; Sun, Y.; Zhao, S.; Liu, Y.; Li, M. Spatio-Temporal Dynamics of Landscape Connectivity and Ecological Network Construction in Long Yangxia Basin at the Upper Yellow River. Land 2020, 9, 265. [Google Scholar] [CrossRef]
- Yu, X.; Yang, Q.; Zhao, Z.; Tang, X.; Xiong, B.; Su, S.; Wu, Z.; Yao, W. Ecological Efficiency of the Mussel Hyriopsis cumingii (Lea, 1852) on Particulate Organic Matter Filtering, Algal Controlling and Water Quality Regulation. Water 2021, 13, 297. [Google Scholar] [CrossRef]
- Mai, Y.; Zhao, X.; Huang, G. Temporal and spatial variability of water quality in an urban wetland and the effects of season and rainfall: A case study in the Daguan Wetland, China. Environ. Monit. Assess. 2022, 194, 347. [Google Scholar] [CrossRef]
- Namugize, J.N.; Jewitt, G.; Graham, M. Effects of land use and land cover changes on water quality in the uMngeni river catchment, South Africa. Phys. Chem. Earth Parts A/B/C 2018, 105, 247–264. [Google Scholar] [CrossRef]
- Sheng, Y.; Liu, W.; Xu, H.; Gao, X. The Spatial Distribution Characteristics of the Cultivated Land Quality in the Diluvial Fan Terrain of the Arid Region: A Case Study of Jimsar County, Xinjiang, China. Land 2021, 10, 896. [Google Scholar] [CrossRef]


| Typical Biological | Type | Main Distribution | Positive Feedback | Negative Feedback |
|---|---|---|---|---|
| Reed, cattails, aquatic canna etc. | Emergent aquatic plants | Water depth <0.3 m | To provide habitat for birds, at the same time play the role of water convection, the first into the upper and lower water circulation | Its own transition reproduction, decay after the pH value decreases, DO concentration decreases |
| Spatterdock, Lotus flower, duckweed etc. | Floating plants | Water depth 0.3 m~0.9 m | Purify water, can effectively degrade TP, TN, etc. [32] | Overbreeding thus obscuring sunlight and affecting photosynthesis in submerged plants |
| Water caltrop, tape grass etc. | Submerged plants | Water depth 0.9 m~2.5 m | N, P removal effect is good, zinc enrichment, arsenic and other metal ions have a strong purification ability [33] | It is easy to cause eutrophication of water after decay |
| Wheat, rice etc. | Economic crops | Land at the edge of the planning area | To enrich the species diversity index, and at the same time to provide security for local economic society and food security | Agriculture had a negative effect on TN, TP and COD [34] |
| Silver carp, crucian carp etc. | Aquatic animals | Each functional area | Effectively inhibit the production of planktonic algae, effectively reduce the concentration of suspended matter, improve the transparency of water | Crucian carp positively increased TN, TP, planktonic biomass and TSS, but negatively improved shallow water ecosystem [35] |
| Monitoring Project | Determination Method | Measuring Range | Resolution | Accuracy | Reference Standard | Note |
|---|---|---|---|---|---|---|
| pH | Glass electrode method | 0–14 | ±0.01 PH | ±0.02 PH | GB6920—86 | In situ determination |
| DO | Fluorescence | 0–20 mg/L | 0.01 mg/L | ±5%Fs | HACH | In situ determination |
| TN | Persulfate oxidation method | 0–25 mg/L | 0.01 mg/L | <5% | HACH | Laboratory analysis |
| TP | Ascorbic acid method | 0–1.5 mg/L | 0.01 mg/L | <5% | HACH | Laboratory analysis |
| COD | Colorimetric method | 3–150 mg/L | 0.01 mg/L | <1% | USEPA | Laboratory analysis |
| Cond | Metal electrode method | 0–200 ms/cm | 0.01 ms/cm | <1% | USEPA | In situ determination |
| Functional Division | Characteristic | Proportion of Area | Monitoring Stations | Monitored Items (N) | Monthly Samples (N) | Annual Samples (N) |
|---|---|---|---|---|---|---|
| WRA | Seminatural ecosystem | 44.3% | D1, D2, D3, D4 | 6 | 68 | 816 |
| MEA | Natural ecosystem | 22.5% | D5, D6, D7 | 6 | 54 | 648 |
| MSA | Artificial ecosystem | 1.6% | D8 | 6 | 22 | 264 |
| WCA | Complex ecosystem | 22.7% | D9, D10 | 6 | 36 | 432 |
| LWA | Complex ecosystem | 8.9% | D11, D12 | 6 | 36 | 432 |
| Functional Division | Agriculture Area (ha) | Percentage % | Forest Area (ha) | Percentage % | Grassland Area (ha) | Percentage % | Water Area (ha) | Percentage % | Built-Up Land (ha) | Percentage % |
|---|---|---|---|---|---|---|---|---|---|---|
| WRA | 59.76 | 15.87 | 84.87 | 22.54 | 95.94 | 25.48 | 133.83 | 35.54 | 2.16 | 0.57 |
| MEA | 31.68 | 14.11 | 42.93 | 19.12 | 72.63 | 32.34 | 75.6 | 33.67 | 1.71 | 0.76 |
| MSA | 2.73 | 9.52 | 5.4 | 18.83 | 10.35 | 36.09 | 7.56 | 26.36 | 2.64 | 9.21 |
| WCA | 12.6 | 6.96 | 48.33 | 26.69 | 47.97 | 26.49 | 72.09 | 39.81 | 0.09 | 0.05 |
| LEA | 24.84 | 20.09 | 24.48 | 19.79 | 33.57 | 27.15 | 38.7 | 31.29 | 2.07 | 1.67 |
| Total | 131.61 | 14.08 | 206.01 | 22.04 | 260.46 | 27.87 | 327.78 | 35.07 | 8.67 | 0.93 |
| Functional Division | Landscape Fragmentation | Value | Landscape Aggregation | Value | Landscape Dominance | Value | Landscape Diversity | Value |
|---|---|---|---|---|---|---|---|---|
| PD | CONTAG | PLAND | SHDI | |||||
| WRA | 45.39 | Low | 32.97 | High | 36.19 | High | 1.41 | Highest |
| MEA | 50.32 | General | 32.81 | General | 19.13 | Low | 1.36 | High |
| MSA | 111.50 | Highest | 19.15 | Lowest | 10.38 | Lowest | 1.29 | Low |
| WCA | 34.79 | Lowest | 41.04 | Highest | 39.82 | Highest | 1.26 | Lowest |
| LEA | 50.95 | High | 31.92 | Low | 20.08 | General | 1.35 | General |
| Index | Functional | Monthly Average | Annual Value | Evaluation | Value | |||||||||
|---|---|---|---|---|---|---|---|---|---|---|---|---|---|---|
| Max | Mth | Min | Mth | Max | Mth | Min | Mth | Annual Mean | ||||||
| TN mg/L | WRA | 1.18 | 2 | 0.58 | 6 | 1.50 | 1 | 0.50 | 6 | 0.84 | 0.77 | 0.78 | 0.78 | Lowest |
| MEA | 1.47 | 2 | 0.80 | 3 | 1.70 | 2 | 0.50 | 4 | 1.04 | 0.98 | 0.84 | 0.91 | Highest | |
| MSA | 1.60 | 2 | 0.70 | 5 | 1.60 | 2 | 0.70 | 5 | 1.11 | 0.80 | 0.81 | 0.81 | Low | |
| WCA | 1.40 | 2 | 0.45 | 4 | 1.40 | 2 | 0.40 | 4 | 0.95 | 0.93 | 0.82 | 0.88 | High | |
| LEA | 1.30 | 2 | 0.75 | 4 | 1.30 | 1 | 0.60 | 4 | 0.96 | 0.68 | 0.83 | 0.85 | General | |
| TP mg/L | WRA | 0.06 | 2 | 0.03 | 4 | 0.08 | 2 | 0.02 | 6 | 0.04 | 0.60 | 0.42 | 0.52 | General |
| MEA | 0.06 | 3 | 0.03 | 7 | 0.08 | 3 | 0.02 | 7 | 0.03 | 0.57 | 0.37 | 0.48 | Low | |
| MSA | 0.06 | 7 | 0.02 | 5 | 0.06 | 7 | 0.02 | 6 | 0.04 | 0.60 | 0.55 | 0.58 | High | |
| WCA | 0.05 | 12 | 0.03 | 6 | 0.05 | 10 | 0.03 | 5 | 0.04 | 0.50 | 0.39 | 0.45 | Lowest | |
| LEA | 0.08 | 5 | 0.03 | 1 | 0.08 | 6 | 0.03 | 1 | 0.05 | 0.75 | 0.47 | 0.62 | Highest | |
| Index | Functional | Monthly Average | Annual Value | Evaluation | Value | |||||||||
|---|---|---|---|---|---|---|---|---|---|---|---|---|---|---|
| Max | Mth | Min | Mth | Max | Mth | Min | Mth | Annual Mean | ||||||
| DO mg/L | WRA | 15.95 | 6 | 10.21 | 3 | 18.9 | 6 | 9.69 | 3 | 12.44 | 2.13 | 1.66 | 1.91 | Highest |
| MEA | 14.52 | 6 | 10.03 | 9 | 15.24 | 6 | 9.68 | 3 | 11.66 | 1.94 | 1.56 | 1.76 | High | |
| MSA | 12.91 | 11 | 8.06 | 1 | 12.91 | 11 | 8.06 | 1 | 11.10 | 1.72 | 1.48 | 1.61 | General | |
| WCA | 12.76 | 12 | 10.03 | 8 | 13.74 | 12 | 9.75 | 8 | 11.13 | 1.70 | 1.48 | 1.60 | Low | |
| LEA | 13.08 | 10 | 9.49 | 6 | 13.19 | 10 | 8.60 | 6 | 10.73 | 1.74 | 1.43 | 1.59 | Lowest | |
| COD mg/L | WRA | 17.79 | 3 | 10.50 | 12 | 18.50 | 3 | 9.30 | 10 | 13.51 | 0.89 | 0.81 | 0.85 | General |
| MEA | 16.84 | 4 | 9.00 | 12 | 17.35 | 3 | 9.80 | 12 | 12.72 | 0.84 | 0.78 | 0.82 | Low | |
| MSA | 18.25 | 3 | 10.10 | 11 | 18.25 | 3 | 10.10 | 11 | 13.49 | 0.91 | 0.83 | 0.87 | High | |
| WCA | 18.13 | 4 | 9.65 | 12 | 18.56 | 4 | 9.40 | 12 | 13.51 | 0.91 | 0.83 | 0.89 | Highest | |
| LEA | 17.23 | 4 | 8.50 | 12 | 19.25 | 4 | 8.30 | 12 | 12.36 | 0.86 | 0.78 | 0.81 | Lowest | |
| Index | Functional | Monthly Average | Annual Value | Evaluation | Value | |||||||||
|---|---|---|---|---|---|---|---|---|---|---|---|---|---|---|
| Max | Mth | Min | Mth | Max | Mth | Min | Mth | Annual Mean | ||||||
| Cond μs/cm | WRA | 314.25 | 12 | 249.5 | 2 | 442.00 | 10 | 268.00 | 1 | 286.43 | 64.75 | 18.59 | 0.06 | Lowest |
| MEA | 292.67 | 12 | 228.33 | 1 | 320.00 | 11 | 198.00 | 1 | 256.29 | 64.33 | 19.25 | 0.08 | Low | |
| MSA | 295.00 | 9 | 199.20 | 11 | 295.00 | 9 | 199.20 | 11 | 249.77 | 95.80 | 32.91 | 0.13 | General | |
| WCA | 282.00 | 3 | 192.05 | 11 | 295.00 | 4 | 191.90 | 11 | 233.00 | 89.95 | 32.19 | 0.14 | Highest | |
| LEA | 274.50 | 4 | 193.50 | 2 | 286.00 | 4 | 192.00 | 2 | 213.18 | 81.00 | 27.08 | 0.13 | High | |
| Index | Functional | Monthly Average | Annual Value | Evaluation | Value | |||||||||
|---|---|---|---|---|---|---|---|---|---|---|---|---|---|---|
| Max | Mth | Min | Mth | Max | Mth | Min | Mth | Difference Value | ||||||
| pH | WRA | 8.44 | 3 | 7.78 | 6 | 8.68 | 3 | 7.49 | 6 | 1.19 | 0.66 | 0.18 | 0.02 | General |
| MEA | 8.43 | 3 | 7.92 | 6 | 8.59 | 3 | 7.85 | 6 | 0.74 | 0.51 | 0.12 | 0.01 | Lowest | |
| MSA | 8.45 | 4 | 7.75 | 7 | 8.45 | 4 | 7.75 | 8 | 0.70 | 0.70 | 0.20 | 0.02 | General | |
| WCA | 8.45 | 3 | 7.55 | 6 | 8.51 | 3 | 7.51 | 6 | 1.00 | 0.90 | 0.24 | 0.03 | Highest | |
| LEA | 8.33 | 10 | 7.72 | 6 | 8.31 | 10 | 7.65 | 6 | 0.66 | 0.60 | 0.18 | 0.02 | General | |
| Index | Rainy Season | Normal Season | Dry Season | ||||||
|---|---|---|---|---|---|---|---|---|---|
| Types | R | P | Types | R | P | Types | R | P | |
| TN | Agriculture | 0.928 | 0.032 | Built-up land | 0.983 | 0.017 | / | ||
| DO | Grassland | 0.973 | 0.027 | / | Built-up land | −0.986 | 0.014 | ||
| COD | / | Built-up land | −0.998 | 0.002 | Agriculture | 0.924 | 0.048 | ||
| pH | Forest | −0.951 | 0.049 | Grassland | −0.953 | 0.047 | / | ||
| Index | Agriculture | Forest | Grassland | Water Area | Built-Up Land | |||||
|---|---|---|---|---|---|---|---|---|---|---|
| Water Season | Ecological Effect (P) | Water Season | Ecological Effect (P) | Water Season | Ecological Effect (P) | Water Season | Ecological Effect (P) | Water Season | Ecological Effect (P) | |
| TN | / | / | / | / | Normal | + (0.052) | / | / | Normal | − (0.017) |
| TP | Rainy | + (0.296) | / | / | / | / | Rainy | + (0.296) | Rainy | − (0.296) |
| DO | / | / | Rainy | + (0.926) | Rainy | + (0.027) | / | / | Dry | − (0.014) |
| COD | Dry | − (0.048) | Normal | − (0.086) | / | / | / | / | Normal | − (0.002) |
| Cond | Dry | − (0.214) | Normal | − (0.444) | Dry | − (0.214) | Dry | − (0.214) | Rainy | − (0.922) |
| Index | Rainy Season | Normal Season | Dry Season | ||||||
|---|---|---|---|---|---|---|---|---|---|
| Types | R | P | Types | R | P | Types | R | P | |
| TN | Forest | 0.928 | 0.049 | Built-up land | 0.983 | 0.016 | / | ||
| Agriculture | 0.971 | 0.028 | |||||||
| DO | Water area | 0.973 | 0.027 | / | Built-up land | −0.988 | 0.012 | ||
| COD | Forest | 0.952 | 0.048 | Agriculture | −0.963 | 0.037 | Grassland | −0.979 | 0.021 |
| Built-up land | −0.962 | 0.038 | Water area | −0.956 | 0.043 | ||||
| Cond | / | Built-up land | −0.988 | 0.012 | Grassland | 0.975 | 0.028 | ||
| Index | Agriculture | Forest | Grassland | Water Area | Built-Up Land | |||||
|---|---|---|---|---|---|---|---|---|---|---|
| Water Season | Ecological Effect (P) | Water Season | Ecological Effect (P) | Water Season | Ecological Effect (P) | Water Season | Ecological Effect (P) | Water Season | Ecological Effect (P) | |
| TN | Normal | −(0.028) | Rainy | +(0.049) | / | / | / | / | / | / |
| DO | Dry | −(0.866) | / | / | / | / | Rainy | −(0.027) | Dry | −(0.432) |
| COD | Normal | +(0.037) | Rainy | −(0.048) | Dry | +(0.021) | / | / | Normal | +(0.038) |
| Cond | Normal | +(0.426) | / | / | Dry | −(0.028) | Dry | +(0.043) | Normal | +(0.012) |
Publisher’s Note: MDPI stays neutral with regard to jurisdictional claims in published maps and institutional affiliations. |
© 2022 by the authors. Licensee MDPI, Basel, Switzerland. This article is an open access article distributed under the terms and conditions of the Creative Commons Attribution (CC BY) license (https://creativecommons.org/licenses/by/4.0/).
Share and Cite
Liu, T.; Ji, X.; Gong, Y. Wetland Functional Area Division Method: A Correlation Analysis of Water Quality and Landscape Structure. Sustainability 2022, 14, 14015. https://doi.org/10.3390/su142114015
Liu T, Ji X, Gong Y. Wetland Functional Area Division Method: A Correlation Analysis of Water Quality and Landscape Structure. Sustainability. 2022; 14(21):14015. https://doi.org/10.3390/su142114015
Chicago/Turabian StyleLiu, Tianlong, Xiang Ji, and Yaxi Gong. 2022. "Wetland Functional Area Division Method: A Correlation Analysis of Water Quality and Landscape Structure" Sustainability 14, no. 21: 14015. https://doi.org/10.3390/su142114015
APA StyleLiu, T., Ji, X., & Gong, Y. (2022). Wetland Functional Area Division Method: A Correlation Analysis of Water Quality and Landscape Structure. Sustainability, 14(21), 14015. https://doi.org/10.3390/su142114015