Abstract
China’s coal-based energy structure and rapid economic expansion have resulted in significant air pollution, notably PM2.5 pollution, which has harmed the environment, citizens’ health, and sustainable and cleaner development of China in recent years. Traditional ground monitoring stations have certain drawbacks, such as spatial distribution that is unequal. To better understand the spatial and temporal dynamic characteristics of PM2.5 emissions, this article studied the temporal and spatial changes of night light data along PM2.5 emission at the national, regional, and provincial scales. The Chinese Academy of Science’s Earth Luminous Data Set, Dalhousie University’s PM2.5 emission dataset, and the basic national geographical dataset from National Geographic were used for analysis. We found a significant positive correlation between nightlight data and PM2.5 emission data, which resulted in an accurate fitting of PM2.5 emissions using the proposed linear regression model, and the results showed that the spatiotemporal dynamics of PM2.5 emission and night light were different in various regions. In terms of spatial distribution, PM2.5 emission over the intermediate level (44% of China’s total area) was concentrated in the Sichuan Basin, North China Plain, and Northwest China, whereas PM2.5 emission below the middle level (55% of China’s total area) was concentrated in northeast China, Xizang, and West Sichuan. In terms of geographical and temporal dynamics, more than 65% of China’s total, area mainly located in the south of the Hu line, showed negative growth from 2012 to 2018, especially the North China Plain, the Sichuan Basin, and the Yangtze River’s Plains showed a lot of negative growth. The evolution of PM2.5 emission in China from 2012 to 2018 was visually exhibited by examining spatiotemporal dynamics and the interaction linkages between PM2.5 emission and nighttime light, which was useful for China’s air pollution control and sustainable development.
1. Introduction
In the past 40 years, China’s economic development has reached major achievements, and the urbanization rate increased from 17.92% in 1978 to 60.60% in 2019. At the same time, with rapid economic growth and urbanization, air pollution, especially PM2.5 pollution, is becoming more and more serious [1]. In 2013, large-scale central and eastern China was hit hard by long-term pollution [2], and the daily concentration of fine particulate matter PM2.5 reached 500 ug/m3 [3]. PM2.5 is absorbed into the human circulatory system through the respiratory tract, causing asthma, bronchitis, and other diseases [4], and increases the risk of carcinogenesis [5], which is extremely harmful to human health [6,7]. The World Health Organization estimates that air pollution kills around 4.2 million people worldwide (WHO, 2018), and the latest global burden of disease study lists PM2.5 as the sixth leading cause of death in a list of 84 risk factors. PM2.5 can also reduce the visibility of the atmosphere by absorbing and scattering light [8], affecting the radiation balance [9,10], and seriously disrupting the ecological balance. In 2016, 71.49% of China’s residents lived in an environment where PM2.5 emission exceeded the national secondary standard, causing about 1.06 million deaths [11] and 705.9 billion Yuan in health economic expenditures [12,13,14]. With increasing global air pollution, PM2.5 pollution has especially attracted widespread attention from the government, scientists, and the public.
As China’s heavy industry started later than abroad, environmental pollution emerged relatively late, and research on PM2.5 emission started from the report of Wu et al. [15] In the 21st century, many studies on PM2.5 emission have emerged at home and abroad [16,17,18,19]. Maji et al. [20] extracted PM2.5 emission data from 338 cities to study its adverse effects on human health and the social economy. Li et al. [21] studied the influencing factors of PM2.5 emission in the Beijing–Tianjin–Hebei region from 2002 to 2015, and the results showed that transportation, electricity, hot water, gas, water supply, and water services are the main sources of PM2.5 emission. Although many researchers have studied the effects of PM2.5 from various perspectives, the main research area is concentrated in cities, as these areas are deployed with sophisticated monitoring networks [22,23,24,25,26,27,28,29]. With the continuous development of satellite remote sensing technology, new ideas for the observation of PM2.5 emission and human activity intensity are emerging. Many scholars have conducted research by combining nighttime light data with PM2.5 data to explore regional economics, urbanization development, natural disaster assessment, and so on [30,31,32,33,34].
Nighttime light can intuitively reflect the area and intensity of human activities, which has the characteristics of wide detection range, long time span, and high data reliability. Wu et al. [35] proposed that nighttime light data should be regarded as a kind of consumer good. They then explored the interaction between nighttime light data and GDP by using 15 years’ panel data from 169 countries around the world. Dai et al. [36] explored the relationship between DMSP/OLS and NPP/VIIRS night light data and GDP data of provinces and cities in China. Wang et al. [37] studied the spatiotemporal evolution of urbanization in the Beijing–Tianjin–Hebei region based on DMSP/OLS and NPP/VIIRS night light datasets. Xu et al. [38] evaluated urbanization in the Yangtze River Economic Belt at provincial, district, and county scales based on DMSP/OLS night light data. Qiang et al. [39] used DMSP-OLS night light data to simulate the recovery mode of economic activities in natural disasters.
Ji et al. [40] proved in their study that there is a significant positive correlation between MSP/OLS night light and PM2.5 emissions, and established a regression model at the pixel scale to simulate the spatiotemporal dynamic changes of PM2.5 air pollution. Fu et al. [41] used NPP/VIIRS night light and PM2.5 data monitored by ground stations to establish a mixed-effects model to estimate the change in PM2.5 emission. Li et al. [42] adopted an NPP/VIIRS nighttime light image, combined with atmospheric aerosol extinction principles and meteorological data of the station, and established a prediction model based on the multiple linear regression method to simulate the concentration of PM2.5 and its spatial distribution in Shanghai during 2014–2018. Li et al. [43] selected the data of Beijing to study the correlation between night light and PM2.5 emission, and used the BP neural network to estimate the PM2.5 emission by using night light data. Cao et al. [44] corrected DMSP/OLS night light data and then compared them with a PM2.5 emission image to discuss the impact of human activities on PM2.5 emissions.
The above research shows that it is feasible to estimate PM2.5 emissions by using night light data, and the study of spatiotemporal dynamic changes of the two will provide scientific support for air pollution control. However, most previous studies focused on the whole region or part of the economic regions in China, and there is a lack of research on the relationship between night light data and PM2.5 emission at the national, economic, and provincial levels. This paper tries to explore the interaction relationships and spatiotemporal characteristics of night light data and PM2.5 emission at multiscale levels. First, a linear regression model was built by using the total PM2.5 emission data and nighttime light data in each province from 2012 to 2018. Goodness of fit and root mean square error were used to evaluate the model. Then, spatiotemporal dynamics of PM2.5 emission and night light at different scales were analyzed; in particular, the spatial and temporal dynamics of PM2.5 emission and night light maps were developed in three dimensions.
2. Data Sources with Research Area
2.1. Research Area
In this study, the dynamics of nighttime light data and PM2.5 emission were discussed from three perspectives, namely, national, economic, regional and provincial, and multiscale analyses were conducted on the spatial and temporal characteristics of PM2.5 emissions and nighttime light data. The study area is shown in Figure 1.
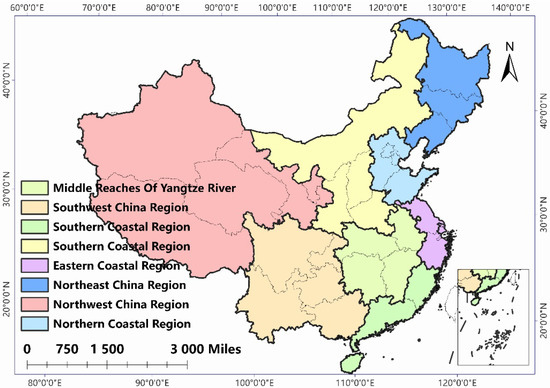
Figure 1.
Study area identification maps.
The first level is to study the spatial and temporal dynamics and distributions of PM2.5 air pollution across the country from the national perspective. After China’s reform and opening up, energy consumption increased by about 8.26 times from 571.44 million tons of standard coal in 1978 to 471.25 million tons in 2018. The number of cars on the road rose from 1.3584 million in 1978 to 232.3123 million in 2018, and China’s nominal GDP rose from 367.87 billion Yuan to 9.143271 billion Yuan in 2018 (National Bureau of Statistics [45]). The speed and scale of China’s development have surprised the world, but at the same time, rapid development has also caused a large amount of PM2.5 emissions. We first analyzed the impact of PM2.5 emission on national development from the dynamic change of total and growth of PM2.5 air pollution.
In the second phase, there is the regional perspective. The PM2.5 emission characteristics of different regions in China are different, which can be divided into eight comprehensive economic regions, namely, the northeast, the northern coast, the eastern coast, the southern coast, the middle reaches of the Yellow River, the middle reaches of the Yangtze River, the southwest, and the northwest. In this study, the data distribution characteristics of different regions are analyzed based on the division of the eight comprehensive economic regions.
The third level is from the perspective of provincial units in China. Due to the differences in geographical environment, population distribution, industrial structure, and so on. PM2.5 emission and night light maps of each province are also very different. Until 2020, China has 23 provinces, 5 autonomous regions, 4 municipalities directly under the central government, and 2 special administrative regions. Only 31 provincial-level units (excluding Hong Kong, Macao, and Taiwan) are selected as research regions in this study.
2.2. Data Source
The data used in this study mainly include the Chinese Academy of Sciences version of the Earth Luminous Data Set (code-named “Flint”), PM2.5 emission data collected by the Dalhousie University‘s Atmospheric Composition Analysis Group, and national basic geographic data provided by the National Geographic information resource service system. A brief explanation of the data is given in Table 1.

Table 1.
Explanation of data set.
2.2.1. Nighttime Light Data
The nighttime light data used in this study are the earth noctilucent data set (named “Flint”) provided by the Chinese Academy of Sciences, which is developed by the China remote sensing satellite ground station of the Chinese Academy of Sciences. In the collection of nighttime light data, the OLS sensor of the Defense Meteorological Satellite Program (DMSP/OLS) is the earliest instrument for nighttime light remote sensing detection. DMSP/OLS continued to observe from 1992 to 2014 and obtained a lot of data. However, its main problems are that the spatial resolution is too low, large cities contain only a few pixels, and the radiation detection range is too narrow, which results in the highlighted areas in the center of the city tending to be saturated.
At present, the nighttime light data used in many studies come from the “soMi” national polar orbit satellite partner satellite of the United States launched in October 2011. The VIIRS sensor onboard the satellite has a band called the Day/Night band (DNB), which provides once-daily, globally sensitive (250-fold better than OLS) nocturnal observations of the surface at a resolution of 500 m (6 times better than OLS). The whole series of global high-definition noctilucent annual products was produced for the first time by the Chinese Academy of Sciences based on the earth’s noctilucent data obtained by the American Suomi-NPP satellite. The name of the product is “Flint”, and the global noctilucent change detection products of the five-year period are further synthesized. Compared with the original product, the Flint data have a long time series, small data volume, and after processing such as denoising and saturation correction, they have the characteristics of higher accuracy, stability, and ease of use, which can be used to continuously track human activities on the earth’s surface. The Beta1 version of Flint used in this article has a resolution of 1500 m, namely, 0.0125 degrees per pixel (28,800 × 11,200 pixels).
2.2.2. Emission Data of PM2.5
This research relied on data from the Atmospheric Composition Analysis Group for China’s PM2.5 emissions. The group estimates ground-level PM2.5 data [46] by combining Aerosol Optical Depth (AOD), NASA MODIS, MISR, and SeaWiFS instruments with the GEOS-Chem chemical transport model and subsequently calibrating the data by using geographically weighted regression. From their original data, we obtain the image data of China’s annual average PM2.5 emission data from 2012 to 2018. The data are a great improvement compared with the data from air quality monitoring stations commonly used around the country. Domestic stations in the city are usually few and generally built in the suburbs, which cannot fully represent the actual air quality of the city, and different stations easily lead to data loss and incomplete data. In addition, data acquisition, sorting, and analyzing are difficult. By contrast, the data used in this paper are easier to obtain and can be used for microscopical and long-term observation of PM2.5 emissions in China.
2.2.3. Basic Geographic Data
The basic geographic data used in this article are derived from the national 1:1,000,000 vector map data of the National Catalogue Service for Geographic Information. The data could be randomly selected and displayed and used for spatial analysis and decision-making, which are widely used in land use spatial planning and control, electronic navigation, disaster assessment and monitoring, and other fields. The data cover 77 maps of the land, main islands, and adjacent waters in China.
3. Methodology
3.1. Description of Correlation Analysis Method
Correlation analysis is a process of describing the closeness of the relationship between objective things and expressing it with relevant statistical indicators. In order to verify the PM2.5 emission correlation with nighttime light data, the correlation between PM2.5 emission and nighttime light data in the provincial area is used as the original hypothesis to estimate the correlation. The formula for correlation estimation is shown in Equation (1).
In Formula (1), the nighttime light data are taken as the independent variable , the PM2.5 emission is taken as the dependent variable , and represents the Pearson correlation coefficient of variables and . is the number of observed objects, is the observation value of , and is the observation value of . The value of the correlation coefficient represents the degree and direction of correlation between variables. When the absolute value of approaches 1, it indicates a strong relationship between variables. When approaches 0, it indicates a weak relationship, a positive sign indicates a positive correlation with data, and a negative sign indicates a negative correlation.
3.2. Estimation of Emissions of PM2.5
Through the verification of the positive correlation between nighttime light data and PM2.5 emission data, it is proved that the model based on nighttime light data is effective in estimating PM2.5 emissions. There are many options for model establishment, such as the linear regression model, the log–log regression model, and other methods. Since the linear regression model is relatively accurate and easy to implement, this paper selects the linear regression model for estimation in combination with the research content. The specific linear regression model is shown in Equation (2).
In the formula, is the night light value in each province, is the intercept, is the regression coefficient, and is the estimated total PM2.5 emission in each province. In this study, the total PM2.5 emission data and nighttime light data in each province from 2012 to 2018 are used as modeling data, and the OLS method is used for modeling. Detailed information on the established model is shown in Table 2. The goodness of fit reaches 0.61, which indicates that the data are significant.
Table 2.
Detailed results of OLS regression.
3.3. Analysis Method of PM2.5 Spatiotemporal Variation
We first calculate the mean value of PM2.5 emission from 2012 to 2018 to describe the spatial distribution characteristics of PM2.5 in this period. The equation is shown in Equation (3), where is the average PM2.5 emission from 2012 to 2018, and is the total number of years. The value is 7 in this paper. At the same time, we also construct Equation (4) to describe the temporal and spatial changes of PM2.5 from 2012 to 2018. represents the fluctuation in PM2.5 emissions over time.
In order to show the changes in PM2.5 emission more intuitively, we use the natural breakpoint method to divide the average PM2.5 emission in each area into five levels, namely: low (0–11.67) and relatively low (11.67–26.27), medium (26.27–42.53), relatively high (42.53–60.04), and high (60.04–106.31). In addition, the different values of the PM2.5 growth rate are divided into four levels: significant negative growth (−53 to −19.2), low-speed negative growth (−19.2 to 0), low-speed growth (0 to 15), and high-speed growth (15 to 41.60).
4. Results and Discussion
4.1. Results of Correlation Analysis
Table 3 displays the results of a correlation study between the Flint data and the PM2.5 emission of 31 provinces between 2012 and 2018. The calculations are based on the formula provided in Section 3.
Table 3.
Correlation coefficient of each year.
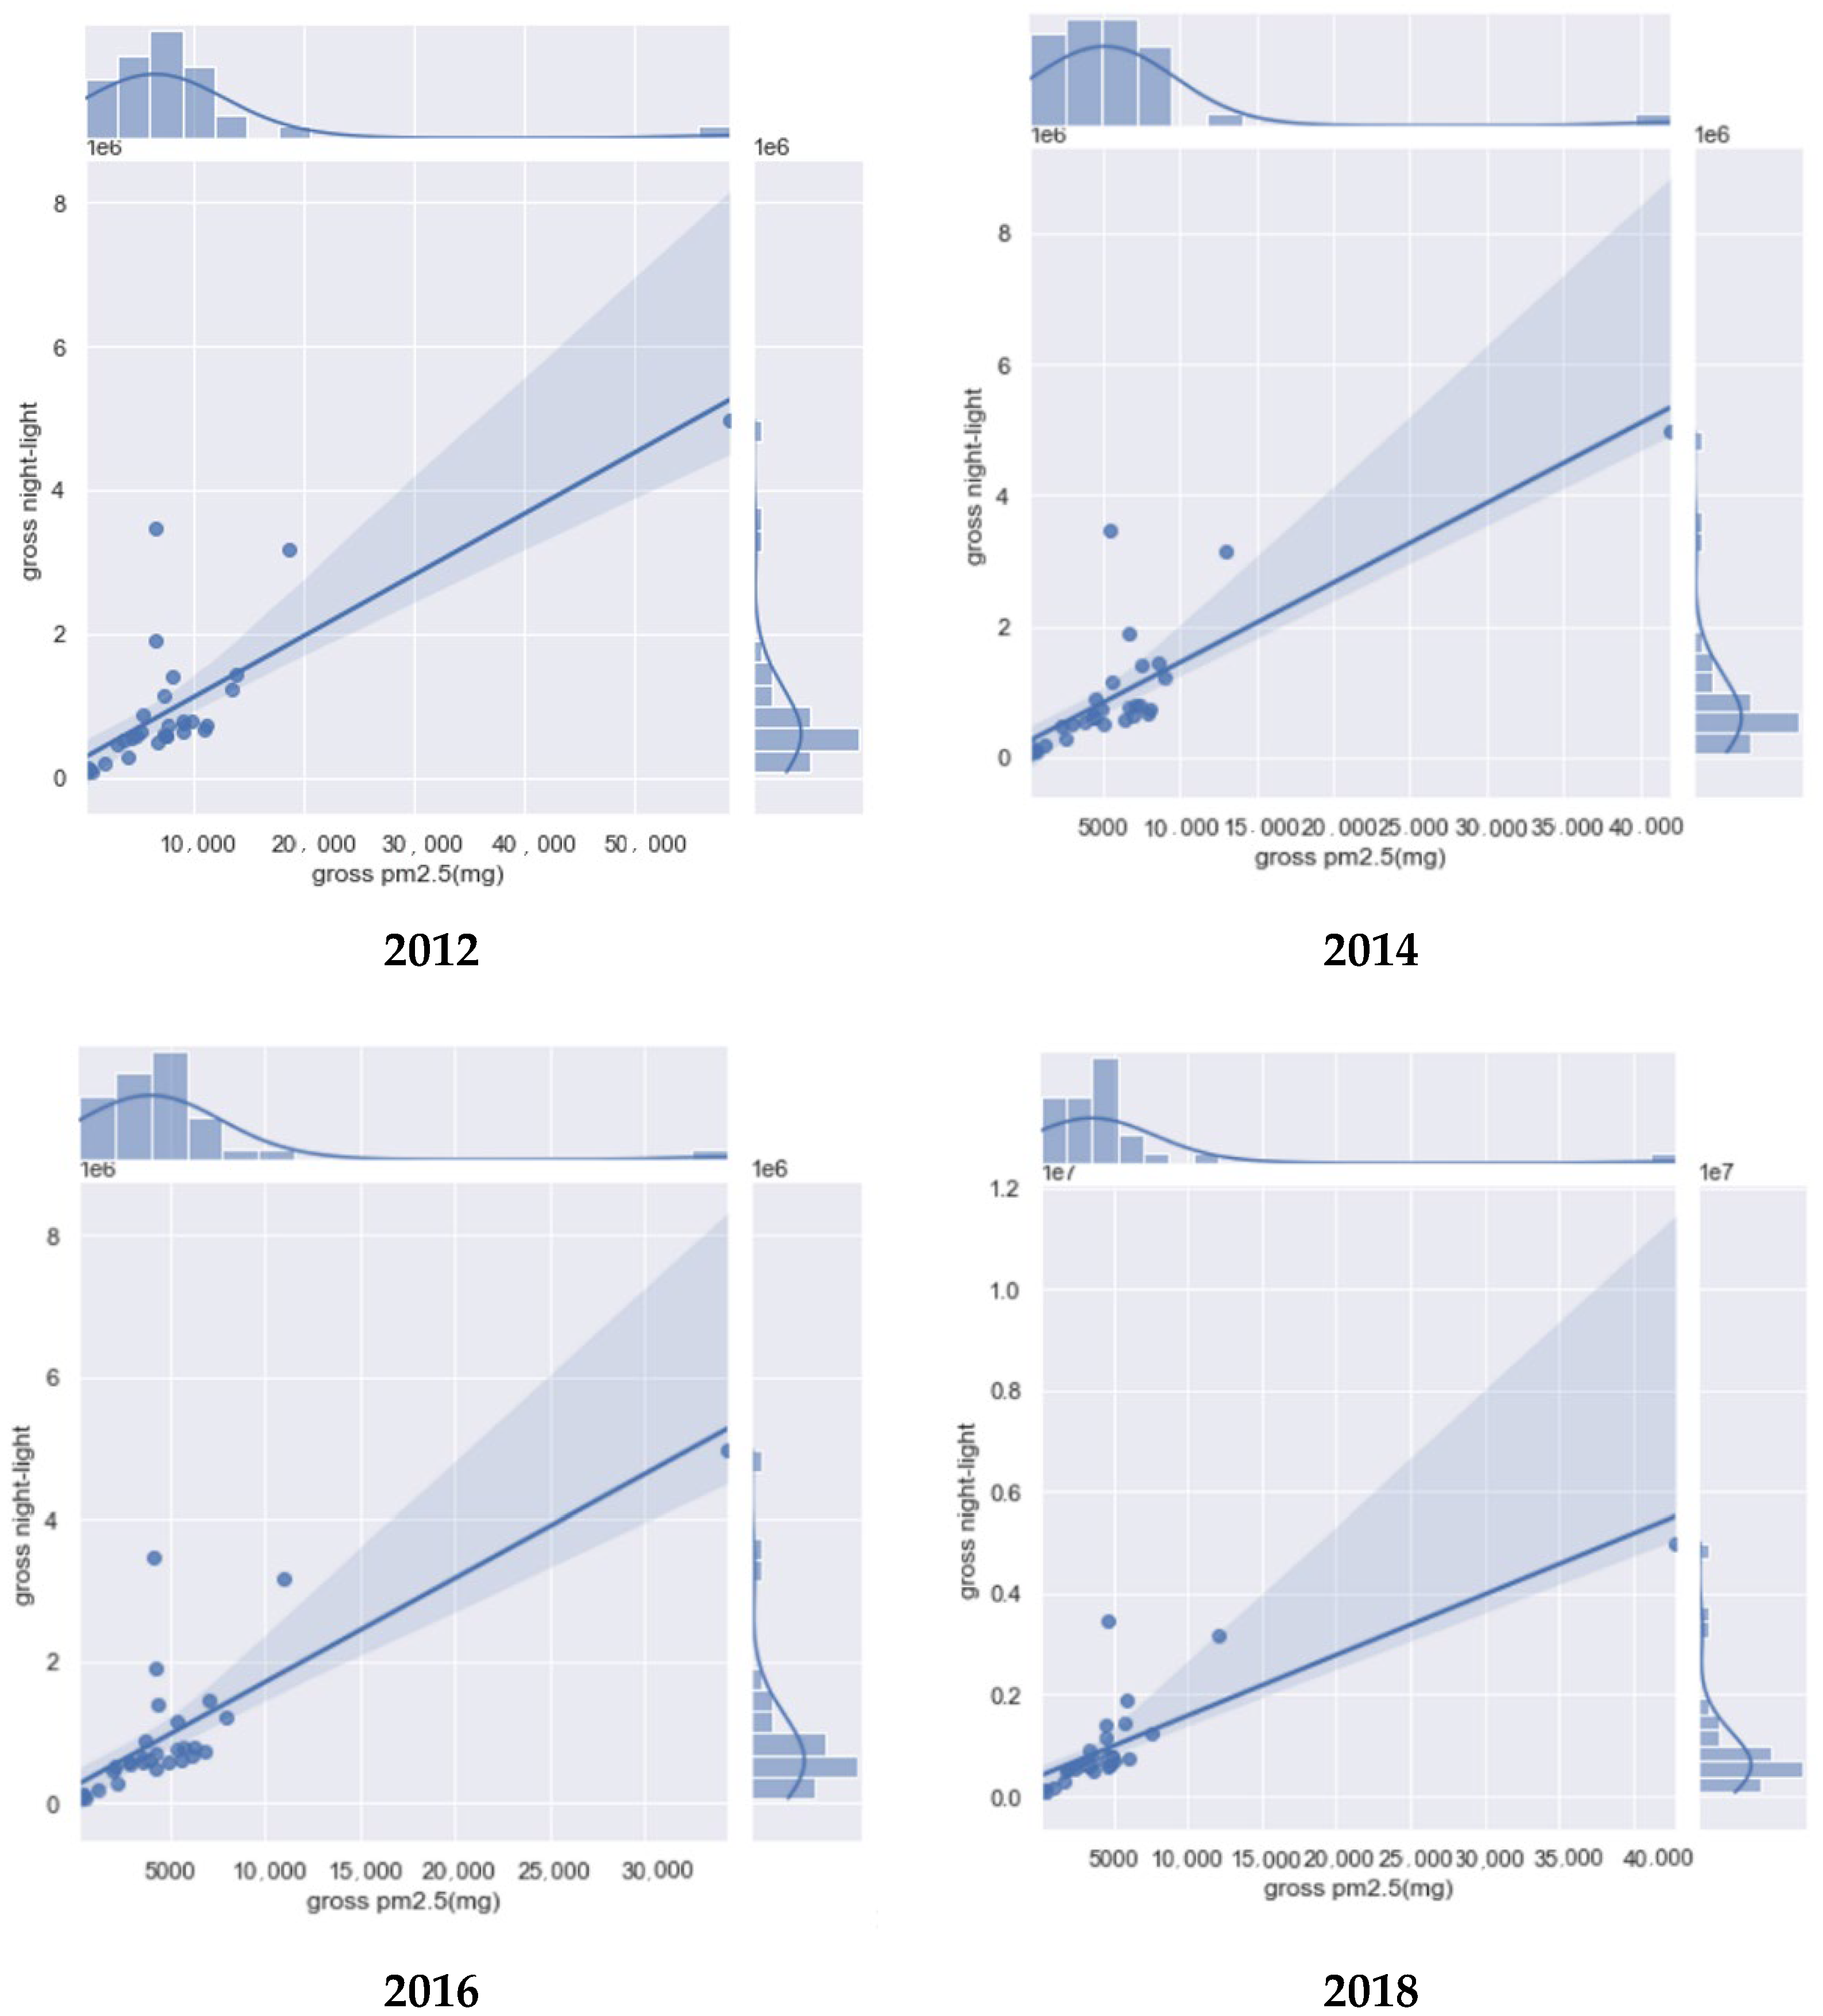
In Table 2, the -value of all years is less than 0.01, and the correlation coefficient is greater than 0.7; therefore, we reject the original hypothesis and confirm that there is a significant positive correlation between the two variables, and the result is statistically significant.
In order to have a more intuitive perception of the correlation between Flint data and PM2.5, this research uses Python libraries to plot the data points, fitting lines, and confidence intervals of each year. The results are shown in Figure 2, the data fitting line of each year is a monotonically increasing linear function, and most of the data points are distributed near the fitting line and within the confidence interval, which indicates that there is a good correlation between Flint data and PM2.5 emissions.
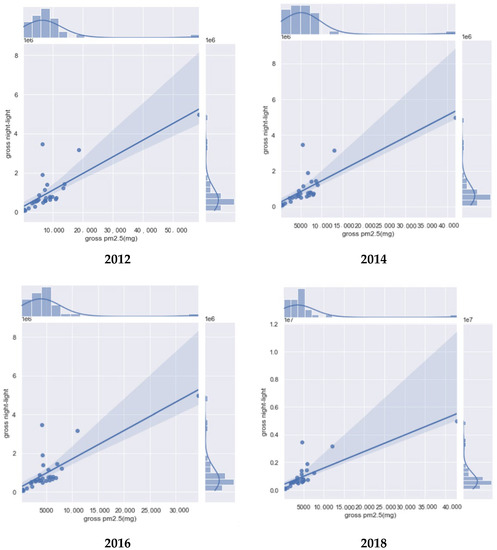
Figure 2.
Data points and fitting line of each year.
4.2. Estimated Results and Comparative Analysis
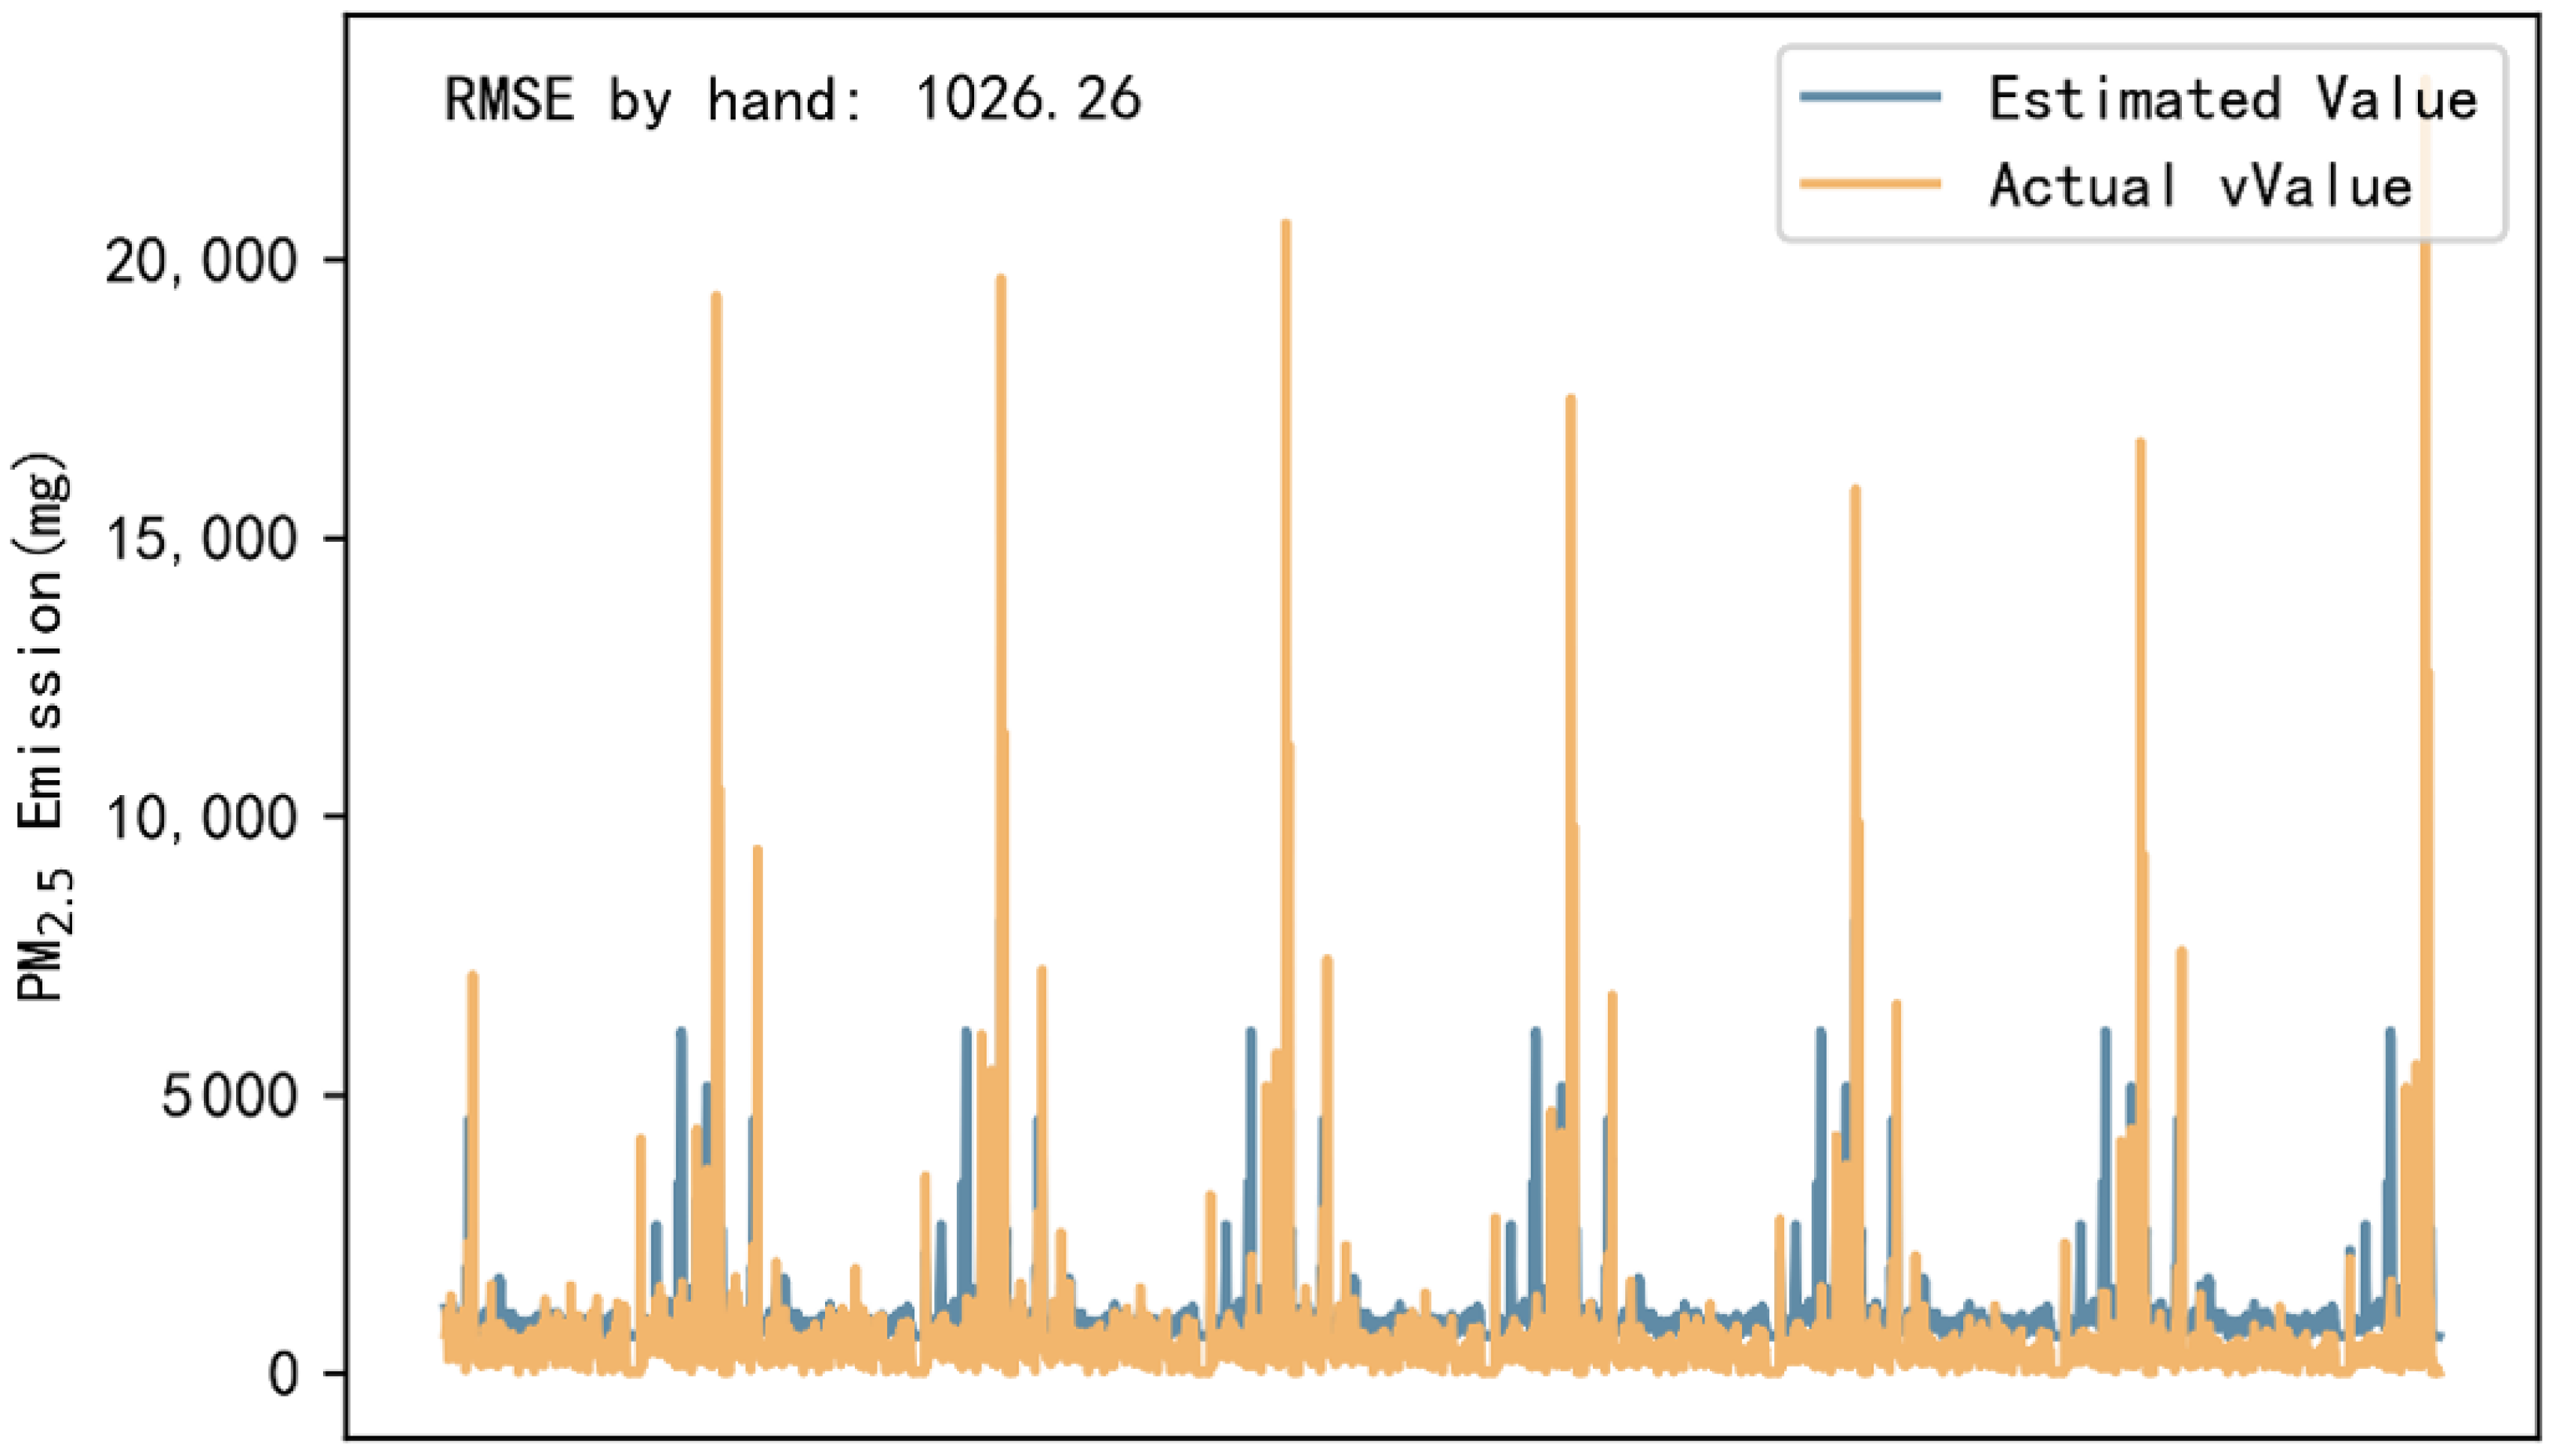
Goodness of fit (R2) and RMSE are important metrics to evaluate the simulation of regression equations and have been used in many previous studies. Su (2014) simulated and estimated the CO2 emissions of energy consumption in China using statistical and DMSP/OLS data from various provinces and cities, and the RMSE of their model is 943.79. Ji (2019) used DMSP/OLS data to simulate the PM2.5 emissions of 1995, 2000, 2005, and 2010 at the level of cities. The RMSE and R2 in their fitting model are 0.58 and 1038.29 in 1995, 0.62 and 873.71 in 2000, 0.56 and 1113.45 in 2005, and 0.73 and 775.30 in 2010. In this study, we estimate PM2.5 emissions using city-level nighttime light data from 2012 to 2018 and compare the estimated value with the actual value to verify the accuracy of the model. Figure 3 shows a comparison of actual PM2.5 and estimated PM2.5 emission from different cities from 2012 to 2018. The data show that the RMSE and R2 of our model are 1026 and 0.746. By comparing with previous studies, our method of simulating PM2.5 emission using Flint nighttime light data is feasible and reliable.
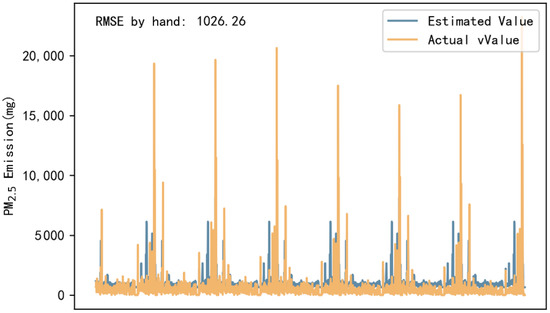
Figure 3.
Root mean square error (RMSE) between PM2.5 estimated data and actual data.
4.3. Spatial and Temporal Dynamics of PM2.5 Emission and Night Light Maps
4.3.1. Spatial and Temporal Dynamics of PM2.5 Emission at Different Scales
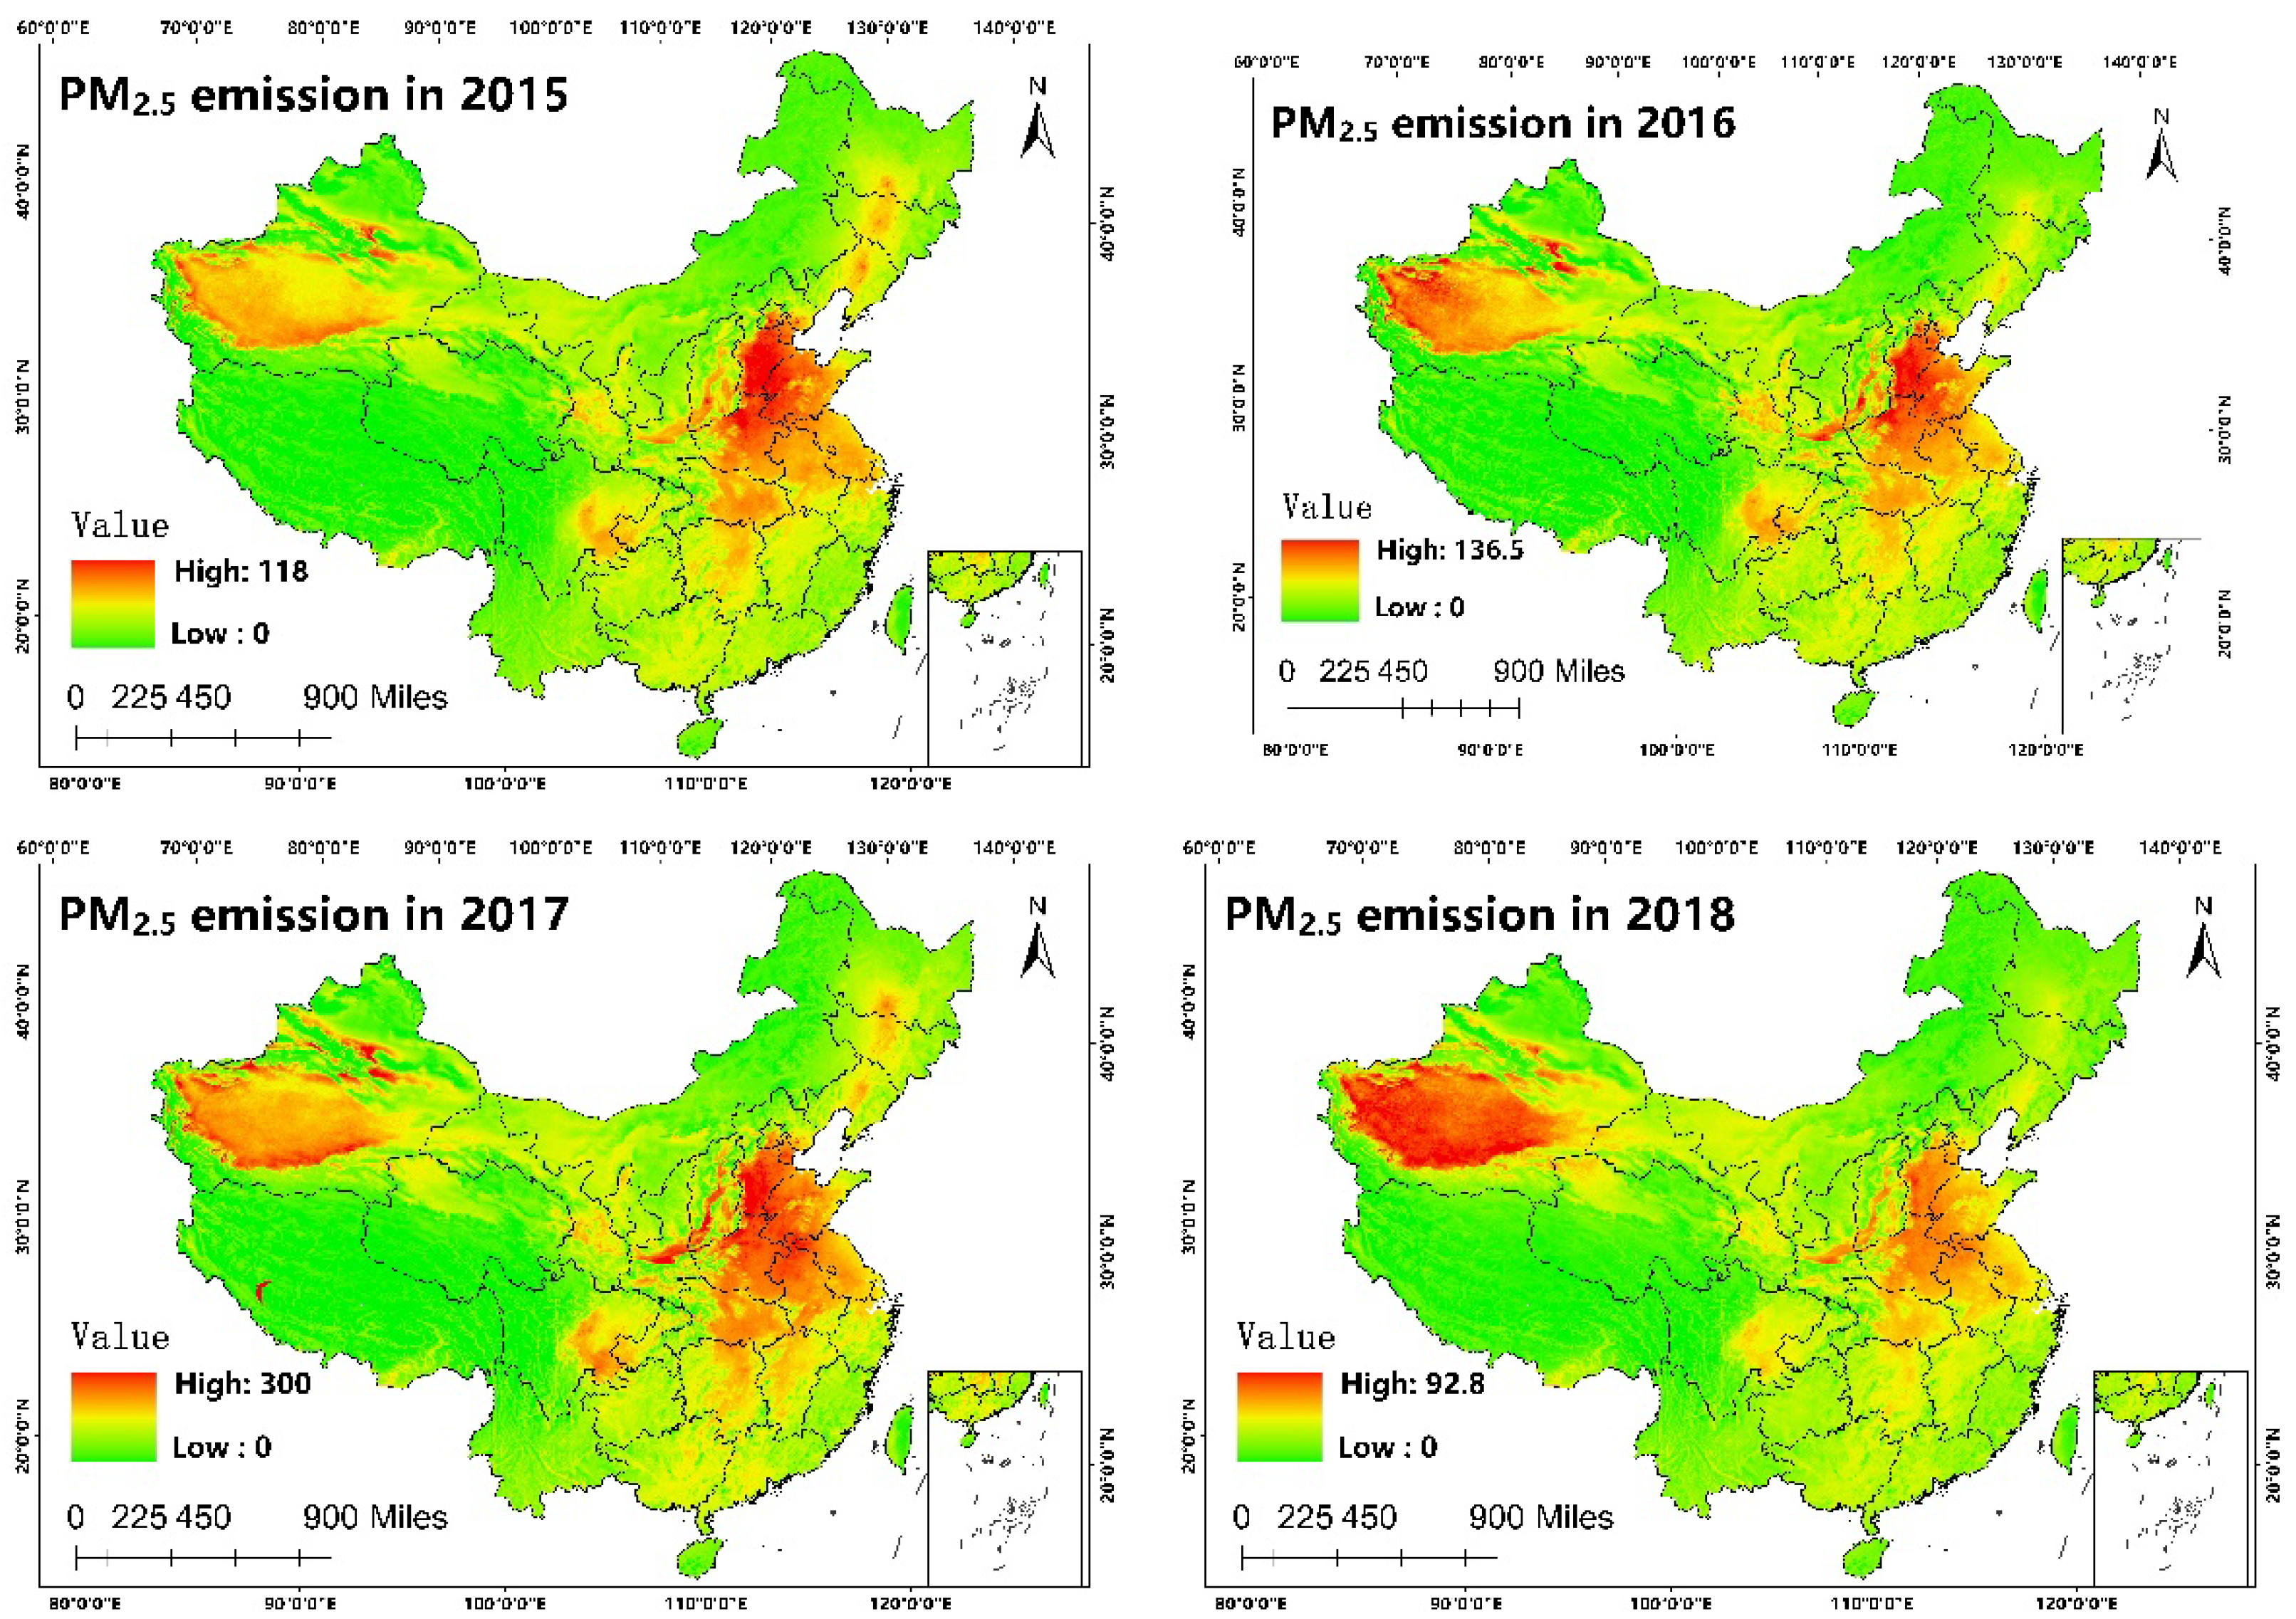
According to the annual average PM2.5 emission grid data from 2012 to 2018, as shown in Figure 4, due to space constraints, only some years are listed. Areas with higher PM2.5 emission in China are mainly located in the plain areas of the middle and lower reaches of the Yellow River and Yangtze River, the eastern coastal areas, the Sichuan Basin, and the southern area of Xinjiang. The high PM2.5 emission is mainly caused by the limited type of local pillar industries, high intensity of human activities, frequent sandstorms in the natural environment, and other factors. At the same time, it can be observed that the polluted area in central China gradually shrinks, and the areas with high PM2.5 emission are gradually reduced.
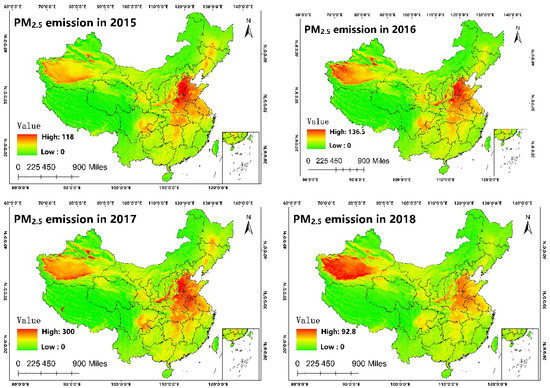
Figure 4.
PM2.5 emission grid imagery of 2015–2018 years.
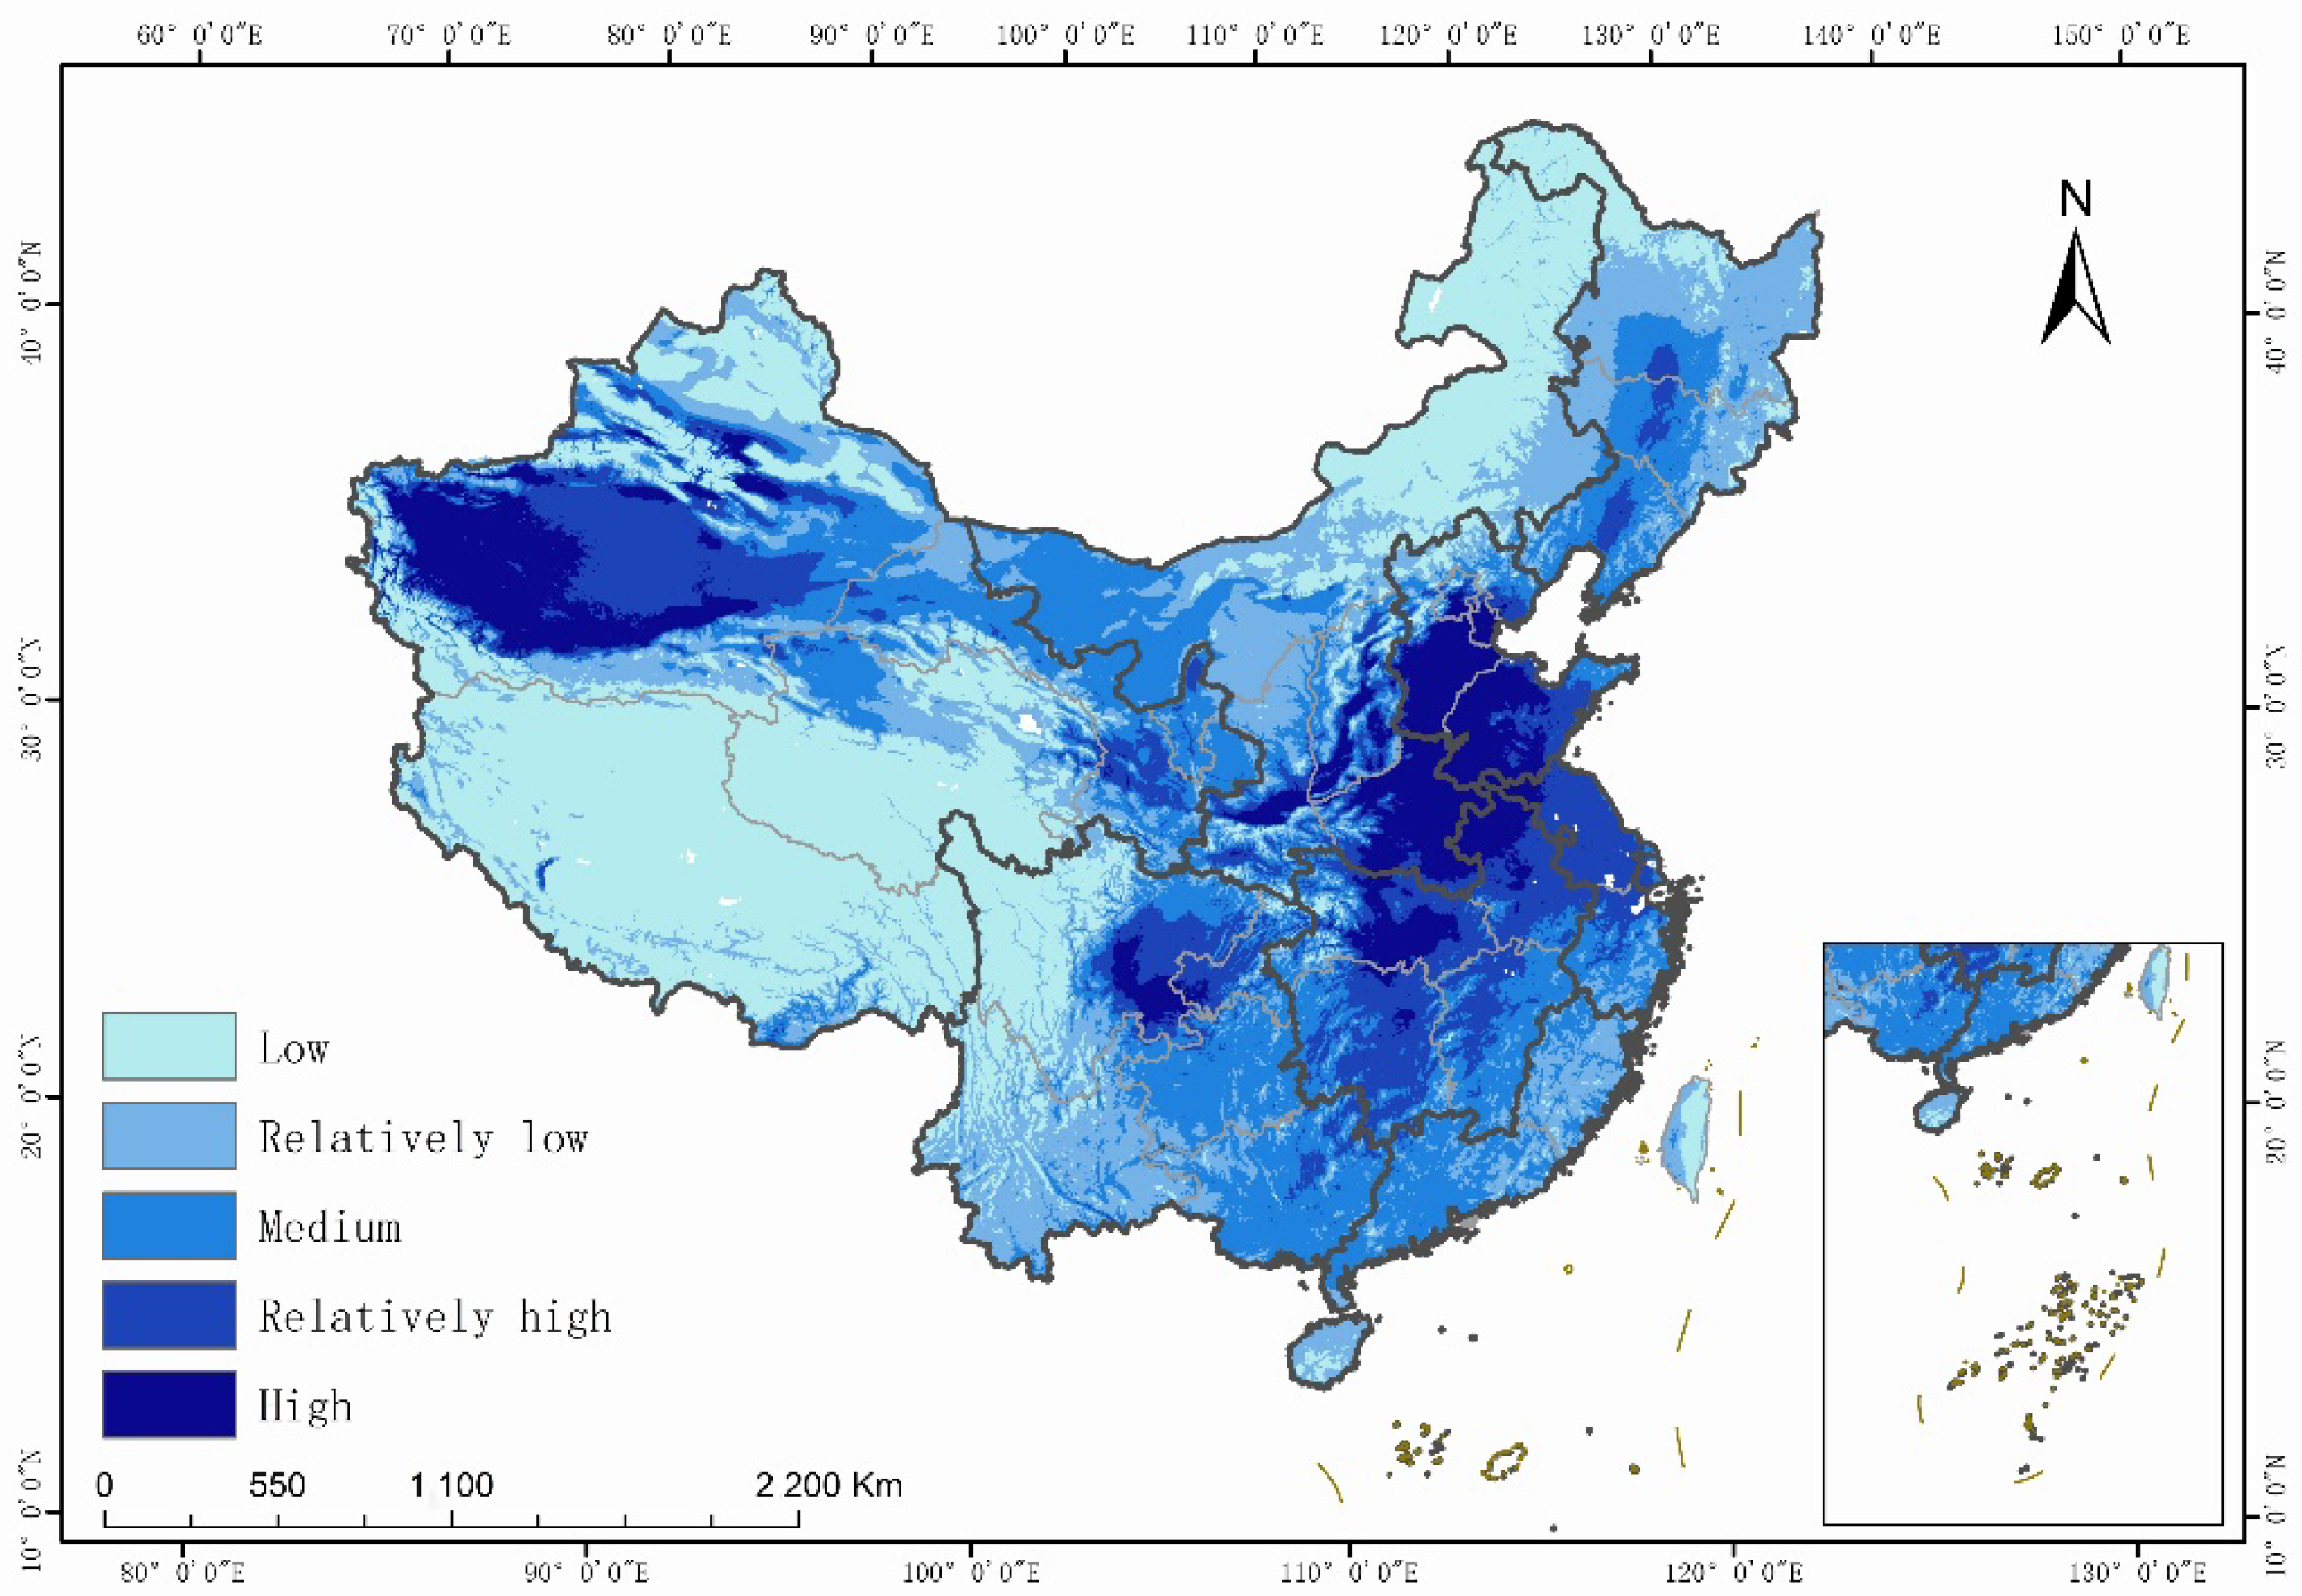
According to the different levels of PM2.5 emission classified in this paper, we use the average PM2.5 emission data from 2012 to 2018 by Equation (3) described in Section 3.3. The area proportion of the average PM2.5 emission of each level is shown in Figure 5. It can be seen from the figure that high-grade, relatively high-grade, and medium-grade areas are mainly concentrated in the central and eastern plains, the Sichuan Basin, and Northwest China, accounting for 8.59%, 12.52%, and 23.08% of the total area of the country, respectively. The relatively low and low grades occupy more than 55% of China’s area, mainly distributed in northeast China, Tibet, and western Sichuan, accounting for 23.47% and 32.34%, respectively, of the total area of the country.

Figure 5.
Average PM2.5 emission of different levels from 2012 to 2018 in China.
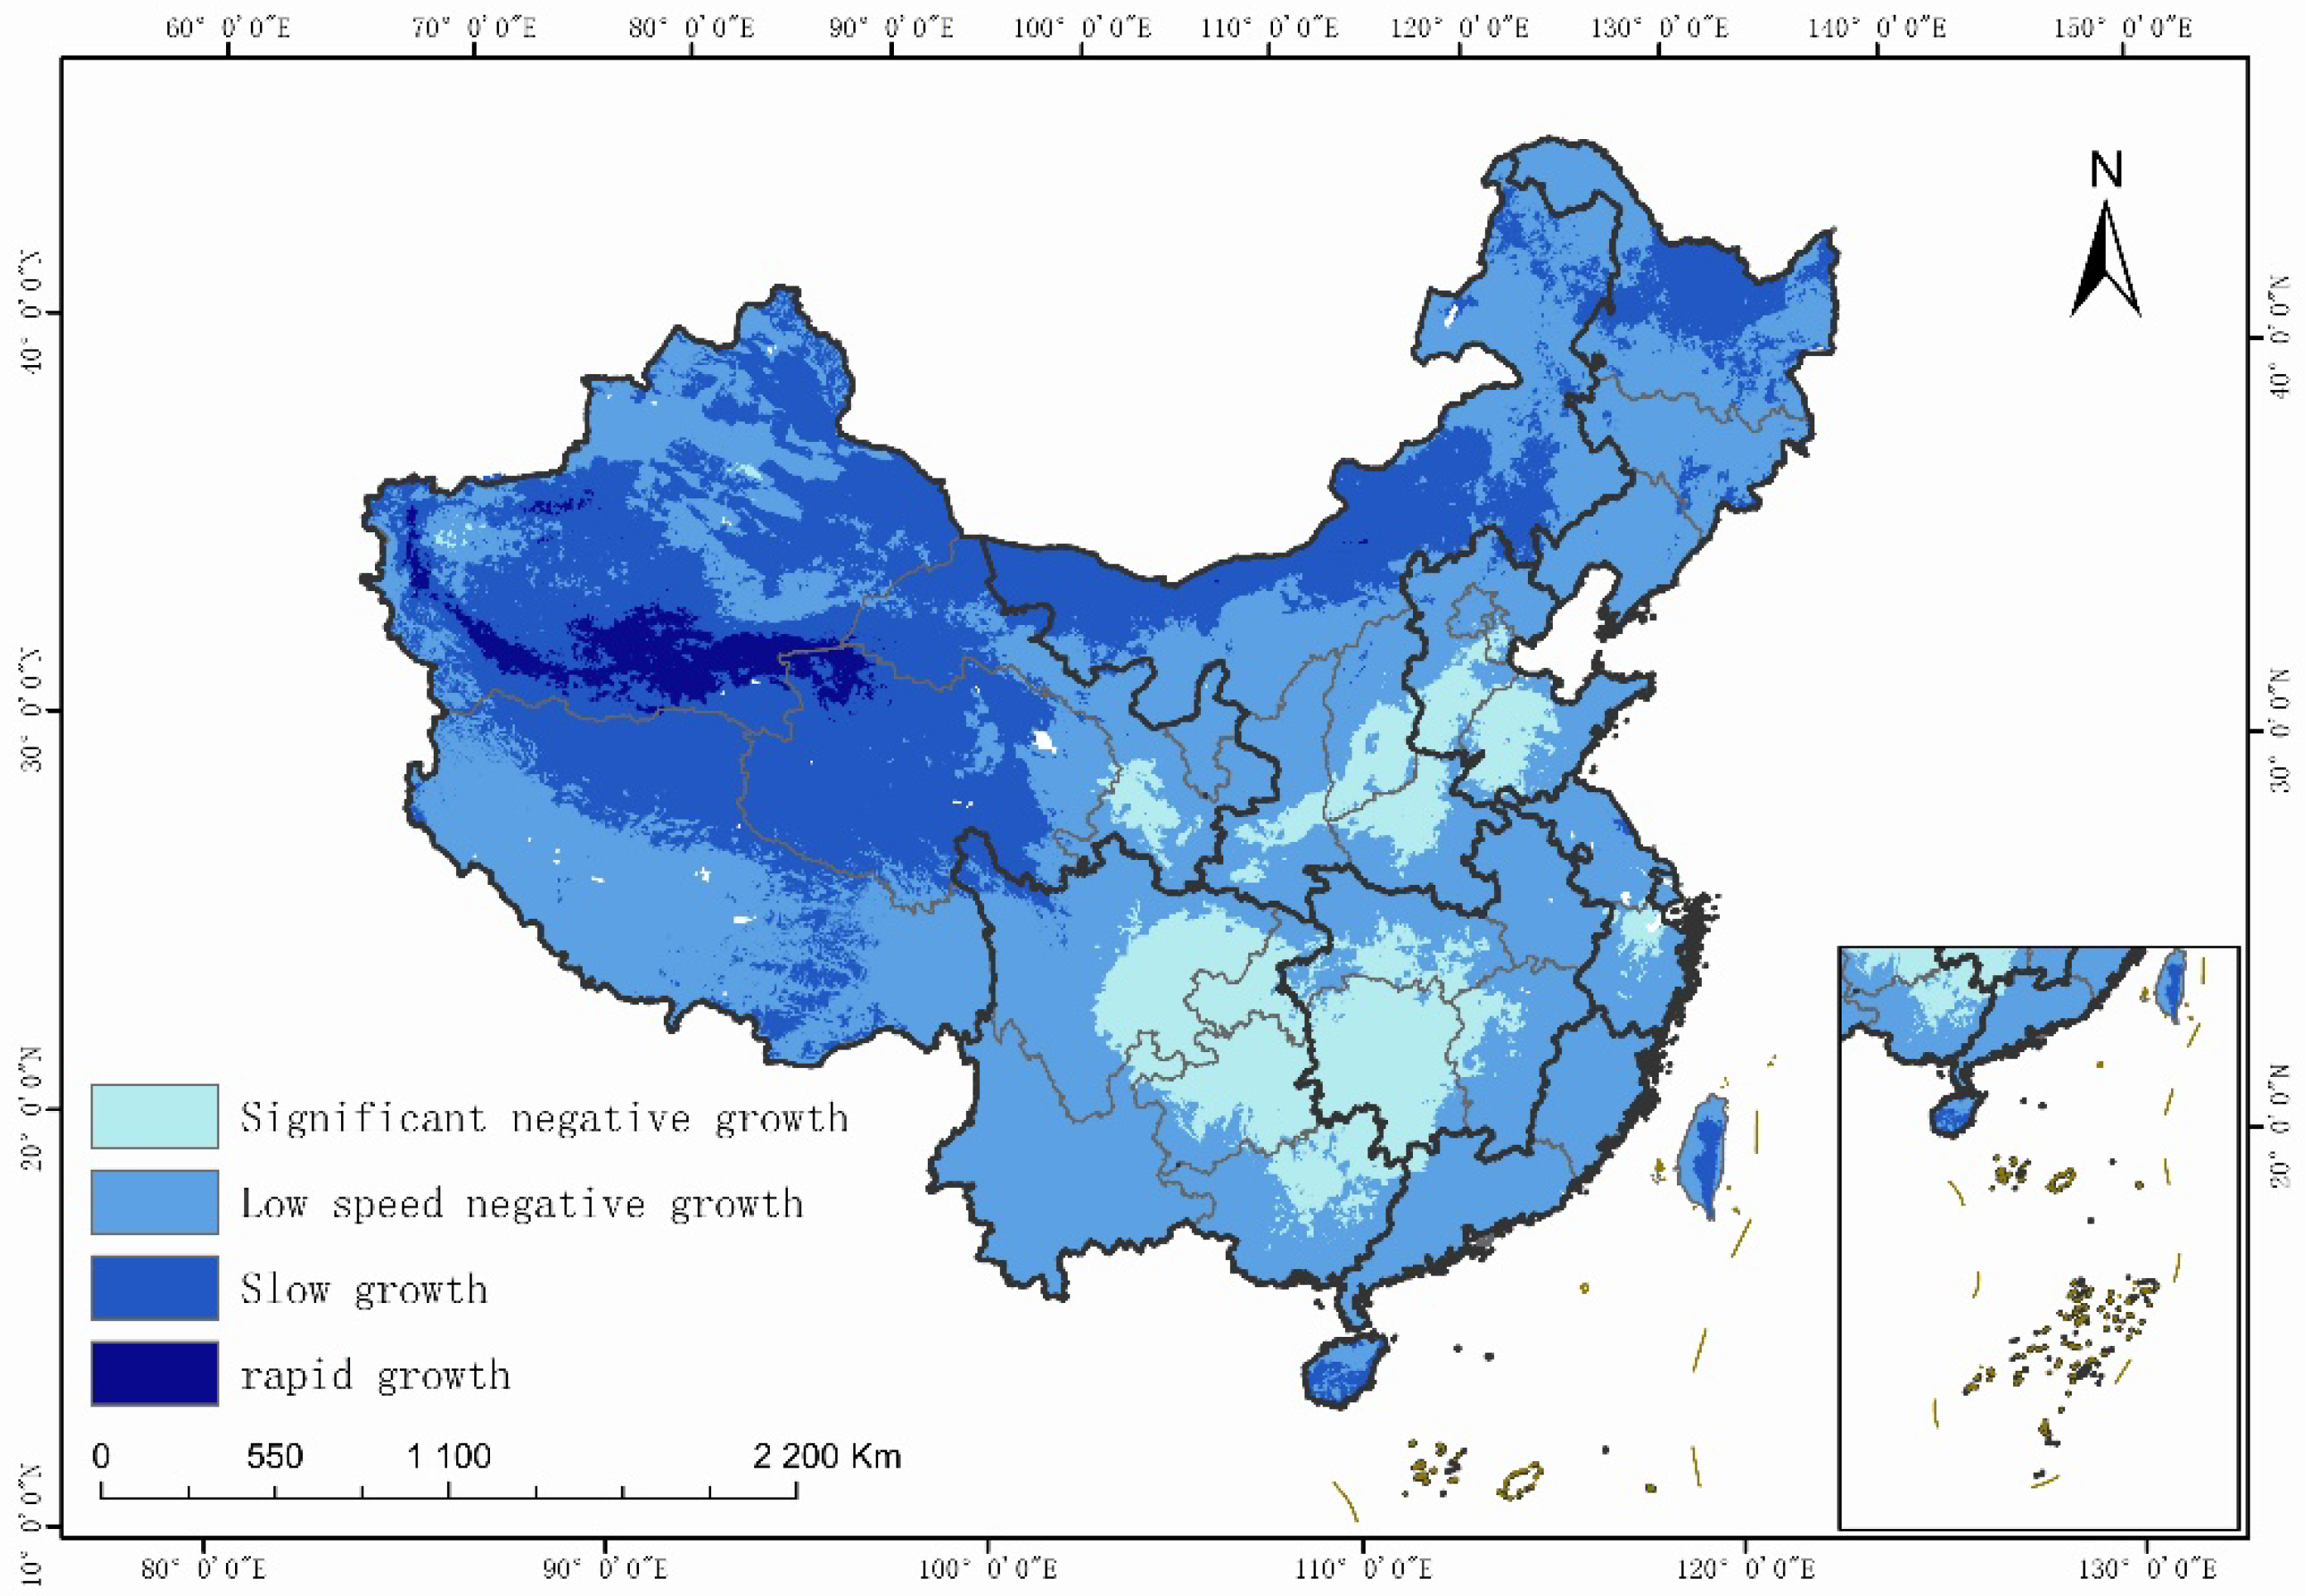
The growth change of PM2.5 in China during 2012–2018 is shown in Figure 6. We employ the temporal variation of PM2.5 emission from 2012 to 2018, as given by Equation (4) in Section 3.3. It can be seen that areas with negative growth of PM2.5 emission during 2012–2018 account for more than 65%, among which areas with significant negative growth are mainly concentrated in the North China Plain, the Sichuan Basin, and the middle and lower reaches of the Yangtze River Plain, accounting for 11.4%. The low-speed negative growth area mainly appeared in central and southern China and part of northeast China, accounting for 57.3%. The regions with an increase in growth are located in the northwest, central and southern parts of Inner Mongolia and the central part of Heilongjiang, accounting for 28.6%. PM2.5 emission increases rapidly in southern Xinjiang and some regions of Qinghai, but the area is small, accounting for only 2.2%. It can be seen that PM2.5 pollution in most areas of China has been alleviated to varying degrees in recent years, but it is undeniable that more than 30% of areas in China still increase.

Figure 6.
Growth change of PM2.5 emission in China from 2012 to 2018.
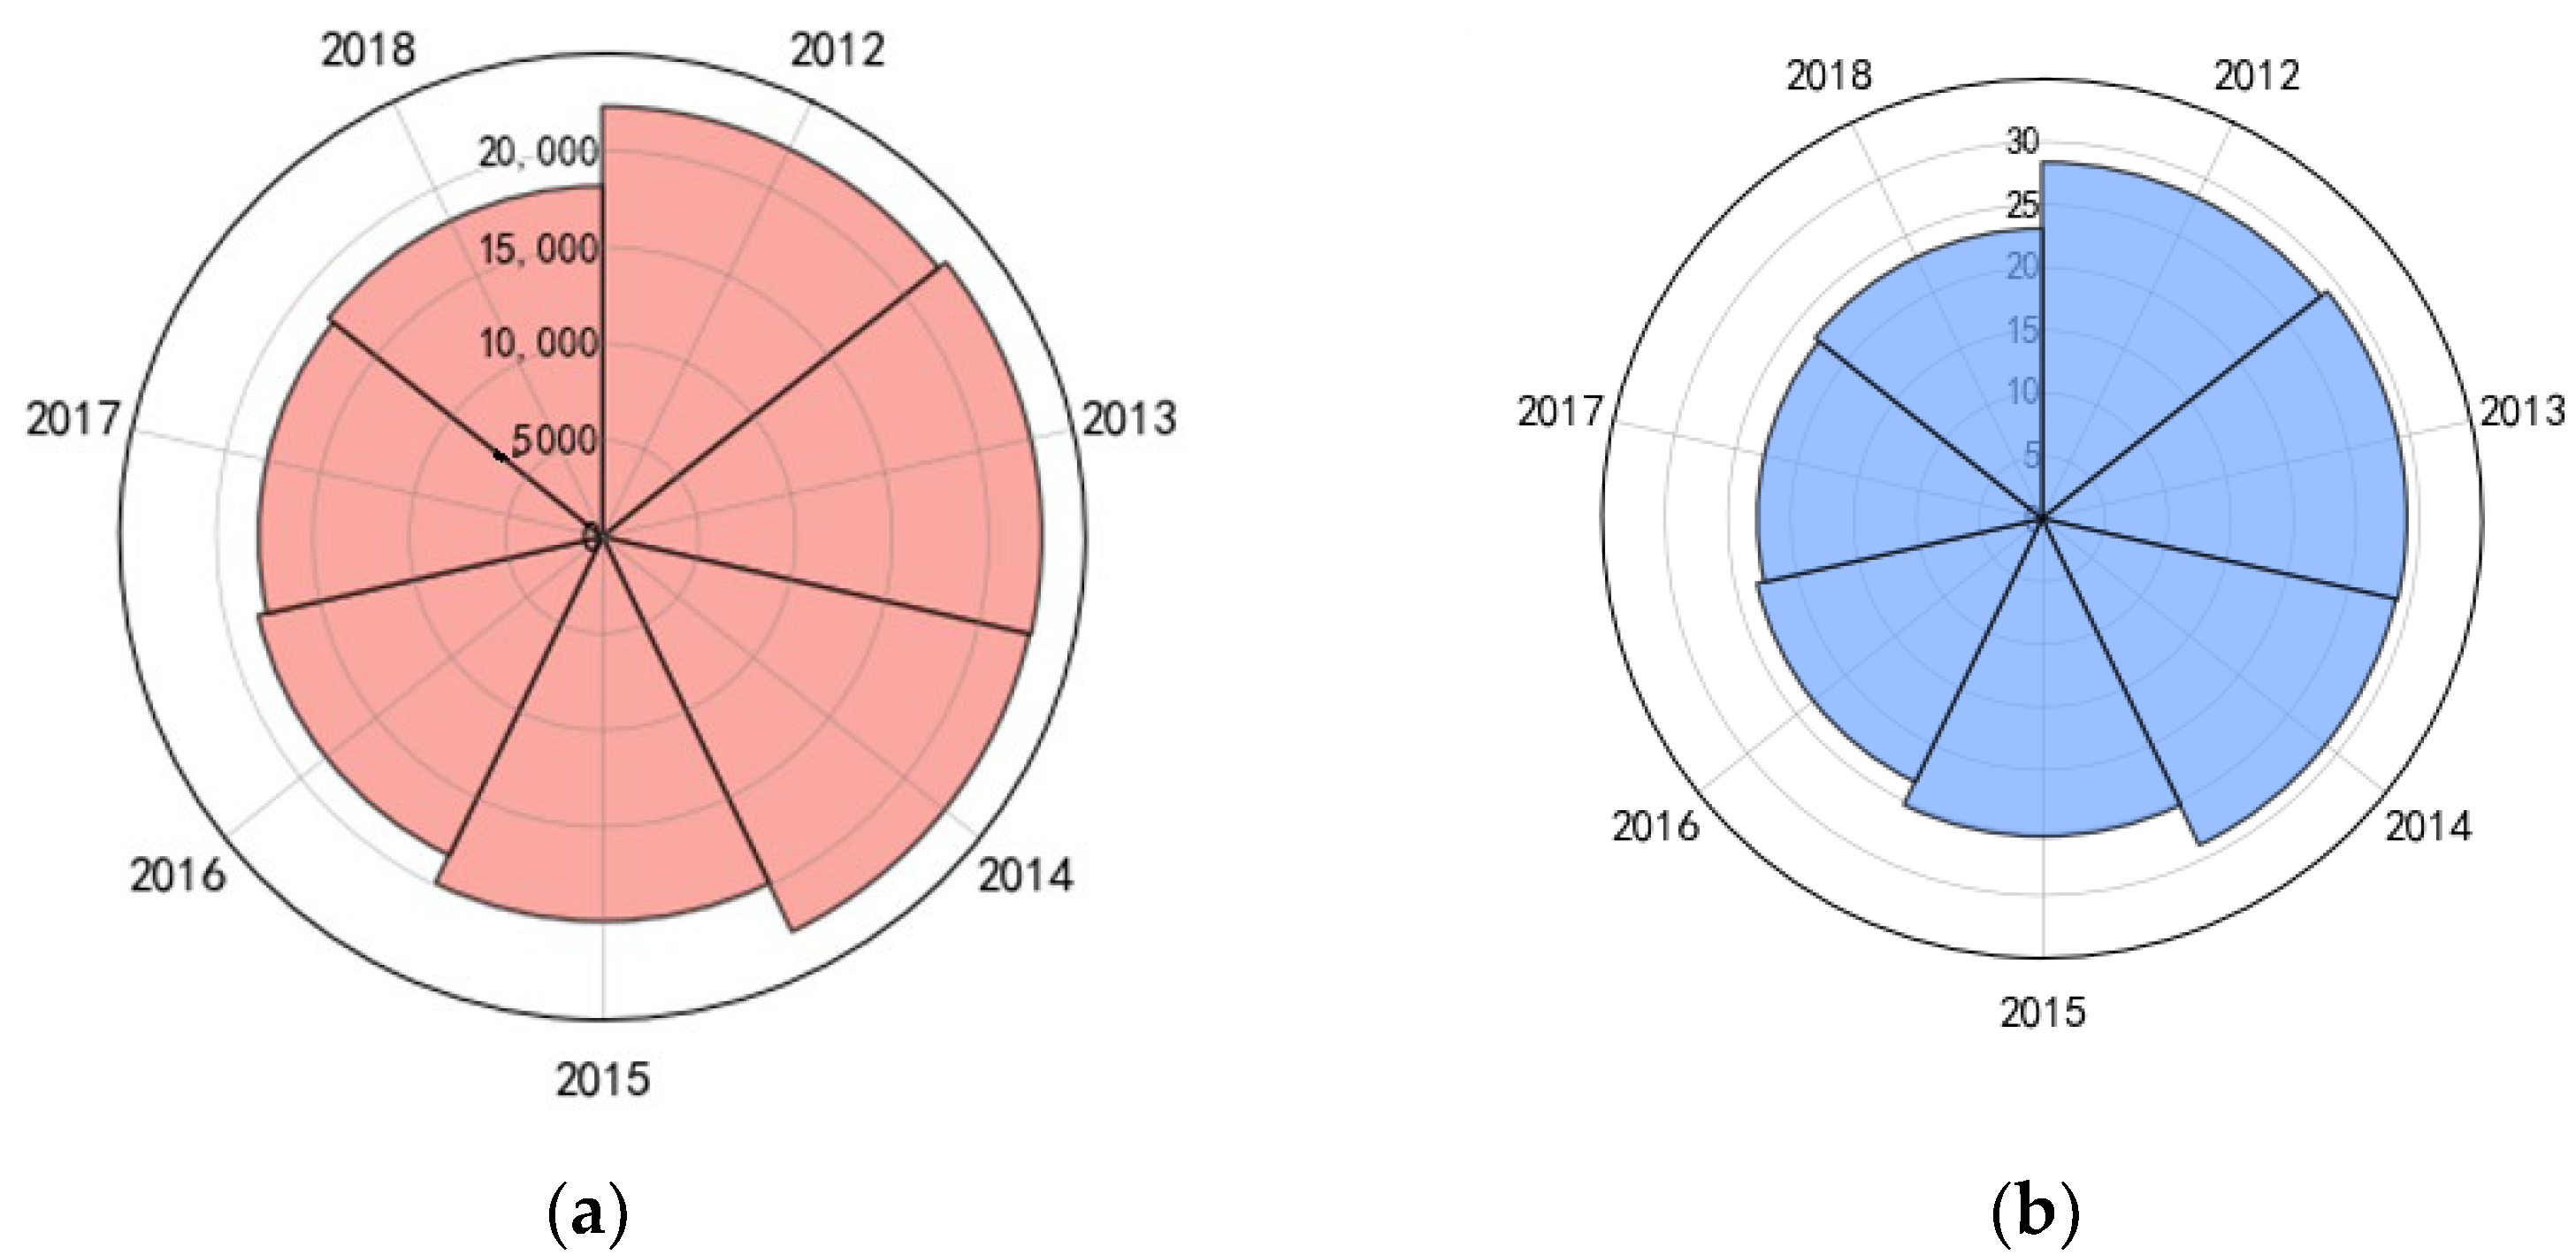
We also make a statistical analysis of the changes of PM2.5 emission in China in each year from 2012 to 2018, as shown in Figure 7. The figure shows the annual changes of the total and the mean PM2.5 air pollution in China from the temporal dimension. It can be seen that both of them show a downward trend. The data in 2013 show a small increase compared with the data in 2012, but began to show a gradual decline after 2013. Although the data rebounded slightly in 2018, they were still much better than the PM2.5 emission in 2012. In general, due to the great attention paid by the Chinese government to environmental protection in recent years, People’s understanding of the need of reducing their carbon footprint and conserving energy is growing. PM2.5 pollution shows a gradual trend of change, and PM2.5 emissions have been significantly reduced. Regions with low PM2.5 emission and relatively low grade account for more than half of China’s land area. In addition, PM2.5 emission shows a negative growth trend in most regions.
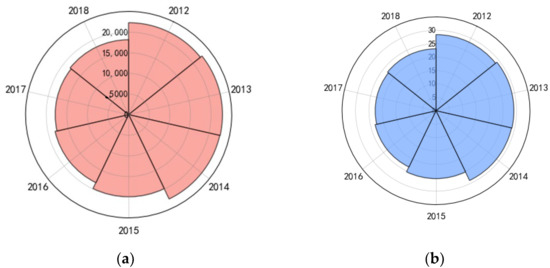
Figure 7.
Annual variation of total and mean PM2.5 emission in China. (a) Annual change of total PM2.5 air pollution. (b) Annual change of mean PM2.5 air pollution.
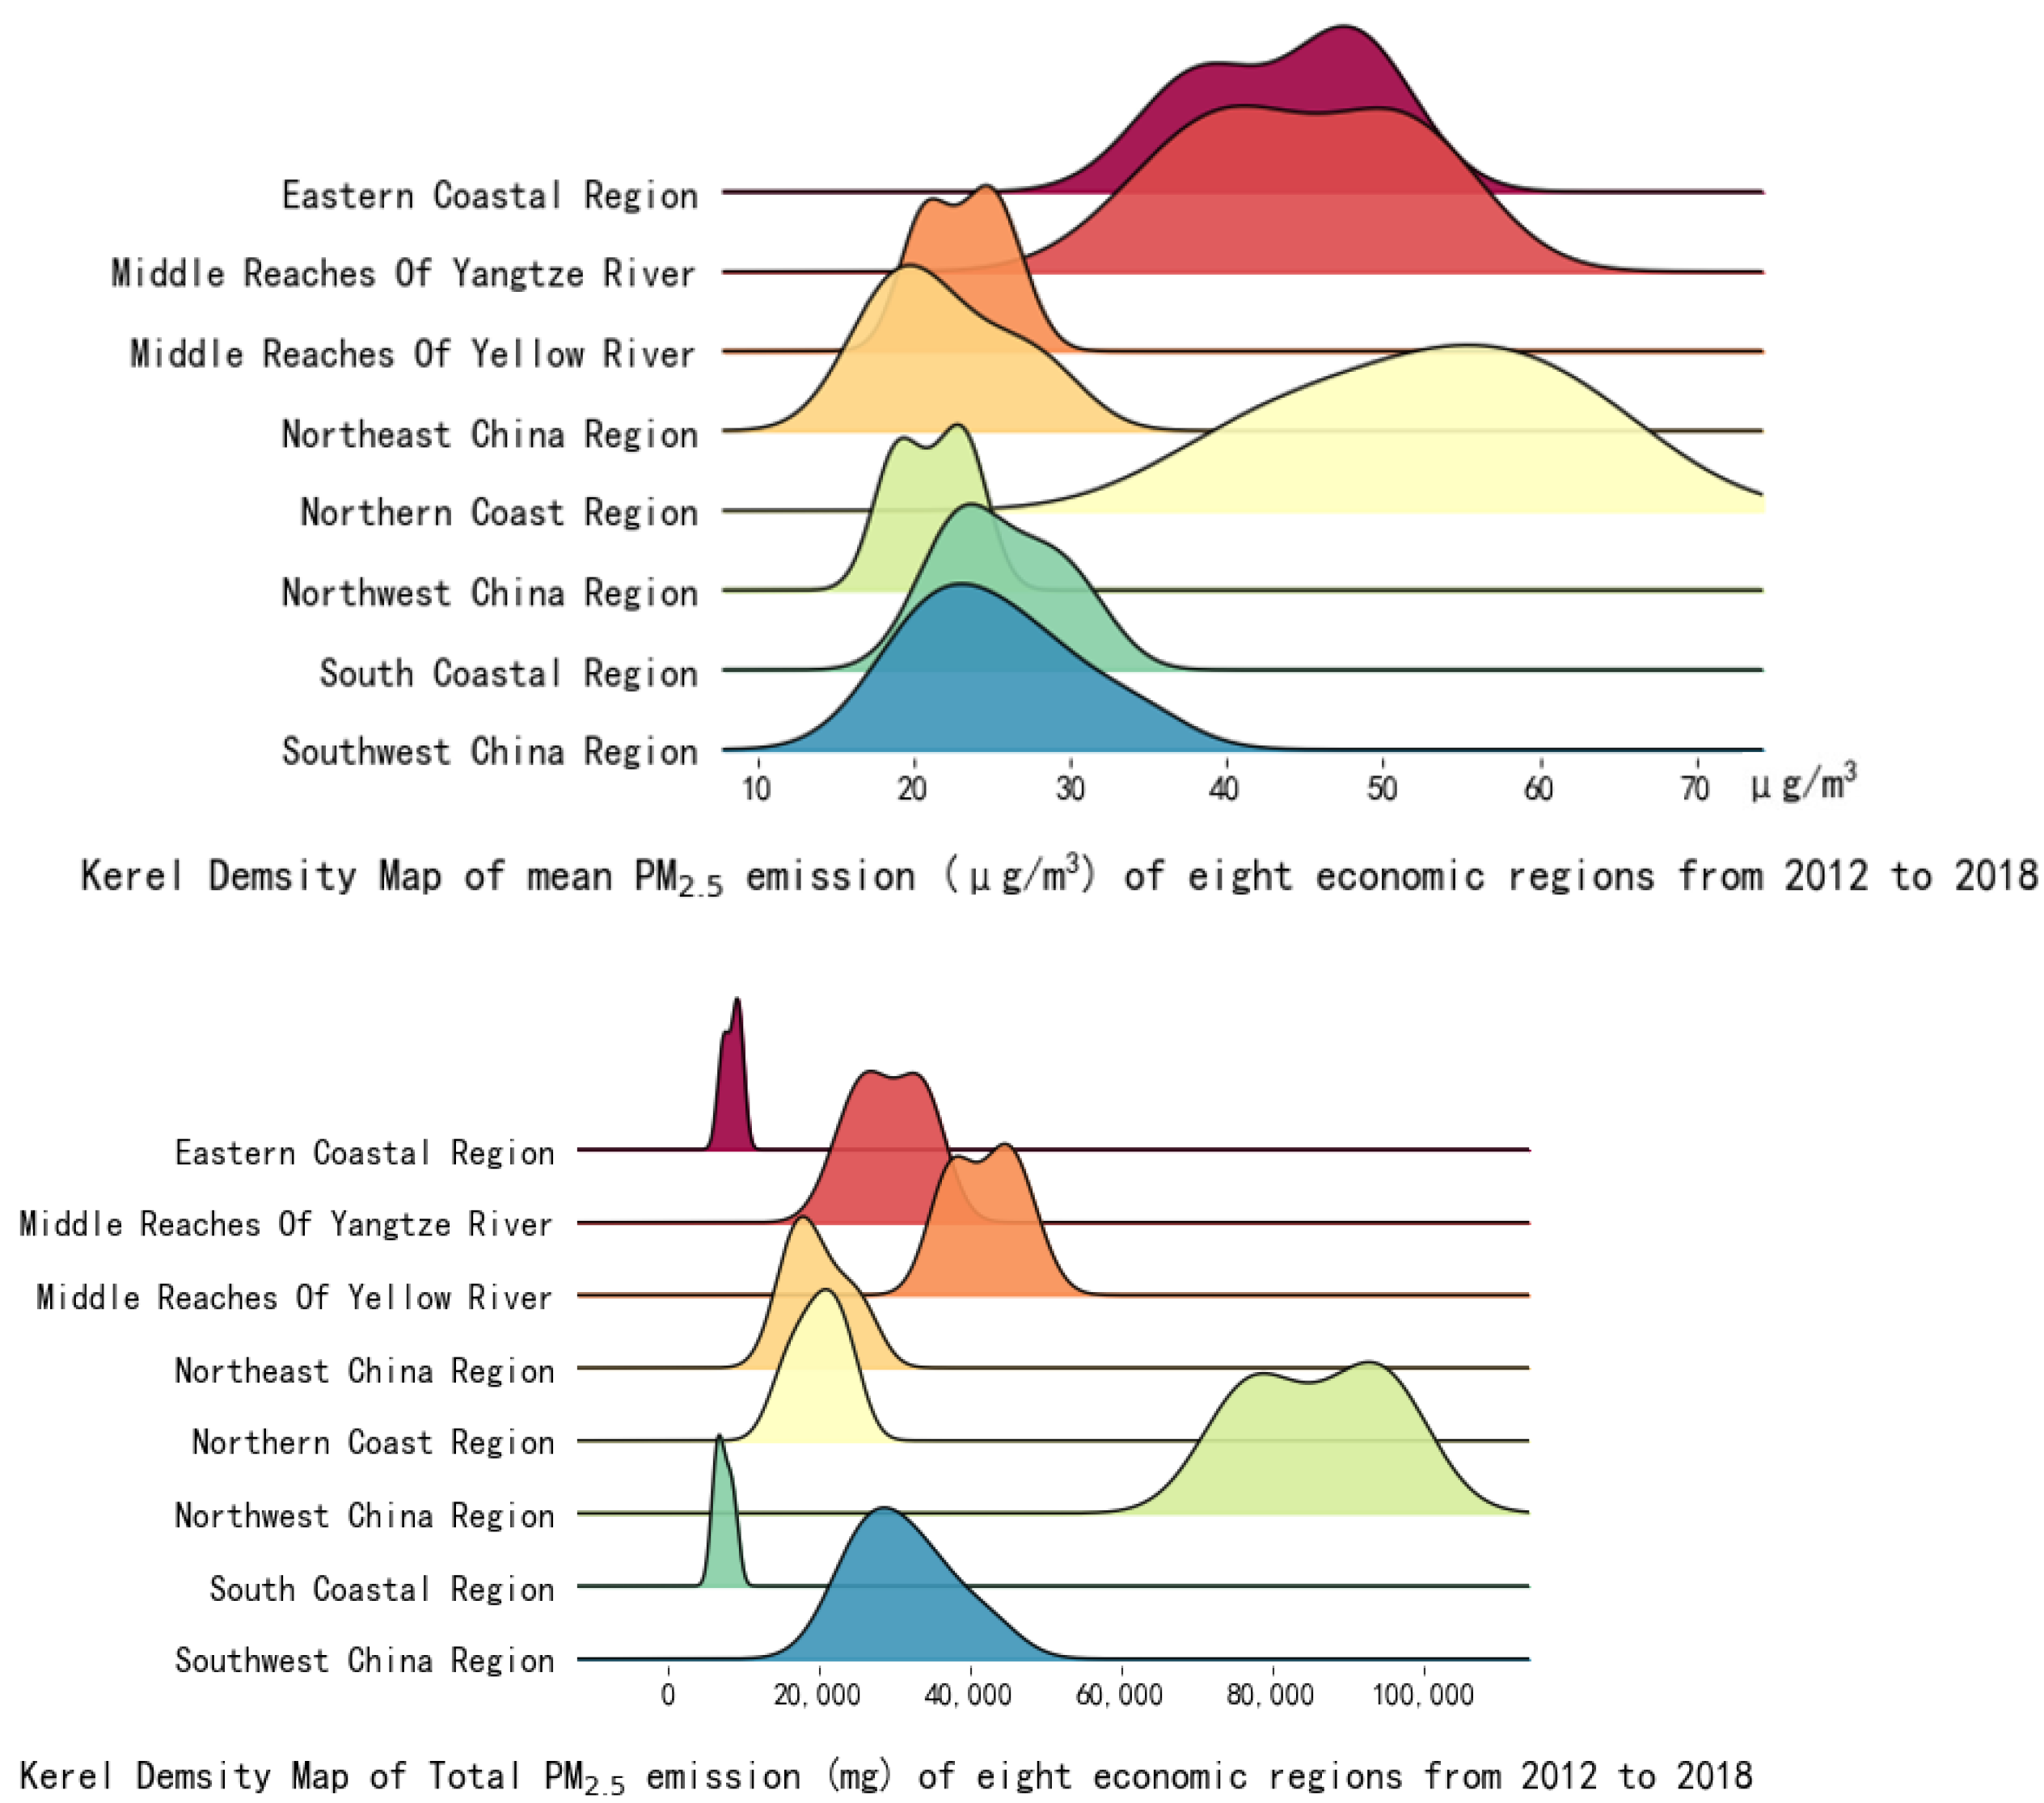
The distribution of the mean PM2.5 emission and total PM2.5 emission of the eight major economic regions is shown in Figure 8. We can see that there are large differences in data among different areas. The northern coastal area has the highest proportion of high grade, the southern coastal region has the lowest proportion of high grade, the northwest region has the highest proportion of low grade, and the eastern seaboard has the lowest proportion of low grade.
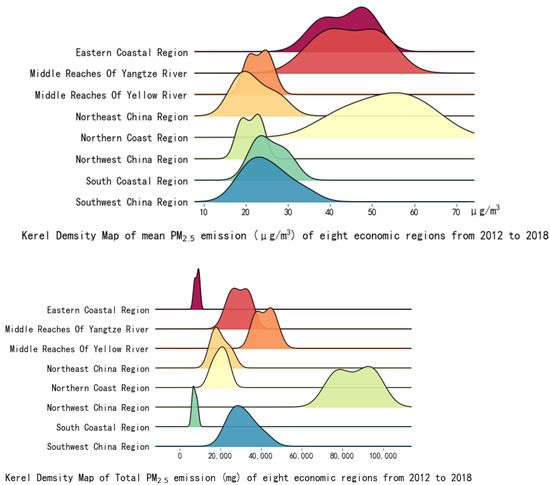
Figure 8.
Mean and total PM2.5 emission of eight economic regions from 2012 to 2018.
From the data distribution of PM2.5 emission in eight economic regions, the average PM2.5 emission is within the range of 10–60 ug/m3. Among them, PM2.5 emission in the northern and eastern coastal areas and the middle reaches of the Yangtze River are located in the ranges with higher mean values, while concentrations in the northeast, the southern coastal areas, the great northwest, the southwest, and the middle reaches of the Yellow River are located in the ranges with lower values. However, the data distribution of total PM2.5 emission shows different results. Figure 8 displays that most of the total PM2.5 emission in the eight economic regions are in the range of 900,000–6,000,000 ug/m3, while the total PM2.5 emission in the northwest is much higher than that in other regions. The data are in the range of 6,000,000–12,000,000 ug/m3, and the total PM2.5 air pollution in the southern coastal area is the lowest in the eight economic regions.
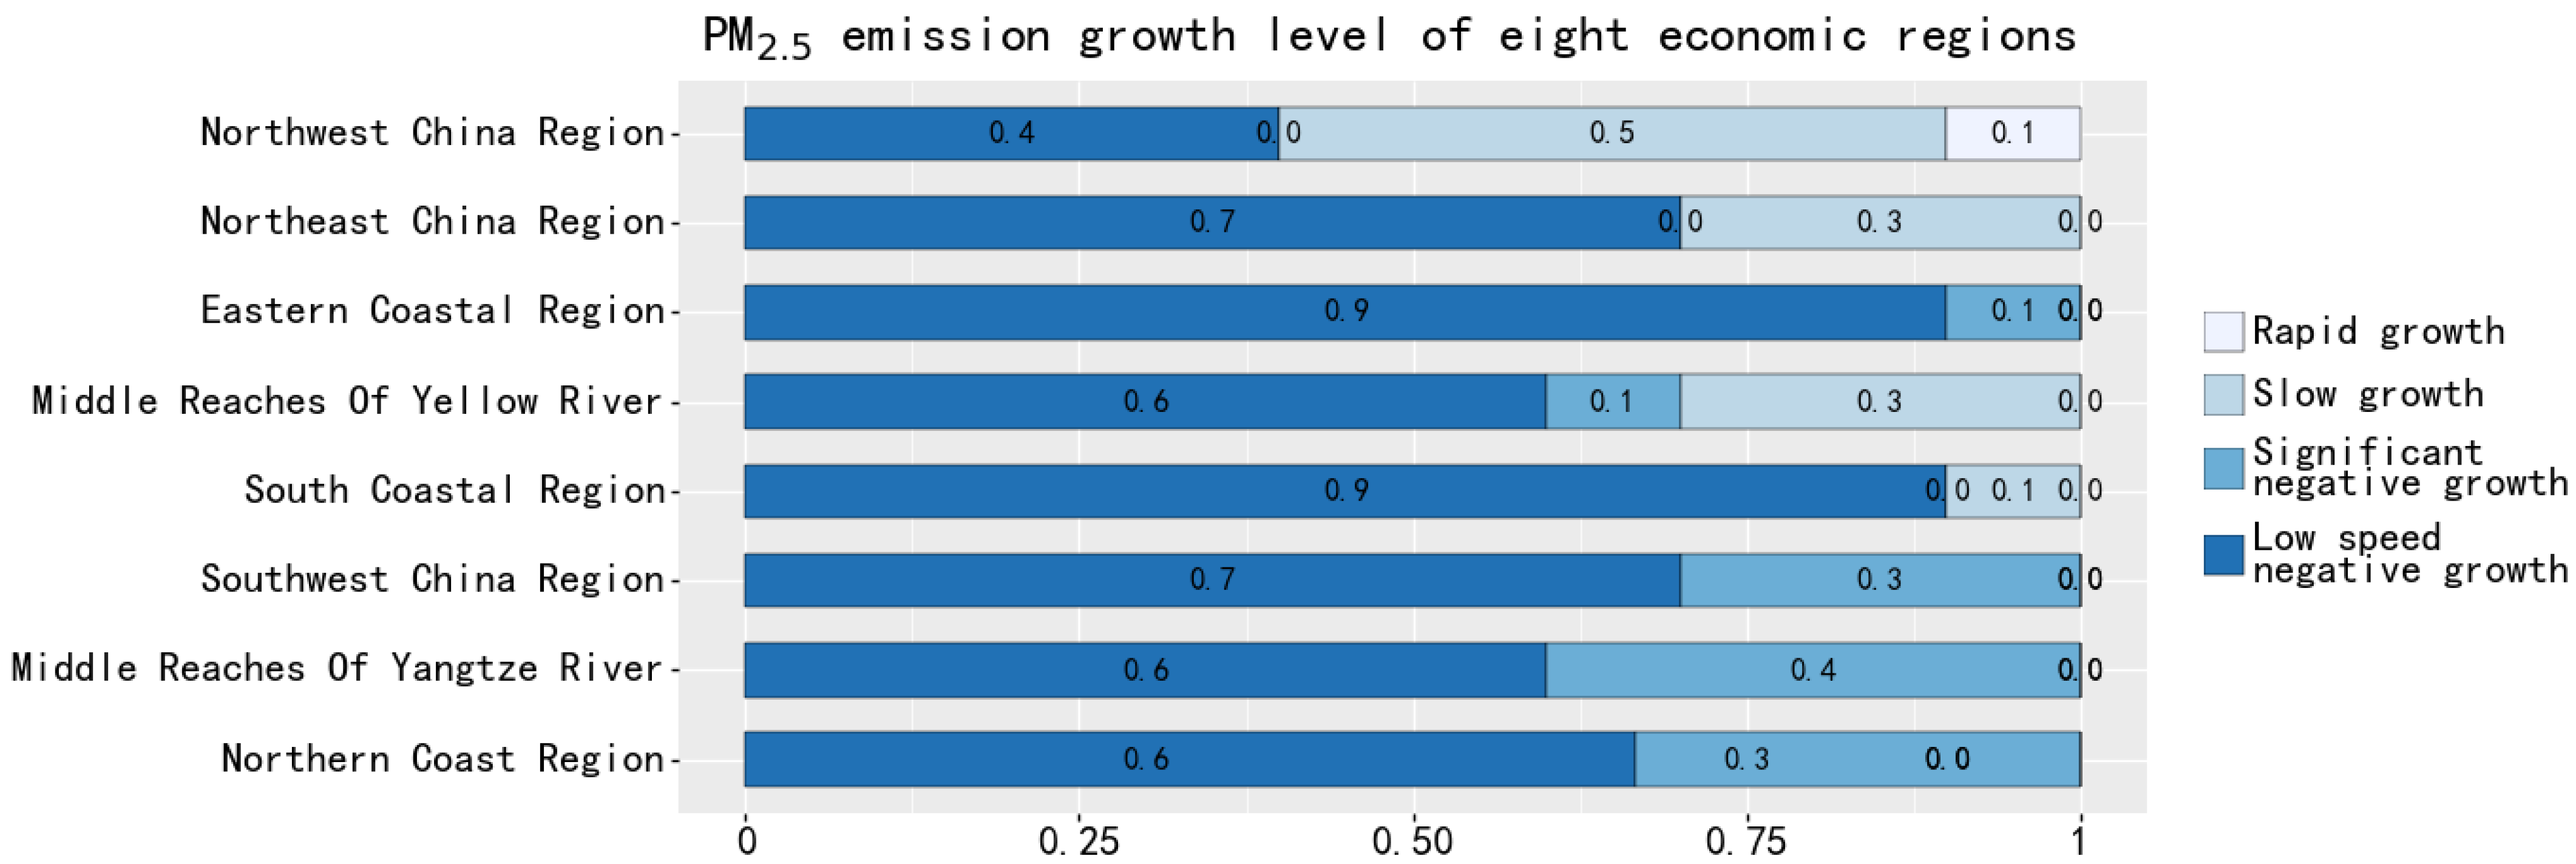
The growing rate of PM2.5 emission in the eight economic regions is similar to the whole country, showing negative growth, as shown in Figure 9. The middle reaches of the Yangtze River region have the highest proportion of significant negative growth, the southern coastal region has the highest proportion of low-speed negative growth, the northwest region has the highest proportion of low-speed and high-speed growth, and the other regions have no high-speed growth, except for the northwest region. From 2012 to 2018, the total PM2.5 emission in eight economic regions and other regions shows a decreasing trend. Except for northeast China and northwest China, these two areas still show an increasing trend in 2018.
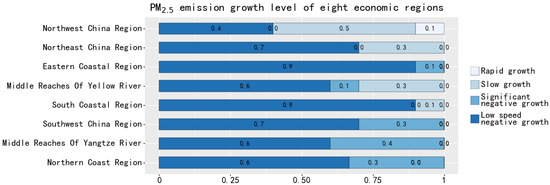
Figure 9.
Area proportion of PM2.5 growth rate in eight economic regions.
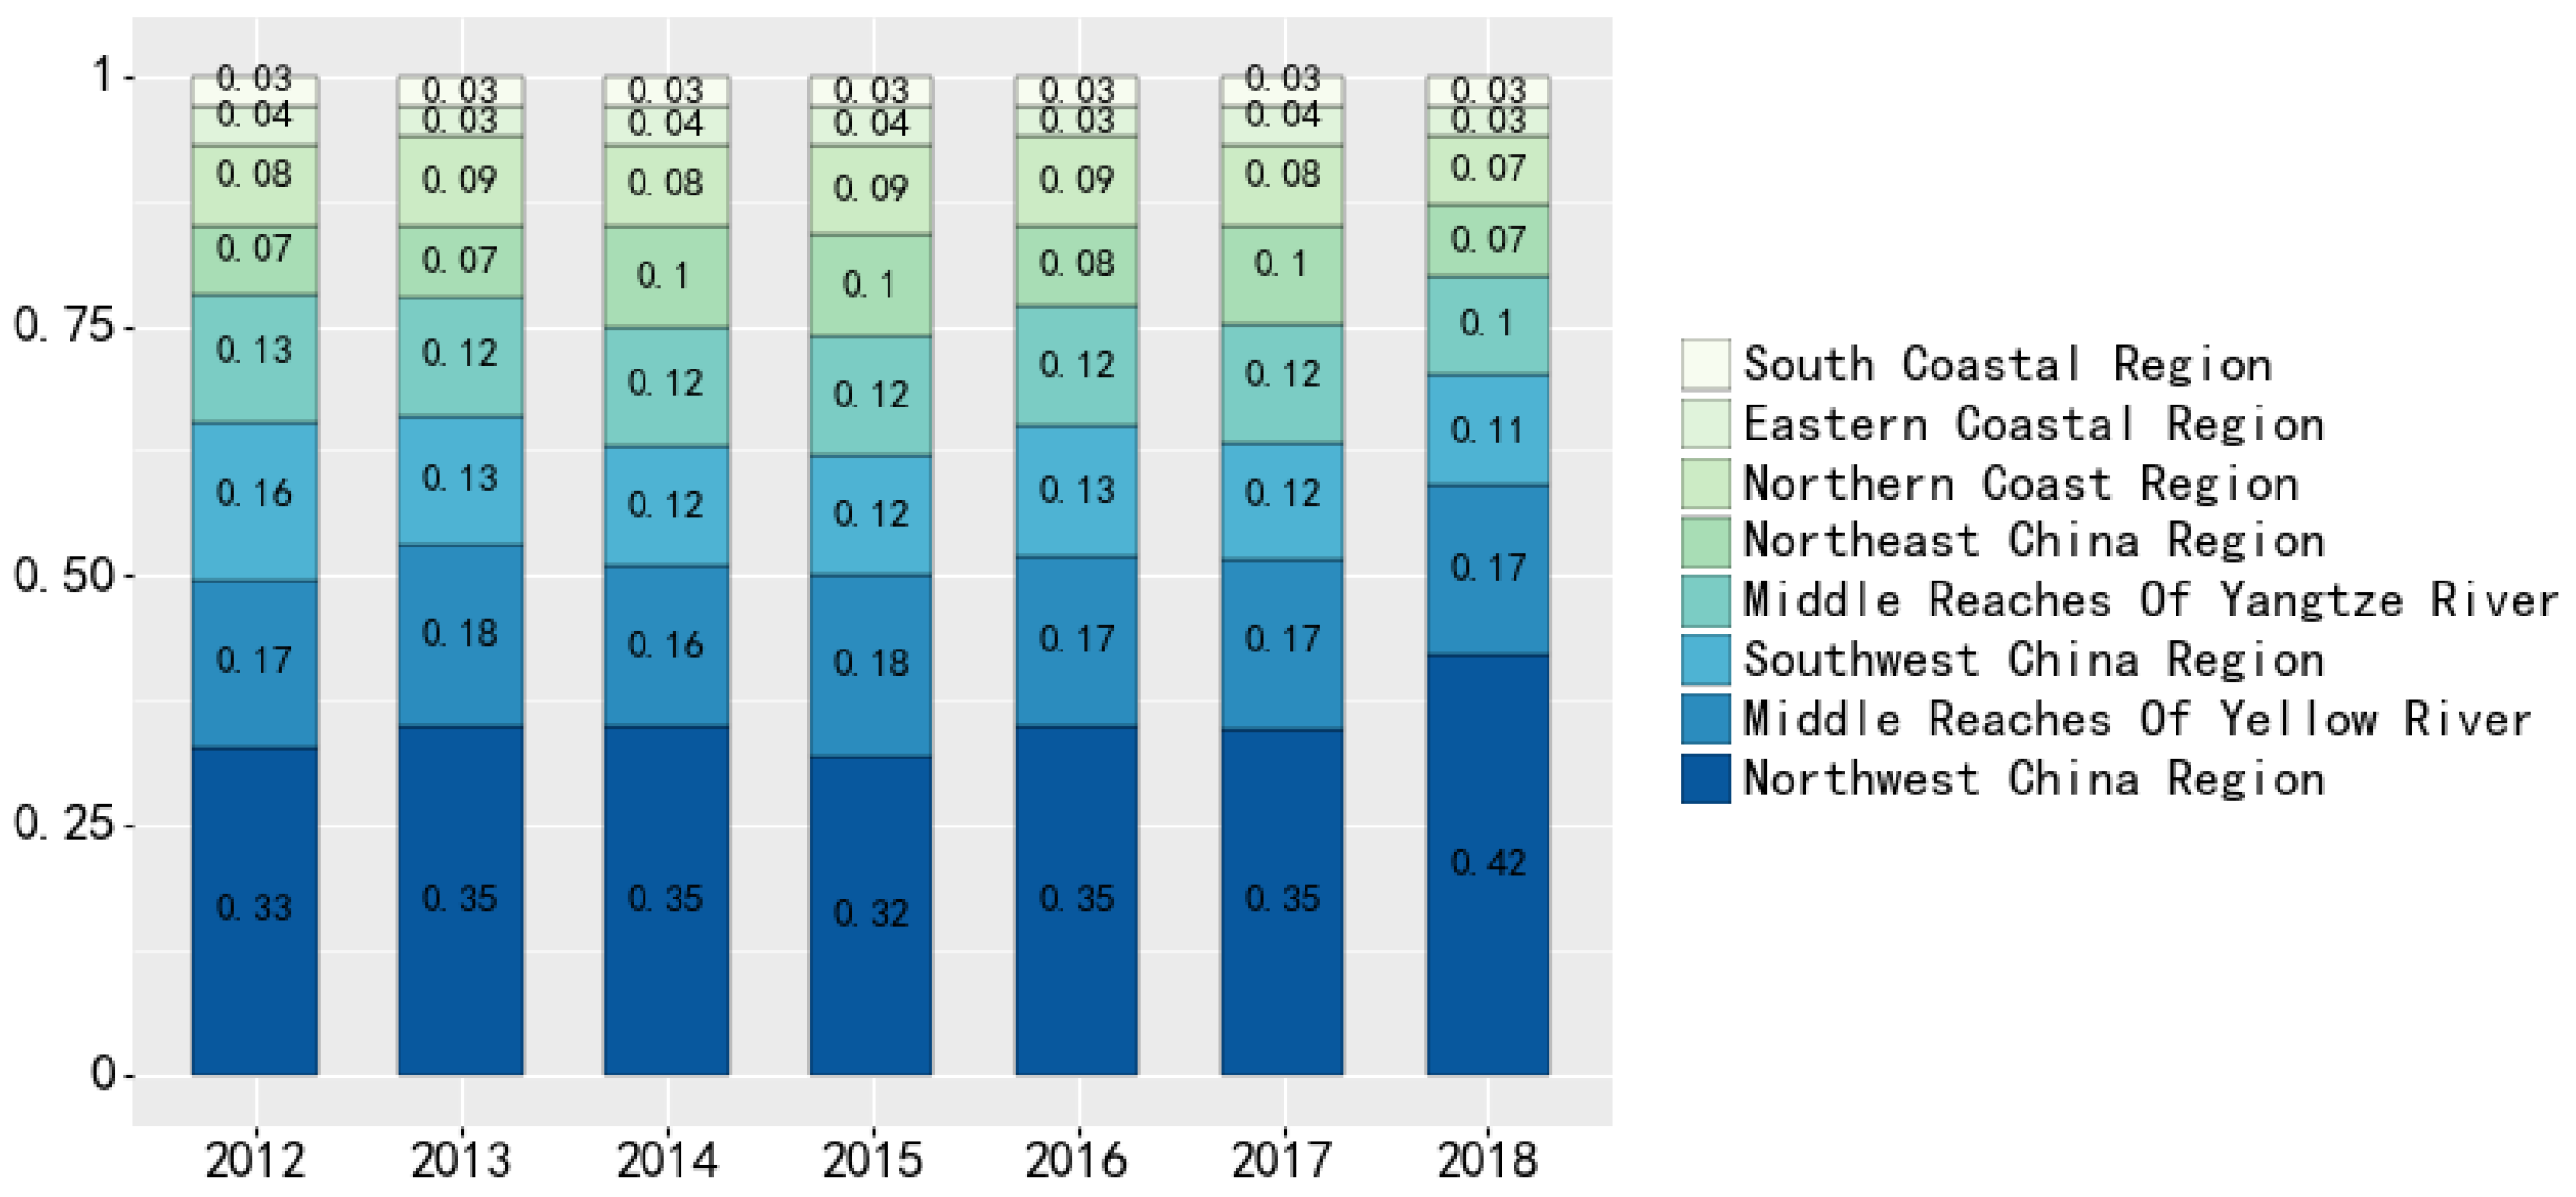
From the perspective of the proportion of regional and overall PM2.5 emissions in the country, as shown in Figure 10. PM2.5 emissions in Northwest China are the highest in the eight economic regions, accounting for more than 32%, and showed an increasing trend year by year during 2014–2018. The middle reaches of the Yellow River accounted for the second, accounting for more than 16% and with little change in the data. Southwest China ranks third, accounting for more than 12%, and the proportion has a fluctuating trend of decline. The middle reaches of the Yangtze River accounted for more than 10%, and the data changed little. Northeast China accounted for more than 7%, and the data showed an increasing trend from 2012 to 2015 and then decreased again from 2017 to 2018, showing the characteristics of “rising first and then falling”. The northern coastal area, the eastern coastal area, and the southern coastal area are relatively small, accounting for 10–15% in total; meanwhile, the data change little.
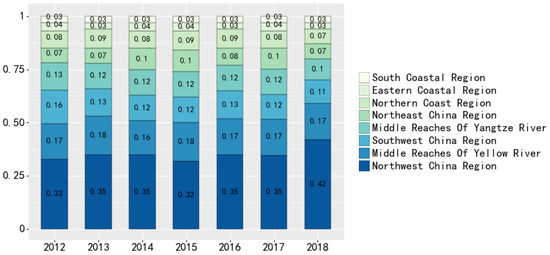
Figure 10.
Annual proportion change of PM2.5 air pollution in eight economic areas.
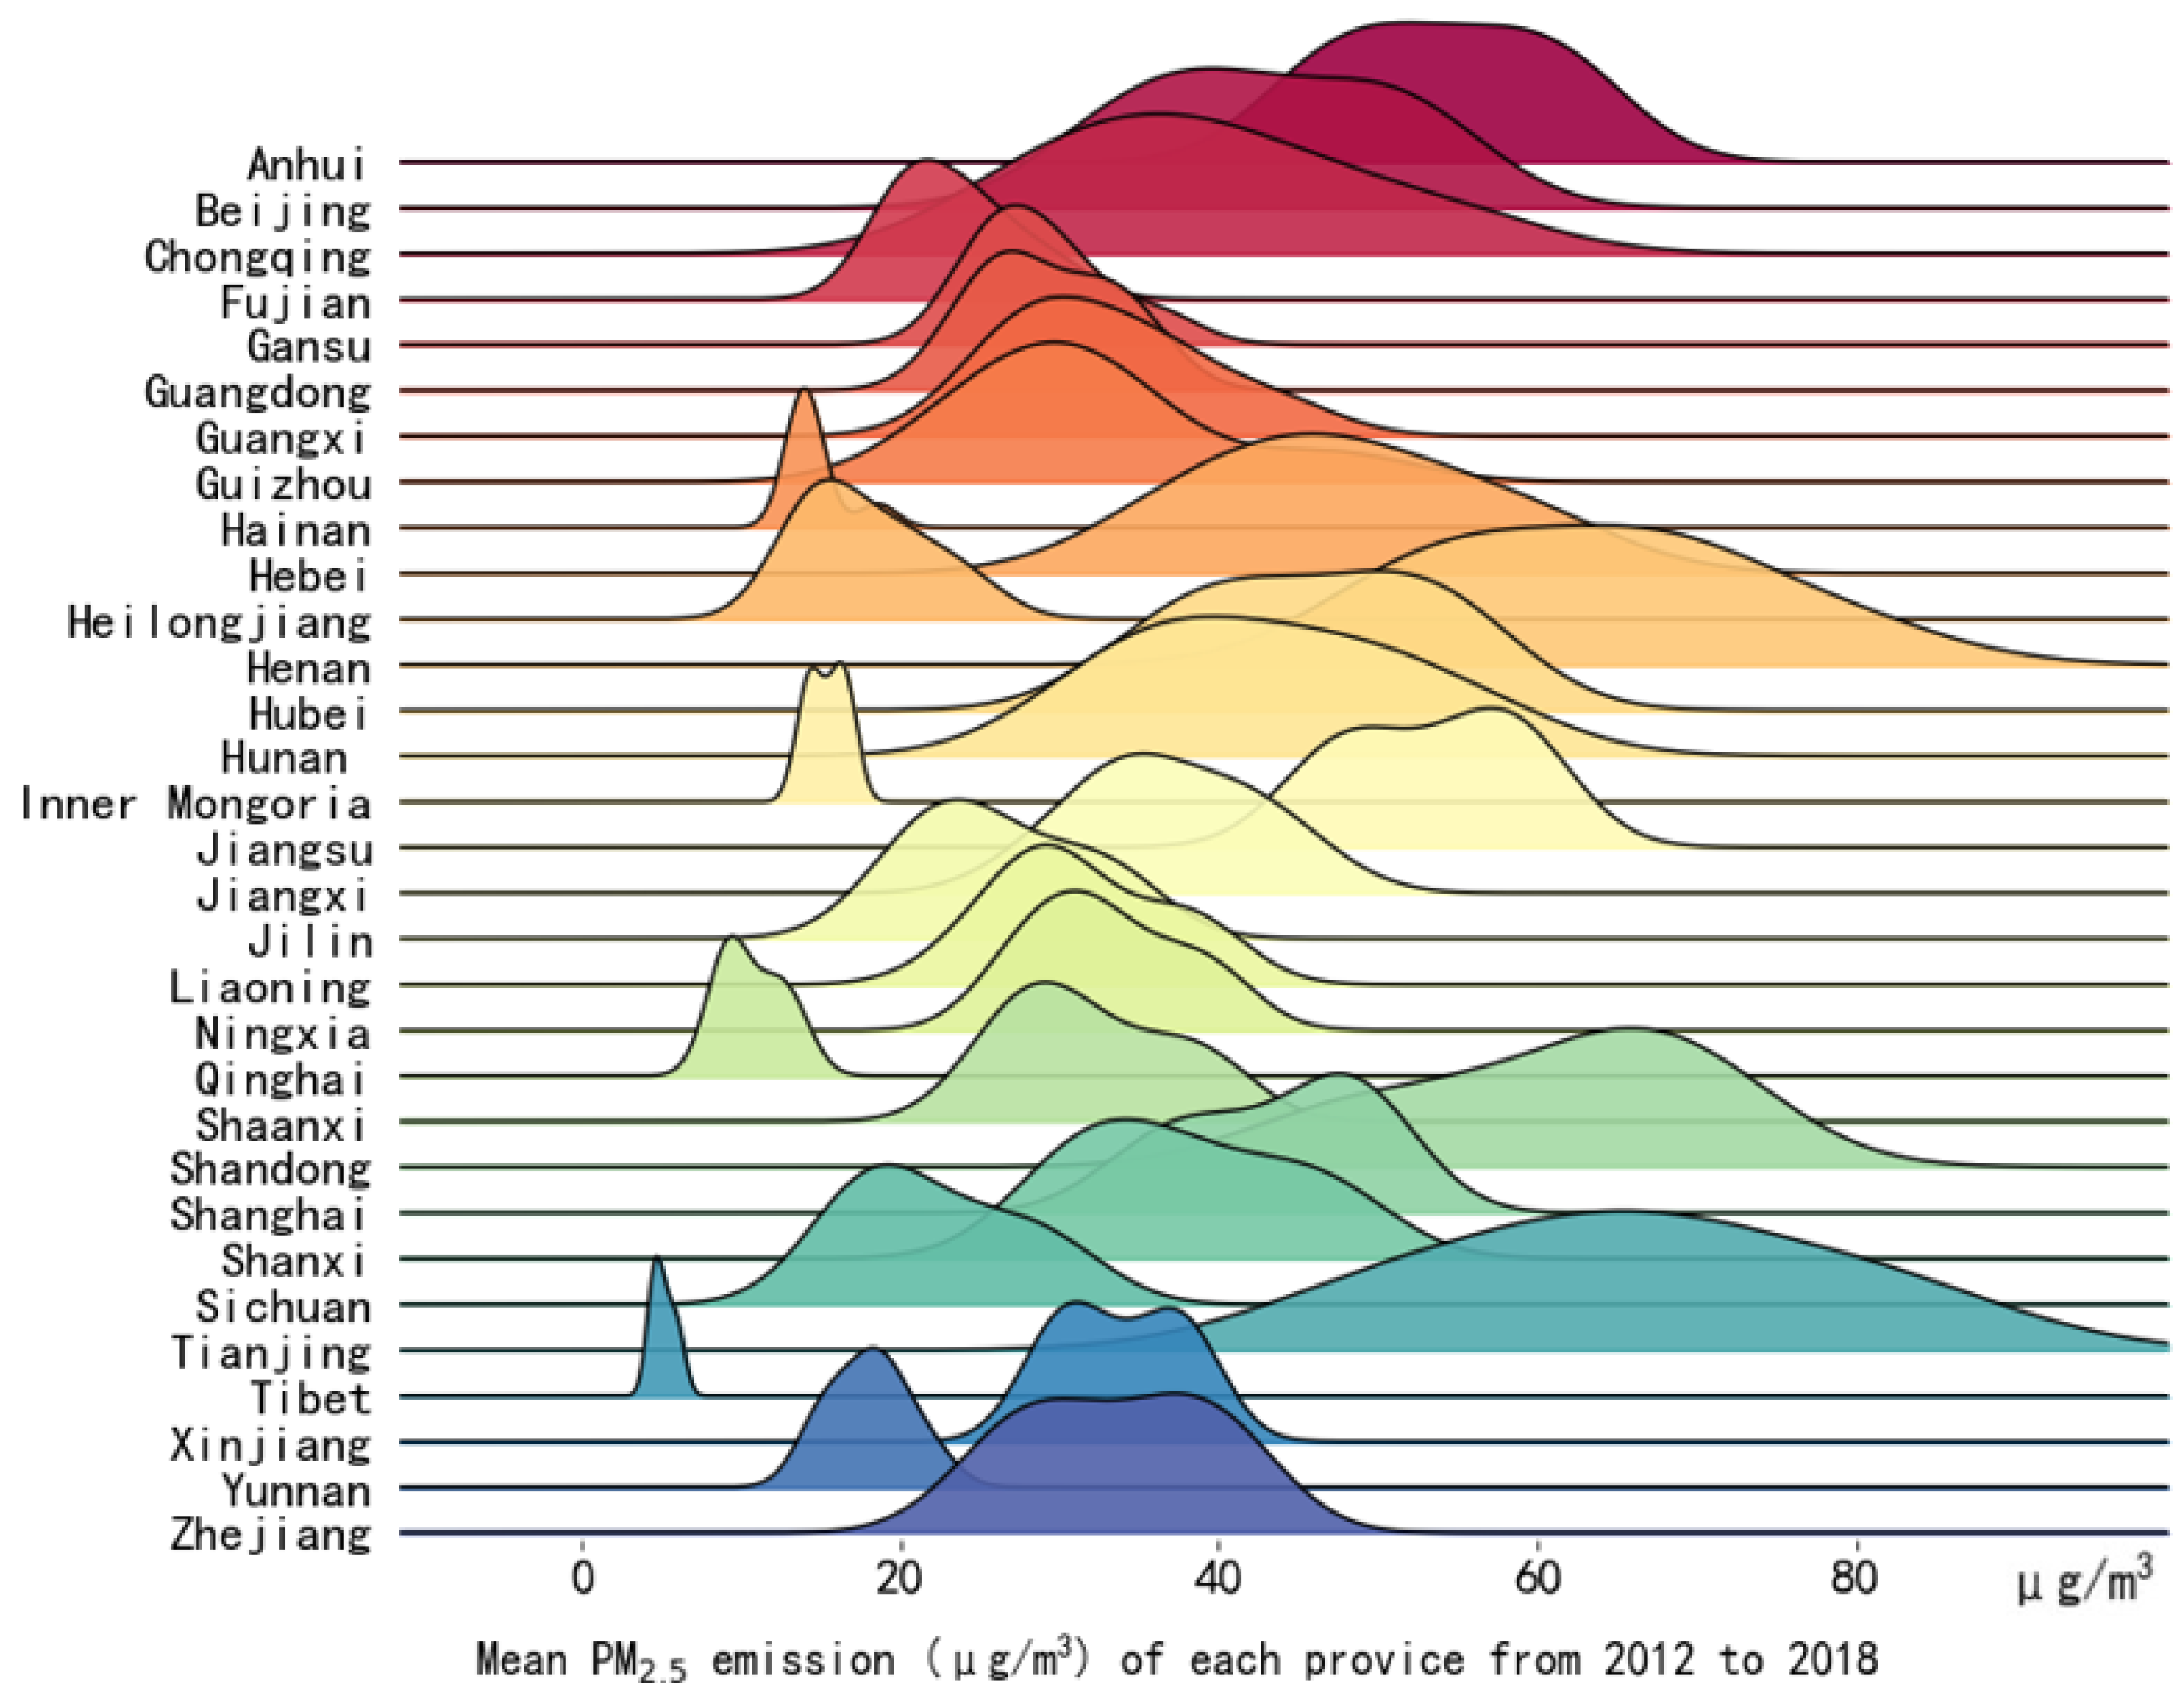
From the distribution of the mean PM2.5 emission in each province, as shown in Figure 11, the average PM2.5 emission in each province is mostly concentrated in the range of 20–60 (μg/m3), and the data of some provinces change significantly, such as Tianjin, Shandong, Hebei, Henan, and Chongqing. Among them, the average PM2.5 air pollution in Tianjin and Henan is the highest, and the Tibet Autonomous Region is the lowest on average. In conclusion, the growing rate of PM2.5 emission in most provinces in China shows a fluctuating downward trend.

Figure 11.
Mean PM2.5 emission of each province from 2012 to 2018.
4.3.2. Spatiotemporal Dynamics of Nighttime Light
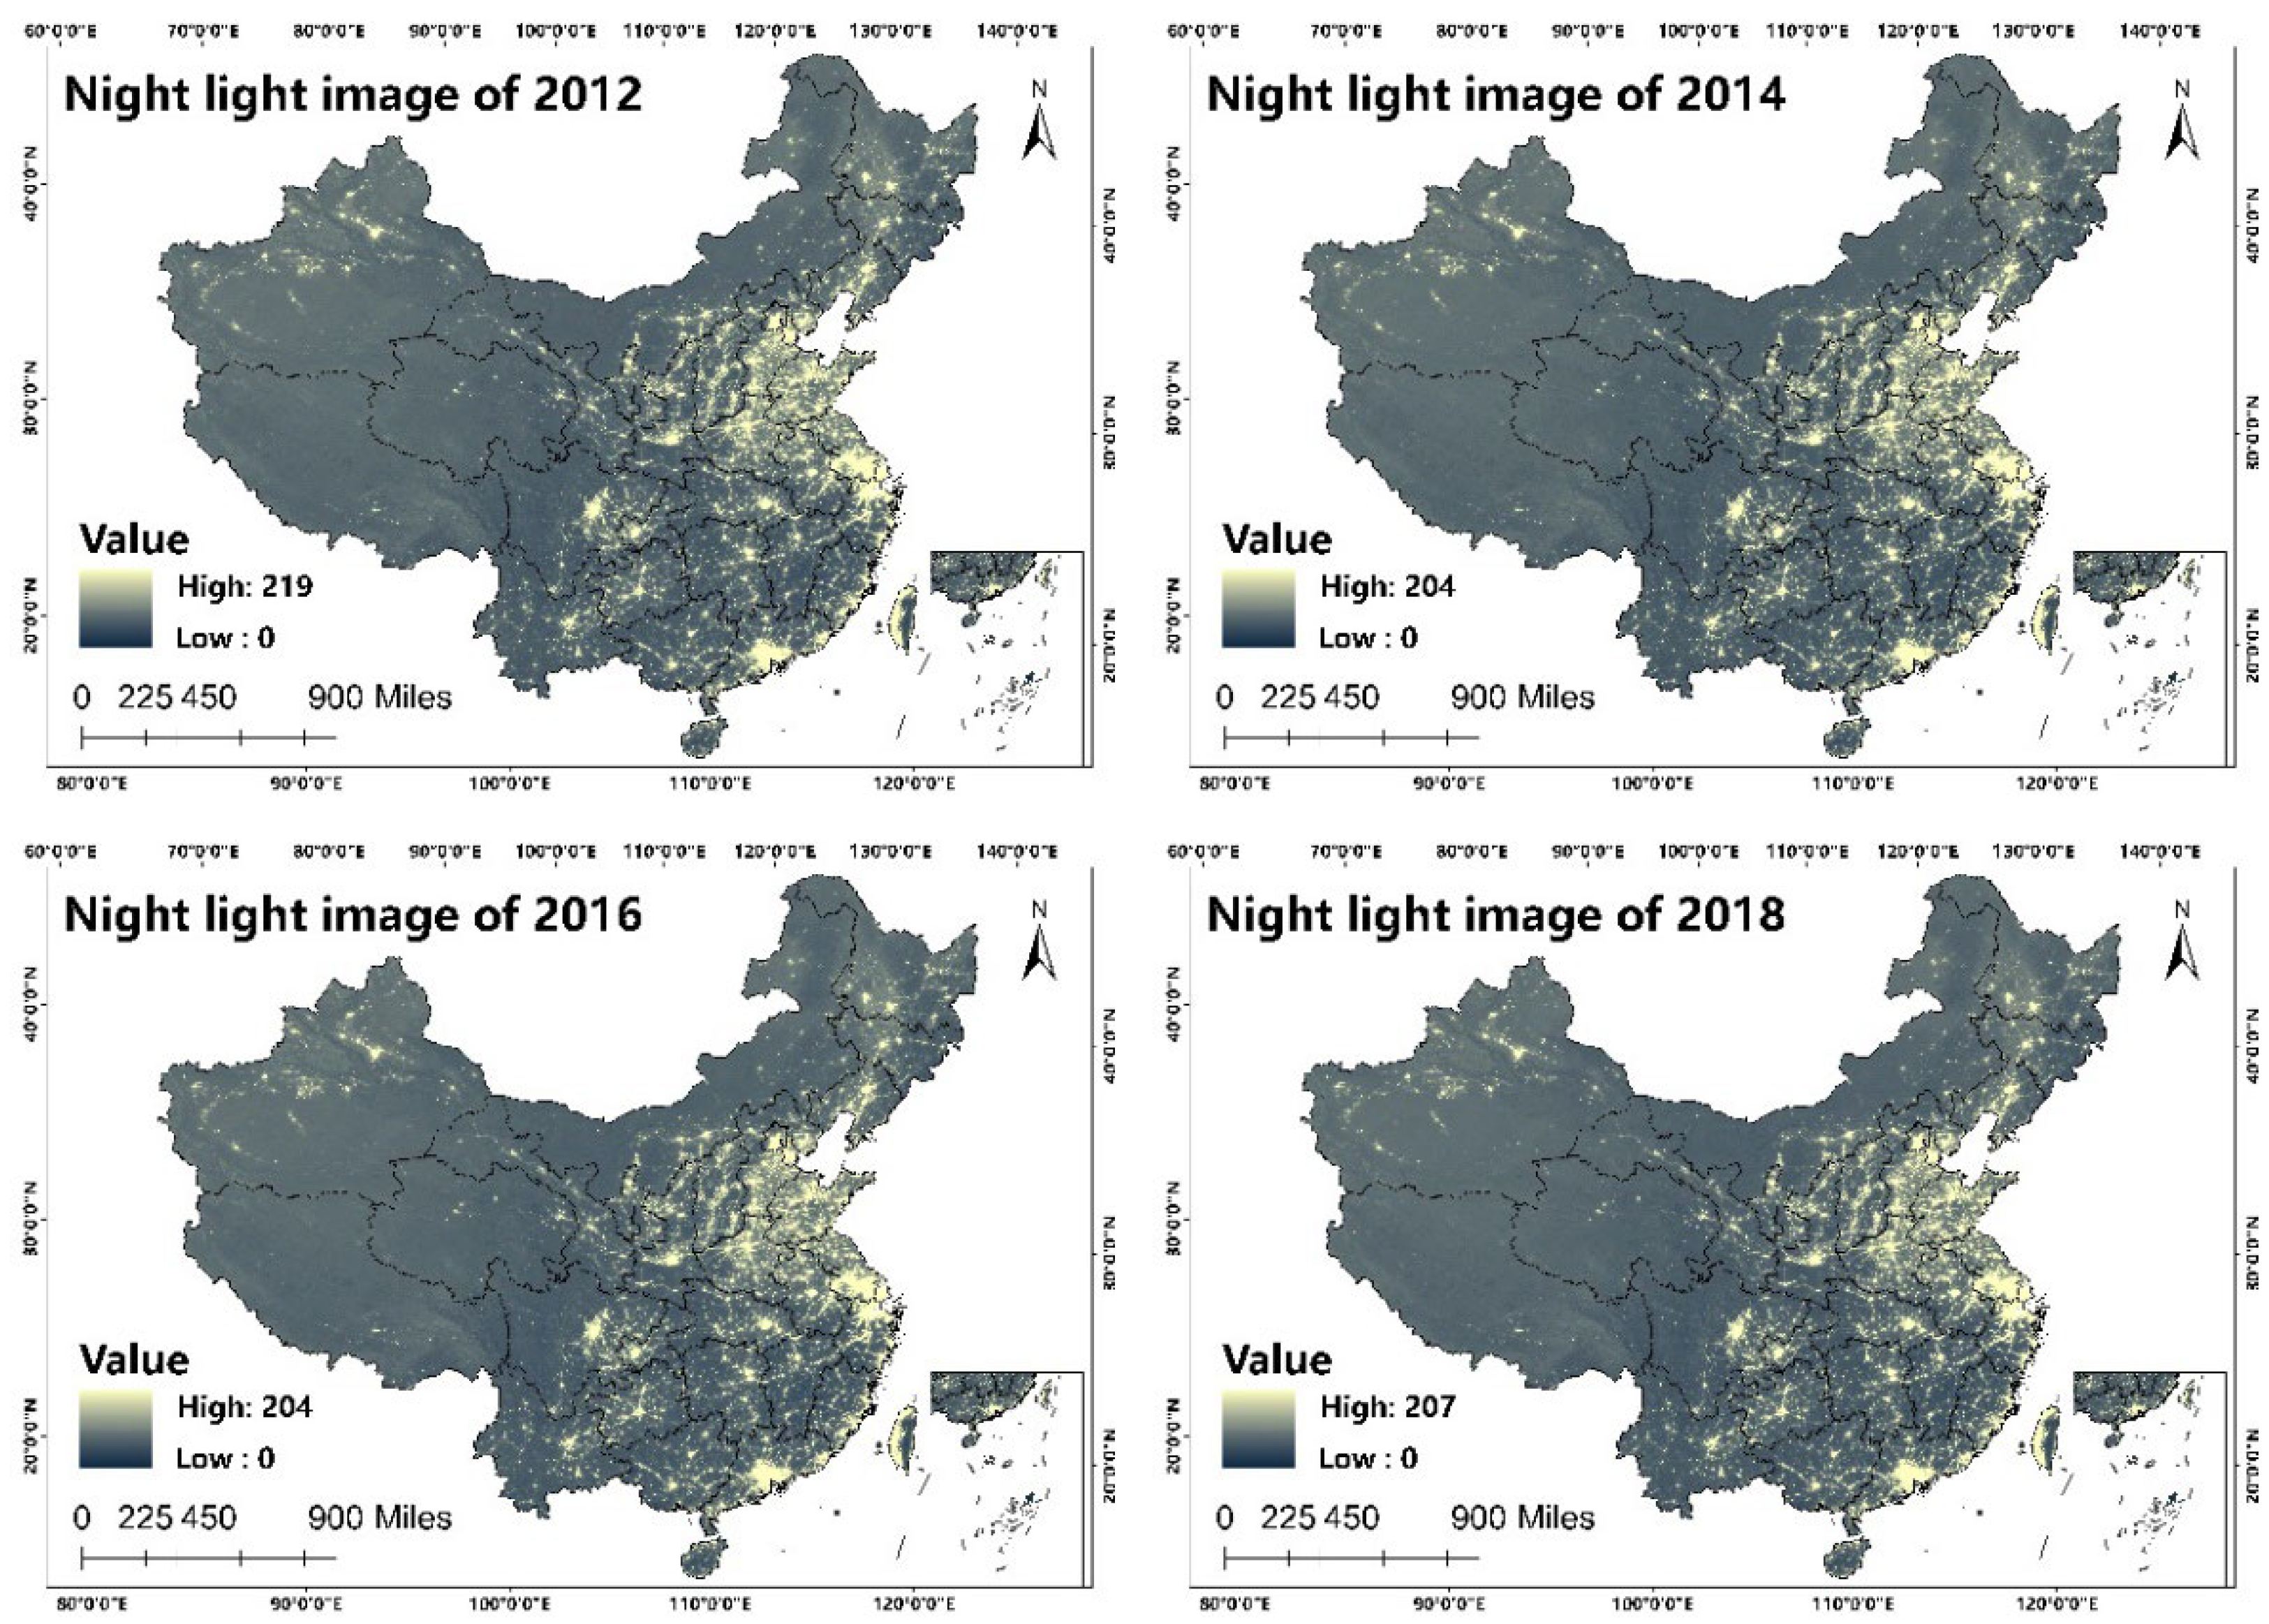
Nighttime light data of each year are shown in Figure 12. Due to space constraints, only some years are listed. Areas with large DN values are in the majority of China’s population centers in these south of the Hu line. This line is roughly a basic straight line with an inclination of 45 degrees from Fuhui in Heilongjiang Province to Tengchong in Yunnan Province. The southeastern part of the line occupies 36% of the country’s territory and is home to 96% of the population of China (according to the data of the fifth national population census in 2000, accurate calculation using ArcGIS shows that the southeastern of Hu line accounts for 43.8% of the national area and 94.1% of the total population); therefore, the spatial distribution of nighttime light images generally presents the characteristics of “southeast bright, northwest dark”. The south area of the Hu line has the highest brightness in the Beijing–Tianjin–Hebei, Yangtze River Delta, and Pearl River Delta regions. The primary reason is that these places are highly populated, highly industrialized, and economically advanced. The light brightness values in Tibet, southern Xinjiang, Qinghai, and Gansu in the north of the Hu line are relatively low, which is mainly due to the high altitude of the area and the relatively unsuitable natural environment for human life.
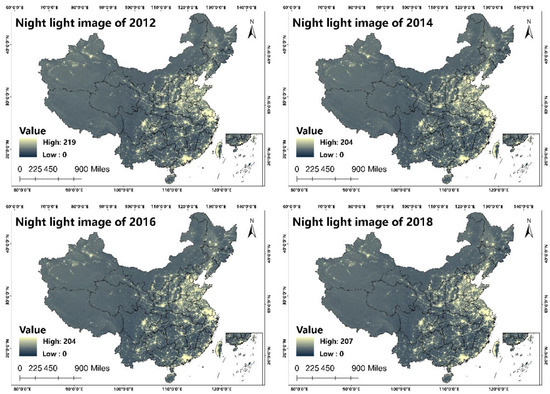
Figure 12.
Nighttime light imagery of China from 2012 to 2018.
In recent years, the interannual growth of the total nighttime light in the eight economic regions shows a trend of first decline and then increase, but the growth rate is low, as shown in Figure 13. The increasing trend of the total nighttime light in the southern coastal region is more significant than that in other regions, especially in 2017–2018, with an increase of 0.7%, while the growth trend of the total nighttime light in the northeast area is relatively low. The data of the eight major economic regions have changed slightly. Among them, the night light values of the northern, eastern, and southern coastal areas have increased significantly. The main reason is that the above-mentioned areas are superior in geographic location, economically developed, and densely distributed, while the area is small; thus, the characteristics of these areas are that the average value is high and the total value is low, the distribution of high grades is large, and the area with medium- and high-speed growth is large. The area of the great northwest region accounts for about 40% of China’s land, so it has more light distribution than other regions. However, due to the environment, altitude, climate, and other reasons, the great northwest region has a small population and slow urban development, which leads to the situation of large and sparsely populated areas, thus resulting in the characteristics of high total value and low average value.
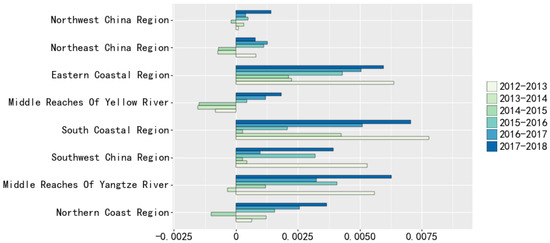
Figure 13.
Growth of nighttime light in eight economic regions from 2012 to 2018.
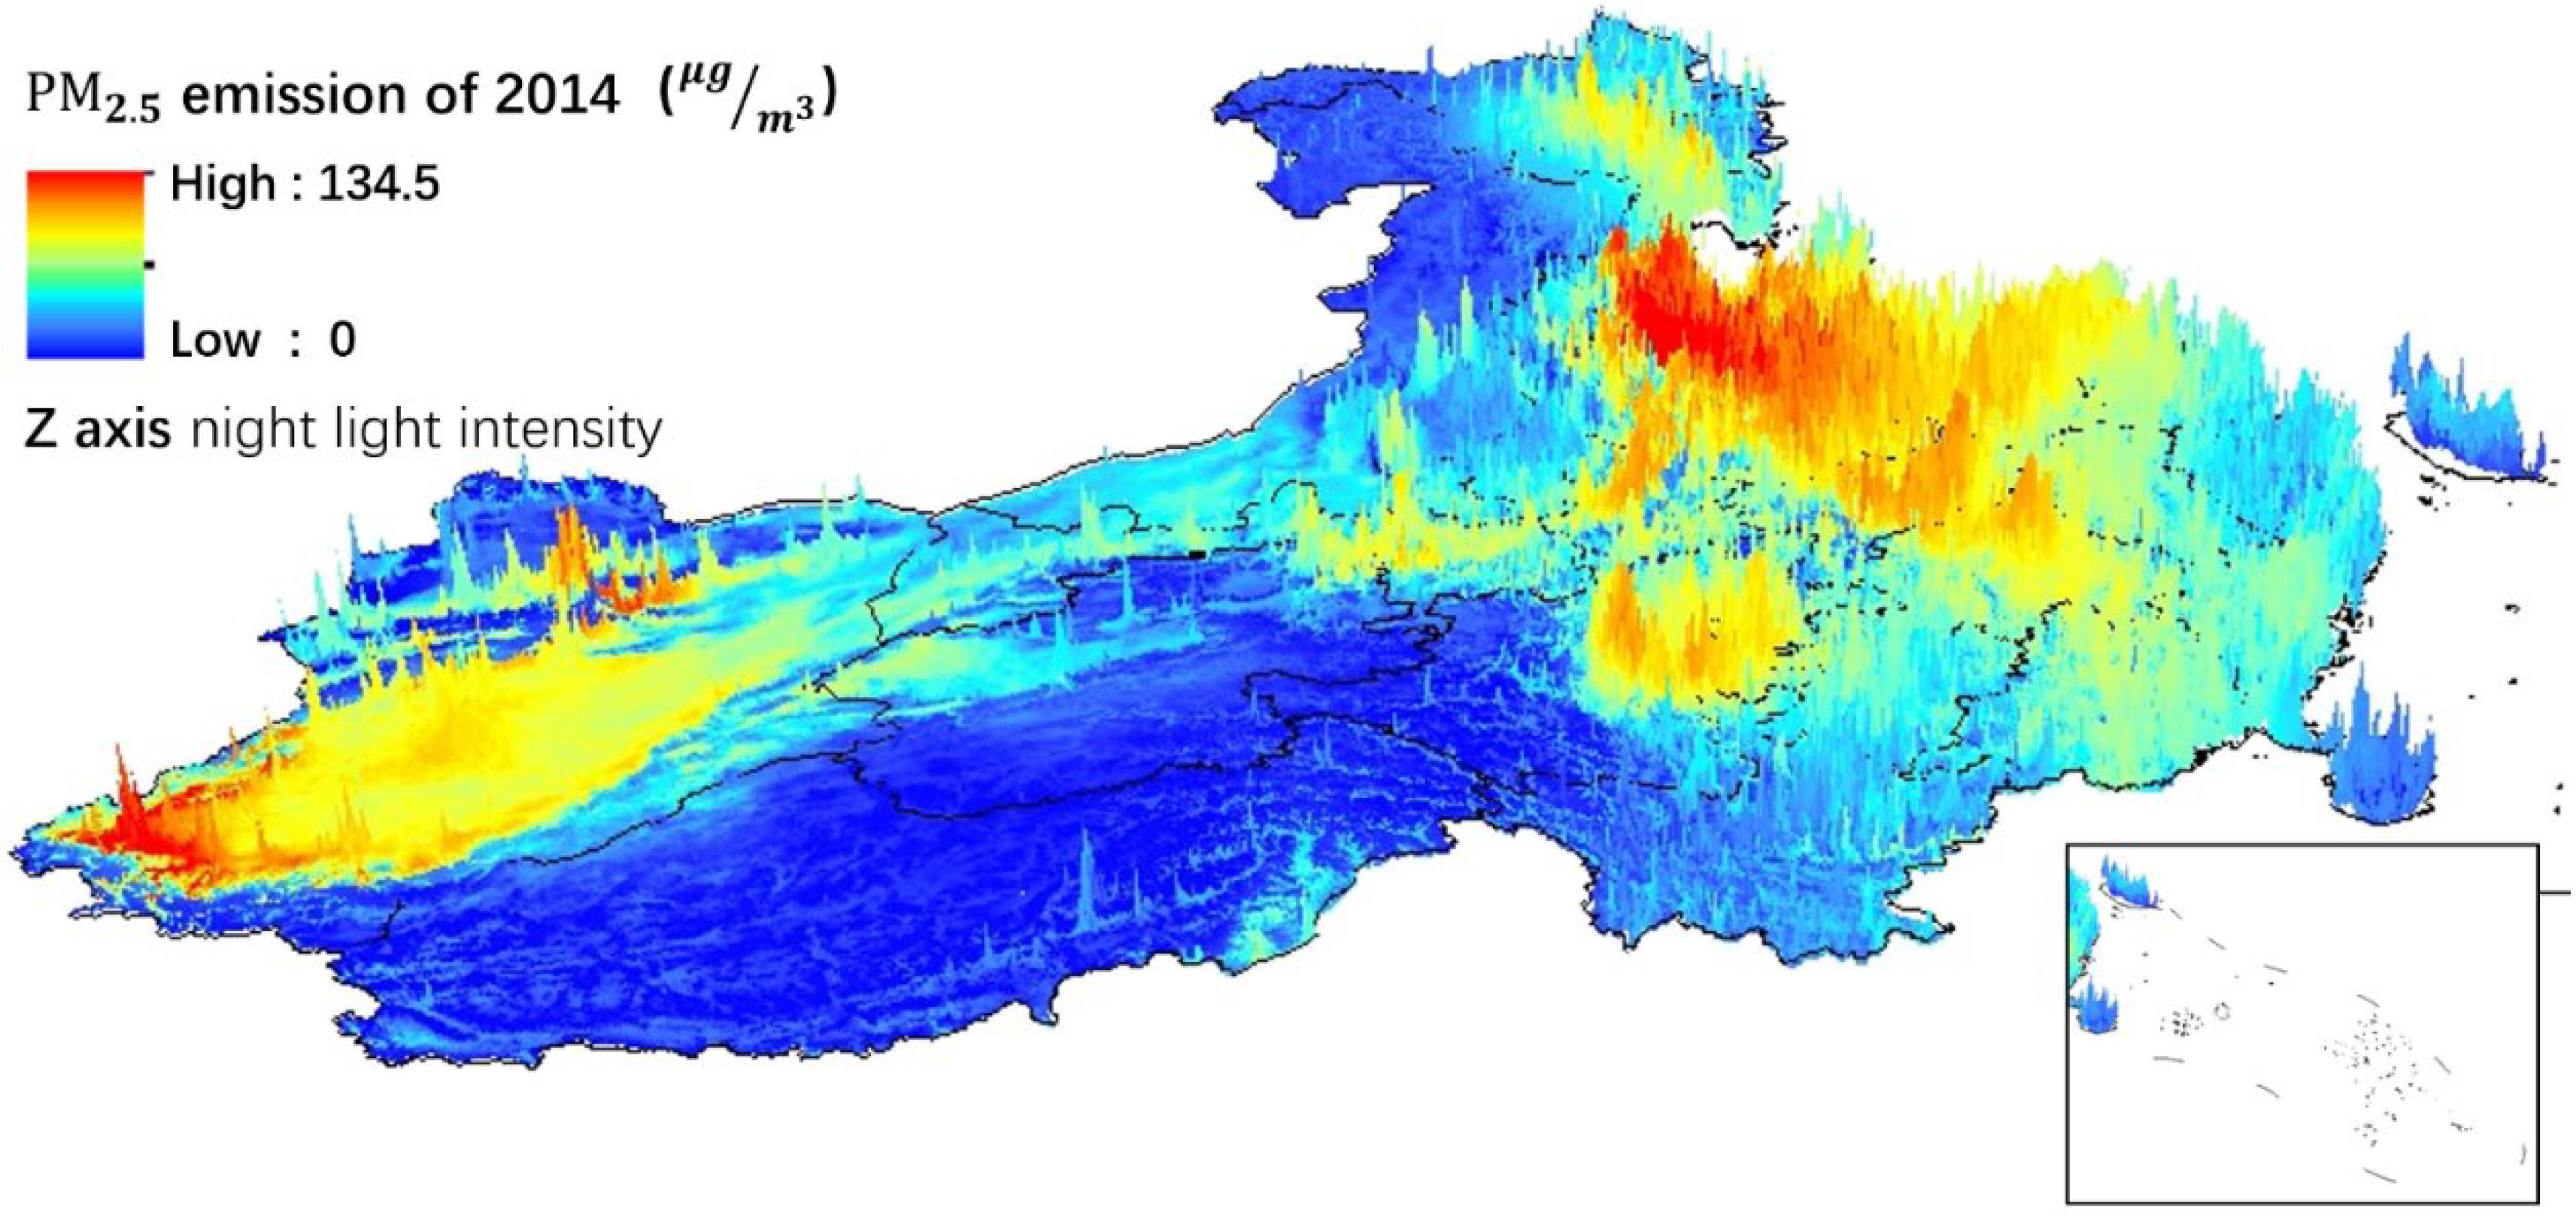
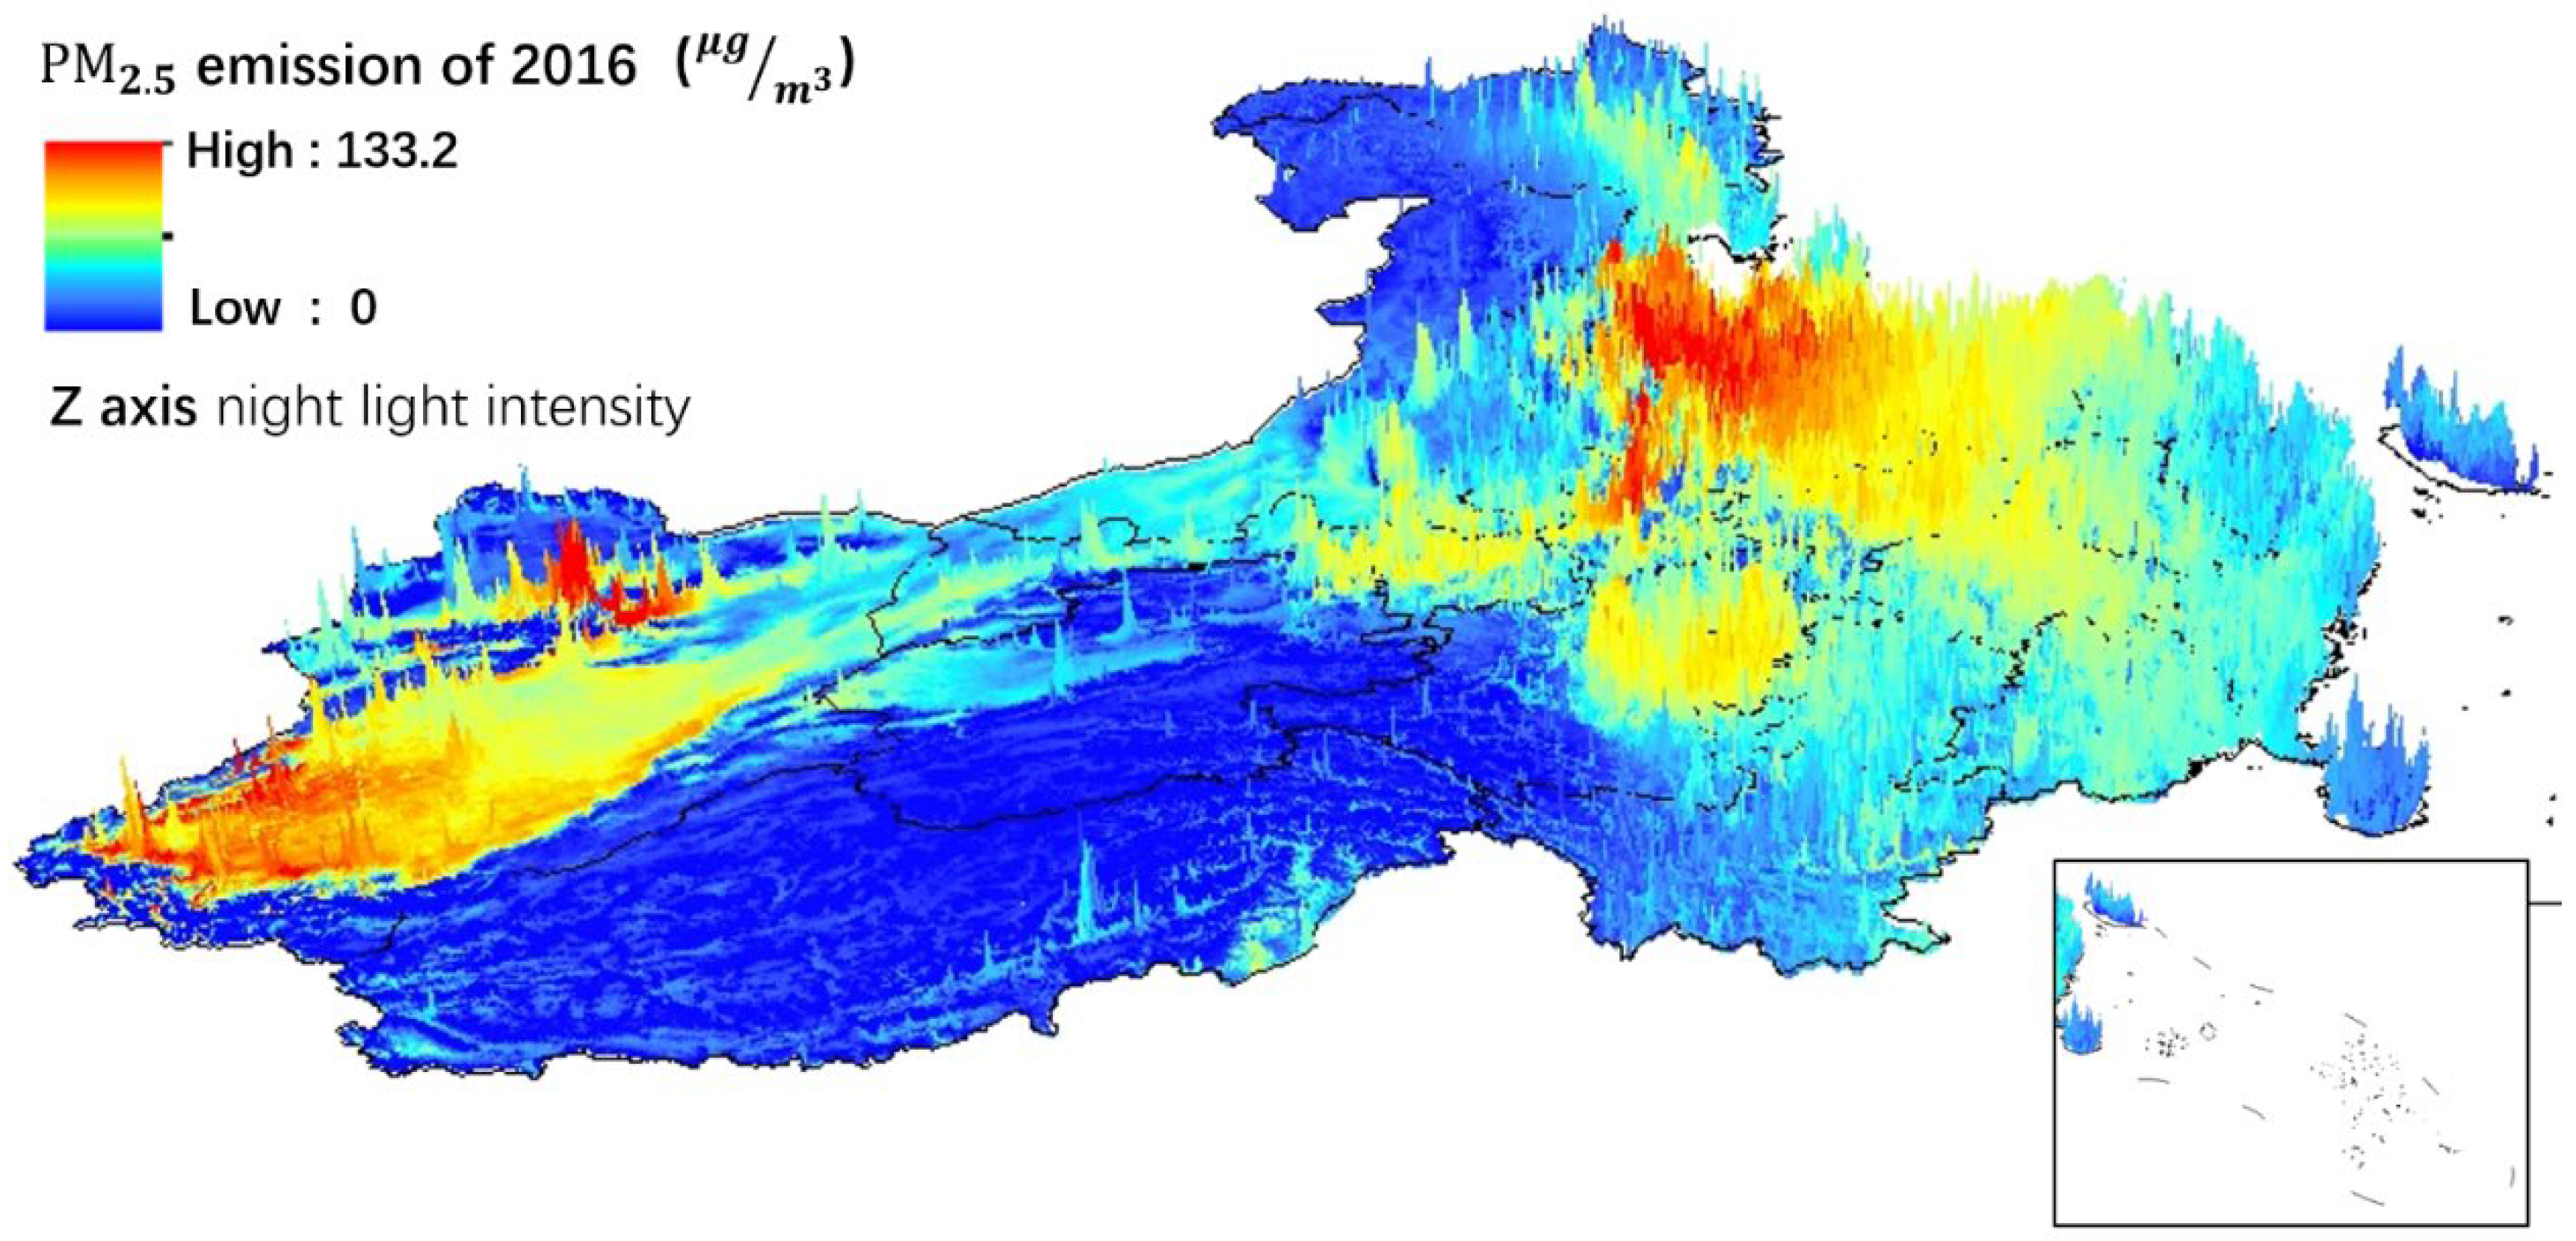
4.3.3. Spatial and Temporal Dynamics between PM2.5 Emission and Night Light Maps and Night Light
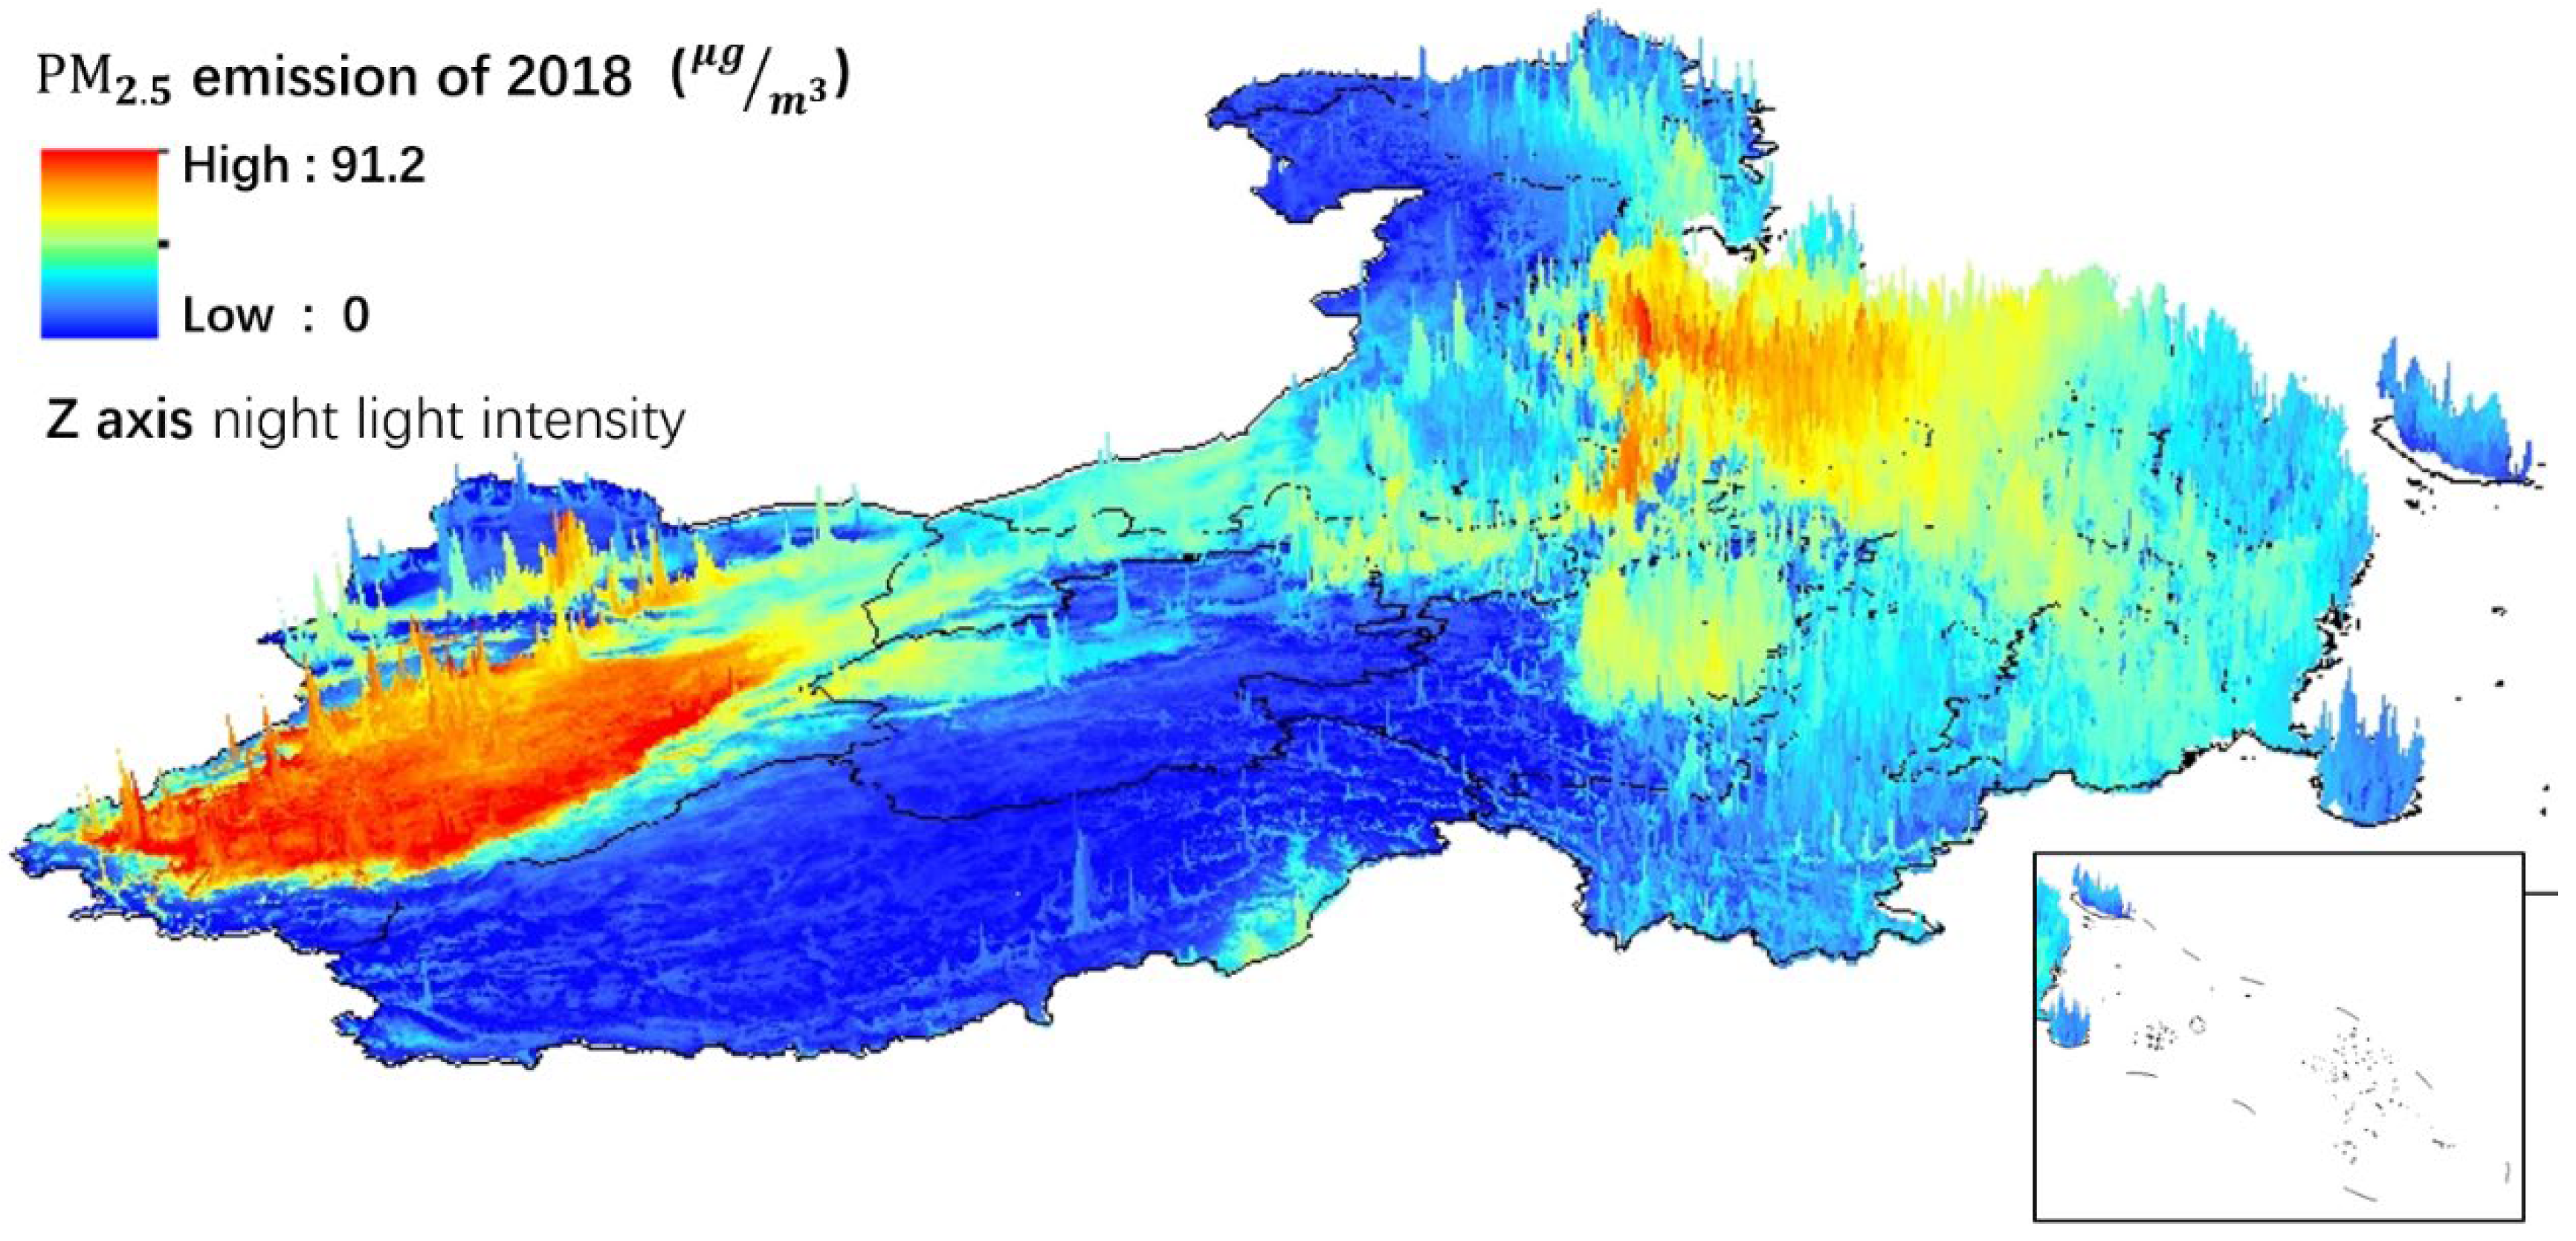
Based on the nighttime light and PM2.5 emission data, it can be seen that the areas with high intensity of human activity reflected in the nighttime light image have spatial correspondence with those with higher PM2.5 emission. The three-dimensional figures of nighttime light brightness and PM2.5 emission in 2012, 2014, 2016, and 2018 are shown in Figure 14, Figure 15, Figure 16 and Figure 17.
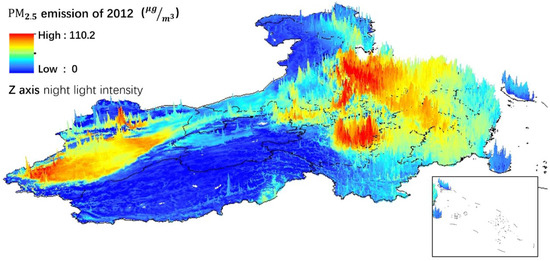
Figure 14.
Three-dimensional diagram of night light and PM2.5 emission in 2012.

Figure 15.
Three-dimensional diagram of night light and PM2.5 emission in 2014.

Figure 16.
Three-dimensional diagram of night light and PM2.5 emission in 2016.

Figure 17.
Three-dimensional diagram of night light and PM2.5 emission in 2018.
It can be seen from the figure that there is a good correlation between nighttime light and PM2.5 emission. Areas with high nighttime light intensity have relatively large PM2.5 emissions. However, there is no good correlation between the two data of the Pearl River Delta region of Guangdong Province and the Tarim Basin region. In the Pearl River Delta, Guangdong Province’s economic growth has been accelerating, but the PM2.5 emission is relatively low. The reason may be that the Pearl River Delta is located in the southern region with low latitude, which is less affected by the wind-blown sand from the northwest region. The tertiary industry is developed with less emission pollution, and the work of the Guangdong provincial government in environmental protection is relatively better. However, PM2.5 emission has a high value in the Tarim Basin of Xinjiang, where the nighttime light is not high. The reason for this is the influence of multiwind sand weather, natural conditions, and other factors in the Tarim Basin.
4.4. Recommendations to Reduce PM2.5 Emission
Although China has made some progress in environmental governance in recent years, the process of controlling environmental pollution still needs to be strengthened. Controlling PM2.5 pollution is not an overnight matter. A handful of steps, such as a long-term mechanism, must be established, and multiple measures must be taken; thus, the government shall continue to take measures in the following aspects. (1) Control the emission source of PM2.5, strengthen the control of industrial dust, adopt a comprehensive control strategy, improve the existing dust removal technology and equipment, and strictly control the dust pollution caused by industrial production. (2) Improve energy consumption structure and increase energy efficiency. Vigorously develop clean energy such as nuclear power, hydropower, biogas, and solar energy; increase the use of clean energy; increase the proportion of renewable energy in the primary energy consumption structure; and reduce pollutant emissions caused by the combustion of fossil fuels such as coal and oil. (3) Control exhaust emissions and improve vehicle emission standards, especially diesel-fueled vehicles. (4) Promote the construction of public transportation infrastructure, actively develop public transportation urban transportation, and reduce residents’ dependence on motor vehicles for travel, thereby reducing fuel consumption and reducing air pollutants emitted by vehicle exhausts.
5. Conclusions
Using nighttime light data, this study demonstrates the current condition of ecological environmental pollution produced by human activities, as well as economic and social developments. Our findings reveal that there is a considerable positive correlation between nighttime light data and PM2.5 emission, and that the proposed model data matching is effective when using a variety of data verification and comparison methods. In terms of spatial distribution, PM2.5 emission over the intermediate level (more than 44% of China’s total area) is concentrated in the North China Plain, Sichuan Basin, and Northwest China, whereas PM2.5 emission below the intermediate level (55% of China’s total area) is concentrated in northeast China, Tibet, and western Sichuan. The area where PM2.5 emissions are showing a negative trend is relatively large (more than 65 percent of China’s total area), with the majority of it lying south of the Hu line, the North China Plain, the Sichuan Basin, and the Yangtze River’s Plains (middle and lower areas). The area with positive growth in PM2.5 emissions, on the other hand, accounts for only 30.8 percent of China’s total land area. Our research demonstrates that China’s air quality has improved after the announcement of the “Twelfth Five Year Plan for the Prevention and Control of Air Pollution in Key Areas” at the end of 2012, notably in some import regions where the Chinese government has taken considerable steps in recent years. These steps are vigorous in promoting the adjustment of industrial structure, accelerating the relevant technological transformation, increasing the supply of clean energy, and promoting the improvement of energy efficiency. The visual data analysis of this study not only helps the government to design measures to mitigate air pollution, but also offers a scientific foundation for promoting sustainable development in China.
Author Contributions
Investigation, D.L. and Z.D.; Methodology, J.L.; Project administration, D.L.; Writing—original draft preparation, D.L. and Z.D.; Writing—review and editing, Q.H. and H.N. All authors have read and agreed to the published version of the manuscript.
Funding
This work was supported in part by Special project of key research and development Plan of Henan Province under Grant nos. 221111111700, the State Key Program of National Natural Science Foundation of China under Grant No. 41901297, the Science and Technology Key Project of Henan province under Grant no. 222102210155 and 202102310017.
Institutional Review Board Statement
Not applicable.
Informed Consent Statement
Not applicable.
Data Availability Statement
The data used to support the findings of this study are available from the corresponding author upon request.
Acknowledgments
The anonymous reviewers are greatly thanked for their valuable comments and suggestions to improve the manuscript.
Conflicts of Interest
The authors declare no conflict of interest.
References
- Huang, R.J.; Zhang, Y.; Bozzetti, C.; Ho, K.F.; Cao, J.J.; Han, Y.; Daellenbach, K.R.; Slowik, J.G.; Platt, S.M.; Canonaco, F.; et al. High secondary aerosol contribution to particulate pollution during haze events in China. Nature 2014, 514, 218–222. [Google Scholar] [CrossRef] [PubMed] [Green Version]
- Tian, S.; Pan, Y.; Liu, Z.; Wen, T.; Wang, Y. Size-resolved aerosol chemical analysis of extreme haze pollution events during early 2013 in urban Beijing, China. J. Hazard. Mater. 2014, 279, 452–460. [Google Scholar] [CrossRef] [PubMed]
- Wang, Y.; Yao, L.; Wang, L.; Liu, Z.; Ji, D.; Tang, G.; Zhang, J.; Sun, Y.; Hu, B.; Xin, J. Mechanism for the formation of the January 2013 heavy haze pollution episode over central and eastern China. Sci. China Earth Sci. 2014, 57, 14–25. [Google Scholar] [CrossRef]
- Chi, R.; Li, H.; Wang, Q.; Zhai, Q.; Wang, D.; Wu, M.; Liu, Q.; Wu, S.; Ma, Q.; Deng, F.; et al. Association of emergency room visits for respiratory diseases with sources of ambient PM2.5. J. Environ. Sci. 2019, 86, 154–163. [Google Scholar] [CrossRef] [PubMed]
- Wang, G.; Wang, Y.; Yin, W.; Xu, T.; Hu, C.; Cheng, J.; Hou, J.; He, Z.; Yuan, J. Seasonal exposure to PM2.5-bound polycyclic aromatic hydrocarbons and estimated lifetime risk of cancer: A pilot study. Sci. Total Environ. 2020, 702, 135056. [Google Scholar] [CrossRef]
- Dockery, D.W.; Pope, C.A.; Xu, X.; Spengler, J.D.; Ware, J.H.; Fay, M.E.; Ferris Jr, B.G.; Speizer, F.E. An association between air pollution and mortality in six US cities. N. Engl. J. Med. 1993, 329, 1753–1759. [Google Scholar] [CrossRef] [Green Version]
- Pope Iii, C.A.; Burnett, R.T.; Thun, M.J.; Calle, E.E.; Krewski, D.; Ito, K.; Thurston, G.D. Lung cancer, cardiopulmonary mortality, and long-term exposure to fine particulate air pollution. Jama 2002, 287, 1132–1141. [Google Scholar] [CrossRef] [Green Version]
- WHO (World Health Organization). 2018. Available online: https://www.who.int/en/newsroom/fact-sheets/detail/ambient-(outdoor)-air-quality-and-health (accessed on 3 January 2019).
- Fan, G.F.; Ma, H.; Zhang, X.W.; Liu, Y. Impacts of relative humidity and PM2.5 concentration on atmospheric visibility: A comparative study of hourly observations of multiple stations. Acta Meteor. Sin. 2016, 74, 959–973. [Google Scholar]
- Li, Z.; Guo, J.; Ding, A.; Liao, H.; Liu, J.; Sun, Y.; Wang, T.; Xue, H.; Zhang, H.; Zhu, B. Aerosol and boundary-layer interactions and impact on air quality. Natl. Sci. Rev. 2017, 4, 810–833. [Google Scholar] [CrossRef]
- Kuniyal, J.C.; Guleria, R.P. The current state of aerosol-radiation interactions: A mini review. J. Aerosol Sci. 2019, 130, 45–54. [Google Scholar] [CrossRef]
- Li, Y.; Liao, Q.; Zhao, X.G.; Bai, Y.; Tao, Y. Influence of PM2.5 Pollution on Health Burden and Economic Loss in China. Huanjing Kexue 2021, 42, 1688–1695. [Google Scholar]
- Ma, Y.R.; Ji, Q.; Fan, Y. Spatial linkage analysis of the impact of regional economic activities on PM2.5 pollution in China. J. Clean. Prod. 2016, 139, 1157–1167. [Google Scholar] [CrossRef]
- Hao, Y.; Peng, H.; Temulun, T.; Liu, L.Q.; Mao, J.; Lu, Z.N.; Chen, H. How harmful is air pollution to economic development? New evidence from PM2.5 concentrations of Chinese cities. J. Clean. Prod. 2018, 172, 743–757. [Google Scholar] [CrossRef]
- Wu, G.P.; Hu, W.; Teng, E.J. PM2.5 and PM10 pollution level in the four cities in China. China Environ. Sci. 1999, 19, 133–1387. [Google Scholar]
- Yu, H.L.; Wang, C.H.; Liu, M.C.; Kuo, Y.M. Estimation of fine particulate matter in Taipei using landuse regression and Bayesian maximum entropy method. Int. J. Environ. Res. Public Health 2011, 8, 2153–2169. [Google Scholar] [CrossRef] [Green Version]
- Lin, G.; Fu, J.; Jiang, D.; Hu, W.; Dong, D.; Huang, Y.; Zhao, M. Spatio-temporal variation of PM2.5 concentrations and their relationship with geographic and socioeconomic factors in China. Int. J. Environ. Res. Public Health 2014, 11, 173–186. [Google Scholar] [CrossRef] [Green Version]
- Wang, Z.B.; Fang, C.L.; Xu, G.; Pan, Y. Spatial-temporal characteristics of the PM2.5 in China in 2014. Acta Geogr. Sin. 2015, 70, 1720–1734. [Google Scholar]
- Yang, G.; Huang, J.; Li, X. Mining sequential patterns of PM2.5 pollution in three zones in China. J. Clean. Prod. 2018, 170, 388–398. [Google Scholar] [CrossRef]
- Maji, K.J.; Ye, W.F.; Arora, M.; Nagendra, S.S. PM2.5-related health and economic loss assessment for 338 Chinese cities. Environ. Int. 2018, 121, 392–403. [Google Scholar] [CrossRef]
- Li, Y.; Chen, B.; Fang, D.; Zhang, B.; Bai, J.; Liu, G.; Zhang, Y. Drivers of energy-related PM2. 5 emissions in the Jing-Jin-Ji region between 2002 and 2015. Appl. Energy 2021, 288, 116668. [Google Scholar] [CrossRef]
- Brook, R.D.; Rajagopalan, S.; Pope, C.A., III; Brook, J.R.; Bhatnagar, A.; Diez-Roux, A.V.; Holguin, F.; Hong, Y.; Luepker, R.V.; Mittleman, M.A.; et al. Particulate matter air pollution and cardiovascular disease: An update to the scientific statement from the American Heart Association. Circulation 2010, 121, 2331–2378. [Google Scholar] [CrossRef] [Green Version]
- Rückerl, R.; Schneider, A.; Breitner, S.; Cyrys, J.; Peters, A. Health effects of particulate air pollution: A review of epidemiological evidence. Inhal. Toxicol. 2011, 23, 555–592. [Google Scholar] [CrossRef] [PubMed]
- Samoli, E.; Stafoggia, M.; Rodopoulou, S.; Ostro, B.; Declercq, C.; Alessandrini, E.; Díaz, J.; Karanasiou, A.; Kelessis, A.G.; Le Tertre, A.; et al. Associations between fine and coarse particles and mortality in Mediterranean cities: Results from the MED-PARTICLES project. Environ. Health Perspect. 2013, 121, 932–938. [Google Scholar] [CrossRef] [PubMed] [Green Version]
- Stafoggia, M.; Samoli, E.; Alessandrini, E.; Cadum, E.; Ostro, B.; Berti, G.; Faustini, A.; Jacquemin, B.; Linares, C.; Pascal, M.; et al. Short-term associations between fine and coarse particulate matter and hospitalizations in Southern Europe: Results from the MED-PARTICLES project. Environ. Health Perspect. 2013, 121, 1026–1033. [Google Scholar] [CrossRef] [PubMed]
- Cesaroni, G.; Badaloni, C.; Gariazzo, C.; Stafoggia, M.; Sozzi, R.; Davoli, M.; Forastiere, F. Long-term exposure to urban air pollution and mortality in a cohort of more than a million adults in Rome. Environ. Health Perspect. 2013, 121, 324–331. [Google Scholar] [CrossRef] [Green Version]
- Raaschou-Nielsen, O.; Andersen, Z.J.; Beelen, R.; Samoli, E.; Stafoggia, M.; Weinmayr, G.; Hoffmann, B.; Fischer, P.; Nieuwenhuijsen, M.J.; Brunekreef, B.; et al. Air pollution and lung cancer incidence in 17 European cohorts: Prospective analyses from the European Study of Cohorts for Air Pollution Effects (ESCAPE). Lancet Oncol. 2013, 14, 813–822. [Google Scholar] [CrossRef]
- Atkinson, R.W.; Kang, S.; Anderson, H.R.; Mills, I.C.; Walton, H.A. Epidemiological time series studies of PM2.5 and daily mortality and hospital admissions: A systematic review and meta-analysis. Thorax 2014, 69, 660–665. [Google Scholar] [CrossRef] [Green Version]
- Beelen, R.; Raaschou-Nielsen, O.; Stafoggia, M.; Andersen, Z.J.; Weinmayr, G.; Hoffmann, B.; Wolf, K.; Samoli, E.; Fischer, P.; Nieuwenhuijsen, M.; et al. Effects of long-term exposure to air pollution on natural-cause mortality: An analysis of 22 European cohorts within the multicentre ESCAPE project. Lancet 2014, 383, 785–795. [Google Scholar]
- de Hoogh, K.; Héritier, H.; Stafoggia, M.; Künzli, N.; Kloog, I. Modelling daily PM2.5 concentrations at high spatio-temporal resolution across Switzerlan. Environ. Pollut. 2018, 233, 1147–1154. [Google Scholar] [CrossRef]
- Di, Q.; Kloog, I.; Koutrakis, P.; Lyapustin, A.; Wang, Y.; Schwartz, J. Assessing PM2.5 exposures with high spatiotemporal resolution across the continental United States. Environ. Sci. Technol. 2016, 50, 4712–4721. [Google Scholar]
- Kloog, I.; Nordio, F.; Coull, B.A.; Schwartz, J. Incorporating local land use regression and satellite aerosol optical depth in a hybrid model of spatiotemporal PM2.5 exposures in the Mid-Atlantic states. Environ. Sci. Technol. 2012, 46, 11913–11921. [Google Scholar] [CrossRef] [Green Version]
- Lee, M.; Kloog, I.; Chudnovsky, A.; Lyapustin, A.; Wang, Y.; Melly, S.; Coull, B.; Koutrakis, P.; Schwartz, J. Spatiotemporal prediction of fine particulate matter using high-resolution satellite images in the Southeastern US 2003–2011. J. Expo. Sci. Environ. Epidemiol. 2016, 26, 377–384. [Google Scholar] [CrossRef] [Green Version]
- Stafoggia, M.; Schwartz, J.; Badaloni, C.; Bellander, T.; Alessandrini, E.; Cattani, G.; De’Donato, F.; Gaeta, A.; Leone, G.; Lyapustin, A.; et al. Estimation of daily PM10 concentrations in Italy (2006–2012) using finely resolved satellite data, land use variables and meteorology. Environ. Int. 2017, 99, 234–244. [Google Scholar] [CrossRef]
- Wu, J.; Wang, Z.; Li, W.; Peng, J. Exploring factors affecting the relationship between light consumption and GDP based on DMSP/OLS nighttime satellite imagery. Remote Sens. Environ. 2013, 134, 111–119. [Google Scholar] [CrossRef]
- Dai, Z.; Hu, Y.; Zhao, G. The suitability of different nighttime light data for GDP estimation at different spatial scales and regional levels. Sustainability 2017, 9, 305. [Google Scholar] [CrossRef] [Green Version]
- Wang, J.; Liu, H.; Liu, H.; Huang, H. Spatiotemporal evolution of multiscale urbanization level in the Beijing-Tianjin-Hebei Region using the integration of DMSP/OLS and NPP/VIIRS night light datasets. Sustainability 2021, 13, 2000. [Google Scholar] [CrossRef]
- Xu, Z.; He, X.; Chen, L.; Hu, X.; Tang, W.; Li, J. How does the urbanization level change in the Yangtze River economic belt, China? A multi-scale evaluation using DMSP/OLS nighttime light data. In IOP Conference Series: Earth and Environmental Science; IOP Publishing: Bristol, UK, 2021; Volume 675, p. 012112. [Google Scholar]
- Qiang, Y.; Huang, Q.; Xu, J. Observing community resilience from space: Using nighttime lights to model economic disturbance and recovery pattern in natural disaster. Sustain. Cities Soc. 2020, 57, 102115. [Google Scholar] [CrossRef]
- Ji, G.; Tian, L.; Zhao, J.; Yue, Y.; Wang, Z. Detecting spatiotemporal dynamics of PM2.5 emission data in China using DMSP-OLS nighttime stable light data. J. Clean. Prod. 2019, 209, 363–370. [Google Scholar] [CrossRef]
- Fu, D.; Xia, X.; Duan, M.; Zhang, X.; Li, X.; Wang, J.; Liu, J. Mapping nighttime PM2.5 from VIIRS DNB using a linear mixed-effect model. Atmos. Environ. 2018, 178, 214–222. [Google Scholar] [CrossRef]
- Li, K.; Liu, C.S.; Jiao, P.L. Estimation of nighttime PM2.5 concentration in Shanghai based on NPP/VIIRS Day_Night Band data. Acta Sci. Circumstantiae 2019, 39, 1913–1922. [Google Scholar]
- Li, R.Y. Study on the Methodology of Using Nighttime Light Data to Retrieve Atmospheric Fine Particle’s Concentration; China University of Geosciences (Beijing): Beijing, China, 2015. [Google Scholar]
- Cao, Z.Y. Estimating the Spatial Distribution of GDP Based on Nighttime Light Image and Analysis of Correlation between It and PM2.5 Concentration; University of Chinese Academy of Sciences: Beijing, China, 2016. [Google Scholar]
- National Bureau of Statistics. Available online: https://data.stats.gov.cn/ (accessed on 10 October 2020).
- Hammer, M.S.; van Donkelaar, A.; Li, C.; Lyapustin, A.; Sayer, A.M.; Hsu, N.C.; Levy, R.C.; Garay, M.J.; Kalashnikova, O.V.; Kahn, R.A.; et al. Global estimates and long-term trends of fine particulate matter concentrations (1998–2018). Environ. Sci. Technol. 2020, 54, 7879–7890. [Google Scholar] [CrossRef]


Publisher’s Note: MDPI stays neutral with regard to jurisdictional claims in published maps and institutional affiliations. |
© 2022 by the authors. Licensee MDPI, Basel, Switzerland. This article is an open access article distributed under the terms and conditions of the Creative Commons Attribution (CC BY) license (https://creativecommons.org/licenses/by/4.0/).