

Predictors Influencing Urban and Rural Area students to Use Tablet Computers as Learning Tools: Combination of UTAUT and TTF Models


Abstract
1. Introduction
2. Theoretical Background
2.1. Tablet Computers in Education
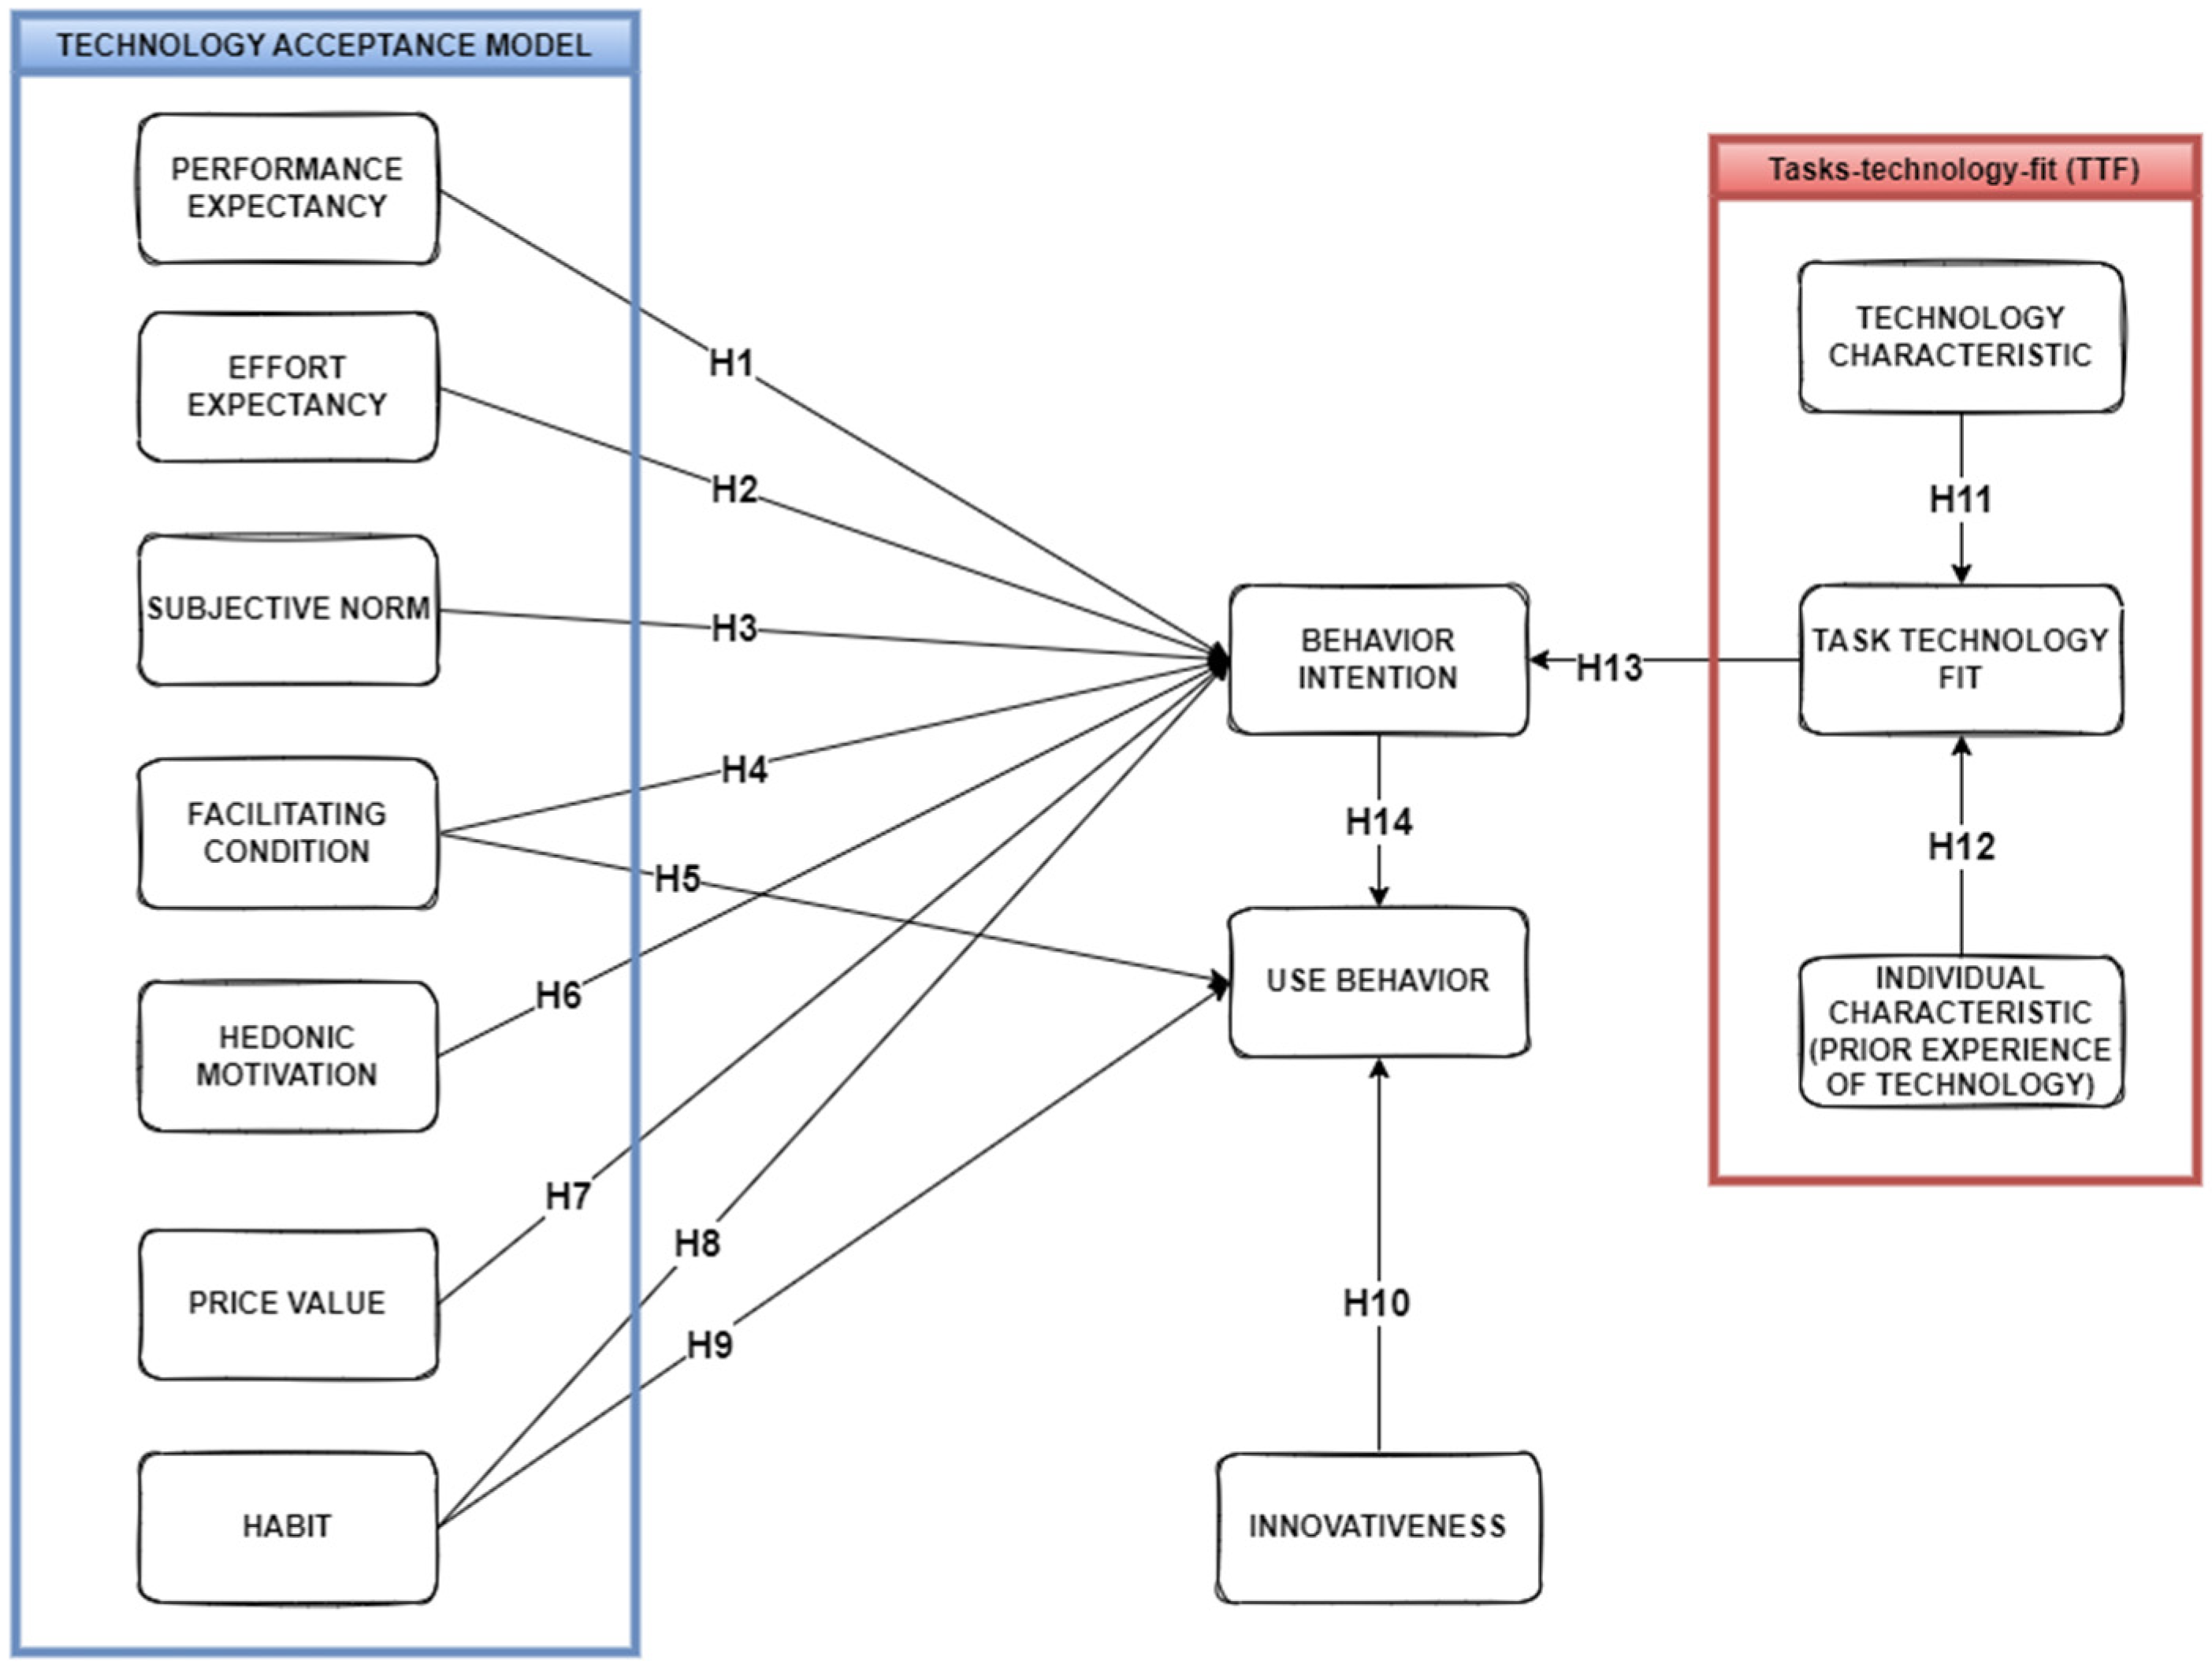
2.2. Study Model and Hypothesis
2.3. Performance Expectancy (PE)
2.4. Effort Expectancy (EE)
2.5. Subjective Norm (SN)
2.6. Facilitating Conditions (FC)
2.7. Hedonic Motivation (HM)
2.8. Price Value (PV)
2.9. Habit (HB)
2.10. Behavioral Intention (BI)
2.11. Innovativeness (INV)
2.12. Task Technology Fit (TTF)
3. Method
3.1. Questionnaire Development
3.2. Data Collection
3.3. Ethic Protocol
3.4. Data Analysis
4. Results
4.1. Measurement Model
4.2. Structural Model
4.3. Hypothesis Testing
5. Discussion
6. Contribution and Implication
7. Limitations and Recommendations for Future Studies
8. Conclusions
Author Contributions
Funding
Institutional Review Board Statement
Informed Consent Statement
Data Availability Statement
Conflicts of Interest
Appendix A. Measurement Item and Sources
| Determinants | Measurement Items |
| Performance expectancy | Tablet computers improve learning performance |
| A tablet computer helps search for literature and complete college assignments quickly | |
| Tablet computers help review lessons effectively | |
| Effort expectancy | Tablet computers are easy to use |
| It is easy to learn using a tablet computer | |
| The interaction with the tablet computer is clear and understandable | |
| Subjective Norm (SN) | Friends at university use a tablet computer as a learning tool |
| Friends at university recommended using tablet computers as learning tools | |
| People recommend using tablet computers as learning tools | |
| Facilitating conditions | I have a tablet computer for learning |
| I have the knowledge to use tablet computers for learning | |
| People help when I do not know how to use a tablet computer to learning | |
| Price value | Tablet computers for learning purposes are reasonably priced |
| The tablet computer is a good value for money | |
| Using a tablet computer to learn is reasonably priced than other learning tools, such as a laptop | |
| habits | The use of tablet computers for learning has become a habit |
| I must use a tablet computer when learning | |
| Using a tablet computer has become natural | |
| Hedonic motivation | Using a tablet computer in my learning activities is fun |
| The use of tablet computers is amusing | |
| I enjoy using a tablet computer when learning | |
| Behavioral intentions | I intend to use a tablet computer as a learning tool in the future |
| I predict I will use a tablet computer for learning in the future | |
| I have a plan to use a tablet computer for learning in the future | |
| Usage behavior | I use a tablet computer frequently during my academic period |
| I use a tablet computer as the main tool for my studies | |
| I recommend tablet computers to other friends to use | |
| Task Characteristics | I need to use a tablet computer to learn at any time. |
| I need to use a tablet computer to learn anywhere | |
| I often get non-routine tasks | |
| Technology Characteristics | Using a tablet computer as a learning tool helps me provide high-quality learning material |
| Tablet computers support learning outside the classroom | |
| It is convenient for me to learn to use a tablet computer | |
| Task-Technology Fit (TTF) | I think the features of the tablet computer are sufficient to help me complete my learning activities. |
| I think the features of the co tablet computer are appropriate to help me complete my learning activities. | |
| I think the features of the tablet computer fully meet my learning activities needs | |
| Innovation | I like new things and technologies. |
| I am good at discovering new things. | |
| Compared to the people around me, I often experience new products and technologies first. | |
References
- Çetin, K.; Kılıçkaya, F. A systematic review of research on reading in English on screen and on paper. Online Submiss. 2019, 61, 7–21. [Google Scholar] [CrossRef]
- Zhang, R.; Zou, D.; Xie, H.; Au, O.T.S.; Wang, F.L. A systematic review of research on e-book-based language learning. Knowl. Manag. E-Learn. 2020, 12, 106–128. [Google Scholar] [CrossRef]
- Haßler, B.; Major, L.; Hennessy, S. Tablet use in schools: A critical review of the evidence for learning outcomes. J. Comput. Assist. Learn. 2016, 32, 139–156. [Google Scholar] [CrossRef]
- Moran, M.; Hawkes, M.; El Gayar, O. Tablet personal computer integration in higher education: Applying the unified theory of acceptance and use technology model to understand supporting factors. J. Educ. Comput. Res. 2010, 42, 79–101. [Google Scholar] [CrossRef]
- Reychav, I.; Warkentin, M.; Ndicu, M. Tablet adoption with smart school website technology. J. Comput. Inf. Syst. 2016, 56, 280–287. [Google Scholar] [CrossRef]
- Çukurbaşi, B.; Işbulan, O.; Kiyici, M. Acceptance of educational use of tablet computers: A critical view of the FATIH Project. Egit. Bilim 2016, 41, 67–82. [Google Scholar] [CrossRef]
- Cacciamani, S.; Villani, D.; Bonanomi, A.; Carissoli, C.; Olivari, M.G.; Morganti, L.; Riva, G.; Confalonieri, E. Factors Affecting Students’ Acceptance of Tablet PCs: A Study in Italian High Schools. J. Res. Technol. Educ. 2018, 50, 120–133. [Google Scholar] [CrossRef]
- Chou, P.N.; Feng, S.T. Using a tablet computer application to advance high school students’ laboratory learning experiences: A focus on electrical engineering education. Sustainability 2019, 11, 381. [Google Scholar] [CrossRef]
- Villani, D.; Morganti, L.; Carissoli, C.; Gatti, E.; Bonanomi, A.; Cacciamani, S.; Confalonieri, E.; Riva, G. Students’ acceptance of tablet PCs in Italian high schools: Profiles and differences. Br. J. Educ. Technol. 2018, 49, 533–544. [Google Scholar] [CrossRef]
- Opoku-Asare, N.A.; Siaw, A.O. Rural–Urban Disparity in Students’ Academic Performance in Visual Arts Education: Evidence From Six Senior High Schools in Kumasi, Ghana. SAGE Open. 2015, 5, 4. [Google Scholar]
- Liebenberg, J.; Benade, T.; Ellis, S. Acceptance of ICT: Applicability of the Unified Theory of Acceptance and Use of Technology (UTAUT) to South African Students. Afr. J. Inf. Syst. 2018, 10, 1. [Google Scholar]
- Šumak, B.; Šorgo, A. The acceptance and use of interactive whiteboards among teachers: Differences in UTAUT determinants between pre- and post-adopters. Comput. Human Behav. 2016, 64, 602–620. [Google Scholar] [CrossRef]
- Moorthy, K.; Tíng, L.C.; Ming, K.S.; Ping, C.C.; Ping, L.Y.; Joe, L.Q.; Jie, W.J. Behavioral Intention to Adopt Digital Library by the Undergraduates. Int. Inf. Libr. Rev. 2019, 51, 128–144. [Google Scholar] [CrossRef]
- Wang, P.-Y. Examining the Digital Divide between Rural and Urban Schools: Technology Availability, Teachers’ Integration Level and Students’ Perception. J. Curric. Teach. 2013, 2, 127–139. [Google Scholar] [CrossRef]
- Asfar, N.; Zainuddin, Z. Secondary students’ perceptions of information, communication and technology (ICT) use in promoting self directed learning in Malaysia. Online J. Distance Educ. E-Learn. 2015, 3, 67–82. [Google Scholar]
- Sarfo, F.K.; Amartei, A.M.; Adentwi, K.I.; Brefo, C. Technology and gender equity: Rural and urban students’ attitudes towards information and communication technology. J. Media Commun. Stud. 2011, 3, 221–230. [Google Scholar]
- Siaw, K.P.; Muesser, N.; Robert, B.A. Over time and task-fit technology factors on urban—rural high in flipped learning approach. Educ. Technol. Res. Dev. 2018, 66, 1547–1569. [Google Scholar]
- Sulisworo, D.; Kusumaningtyas, D.A.; Anomeisa, A.B.; Wahyuningsih; Rahmadhani, W. Perceptions of online learning experiences between students in urban and remote areas: Case study in Indonesia. Int. J. Sci. Technol. Res. 2020, 9, 4850–4854. [Google Scholar]
- Menachemi, N.; Langley, A.; Brooks, R.G. The use of information technologies among rural and urban physicians in Florida. J. Med. Syst. 2007, 31, 483–488. [Google Scholar] [CrossRef] [PubMed]
- Pujiastuti, H.; Haryadi, R. Interactive Math E-Book: An Alternative Learning Resources for 21st Century Learners, 2019. In Proceedings of the First International Conference on Technology and Educational Science, ICSTES 2018, Bali, Indonesia, 21–22 November 2018. [Google Scholar] [CrossRef]
- Lim, K.; Kim, Y.; Kim, M.; Jang, Y.; Joo, M.H. The digital divide? Analyzing regional differences of tablet PC use in Korean middle schools for sustainable development. Sustainability 2019, 11, 5054. [Google Scholar] [CrossRef]
- Pruet, P.; Ang, C.S.; Farzin, D. Understanding tablet computer usage among primary school students in underdeveloped areas: Students’ technology experience, learning styles and attitudes. Comput. Human Behav. 2016, 55, 1131–1144. [Google Scholar] [CrossRef]
- Venkatesh, M.G.; Morris, G.; Davis, B.; Davis, F.D. User acceptance of information technology: Toward a unified view. Manag. Inf. Syst. Q. 2003, 27, 425–478. [Google Scholar] [CrossRef]
- Garg, A. Investigating the Moderating Effects of Age and Gender on Customers’ Use of Tablet Menu in Casual Dining Restaurants. J. Qual. Assur. Hosp. Tour. 2021. [Google Scholar] [CrossRef]
- Roldán-Álvarez, D.; Martín, E.; Haya, P.A. Collaborative video-based learning using tablet computers to teach job skills to students with intellectual disabilities. Educ. Sci. 2021, 11, 437. [Google Scholar] [CrossRef]
- Hooft, M.v.; Swan, K. Ubiquitous Computing in Education: Invisible Technology, Visible Impact; Lawrence Erlbaum Associates: London, UK, 2007. [Google Scholar]
- Christensen, R.; Knezek, G.; Overall, T. Transition points for the gender gap in computer enjoyment. J. Res. Tech. Educ. 2005, 38, 23–38. [Google Scholar] [CrossRef]
- Zucker, A.; McGhee, R. A Study of One-to-One Computer Use in Mathematics and Science Instruction at the Secondary Level in Henrico County Public Schools; SRI: Menlo Park, CA, USA, 2005. [Google Scholar]
- Al-mekhlafi, A.A.; Othman, I.; Kineber, A.F.; Mousa, A.A.; Zamil, A.M.A. Modeling the Impact of Massive Open Online Courses (MOOC) Implementation Factors on Continuance Intention of Students: PLS-SEM Approach. Sustainability 2022, 14, 5342. [Google Scholar] [CrossRef]
- Faqih, K.M.S.; Jaradat, M.I.R.M. Integrating TTF and UTAUT2 theories to investigate the adoption of augmented reality technology in education: Perspective from a developing country. Technol. Soc. 2021, 67, 101787. [Google Scholar] [CrossRef]
- Penuel, W.R.; Fishman, B.J.; Cheng, B.H.; Sabelli, N. Organizing research and development at the intersection of learning, implementation, and design. Educ. Res. 2011, 40, 331–337. [Google Scholar] [CrossRef]
- Al-Mashaqbeh, I.F. IPad in elementary school math learning setting. Int. J. Emerg. Technol. Learn. 2016, 11, 48–52. [Google Scholar] [CrossRef][Green Version]
- Hart, K.; Ahmed, R. Using demibooks composer to create remedial learning apps for the profoundly deaf. In Proceedings of the IDC ‘13: 12th International Conference on Interaction Design and Children, New York, NY, USA, 24–27 June 2013; pp. 573–576. [Google Scholar] [CrossRef]
- Cho, Y.H.; Huh, S.Y.; Jo, G.T. Influence of individual differences on learning with digital textbooks. In Proceedings of the ICCE 2018—26th International Conference on Computers in Education, Main Conference Proceedings, Manila, Philippines, 26–30 November 2018; pp. 506–511. Available online: https://www.scopus.com/inward/record.uri?eid=2-s2.0-85060047802&partnerID=40&md5=5b9afa767f7bbff1b8ad2acc1ef58c1e (accessed on 10 April 2022).
- Mukminin, A.; Habibi, A.; Muhaimin, M.; Prasojo, L.D. Exploring the drivers predicting behavioral intention to use m-learning management system: Partial least square structural equation model. IEEE Access 2020, 8, 181356–181365. [Google Scholar] [CrossRef]
- Al-Maroof, R.S.; Alnazzawi, N.; Akour, I.A.; Ayoubi, K.; Alhumaid, K.; AlAhabi, N.M.; Alnnaimi, M.; Thabit, S.; Alfaisal, R.; Aburayya, A.; et al. The effectiveness of online platforms after the pandemic: Will face-to-face classes affect students’ perception of their behavioural intention (BIU) to use online platforms? Informatics 2021, 8, 83. [Google Scholar] [CrossRef]
- Camadan, F.; Reisoglu, I.; Ursavas, Ö.F.; Mcilroy, D. How teachers’ personality affect on their behavioral intention to use tablet PC. Int. J. Inf. Learn. Technol. 2018, 35, 12–28. [Google Scholar] [CrossRef]
- Wijaya, T.T.; Cao, Y.; Weinhandl, R.; Yusron, E. Applying the UTAUT Model to Understand Factors Affecting Micro-Lecture Usage by Mathematics Teachers in China. Mathematics 2022, 10, 1008. [Google Scholar] [CrossRef]
- Alenezi, A.R. Modeling the Social Factors Affecting Students’ Satisfaction with Online Learning: A Structural Equation Modeling Approach. Educ. Res. Int. 2022, 2022, 2594221. [Google Scholar] [CrossRef]
- Lavidas, K.; Komis, V.; Achriani, A. Explaining faculty members’ behavioral intention to use learning management systems. J. Comput. Educ. 2022, 9, 707–725. [Google Scholar] [CrossRef]
- Taamneh, A.; Alsaad, A.; Elrehail, H.; Al-Okaily, M.; Lutfi, A.; Sergio, R.P. University lecturers acceptance of moodle platform in the context of the COVID-19 pandemic. Glob. Knowl. Mem. Commun. 2022; ahead-of-print. [Google Scholar] [CrossRef]
- Sarfraz, M.; Fiaz, K.; Ivascu, L. The International Journal of Management Education Factors affecting business school students’ performance during the COVID-19 pandemic: A moderated and mediated model. Int. J. Manag. Educ. 2022, 20, 100630. [Google Scholar] [CrossRef]
- Acharjya, B.; Das, S. Adoption of E-Learning during the COVID-19 Pandemic. Int. J. Web-Based Learn. Teach. Technol. 2022, 17, 1–14. [Google Scholar] [CrossRef]
- Choi, H.; Hong, H. Influential Factors on Elementary School Teachers’ Intention to Use MOOC. Teach. Educ. Res. 2018, 57, 16–29. [Google Scholar] [CrossRef]
- Venkatesh, V.Y.L.; Thong, J.; Xu, X. Consumer acceptance and use of information Technology: Extending the unified theory of acceptance and use of technology. MIS Quarterly. Manag. Inf. Syst. Q. 2012, 36, 157–178. [Google Scholar] [CrossRef]
- Uymaz, P.; Uymaz, A.O. Assessing acceptance of augmented reality in nursing education. PLoS ONE 2022, 17, e0263937. [Google Scholar] [CrossRef]
- Nikolopoulou, K.; Gialamas, V.; Lavidas, K. Habit, hedonic motivation, performance expectancy and technological pedagogical knowledge affect teachers’ intention to use mobile internet. Comput. Educ. Open 2021, 2, 100041. [Google Scholar] [CrossRef]
- Wang, Y.S.; Wu, M.C.; Wang, H.Y. Investigating the determinants and age and gender differences in the acceptance of mobile learning. Br. J. Educ. Technol. 2009, 40, 92–118. [Google Scholar] [CrossRef]
- Clements, J. Beyond habit: The role of sunk costs on developing automatic IS use behaviors. J. South. Assoc. Inf. Syst. 2015, 3, 17–37. [Google Scholar] [CrossRef][Green Version]
- Yu, C.W.; Chao, C.M.; Chang, C.F.; Chen, R.J.; Chen, P.C.; Liu, Y.X. Exploring Behavioral Intention to Use a Mobile Health Education Website: An Extension of the UTAUT 2 Model. SAGE Open 2021, 11, 4. [Google Scholar] [CrossRef]
- Hu, S.; Laxman, K.; Lee, K. Exploring factors affecting academics’ adoption of emerging mobile technologies-an extended UTAUT perspective. Educ. Inf. Technol. 2020, 25, 4615–4635. [Google Scholar] [CrossRef]
- Herting, D.C.; Pros, R.C.; Tarrida, A.C. Habit and social influence as determinants of PowerPoint use in higher education: A study from a technology acceptance approach. Interact. Learn. Environ. 2020, 1–17. [Google Scholar] [CrossRef]
- Prasetyo, Y.T.; Roque, R.A.C.; Chuenyindee, T.; Young, M.N.; Diaz, J.F.T.; Persada, S.F.; Miraja, B.A.; Redi, A.A.N.P. Determining factors affecting the acceptance of medical education elearning platforms during the covid-19 pandemic in the philippines: Utaut2 approach. Healthcare 2021, 9, 780. [Google Scholar] [CrossRef] [PubMed]
- Briz-Ponce, L.; Pereira, A.; Carvalho, L.; Juanes-Méndez, J.A.; García-Peñalvo, F.J. Learning with mobile technologies—Students’ behavior. Comput. Human Behav. 2017, 72, 612–620. [Google Scholar] [CrossRef]
- Al-rahmi, A.M.; Al-rahmi, W.M.; Alturki, U.; Aldraiweesh, A.; Almutairy, S.; Al-adwan, A.S. Exploring the factors affecting mobile learning for sustainability in higher education. Sustainability 2021, 13, 7893. [Google Scholar] [CrossRef]
- Reyes, E.G.D.; Galura, J.C.; Pineda, J.L.S. C5-LMS design using Google Classroom: User acceptance based on extended Unified Theory of Acceptance and Use of Technology. Interact. Learn. Environ. 2022, 1–10. [Google Scholar] [CrossRef]
- Lazar, I.M.; Panisoara, G.; Panisoara, I.O. Digital technology adoption scale in the blended learning context in higher education: Development, validation and testing of a specific tool. PLoS ONE 2020, 15, e0235957. [Google Scholar] [CrossRef] [PubMed]
- Huang, H.; Cheng, E.W.L. The Role of Commitment in an Extended Theory of Planned Behavior: Test of Its Mediating Effect with Partial Least Squares Structural Equation Modeling. Mathematics 2022, 10, 1049. [Google Scholar] [CrossRef]
- Fussell, S.G.; Truong, D. Using virtual reality for dynamic learning: An extended technology acceptance model. Virtual Real. 2022, 26, 249–267. [Google Scholar] [CrossRef] [PubMed]
- Saprikis, V.; Avlogiaris, G.; Katarachia, A. Determinants of the intention to adopt mobile augmented reality apps in shopping malls among university students. J. Theor. Appl. Electron. Commer. Res. 2021, 16, 491–512. [Google Scholar] [CrossRef]
- Arenas, J.E.; Bravo, C.J.; Ramírez, P.E.; Arenas, J.; Bravo, C.; Ramírez, J.P. Aceptación del Re- conocimiento Facial Como Medida de Vigilancia y Seguridad: Un Estudio Empírico en Chile. Inf. Tecnológica 2018, 29, 115–122. [Google Scholar]
- Zampieri, M.; Lindner, D.; Flores, L.; Pellegrin, T. Compreensao da satisfacao e intencao de con- tinuidade de uso da tecnologia por meio do indice de prontidao tecnològica. Rev. Adm. Innov. 2014, 11, 101. [Google Scholar]
- Ye, C. Antecedents and Consequences of Perceived Fit of an Interactive Digital Textbook. J. Inf. Syst. Educ. 2021, 32, 27–39. [Google Scholar]
- Liu, D.; Luo, J. College Learning from Classrooms to the Internet: Adoption of the YouTube as Supplementary Tool in COVID-19 Pandemic Environment. Educ. Urban Soc. 2021, 54, 848–870. [Google Scholar] [CrossRef]
- Alismaiel, O.A. Using structural equation modeling to assess online learning systems’ educational sustainability for university students. Sustainability 2021, 13, 13565. [Google Scholar] [CrossRef]
- Navarro, M.M.; Prasetyo, Y.T.; Young, M.N.; Nadlifatin, R.; Redi, A.A.N.P. The perceived satisfaction in utilizing learning management systems among engineering students during the COVID-19 pandemic: Integrating task technology fit and extended technology acceptance model. Sustainability 2021, 13, 10669. [Google Scholar] [CrossRef]
- Goodhue, D.; Thompson, R.L. Task-technology fit and individual performance. MIS Q. 1995, 19, 213–236. [Google Scholar] [CrossRef]
- Alyoussef, I.Y. Massive open online course (Moocs) acceptance: The role of task-technology fit (ttf) for higher education sustainability. Sustainability 2021, 13, 7374. [Google Scholar] [CrossRef]
- Sharif, A.; Afshan, S.; Qureshi, M.A. Acceptance of learning management system in university students: An integrating framework of modified UTAUT2 and TTF theories. Int. J. Technol. Enhanc. Learn. 2019, 11, 2. [Google Scholar] [CrossRef]
- Pal, D.; Patra, S. University Students ’ Perception of Video-Based Learning in Times of COVID-19: A TAM/TTF Perspective. Int. J. Hum. Comput. Interact. 2021, 37, 903–921. [Google Scholar] [CrossRef]
- Ain, N.U.; Kaur, K.; Waheed, M. The influence of learning value on learning management system use: An extension of UTAUT2. Inf. Dev. 2016, 32, 1306–1321. [Google Scholar] [CrossRef]
- Paulo, M.M.; Rita, P.; Oliveira, T.; Moro, S. Understanding mobile augmented reality adoption in a consumer context. J. Hosp. Tour. Technol. 2018, 9, 142–157. [Google Scholar] [CrossRef]
- Zheng, J.; Li, S. What drives students’ intention to use tablet computers: An extended technology acceptance model. Int. J. Educ. Res. 2020, 102, 101612. [Google Scholar] [CrossRef]
- Dahri, N.A.; Vighio, M.S.; Bather, J.D.; Arain, A.A. Factors influencing the acceptance of mobile collaborative learning for the continuous professional development of teachers. Sustainability 2021, 13, 13222. [Google Scholar] [CrossRef]
- Wijaya, T.T.; Zhou, Y.; Houghton, T.; Weinhandl, R.; Lavicza, Z.; Yusop, F.D. Factors affecting the use of digital mathematics textbooks in Indonesia. Mathematics 2022, 10, 1808. [Google Scholar] [CrossRef]
- Zhou, Y.; Li, X.; Wijaya, T.T. Determinants of Behavioral Intention and Use of Interactive Whiteboard by K-12 Teachers in Remote and Rural Areas. Front. Psychol. 2022, 13, 934423. [Google Scholar] [CrossRef]
- Hair, J.F.; Hult, G.T.M.; Ringle, C.; Sarstedt, M. A Primer on Partial Least Squares Structural Equation Modeling (PLS-SEM); SAGE Publications: Thousand Oaks, CA, USA, 2016. [Google Scholar]
- Fornell, C.; Larcker, D.F. Evaluating structural equation models with unobservable variables and measurement error. J. Mark. Res. 1981, 18, 39–50. [Google Scholar] [CrossRef]
- Kock, N. Common method bias in PLS-SEM: A full collinearity assessment approach. Int. J. E-Collab. 2015, 11, 1–10. [Google Scholar] [CrossRef]
- Wijnen, F.; van der Molen, J.W.; Voogt, J. Primary school teachers’ attitudes toward technology use and stimulating higher-order thinking in students: A review of the literature. J. Res. Technol. Educ. 2021, 1–23. [Google Scholar] [CrossRef]
- Alturki, U.; Aldraiweesh, A. Students’ Perceptions of the Actual Use of Mobile Learning during COVID-19 Pandemic in Higher Education. Sustainability 2022, 14, 1125. [Google Scholar] [CrossRef]
- Li, Y.; Zhao, M. A Study on the Influencing Factors of Continued Intention to Use MOOCs: UTAUT Model and CCC Moderating Effect. Front. Psychol. 2021, 12, 1–13. [Google Scholar] [CrossRef]
- Khalid, B.; Chaveesuk, S.; Chaiyasoonthorn, W. Moocs adoption in higher education: A management perspective. Polish J. Manag. Stud. 2021, 23, 239–256. [Google Scholar] [CrossRef]
- Wijaya, T.T.; Cao, Y.; Bernard, M.; Rahmadi, I.F.; Lavicza, Z.; Surjono, H.D. Factors influencing microgame adoption among secondary school mathematics teachers supported by structural equation modelling-based research. Front. Psychol. 2022, 13, 1–16. [Google Scholar] [CrossRef]
- Wijaya, T.T.; Weinhandl, R. Factors Influencing Students’ Continuous Intentions for Using Micro-Lectures in the Post-COVID-19 Period: A Modification of the UTAUT-2 Approach. Electronics 2022, 11, 1924. [Google Scholar] [CrossRef]
- Mujalli, A.; Khan, T.; Almgrashi, A. University Accounting Students and Faculty Members Using the Blackboard Platform during COVID-19; Proposed Modification of the UTAUT Model and an Empirical Study. Sustainability 2022, 14, 2360. [Google Scholar] [CrossRef]
- Timothy, K.W.; Sharon, T. Interactive Whiteboard Acceptance: Applicability of the UTAUT Model to Student Teachers. Asia-Pacific Educ. Res. 2013, 22, 1–10. [Google Scholar] [CrossRef]
- Joa, C.Y.; Magsamen-Conrad, K. Social influence and UTAUT in predicting digital immigrants’ technology use. Behav. Inf. Technol. 2021, 41, 1620–1638. [Google Scholar] [CrossRef]
- Balasundaram, M.; Porter, M.; Miller, S.; Sivakumar, D.; Fleming, A.; McCallie, K. Increasing Parent Satisfaction with Discharge Planning: An Improvement Project Using Technology in a Level 3 NICU. Adv. Neonatal Care 2021, 22, 108–118. [Google Scholar] [CrossRef]
- Courage, M.L.; Frizzell, L.M.; Walsh, C.S.; Smith, M. Toddlers Using Tablets: They Engage, Play, and Learn. Front. Psychol. 2021, 12, 564479. [Google Scholar] [CrossRef]
- Ramkalawon, L.; Bholoa, A. Using tablet PC in the teaching and learning of secondary mathematics: A case of a girl’s class in Mauritius. In Proceedings of the 2016 SAI Computing Conference (SAI), London, UK, 13–15 July 2016; pp. 850–857. [Google Scholar] [CrossRef]
- Courtois, C.; Montrieux, H.; de Grove, F.; Raes, A.; de Marez, L.; Schellens, T. Student acceptance of tablet devices in secondary education: A three-wave longitudinal cross-lagged case study. Comput. Human Behav. 2014, 35, 278–286. [Google Scholar] [CrossRef]
- Haksız, M. Investigation of Tablet Computer Use in Special Education Teachers’ Courses. Procedia Soc. Behav. Sci. 2014, 141, 1392–1399. [Google Scholar] [CrossRef][Green Version]
- Clarke, L.; Abbott, L. Young pupils’, their teacher’s and classroom assistants’ experiences of iPads in a Northern Ireland school: ‘Four and five years old, who would have thought they could do that?’. Br. J. Educ. Technol. 2016, 47, 1051–1064. [Google Scholar] [CrossRef]
- Martins, M.; Farias, J.S.; Albuquerque, P.H.M.; Pereira, D.S. Adoption of technology for reading purposes: A study articles of e-books acceptance. Braz. Bus. Rev. 2018, 15, 568–588. [Google Scholar] [CrossRef]
- El-Masri, M.; Tarhini, A. Factors affecting the adoption of e-learning systems in Qatar and USA: Extending the Unified Theory of Acceptance and Use of Technology 2 (UTAUT2). Educ. Technol. Res. Dev. 2017, 65, 743–763. [Google Scholar] [CrossRef]
- Priporas, C.V.; Stylos, N.; Fotiadis, A.K. Generation Z consumers’ expectations of interactions in smart retailing: A future agenda. Comput. Human Behav. 2017, 77, 374–381. [Google Scholar] [CrossRef]
- Cilliers, E.J. The Challenge of Teaching Generation Z. PEOPLE Int. J. Soc. Sci. 2017, 3, 188–198. [Google Scholar] [CrossRef]


| Demographic Information | Item | Xining | Beijing | ||
|---|---|---|---|---|---|
| N | % | N | % | ||
| Level education | undergraduate | 154 | 66.38 | 114 | 49.14 |
| Master degree | 73 | 31.47 | 52 | 22.41 | |
| Doctoral student | 5 | 2.16 | 48 | 20.69 | |
| major | science | 65 | 28.02 | 92 | 39.66 |
| social | 167 | 71.98 | 122 | 52.59 | |
| gender | male | 72 | 32.33 | 93 | 40.09 |
| female | 160 | 68.97 | 121 | 52.16 | |
| age | 18–24 years old | 148 | 63.79 | 113 | 48.71 |
| 25–30 years old | 61 | 26.29 | 64 | 27.59 | |
| Upper 30 | 23 | 9.91 | 37 | 15.95 | |
| Daily use of tablet computers for learning purposes | Less than 2 h | 28 | 12.07 | 51 | 21.98 |
| 2–5 h | 97 | 41.81 | 44 | 18.97 | |
| More than 5 h | 107 | 46.12 | 119 | 51.29 | |
| How often do you use tablet computer for learning purposes? | occasionally | 41 | 17.67 | 8 | 0.03 |
| often | 69 | 29.74 | 51 | 21.98 | |
| Primary learning tool | 122 | 52.59 | 155 | 66.81 | |
| Measurement Items | Factor Loading | Cronbach Alpha | Composite Eability | AVE | ||||
|---|---|---|---|---|---|---|---|---|
| Rural | Urban | Rural | Urban | Rural | Urban | Rural | Urban | |
| Behavioral intention | 0.959 | 0.939 | 0.973 | 0.961 | 0.924 | 0.891 | ||
| BI1 | 0.967 | 0.939 | ||||||
| BI2 | 0.962 | 0.963 | ||||||
| BI3 | 0.955 | 0.929 | ||||||
| Facilitating conditions | 0.825 | 0.821 | 0.894 | 0.894 | 0.738 | 0.737 | ||
| FC1 | 0.897 | 0.886 | ||||||
| FC2 | 0.796 | 0.809 | ||||||
| FC3 | 0.880 | 0.879 | ||||||
| Habit | 0.903 | 0.823 | 0.939 | 0.895 | 0.837 | 0.739 | ||
| HAB1 | 0.916 | 0.847 | ||||||
| HAB2 | 0.903 | 0.848 | ||||||
| HAB3 | 0.925 | 0.884 | ||||||
| Hedonic motivation | 0.929 | 0.924 | 0.955 | 0.952 | 0.876 | 0.868 | ||
| HM1 | 0.935 | 0.896 | ||||||
| HM2 | 0.935 | 0.951 | ||||||
| HM3 | 0.938 | 0.946 | ||||||
| Individual characteristic | 0.940 | 0.914 | 0.961 | 0.946 | 0.892 | 0.853 | ||
| IC1 | 0.937 | 0.918 | ||||||
| IC2 | 0.949 | 0.939 | ||||||
| IC3 | 0.948 | 0.913 | ||||||
| innovativeness | 0.934 | 0.895 | 0.958 | 0.935 | 0.883 | 0.827 | ||
| INV1 | 0.939 | 0.900 | ||||||
| INV2 | 0.942 | 0.939 | ||||||
| INV3 | 0.937 | 0.888 | ||||||
| Effort expectancy | 0.860 | 0.870 | 0.915 | 0.921 | 0.781 | 0.795 | ||
| EE1 | 0.860 | 0.859 | ||||||
| EE2 | 0.926 | 0.913 | ||||||
| EE3 | 0.865 | 0.902 | ||||||
| Performance expectancy | 0.894 | 0.927 | 0.935 | 0.954 | 0.827 | 0.873 | ||
| PE1 | 0.851 | 0.917 | ||||||
| PE2 | 0.946 | 0.952 | ||||||
| PE3 | 0.928 | 0.933 | ||||||
| Price value | 0.834 | 0.857 | 0.900 | 0.914 | 0.750 | 0.780 | ||
| PV1 | 0.821 | 0.876 | ||||||
| PV2 | 0.912 | 0.938 | ||||||
| PV3 | 0.863 | 0.832 | ||||||
| Subjective Norm (SN) | 0.858 | 0.812 | 0.913 | 0.888 | 0.778 | 0.725 | ||
| SN1 | 0.864 | 0.818 | ||||||
| SN2 | 0.868 | 0.857 | ||||||
| SN3 | 0.914 | 0.879 | ||||||
| Technology characteristics | 0.921 | 0.861 | 0.950 | 0.915 | 0.864 | 0.783 | ||
| TC1 | 0.933 | 0.890 | ||||||
| TC2 | 0.930 | 0.926 | ||||||
| TC3 | 0.925 | 0.837 | ||||||
| Task technology fit | 0.888 | 0.776 | 0.931 | 0.869 | 0.818 | 0.692 | ||
| TTF1 | 0.921 | 0.906 | ||||||
| TTF2 | 0.945 | 0.872 | ||||||
| TTF3 | 0.844 | 0.704 | ||||||
| Usage behavior | 0.913 | 0.888 | 0.945 | 0.931 | 0.852 | 0.817 | ||
| UB1 | 0.927 | 0.891 | ||||||
| UB2 | 0.921 | 0.907 | ||||||
| UB3 | 0.921 | 0.914 | ||||||
| AU | BI | FC | HB | HM | IC | INV | PEU | PU | PV | SN | TC | TTF | |
|---|---|---|---|---|---|---|---|---|---|---|---|---|---|
| AU | 0.904 | ||||||||||||
| BI | 0.849 | 0.944 | |||||||||||
| FC | 0.721 | 0.717 | 0.859 | ||||||||||
| HB | 0.780 | 0.674 | 0.673 | 0.860 | |||||||||
| HM | 0.789 | 0.706 | 0.615 | 0.736 | 0.932 | ||||||||
| IC | 0.844 | 0.781 | 0.687 | 0.762 | 0.753 | 0.923 | |||||||
| INV | 0.752 | 0.693 | 0.656 | 0.681 | 0.704 | 0.751 | 0.909 | ||||||
| PEU | 0.711 | 0.695 | 0.724 | 0.665 | 0.647 | 0.664 | 0.651 | 0.891 | |||||
| PU | 0.734 | 0.685 | 0.683 | 0.704 | 0.676 | 0.738 | 0.680 | 0.724 | 0.934 | ||||
| PV | 0.672 | 0.679 | 0.703 | 0.666 | 0.614 | 0.624 | 0.644 | 0.654 | 0.627 | 0.883 | |||
| SN | 0.621 | 0.615 | 0.638 | 0.588 | 0.564 | 0.621 | 0.547 | 0.590 | 0.581 | 0.585 | 0.852 | ||
| TC | 0.820 | 0.787 | 0.721 | 0.690 | 0.698 | 0.770 | 0.741 | 0.709 | 0.672 | 0.657 | 0.596 | 0.885 | |
| TTF | 0.800 | 0.771 | 0.658 | 0.707 | 0.690 | 0.780 | 0.695 | 0.693 | 0.606 | 0.661 | 0.637 | 0.837 | 0.832 |
| AU | BI | FC | HB | HM | IC | INV | PEU | PU | PV | SN | TC | TTF | |
|---|---|---|---|---|---|---|---|---|---|---|---|---|---|
| AU | 0.923 | ||||||||||||
| BI | 0.882 | 0.961 | |||||||||||
| FC | 0.674 | 0.670 | 0.859 | ||||||||||
| HB | 0.718 | 0.660 | 0.687 | 0.915 | |||||||||
| HM | 0.842 | 0.839 | 0.691 | 0.756 | 0.936 | ||||||||
| IC | 0.817 | 0.776 | 0.671 | 0.711 | 0.793 | 0.945 | |||||||
| INV | 0.545 | 0.555 | 0.477 | 0.512 | 0.580 | 0.625 | 0.940 | ||||||
| PEU | 0.633 | 0.636 | 0.695 | 0.601 | 0.641 | 0.594 | 0.436 | 0.884 | |||||
| PU | 0.676 | 0.657 | 0.601 | 0.517 | 0.651 | 0.615 | 0.433 | 0.778 | 0.909 | ||||
| PV | 0.674 | 0.678 | 0.660 | 0.728 | 0.713 | 0.678 | 0.441 | 0.618 | 0.620 | 0.866 | |||
| SN | 0.617 | 0.572 | 0.646 | 0.694 | 0.612 | 0.570 | 0.412 | 0.600 | 0.596 | 0.576 | 0.882 | ||
| TC | 0.853 | 0.817 | 0.666 | 0.682 | 0.820 | 0.787 | 0.578 | 0.636 | 0.606 | 0.646 | 0.571 | 0.929 | |
| TTF | 0.840 | 0.828 | 0.719 | 0.697 | 0.842 | 0.867 | 0.616 | 0.638 | 0.638 | 0.702 | 0.581 | 0.873 | 0.905 |
| Respondent | Hypothesis | Β | T-Statistics | p-Values | Decision | |
|---|---|---|---|---|---|---|
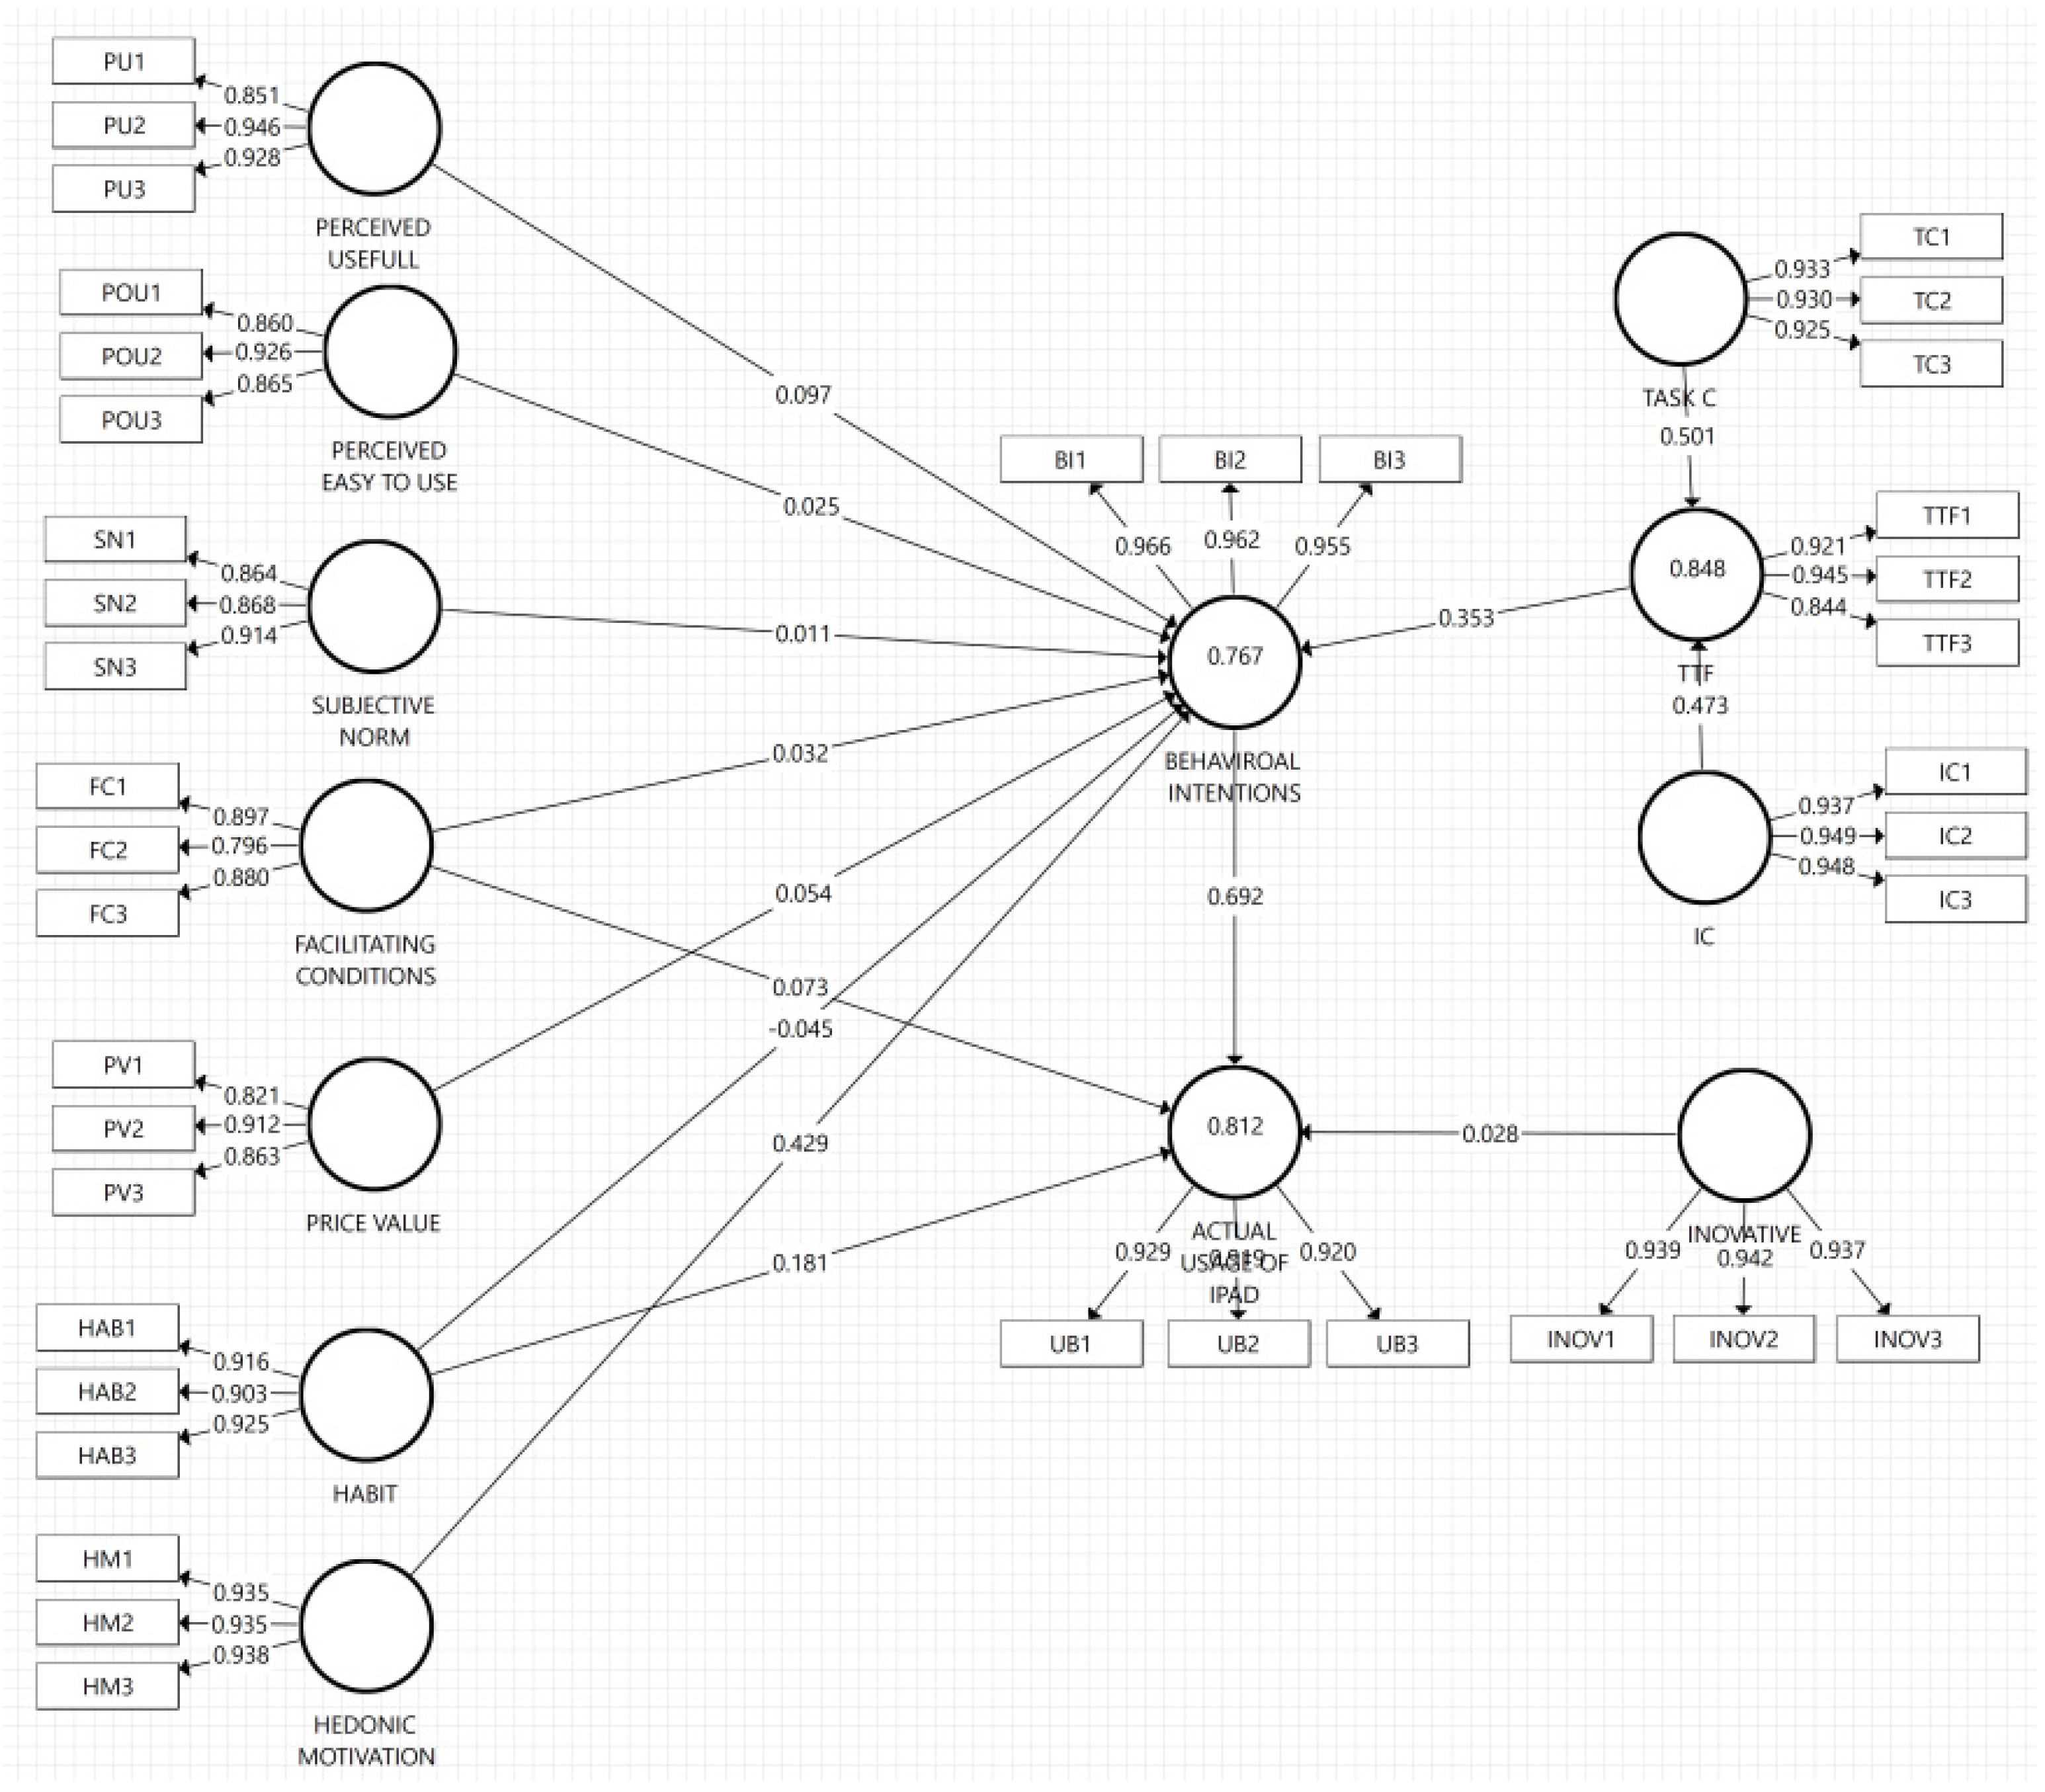
| Xining Rural | H1 | Perceived Useful → Behavioral Intentions | 0.097 | 1.623 | 0.105 | Not-Sig |
| H2 | Perceived Easy to Use → Behavioral Intentions | 0.025 | 0.457 | 0.648 | Not-Sig | |
| H3 | Subjective Norm → Behavioral Intentions | 0.011 | 0.234 | 0.815 | Not-Sig | |
| H4 | Facilitating Conditions → Actual Usage of Tablet Computer | 0.051 | 1.012 | 0.312 | Not-Sig | |
| H5 | Facilitating Conditions → Behavioral Intentions | 0.032 | 0.494 | 0.622 | Not-Sig | |
| H6 | Hedonic Motivation → Behavioral Intentions | 0.429 *** | 5.049 | 0.000 | Sig | |
| H7 | Price Value → Behavioral Intentions | 0.054 | 0.805 | 0.421 | Not-Sig | |
| H8 | Habit → Actual Usage of Tablet Computer | 0.212 *** | 4.291 | 0.000 | Sig | |
| H9 | Habit → Behavioral Intentions | −0.045 | 0.575 | 0.566 | Not-Sig | |
| H10 | Innovativeness → Actual Usage of Tablet Computer | 0.028 | 0.750 | 0.454 | Not-Sig | |
| H11 | Task Characteristics → Task Technology Fit | 0.501 *** | 8.568 | 0.000 | Sig | |
| H12 | Individual Characteristics → Task Technology Fit | 0.473 *** | 8.513 | 0.000 | Sig | |
| H13 | Task Technology Fit → Behavioral Intentions | 0.353 *** | 3.816 | 0.000 | Sig | |
| H14 | Behavioral Intentions → Actual Usage of Tablet Computer | 0.692 *** | 12.714 | 0.000 | Sig | |
| Beijing Urban | T Statistics | p-Values | ||||
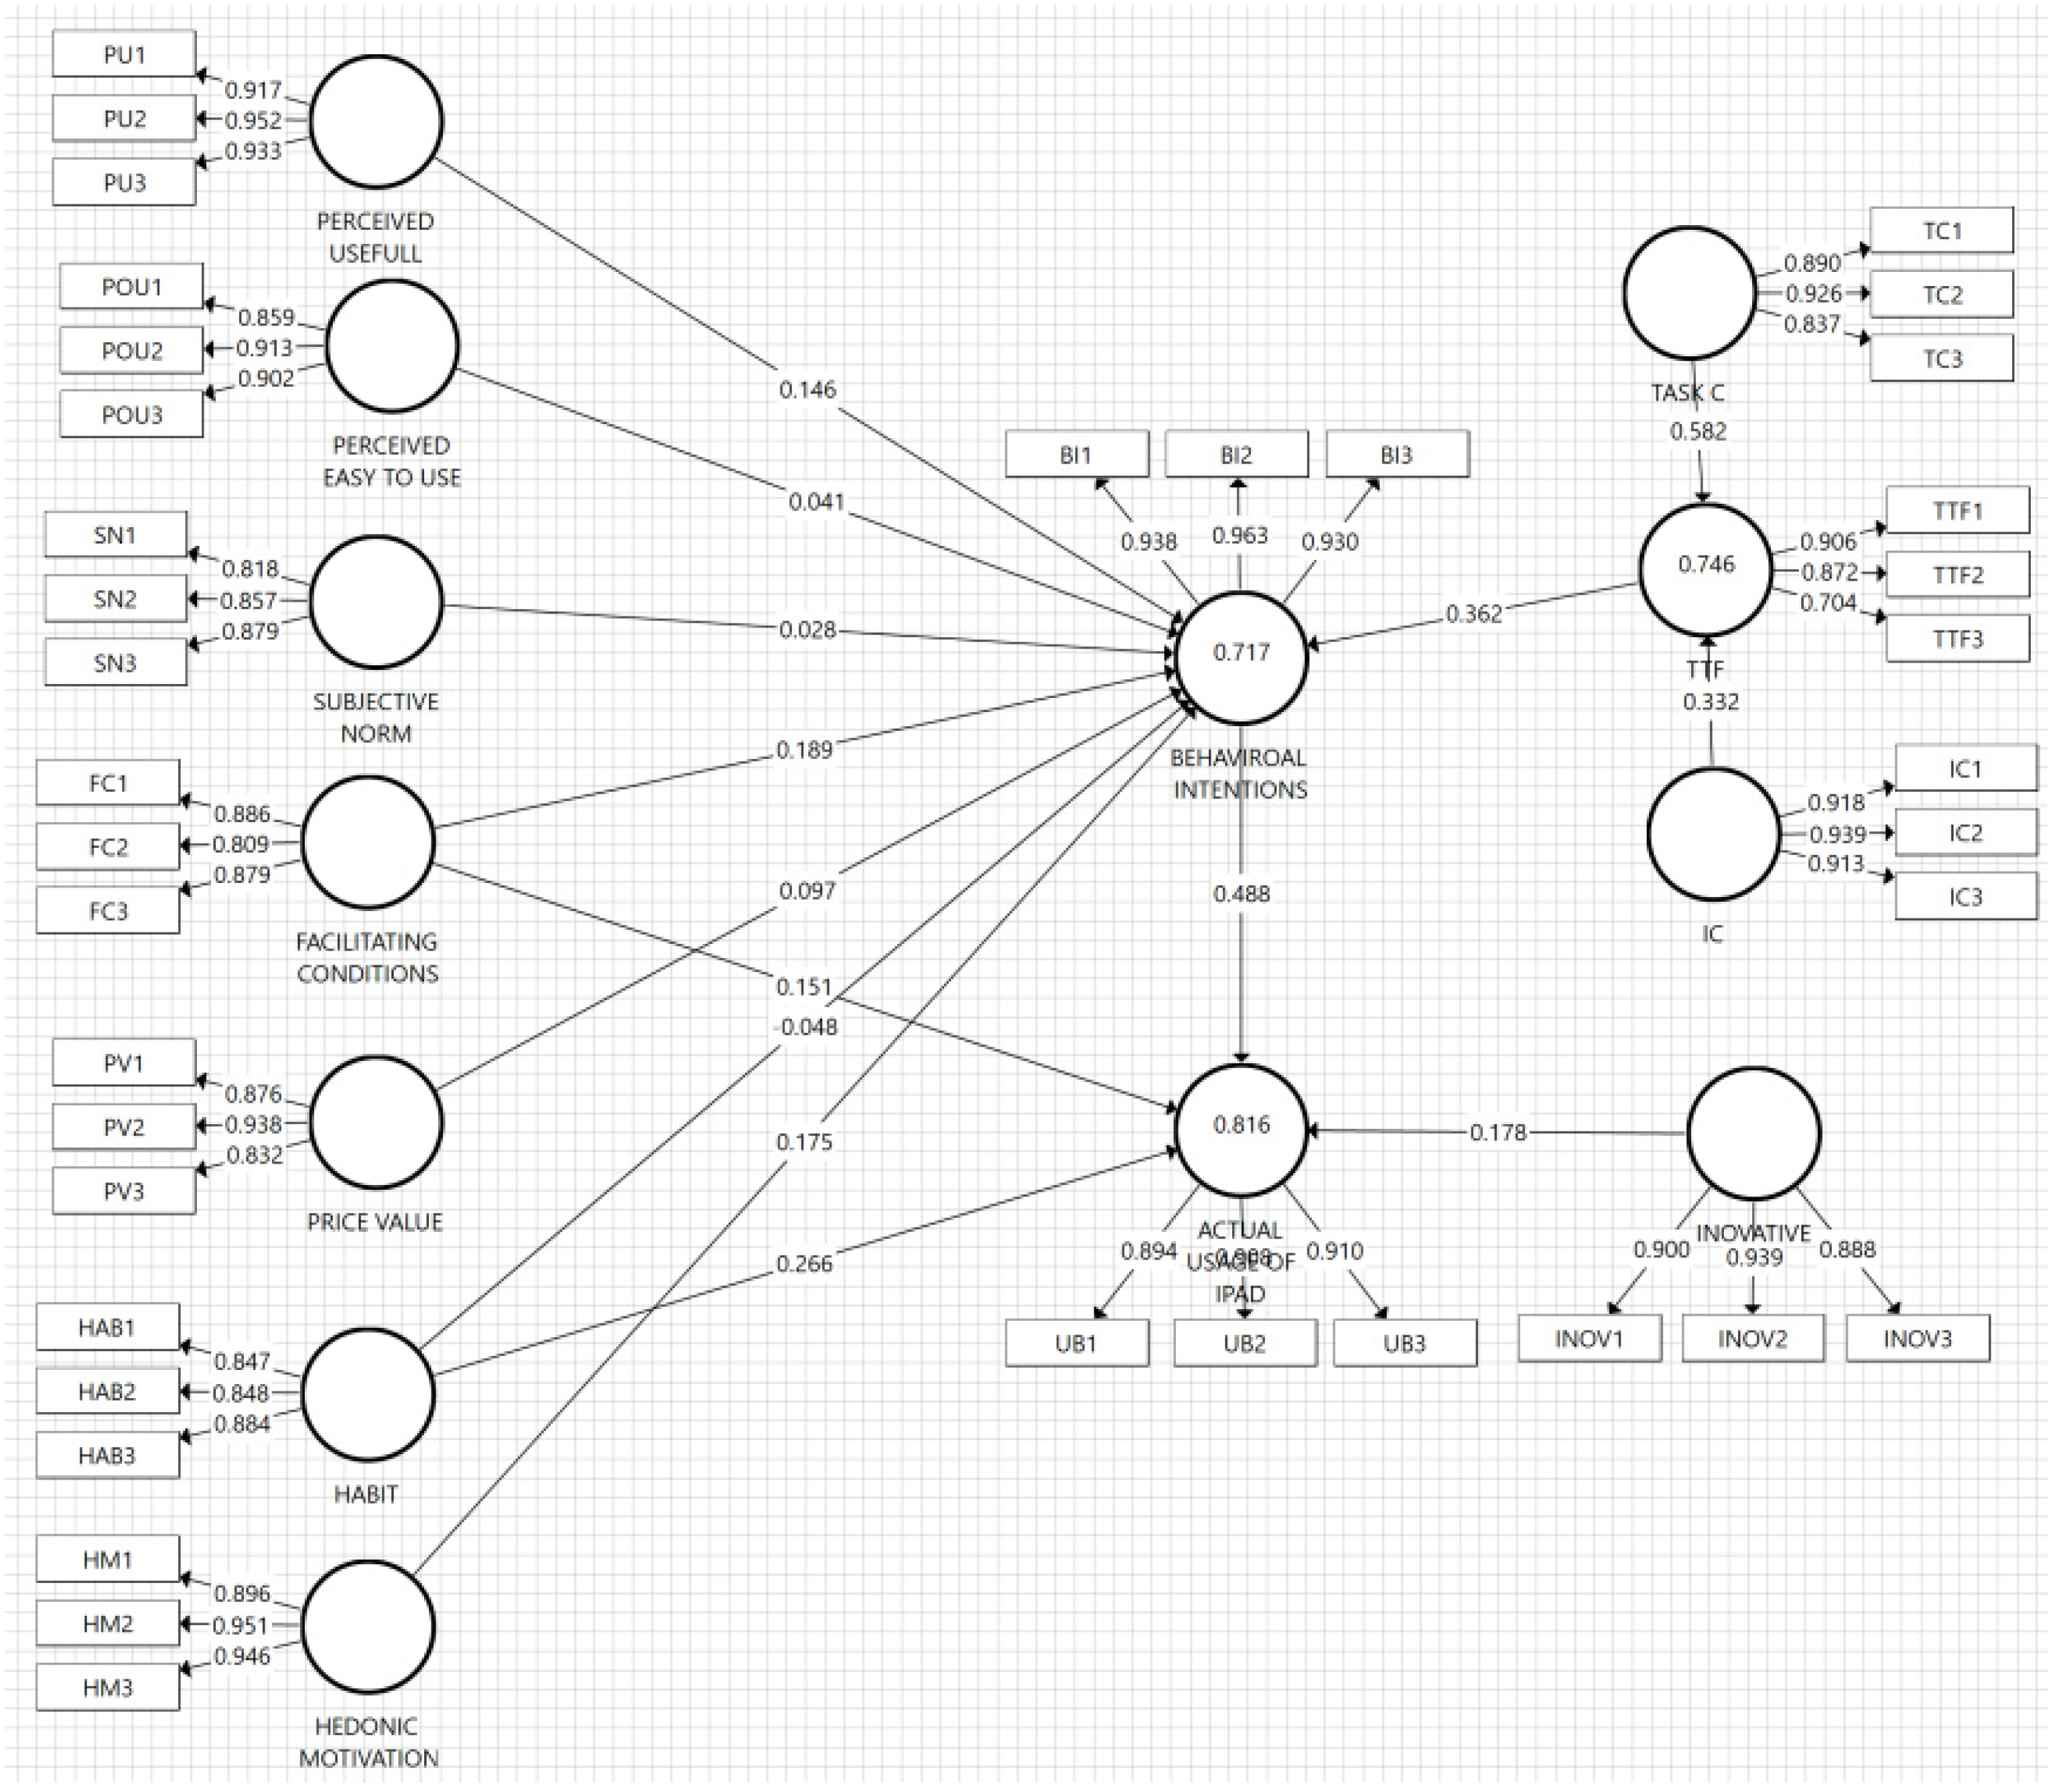
| H1 | Perceived Useful → Behavioral Intentions | 0.146 * | 2.276 | 0.023 | Sig | |
| H2 | Perceived Easy to Use → Behavioral Intentions | 0.041 | 0.593 | 0.554 | Not-Sig | |
| H3 | Subjective Norm → Behavioral Intentions | 0.028 | 0.512 | 0.609 | Not-Sig | |
| H4 | Facilitating Conditions → Actual Usage of Tablet Computer | 0.059 | 1.158 | 0.247 | Not-Sig | |
| H5 | Facilitating Conditions → Behavioral Intentions | 0.189 ** | 2.567 | 0.011 | Sig | |
| H6 | Hedonic Motivation → Behavioral Intentions | 0.175 ** | 2.652 | 0.008 | Sig | |
| H7 | Price Value → Behavioral Intentions | 0.097 | 1.331 | 0.184 | Not-Sig | |
| H8 | Habit → Actual Usage of Tablet Computer | 0.289 *** | 5.419 | 0.000 | Sig | |
| H9 | Habit → Behavioral Intentions | −0.048 | 0.739 | 0.460 | Not-Sig | |
| H10 | Innovativeness → Actual Usage of Tablet Computer | 0.178 ** | 2.921 | 0.004 | Sig | |
| H11 | Task Characteristics → Task Technology Fit | 0.582 *** | 8.580 | 0.000 | Sig | |
| H12 | Individual Characteristics → Task Technology Fit | 0.332 *** | 4.718 | 0.000 | Sig | |
| H13 | Task Technology Fit → Behavioral Intentions | 0.362 *** | 4.862 | 0.000 | Sig | |
| H14 | Behavioral Intentions → Actual Usage of Tablet Computer | 0.488 *** | 7.350 | 0.000 | Sig | |
Publisher’s Note: MDPI stays neutral with regard to jurisdictional claims in published maps and institutional affiliations. |
© 2022 by the authors. Licensee MDPI, Basel, Switzerland. This article is an open access article distributed under the terms and conditions of the Creative Commons Attribution (CC BY) license (https://creativecommons.org/licenses/by/4.0/).
Share and Cite
Wang, F.; Wijaya, T.T.; Habibi, A.; Liu, Y. Predictors Influencing Urban and Rural Area students to Use Tablet Computers as Learning Tools: Combination of UTAUT and TTF Models. Sustainability 2022, 14, 13965. https://doi.org/10.3390/su142113965
Wang F, Wijaya TT, Habibi A, Liu Y. Predictors Influencing Urban and Rural Area students to Use Tablet Computers as Learning Tools: Combination of UTAUT and TTF Models. Sustainability. 2022; 14(21):13965. https://doi.org/10.3390/su142113965
Chicago/Turabian StyleWang, Fang, Tommy Tanu Wijaya, Akhmad Habibi, and Yixuan Liu. 2022. "Predictors Influencing Urban and Rural Area students to Use Tablet Computers as Learning Tools: Combination of UTAUT and TTF Models" Sustainability 14, no. 21: 13965. https://doi.org/10.3390/su142113965
APA StyleWang, F., Wijaya, T. T., Habibi, A., & Liu, Y. (2022). Predictors Influencing Urban and Rural Area students to Use Tablet Computers as Learning Tools: Combination of UTAUT and TTF Models. Sustainability, 14(21), 13965. https://doi.org/10.3390/su142113965