Article

Detection of Location from Kits Set Up by Vulnerable People during Earthquake Disasters with Communication Blackout: Study Using YOLOv5 Algorithm

1
Faculty of Transdisciplinary Sciences for Innovation, Institute of Transdisciplinary Sciences for Innovation, Kanazawa University, Kanazawa 920-1192, Japan
2
Division of Environmental Design, Graduate School of Natural Science and Technology, Kanazawa University, Kanazawa 920-1192, Japan
3
Remote Sensing Technology Center of Japan, Minato 105-0001, Japan
4
Graduate School of Sustainable Systems Science, Komatsu University, Komatsu 923-8511, Japan
*
Author to whom correspondence should be addressed.
Sustainability 2022, 14(21), 13895; https://doi.org/10.3390/su142113895
Submission received: 15 July 2022 / Revised: 19 October 2022 / Accepted: 20 October 2022 / Published: 26 October 2022

Abstract

:
When an earthquake occurs, the larger the scale of the disaster, the harder it is to support the victims’ needs. In fact, even the most meager support for victims has become quite difficult. Furthermore, it is also known that the greater the damage, the more difficult it becomes to use cell phones, applications, etc. The authors have developed multiple reflectors observable by synthetic-aperture radar (SAR) satellites and differing backscattering coefficients. Using them, we have proposed a method for ascertaining the location and needs of victims during a large-scale earthquake disaster. In this study, we developed an object detection model using YOLOv5 to detect the reflectors from within SAR images. In addition, we constructed a method for managing setup locations in GIS by conferring latitude and longitude information on reflectors obtained through YOLO v5. Through analysis, a model of the proposed reflector detection and identification of setup locations via GIS was developed in this study.

1. Introduction

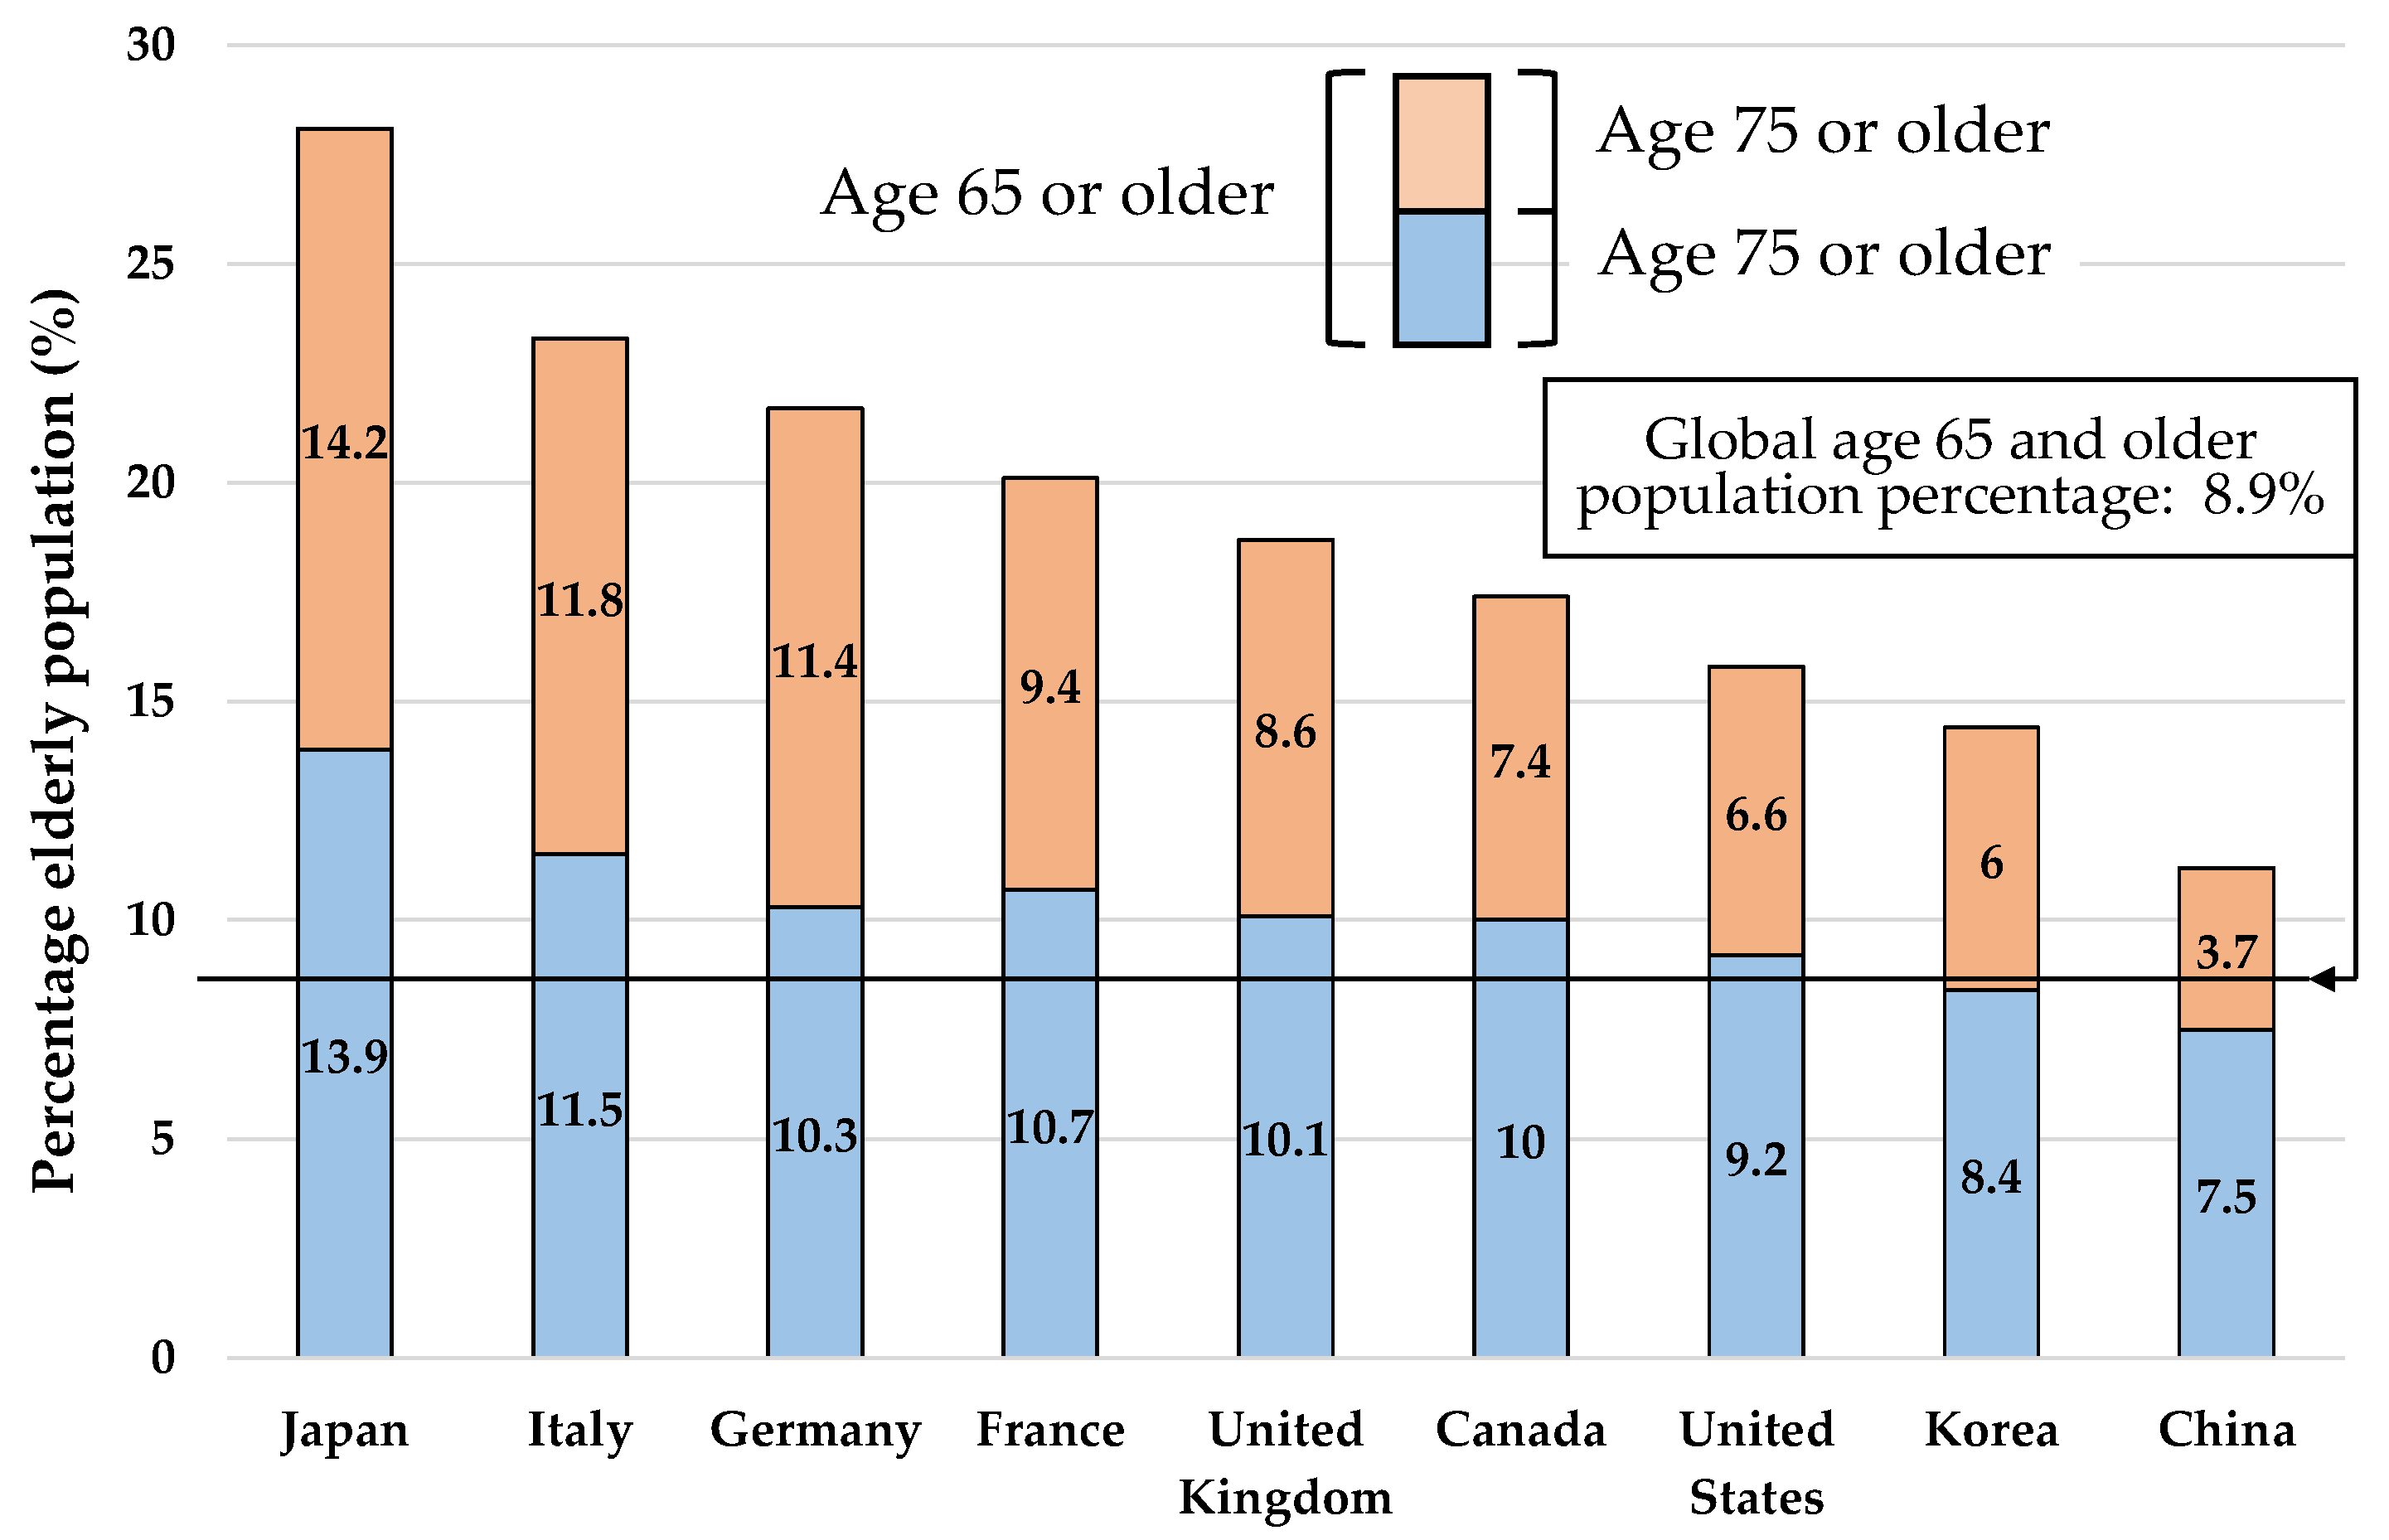
1.1. Study Background

The percentage of the population aged 65 years and older is the highest in Japan; this value was 28.1% as of 2018, as shown in Figure 1. This means that the country’s aging rate is considerably higher than that of other developed nations [1]. There are concerns that this rapid aging will result in social imbalances in ensuring medical care and welfare. In addition, Japan is prone to various natural disasters, owing to its natural location, terrain, geographical features, and climate. Recently, major disasters have occurred in the form of the Great East Japan Earthquake in 2011, the Kumamoto Earthquake in 2016, and the Hokkaido Eastern Iburi Earthquake in 2018. One of the major problems that arise in Japan during earthquake disasters is that many elderly people are affected. Individuals aged 65 and older, individual differences notwithstanding, are in a period of physical and mental decline. Therefore, in many cases, they require third-person assistance during the various phases of a disaster, from lifesaving to evacuation, and post-evacuation survival. As described above, Japan is facing an aging future, thus, establishing emergency measures focusing specifically on the elderly is a pressing issue.
One support system for the elderly in Japan is the List of Persons Requiring Assistance during Evacuations [2]. This was first created after the 2011 Great East Japan Earthquake, and it lists all persons for whom self-evacuation would be difficult during a disaster. During disasters, support is provided based on this list, and it considers each person’s nursing care category, disability support category, family structure, and decision-making ability. Listed persons disclose their address, physical status, and other information primarily for the benefit of the municipal workers who provide them with assistance. However, a considerable number of elderly individuals are not included. No technology has yet been developed to collect information on the location and needs for vulnerable people during a large-scale earthquake disaster with communication blackout.

1.2. Concept of This Study

We proposed a method to determine the location and needs of victims of previous disasters (especially persons requiring special consideration) [3,4,5]. We used images acquired by synthetic-aperture radar (SAR) satellites to ascertain the location and needs. Then, we developed multiple reflectors (Figure 2) of differing backscattering coefficients (hereinafter, σ 0 ); the reflectors exhibit reflection intensities that were observable by SAR satellites, and they were used to ascertain post-disaster location and needs (hereinafter, these reflectors are referred to as quadrilateral reflectors, hexagonal reflectors, and nonagonal reflectors). The reflectors are composed of aluminum, and their shapes are changed by the number of their partitions. The process of ascertaining the location and needs of victims requires the victims to set up reflectors after a disaster, as shown in Figure 3, which are then observed by SAR satellites that scan for the ground surface and reflectors. Thus, it is possible to identify the location of the reflectors set up by the victims (victim locations). Different numbers of partitions within reflectors are used to determine the victim’s need. Differences in need are pre-set as a difference in σ 0 , wherein victims set up reflectors in the shape matching their post-disaster needs. From the above, it is possible to identify victim locations and needs based on the setting out of reflectors and the differences in σ 0 , respectively.
Furthermore, the proposed method will presumably be used immediately after large-scale earthquake disasters, in which communication environments have been cut off. During disasters in which communication environments have been secured and outside communication is available, victims can use mobile phones and social media for communication. However, the proposed tool presumes that the means of external communication have been completely disconnected.
The authors’ previous research is as follows:
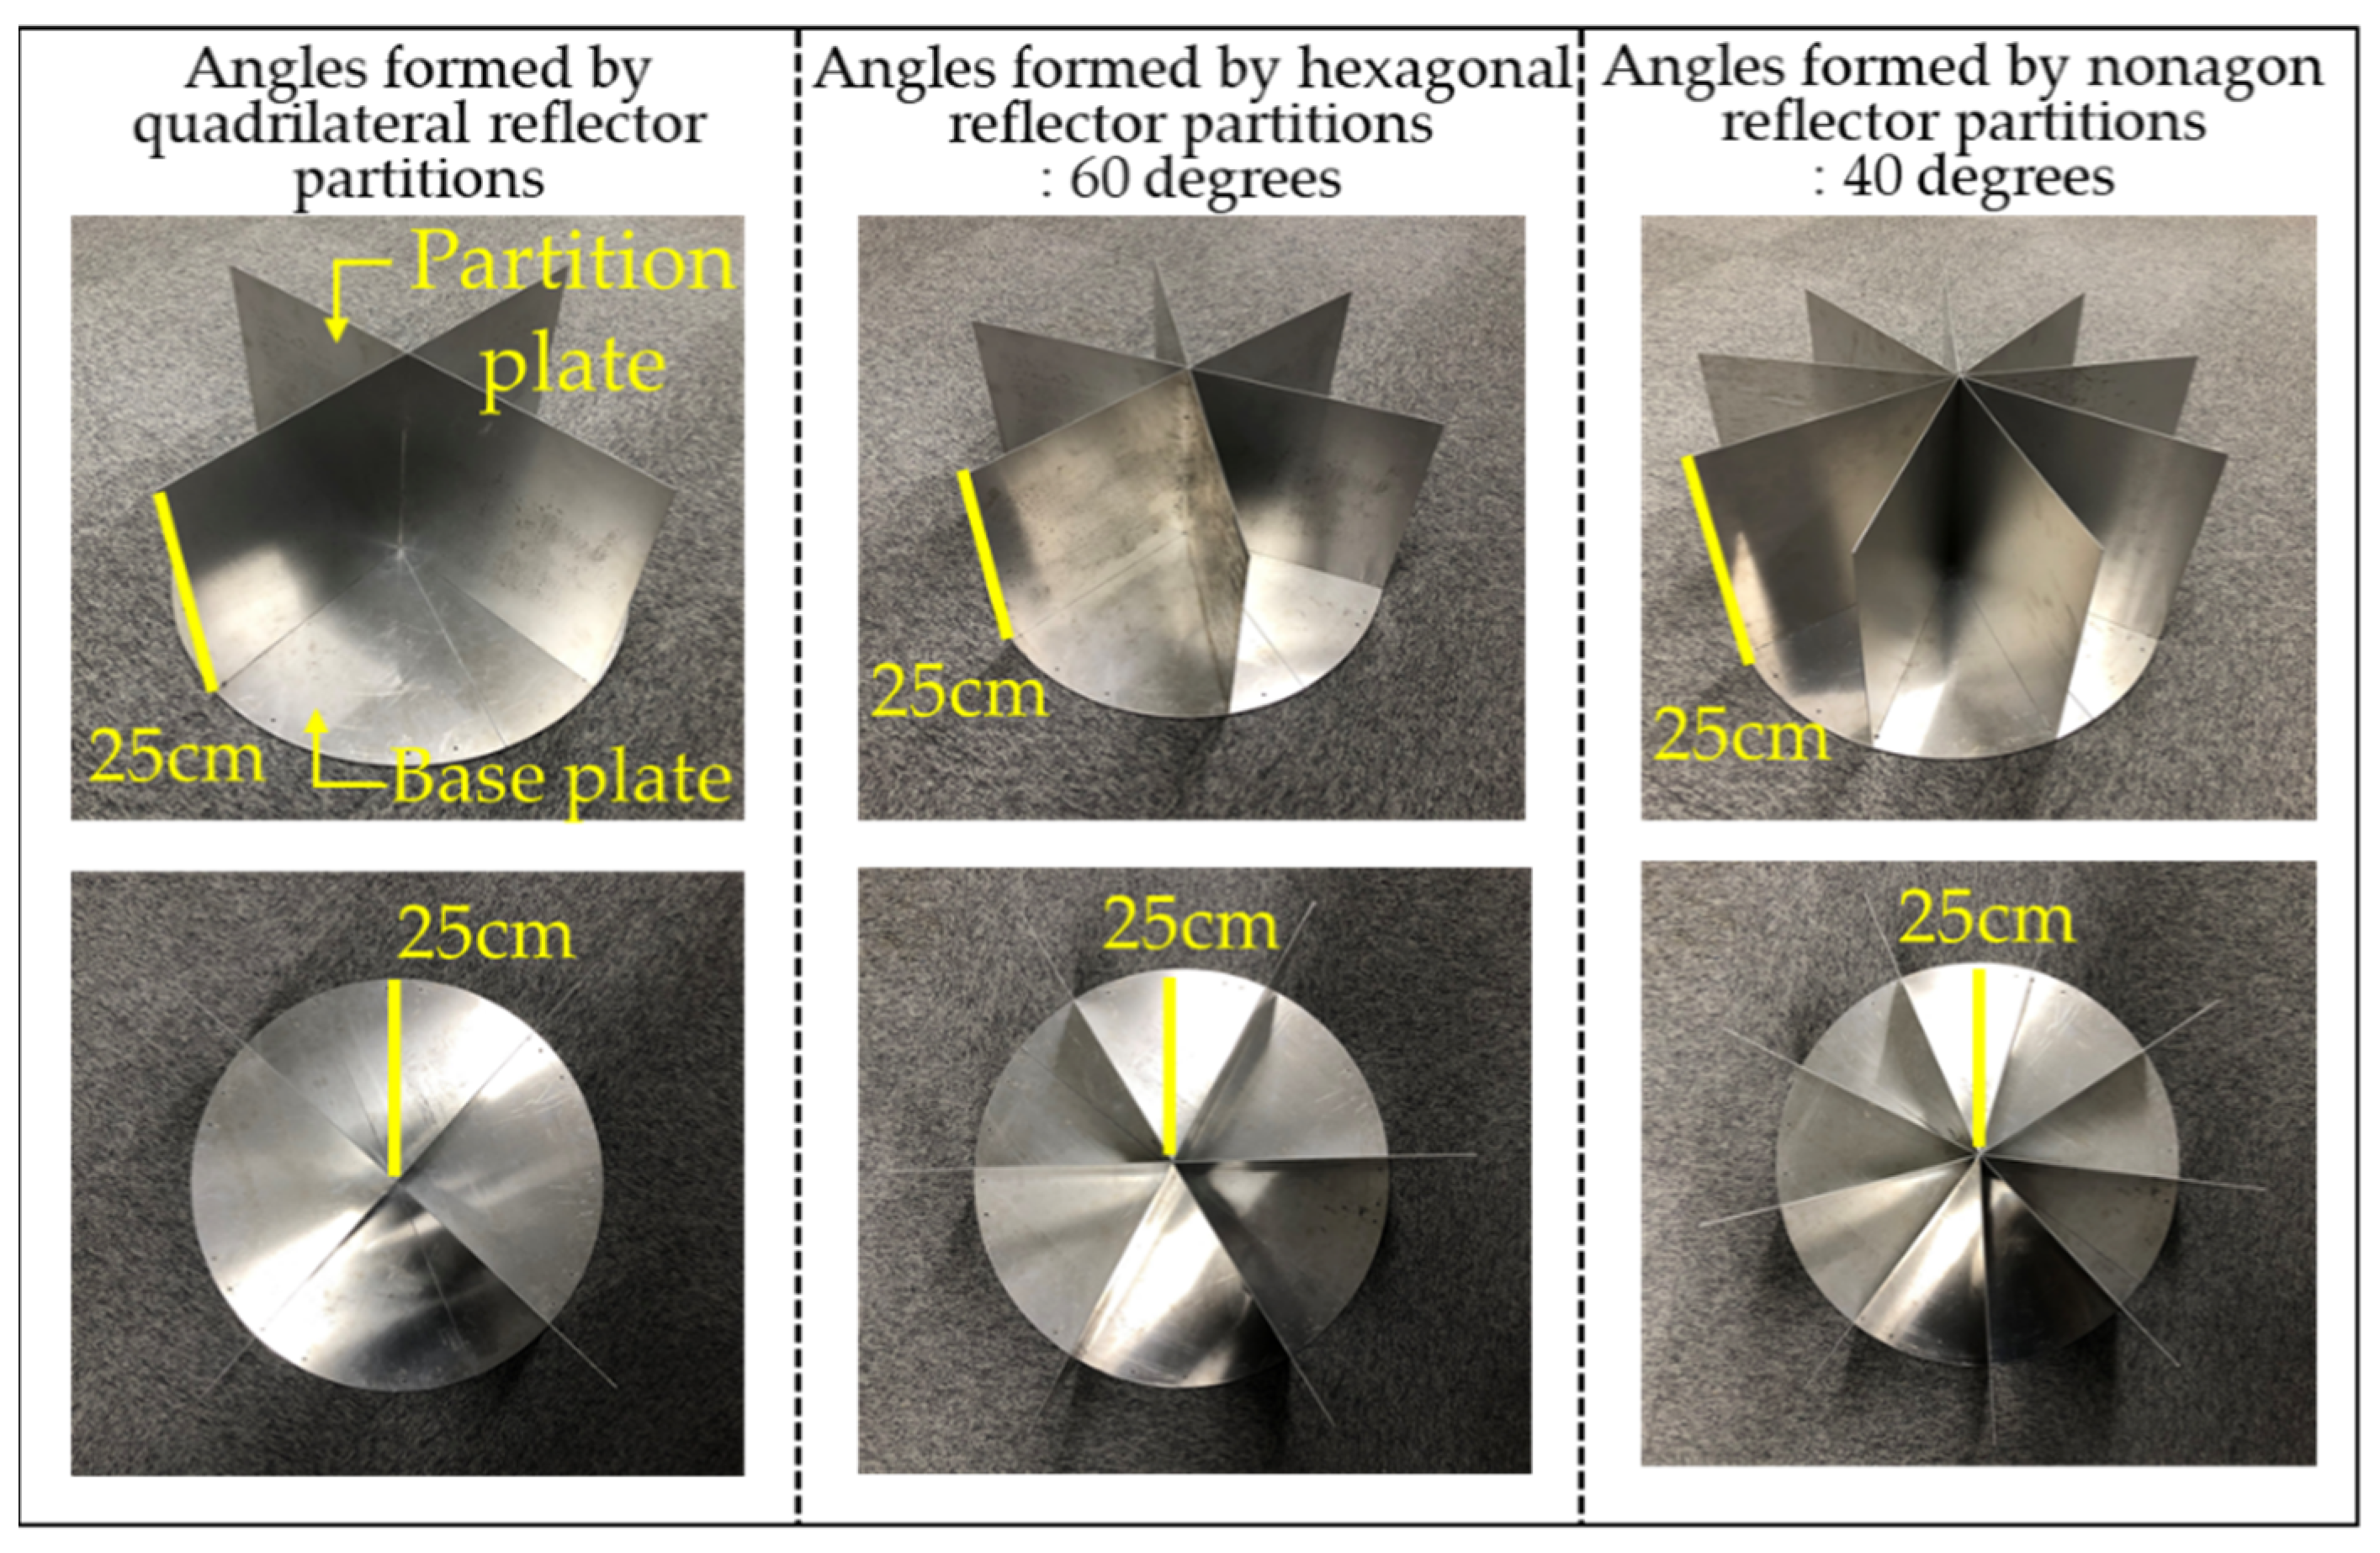
  • Development of multiple reflectors with different σ 0 and proposal of a method to determine a victim’s location and needs [3].
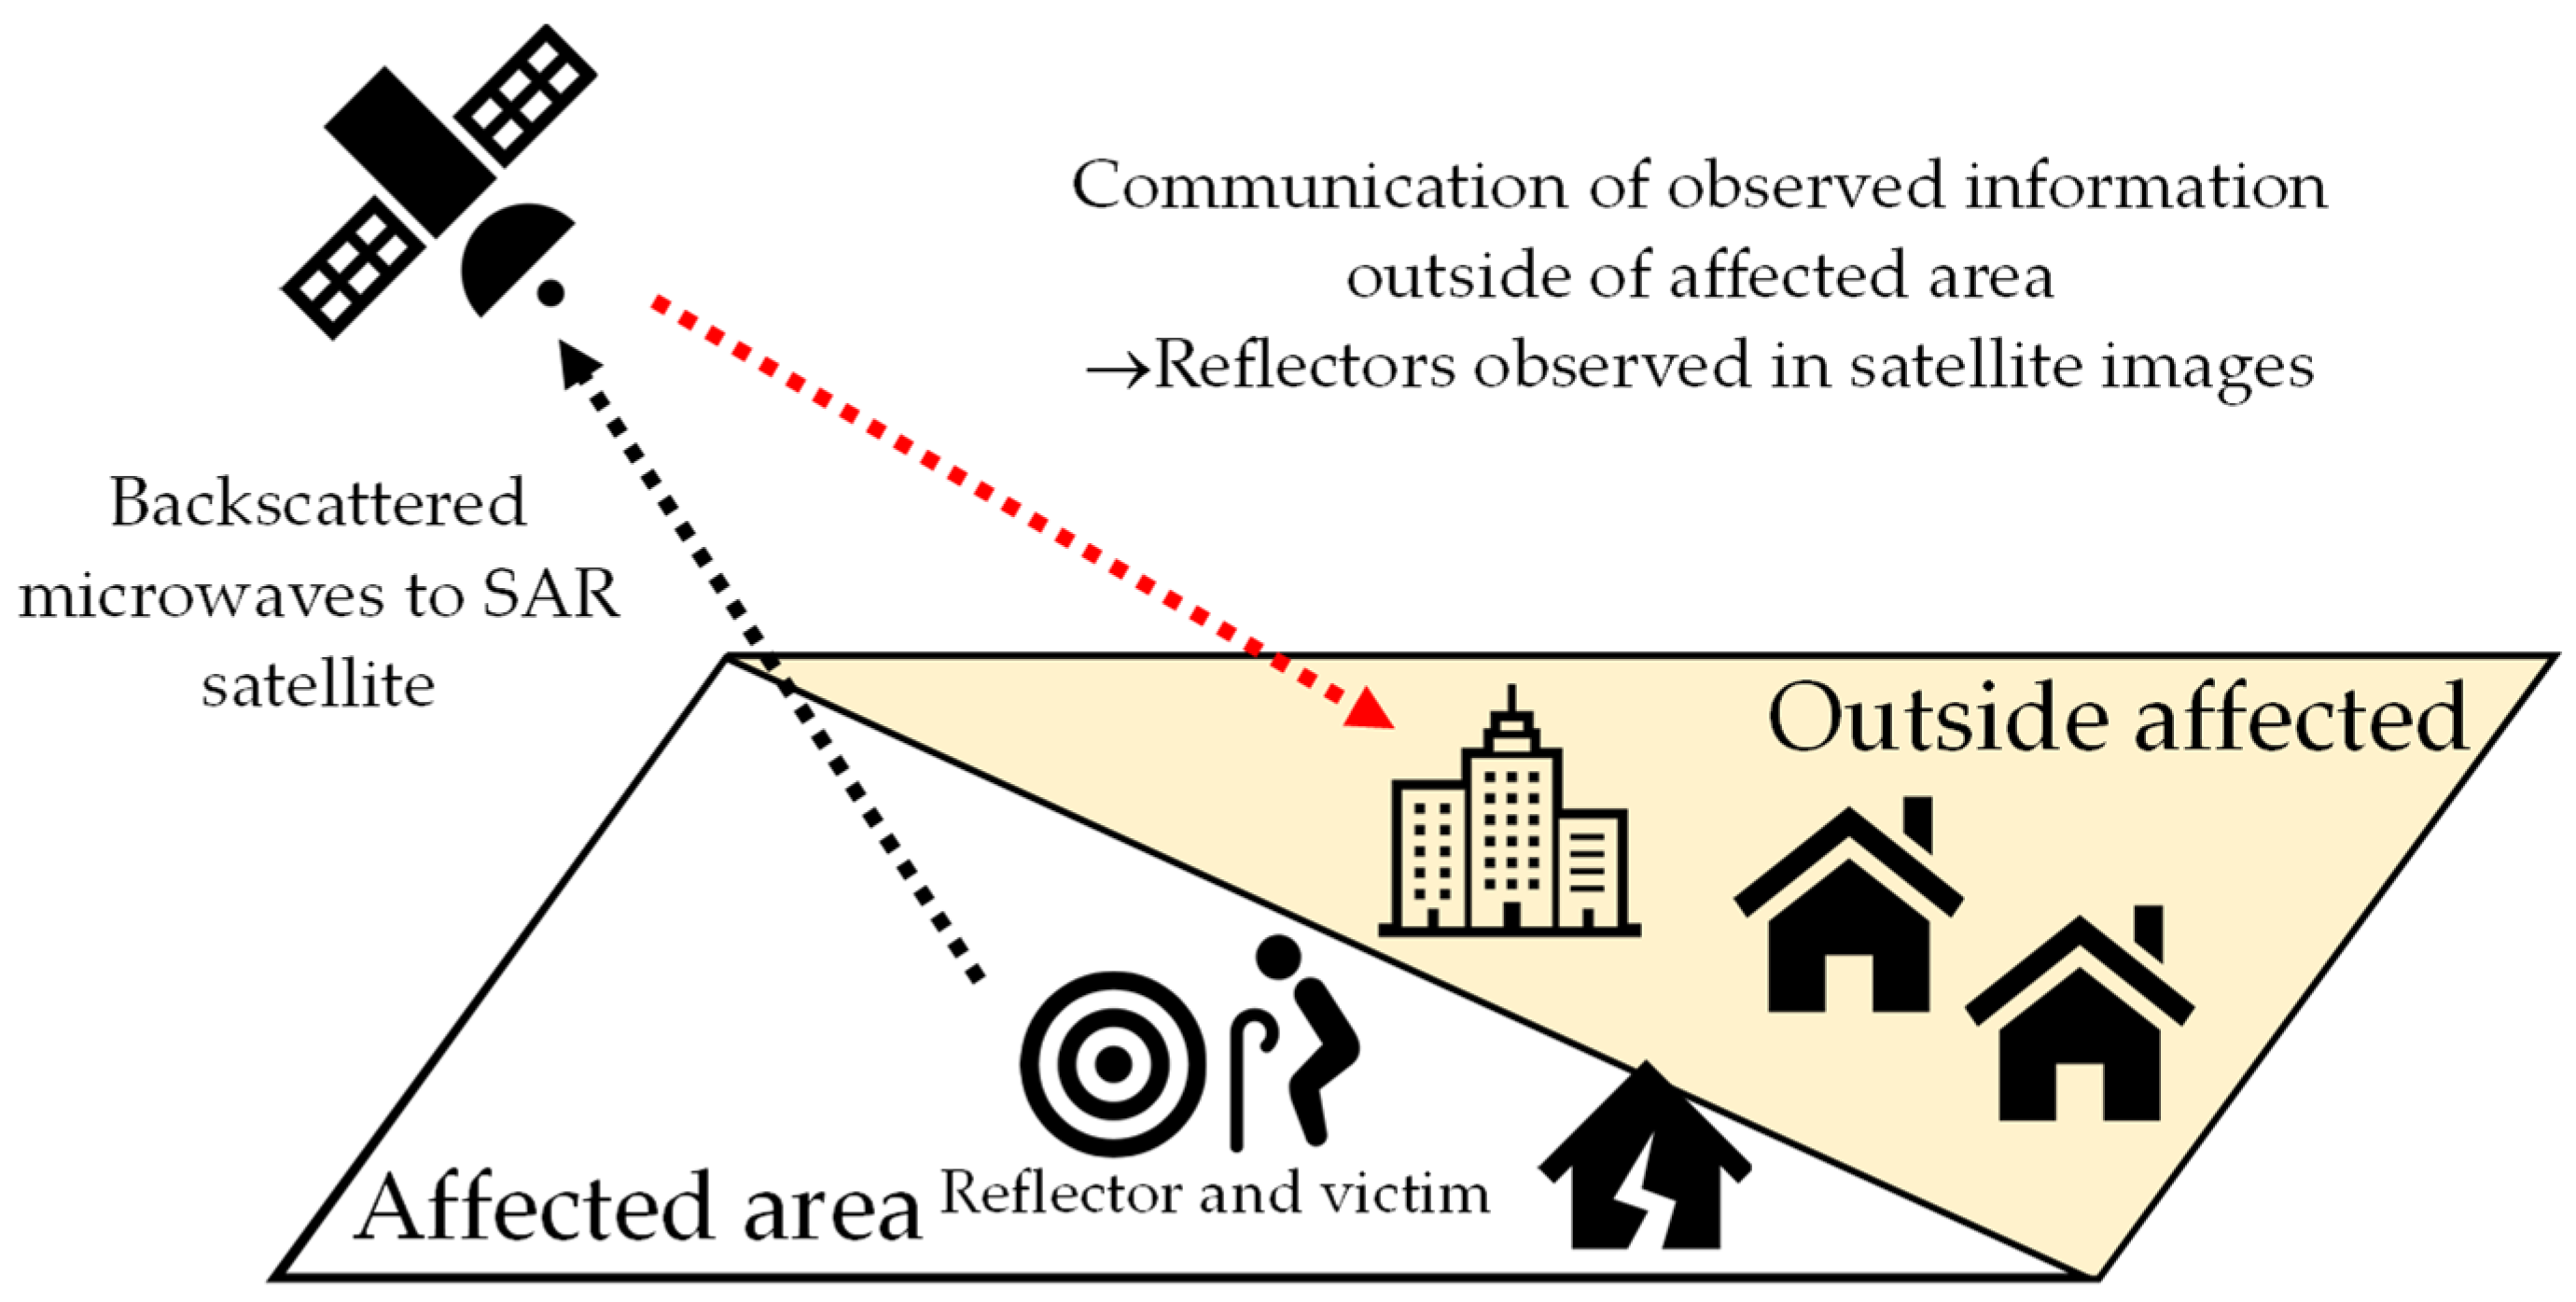
  • Multiple observations of reflectors using SAR satellites and identification of the range obtained for the reflector σ 0 values of each shape [3].
  • Assembly of proposed reflectors and development of compact storable kit [4].
  • Asked elderly persons (who require special consideration during disasters) to put together the assemblable reflector kits and noted their impressions and problems experienced during assembly [4].
Please refer to the cited literature for details on how to combine the assemblable reflector kit, shown in Figure 4, and other detailed analysis results. In addition, the authors have already conducted a basic study of reflector detection using deep learning [5]. This study aims to further advance reflector detection using YOLOv5.

1.3. Workflow of This Study

It is assumed that the reflectors proposed in this study will need to be located by the observing SAR satellites when they are actually set up immediately after a disaster.
Therefore, in this study, we construct a deep learning model, which is used to detect the reflector shapes within SAR images when the reflectors are set up. In addition, we constructed a method to reflect detected locations using the geographic information system (GIS) and identify reflector detection locations from their geographic coordinates. The two points mentioned above form the main purpose of this study. Figure 4 shows the analysis workflow used in this study. Previously, reflectors were observed by SAR satellites multiple times to ascertain the range that can be obtained for the reflector σ 0 values of each shape. Reflectors were observed by the SAR satellites, and the images were orthophoto-corrected by taking on an oval shape. This was used as learning data to run the YOLO v5 object detection algorithm [6]. A reflector detection model was then constructed to verify the accuracy of the model using test data. Thereafter, geographic information was added to the rectangle information that resulted from the reflector detection output by YOLO v5, and the reflector locations were identified in GIS. Detailed analysis procedures will be described later, as appropriate.

2. Literature Survey and Contributions of This Study

In this section, we categorize previous studies based on the following three points, according to the content of this study:
  • Studies that describe tools that victims can use to transmit information outside of affected areas and the means to support information within affected areas.
  • Studies that utilize SAR satellites during earthquake disasters.
  • Studies that detect various objects observed by SAR satellites using deep learning model.
Recently, mobile telephones and other types of information terminals have been used by victims as tools to transmit information within affected areas [7,8,9]. Transmitting needs and collecting needs information is relatively easy using these approaches. However, it is likely that the base stations that are critical to the relaying of information may be affected, which poses the problem of widespread cutoffs in communication environments. In addition, cases have also been observed in which Twitter and other forms of social media have been used by victims to transmit information, however, this depends on the communication environment. There are methods of supporting disaster information, such as fire department patrols (human-wave tactics) and the use of high-altitude cameras and helicopters [10]. However, there may be insufficient manpower involved in such support, and the information supported through these means can only be used to ascertain a very narrow scope with limited accuracy and precision. Recently, the increasingly active use of unmanned aerial vehicles (drones) during earthquake disasters has been observed as a means to transmit information in affected areas. However, aerial photography via drones has the same limitations as helicopter-based methods. Despite being very suited to determining the situation in affected areas, we believe that it faces difficulties in reflecting the immediate circumstances and needs of victims. As shown in Section 1.2, this study will presumably be used for earthquake disasters, in which a communication environment has been cut off. Thus, the viewpoint of this study differs from those exploring communication via mobile telephones or social media. Based on the above previous studies, we believe that this research contributes to society in that it has developed a new tool for ascertaining location and needs during an earthquake disaster with communication blackout.
Research on the utilization of SAR satellites during earthquakes has been conducted in various fields and during various disasters. For example, Miura et al. [11] used SAR images to ascertain the damage to building structures after an earthquake. In addition, Hasekura et al. [12] proposed a method to determine the zone of building damage in tsunami-stricken areas, owing to the Great East Japan Earthquake. These studies all focused on buildings following an earthquake to determine their state of damage. Thus, their perspective is different from this study, which focuses on determining the location and needs of persons requiring special consideration. In addition, there is considerable data from studies to ascertain landslide conditions during an earthquake using SAR satellites, such as the studies by Sato et al. [13] and Li et al. [14]. These studies also present a different perspective.
Finally, some studies, including those by Jiang et al. [15] and Tang et al. [16], detected objects observed by SAR satellites using deep learning. These studies attempted to detect ships traveling on the sea using object detection. In addition, Hass et al. [17] constructed a model to identify icebergs and ships using YOLO v3. Many studies on the detection of objects observed by SAR satellites involve ships. In this study, we constructed a model to detect reflectors, which can be considered to be different from previous studies in terms of the detection subjects and research objectives.

3. Elements of the ASNARO-2 SAR Satellite Used

In this study, we used satellite images obtained from an ASNARO-2 SAR satellite [18] operated by NEC. Table 1 shows the basic information on ASNARO-2. The satellite images used in this study were observed in Spotlight mode with a resolution of observation width of 10 km and a resolution of less than 1 m. Observations were made using microwaves radiated with HH polarization in the X-band wavelength. Regarding the spatial resolution observed ASNARO-2, the backscatter coefficient is calculated by averaging the reflection intensities of materials within a range of 1 m. In addition, although reflectors are observed using ASNARO-2 in this analysis, we believe that in practical applications, the use of this satellite will need to be complemented with other satellites. As shown in Table 1, ASNARO-2 observations made during emergencies have a one-day regression; however, we believe that determining the location and needs of victims in times of extreme emergency can be realized if complemented by other satellites. In this study, experiments and analyses were conducted using ASNARO-2.

4. Reflector Setup Experiments and Learning Data

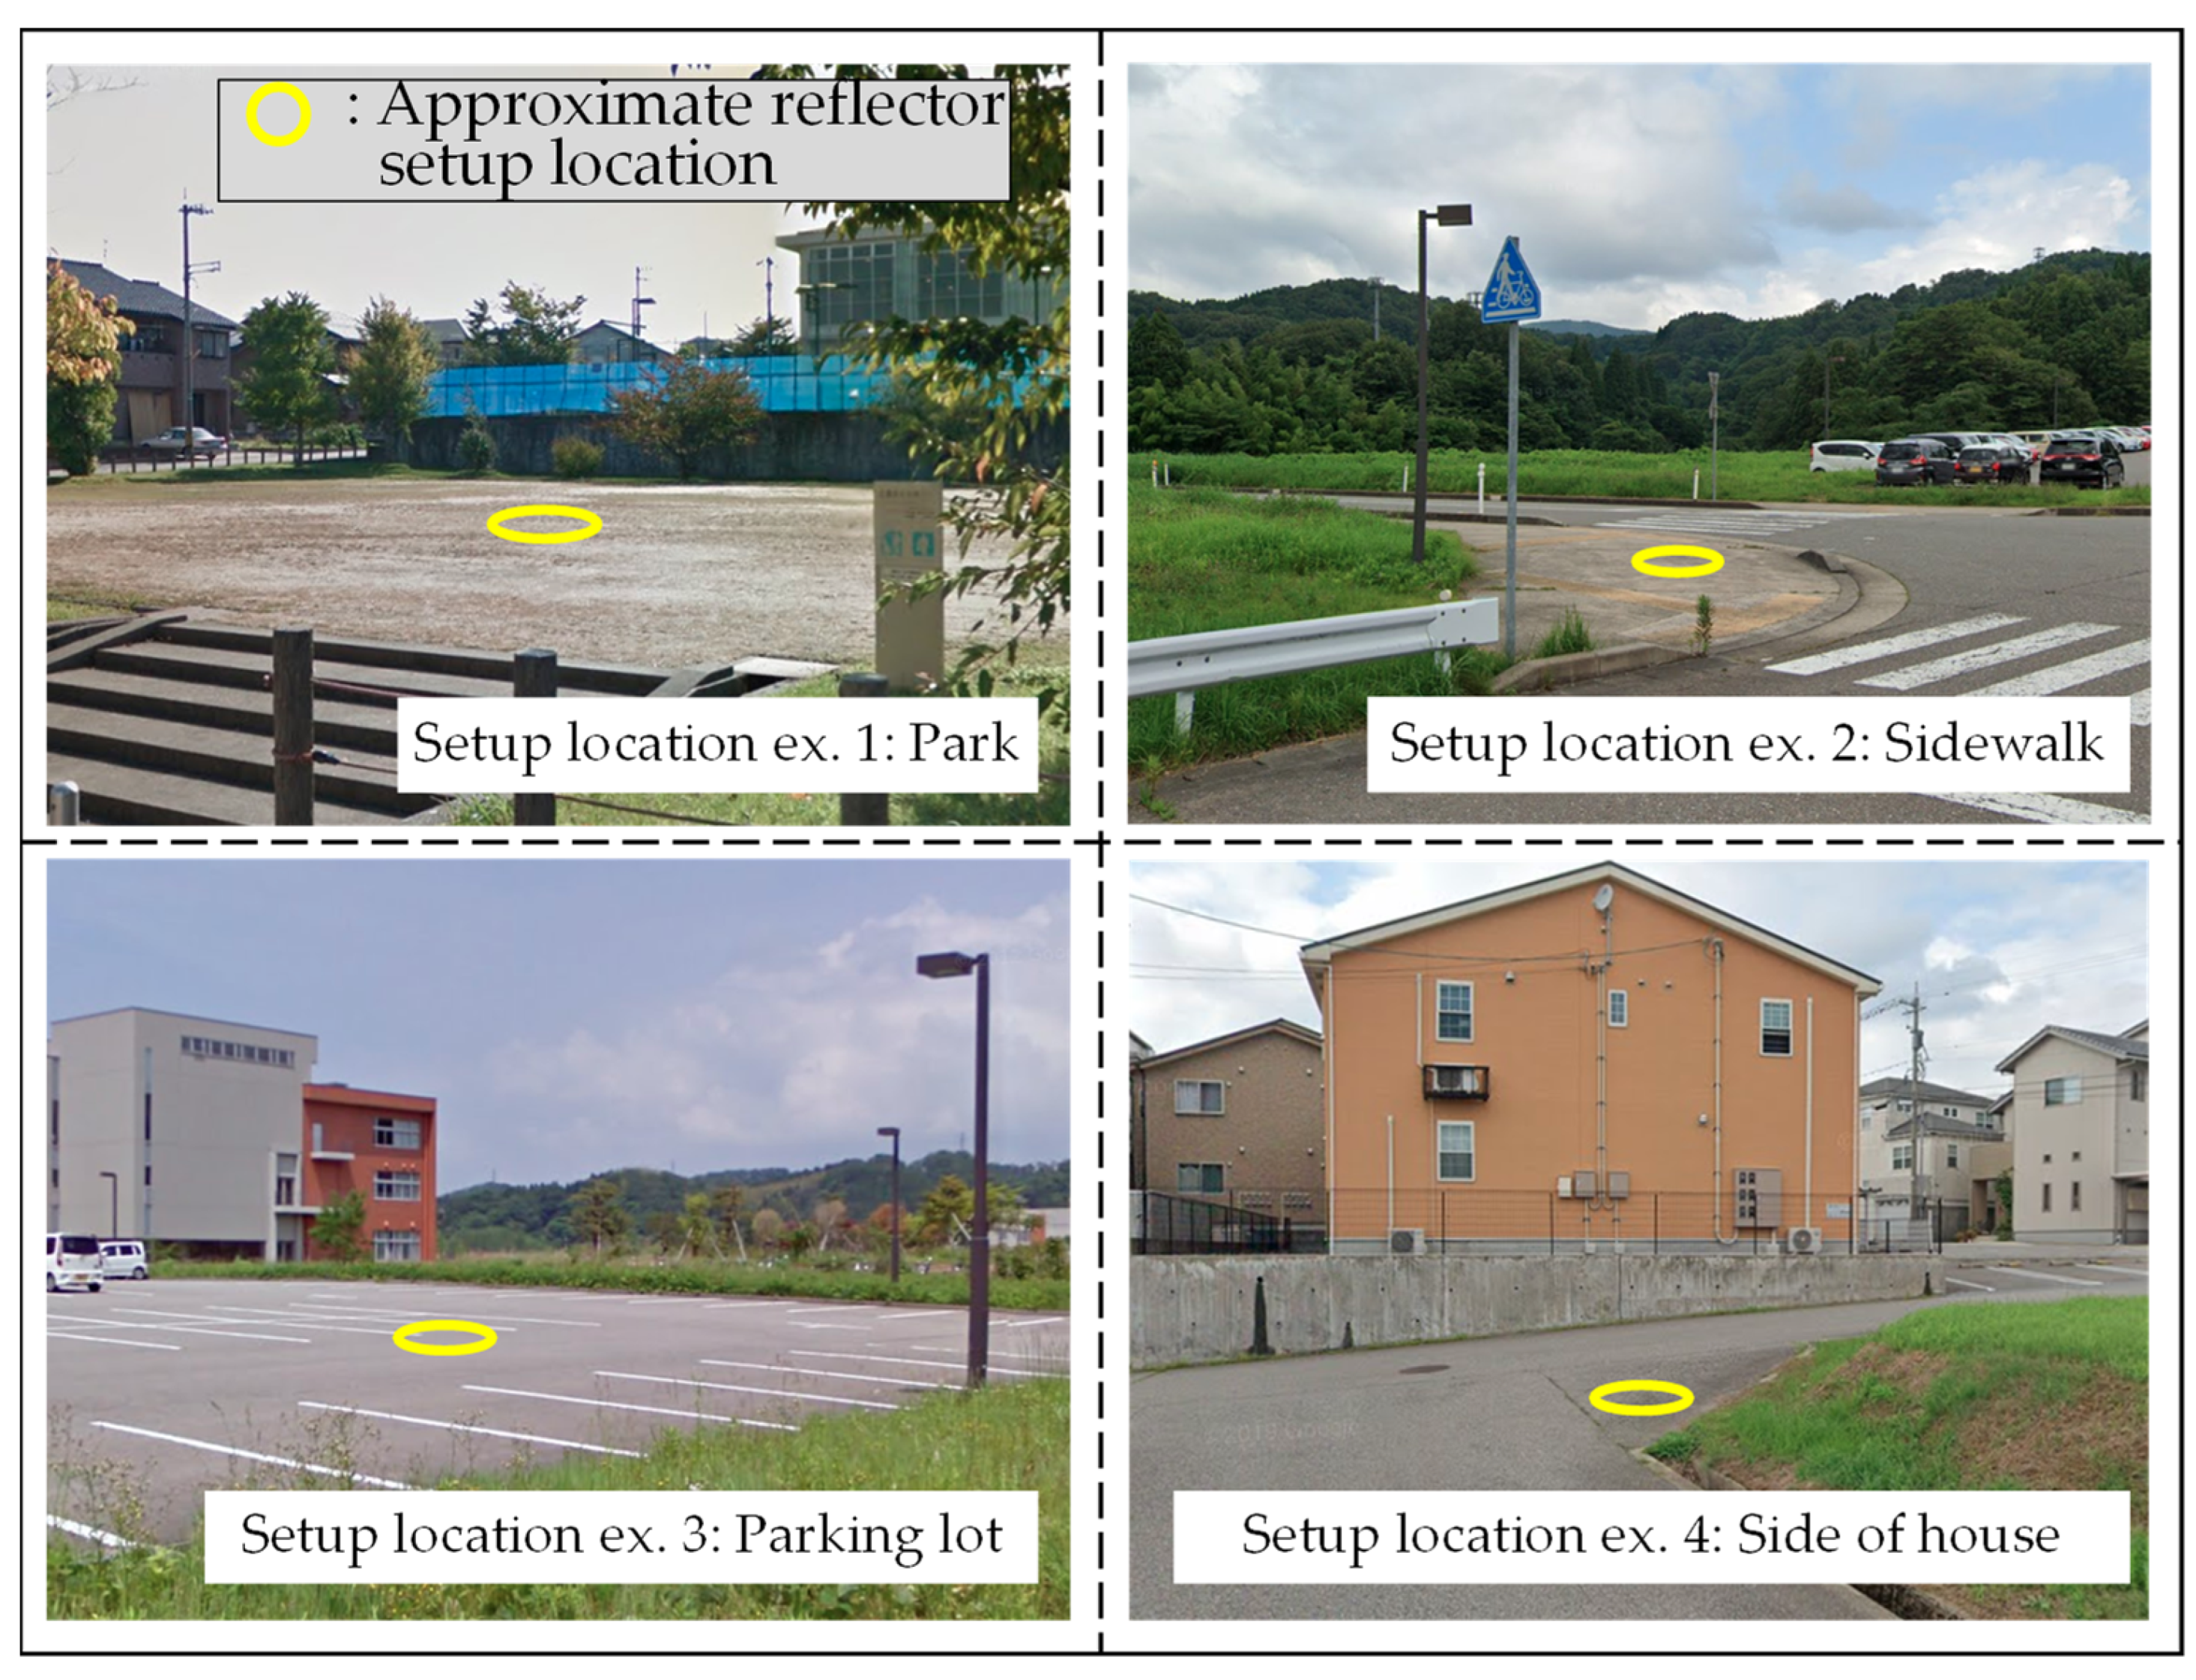
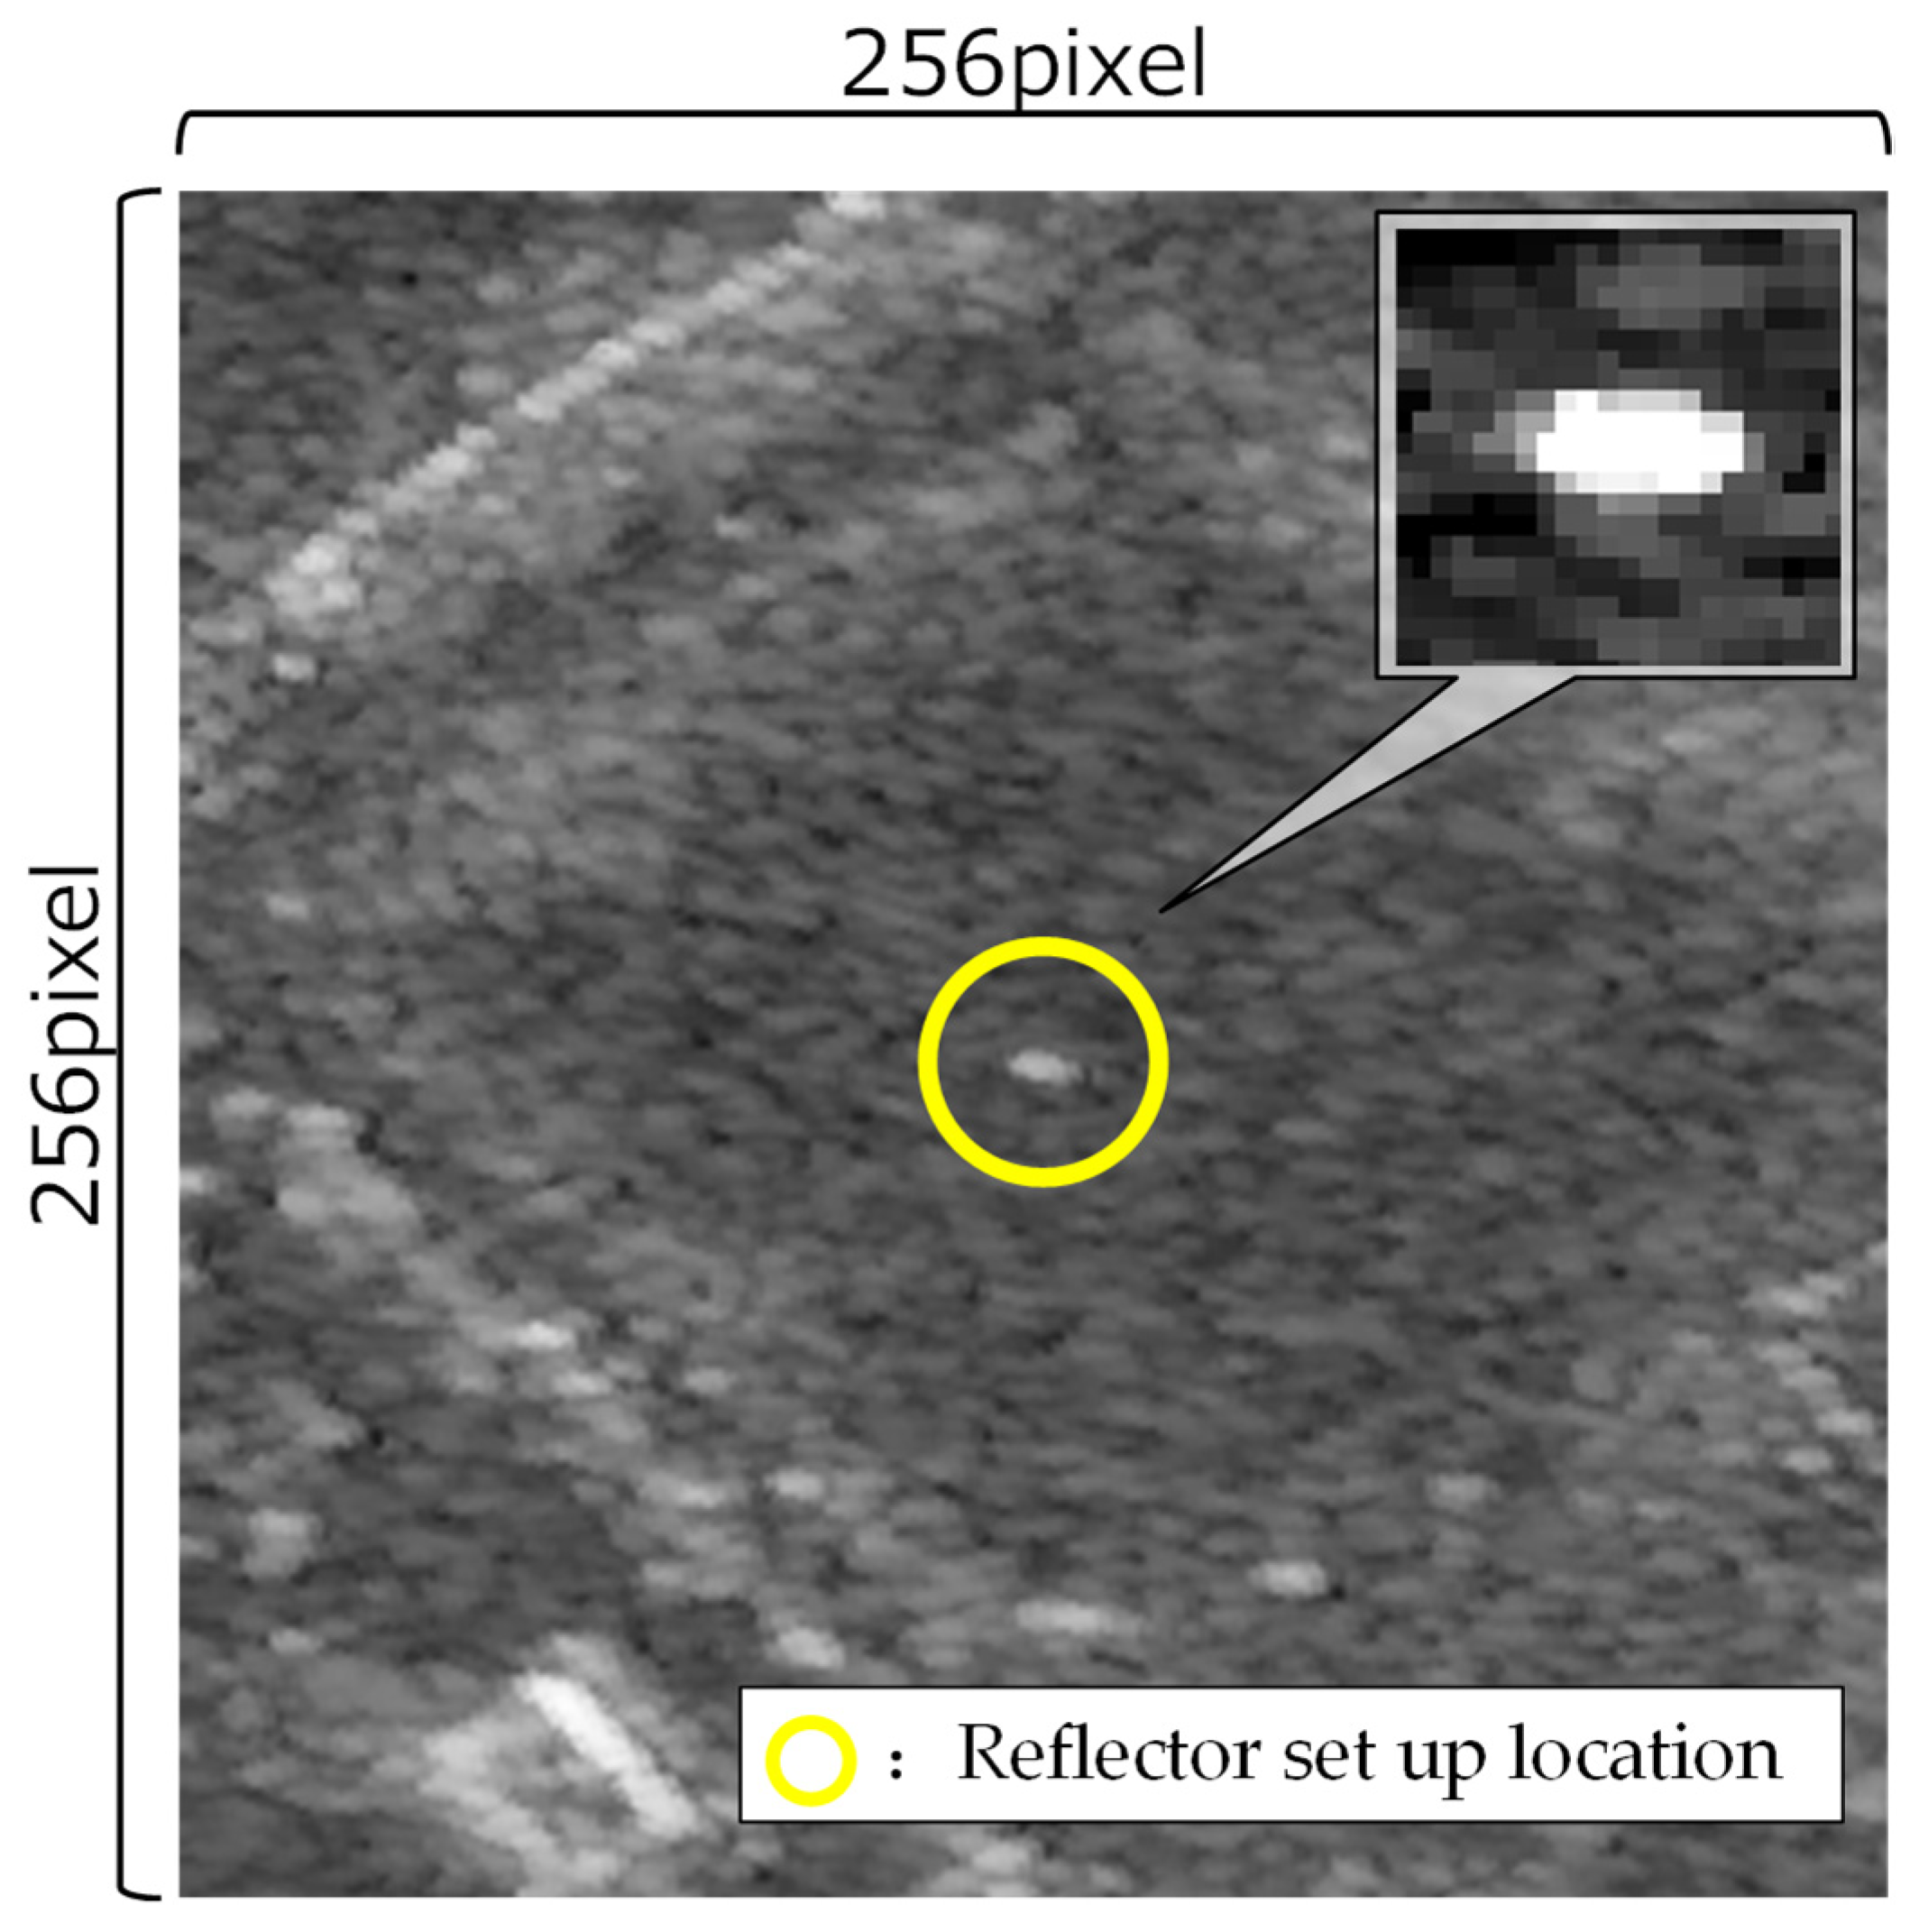
4.1. Data Acquisition through Reflector-Setup Experiments

To ascertain the obtainable range by the reflector σ 0 value of each shape and to acquire reflector learning and test data, we previously conducted multiple experiments to set up reflectors using Kanazawa City in Ishikawa as the experimental field. Setup locations were broadly divided into two types: ideal environments (open locations, such as open ground and parking lots) and parks and sidewalks. Figure 5 shows an example of the setup location. As understood from the setup location examples, setups were in relatively open locations that appeared to be minimally affected by radar shadows from buildings or trees. In addition, we set up reflectors without specifying the direction in which they faced.
Table 2 shows the number of reflectors and date for each experiment adopted as the learning and test data used in YOLO v5. We used observation data from May 26 and 28 and July 7, 21, and 22, 2020, as learning data. The number of reflectors set up on each experimental day is shown in Table 2. There were a total of 16 quadrilateral reflectors, 17 hexagonal reflectors, and 17 nonagonal reflectors. We describe the details on the handling of test data in Section 5; however, we assume that the models are evaluated using images that contain reflectors (experiment results from 26 November 2020 and 10 December 2020) and images of locations without reflectors set up on different observation days (observations on 11 June 2020 and 25 June 2020).
Moreover, the purpose of this study is to identify differences in victims’ needs according to the range obtained from the reflector shape ( σ 0 ) ; thus, the shape of the reflectors must be determined from the SAR images. With YOLO and other object detection methods, if classes are designated according to reflector shape during annotation, the reflectors in each shape may be detected simply via YOLO processing. However, in this study, very little data could be used as the learning data. Therefore, in this analysis, when annotating quadrilateral, hexagonal, and nonagonal reflectors, we combined them into one class called “reflectors” and created a model to detect “reflectors” from SAR images. We believe that the methods used to determine shapes from reflector detection remain a pending issue.

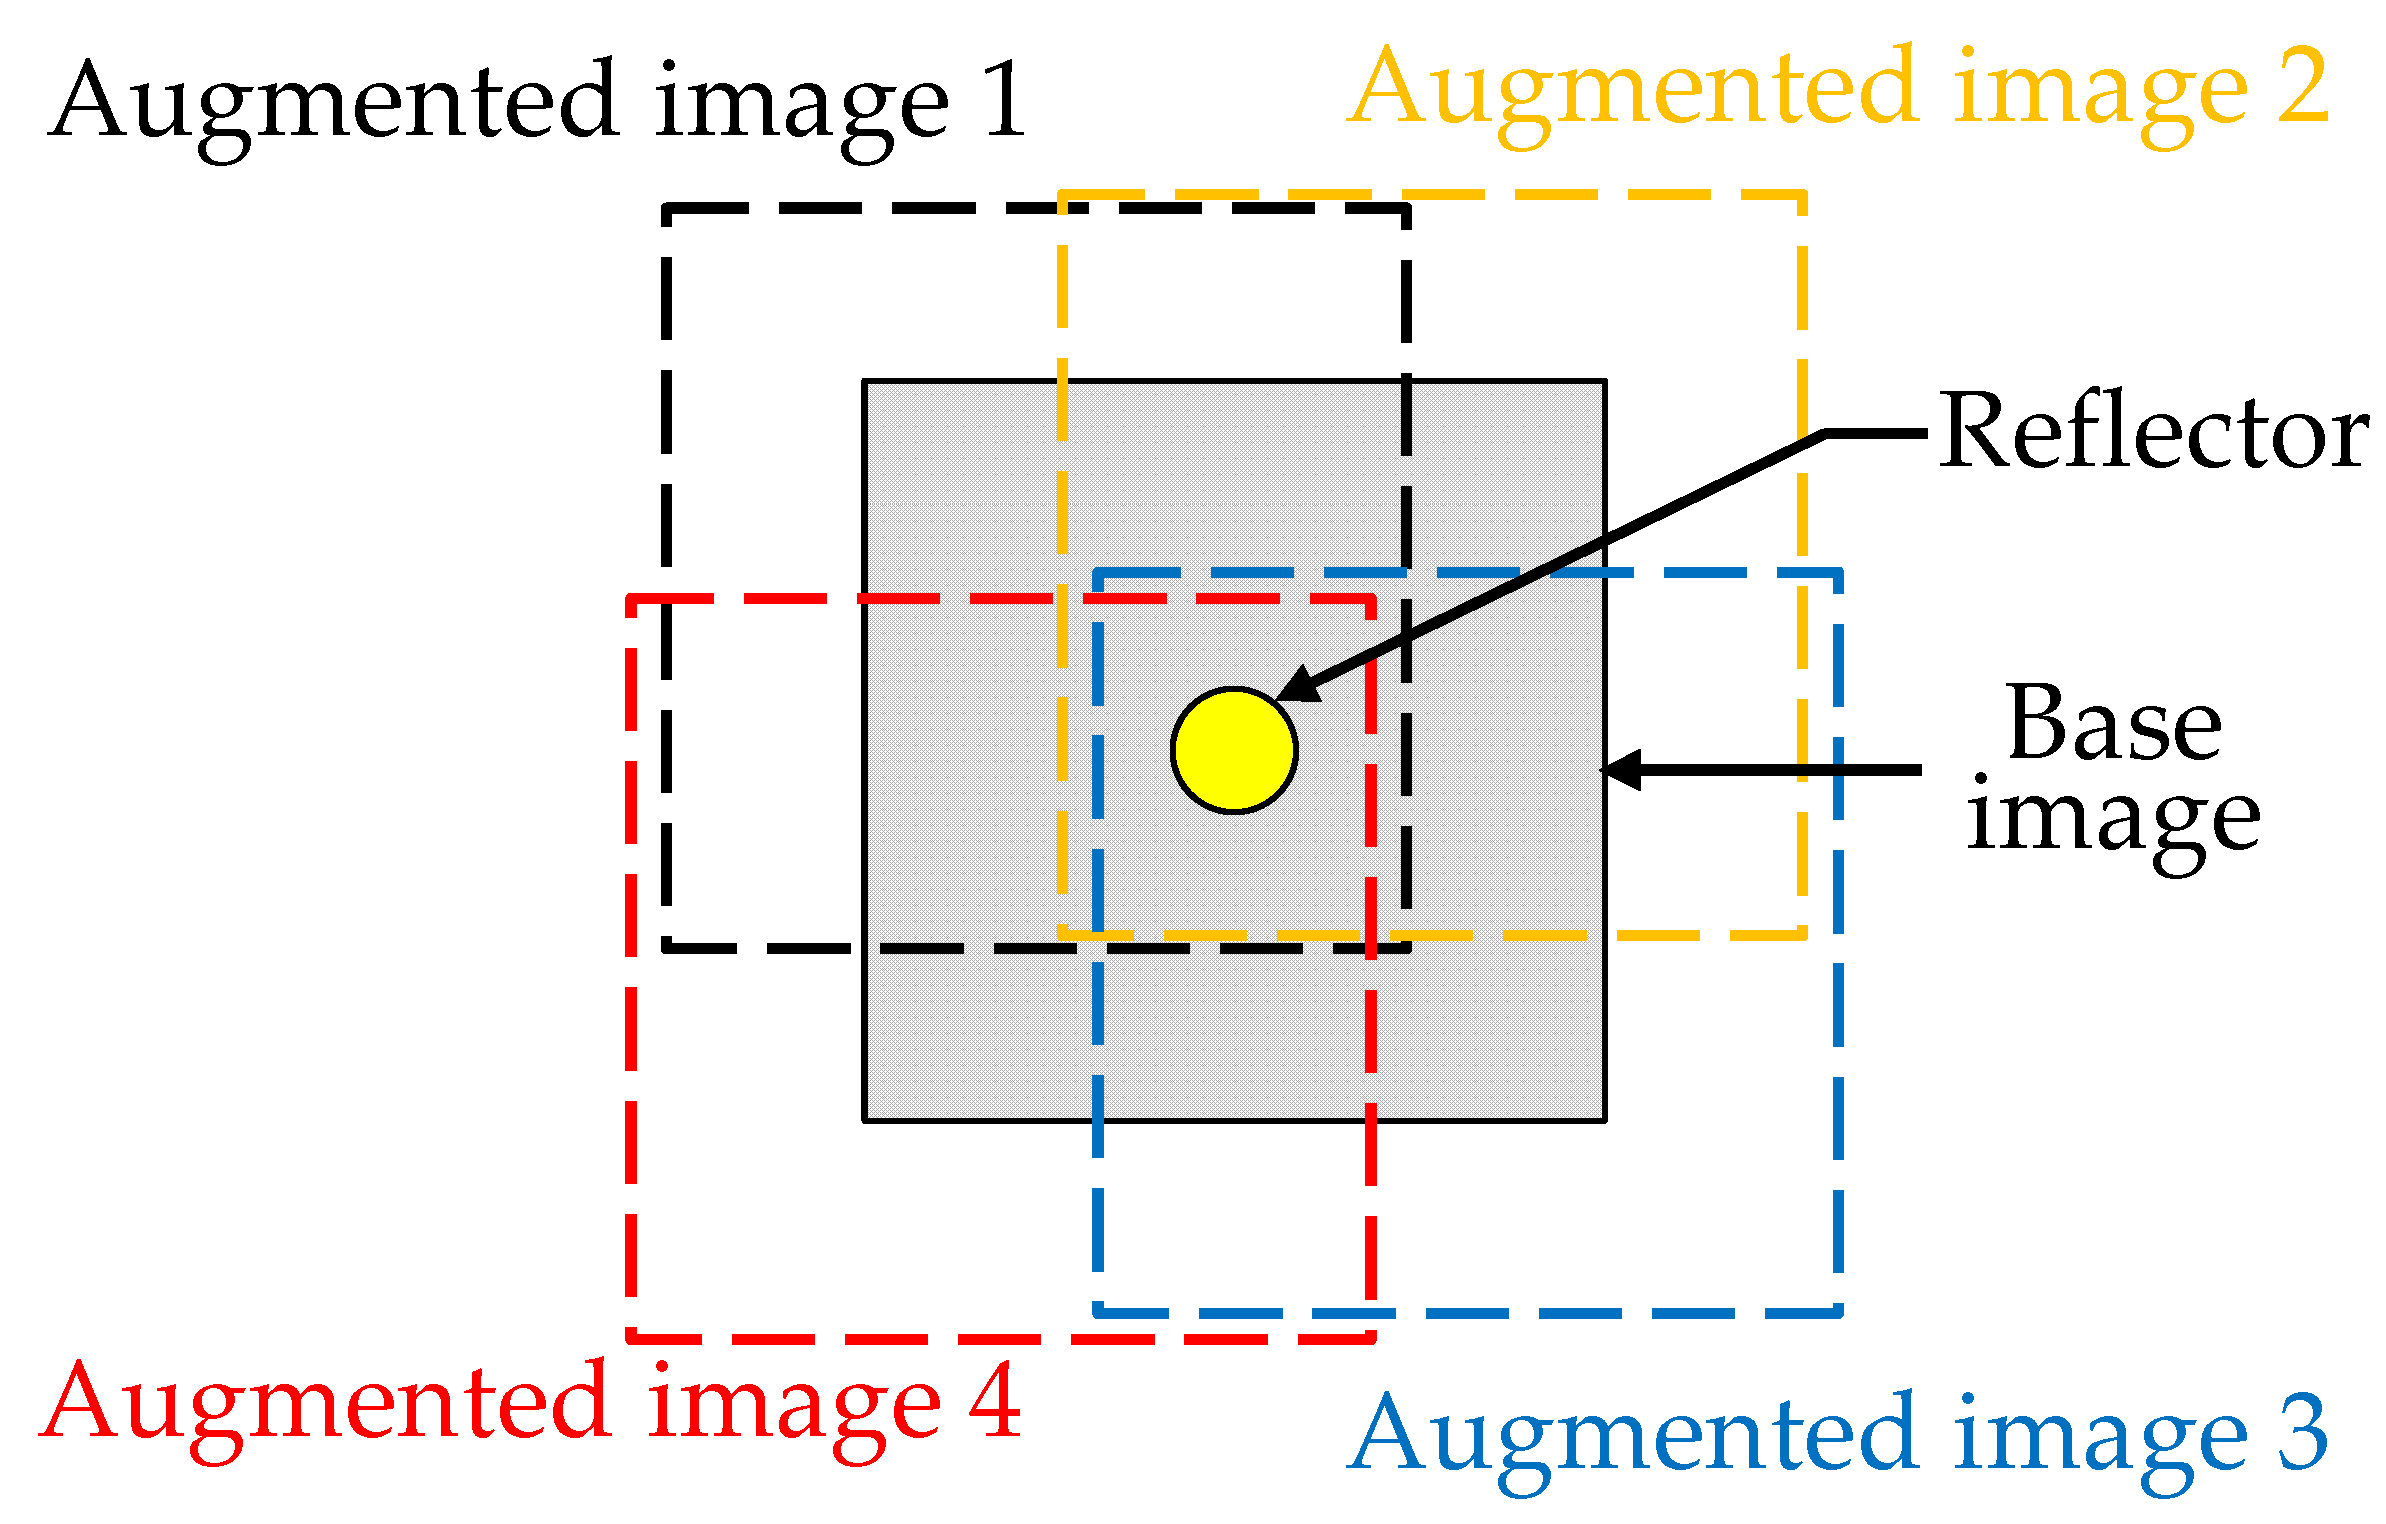
4.2. Creation and Augmentation of Learning Data

We prepared learning data based on 36 reflectors; the data was obtained from observation data on May 26 and 28 and July 7, 21, and 22, 2020. The procedure to prepare learning data first involves the creation of 256 × 256 pixel images based on the setup position of each reflector (Figure 6 shows an example of the learning data). These images are considered learning data-based. A total of 36 base images were compiled to create learning data-based images for 36 reflectors. Next, the base images were augmented. Various methods have been developed for augmentation, such as blurring, gamma correction, inversion, enlargement, and rotation; however, in this study, the purpose is to detect very small reflector objects and use grayscale images referred to as SAR intensity images; thus, we believe that blurring, gamma correction, and enlargement are unsuitable. In addition, when SAR images are ortho-corrected from slant range images, reflectors always assume an oval shape, as shown in Figure 6. Consequently, reflector rotation and inversion augmentation processes are unsuitable. Therefore, the augmentation process in this city, as shown in Figure 7, involves a conversion in which reflector setup locations in 256 × 256 pixel images are arranged to the lower right (for example, moved just 128 pixels to the left or 128 pixels to the top from the center of the base image), lower left, upper left, or upper right, and base images are then quadrupled.
A total of 180 samples of learning data were obtained by performing the above augmentation process. Annotation was performed on the reflector locations for these 180 images, and the learning data were then prepared.

5. Construction of a Reflector Detection Model Using YOLO v5

5.1. Learning Model Preparation

We implemented a learning algorithm using 180 samples of 256 × 256 pixel learning data with a training data to validation data ratio of 3:1. We used Google Colaboratory for learning and to run YOLO v5 with a batch size of 32 and epoch number of 200 during learning.

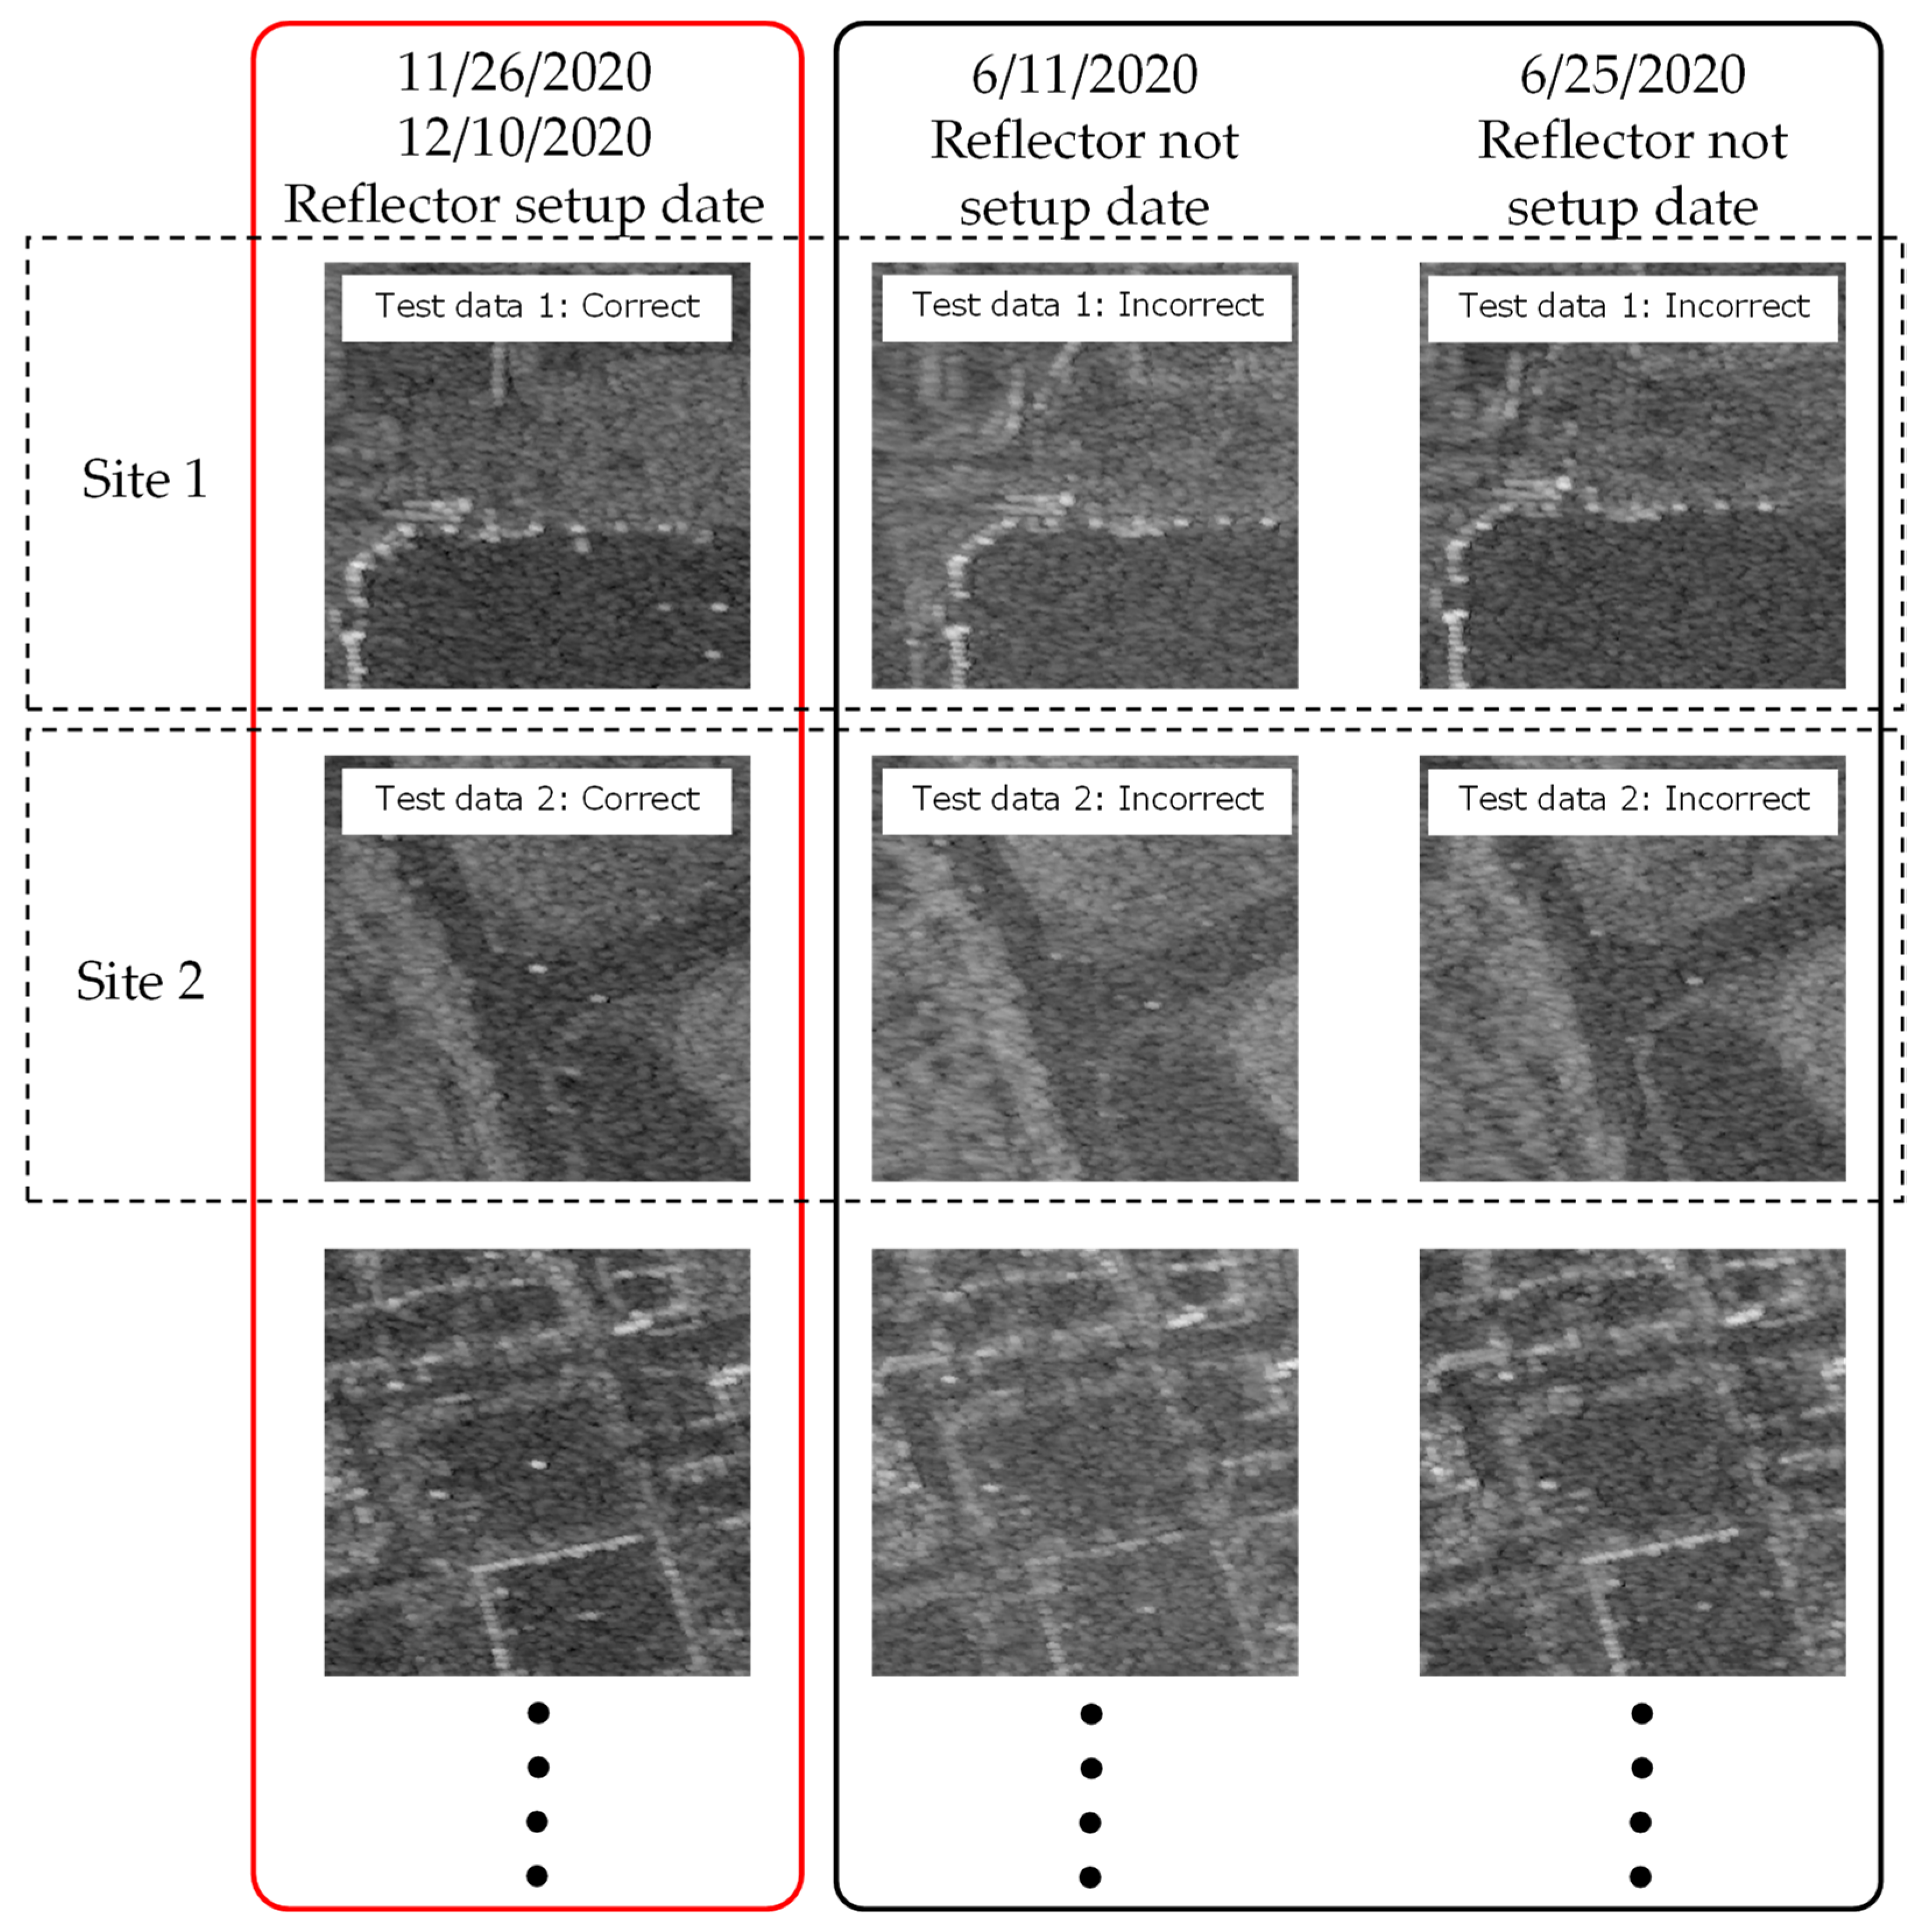
5.2. Preparation of Test Data

We prepared test data to verify the accuracy of the reflector detection model. We used observation data from June 11 and 25, November 26, and December 10, 2020, for the test data. The observation data included a total of 25 reflectors set up on November 26 and December 10 (Table 2). The test data, similar to the learning data, were cropped to 256 × 256 pixels. However, in the experiments on November 26 and December 10, cases emerged involving multiple reflectors within 256 × 256 pixels; thus, there were 13 test data images (25 reflectors observed in 13 images). These images are considered to be the correct image group that contain reflectors. However, no reflectors were set up during SAR satellite observations on June 11 and June 25. Therefore, we removed images of the locations in the correct image group (November 26 and December 10) from the June 11 and June 25 images. We considered these as the incorrect image group because the locations had no reflectors set up. Consequently, we used a 13-image correct-image-group (25 reflectors) and a 26-image incorrect-image-group for the test data. Figure 8 shows images of the test data preparation procedure.

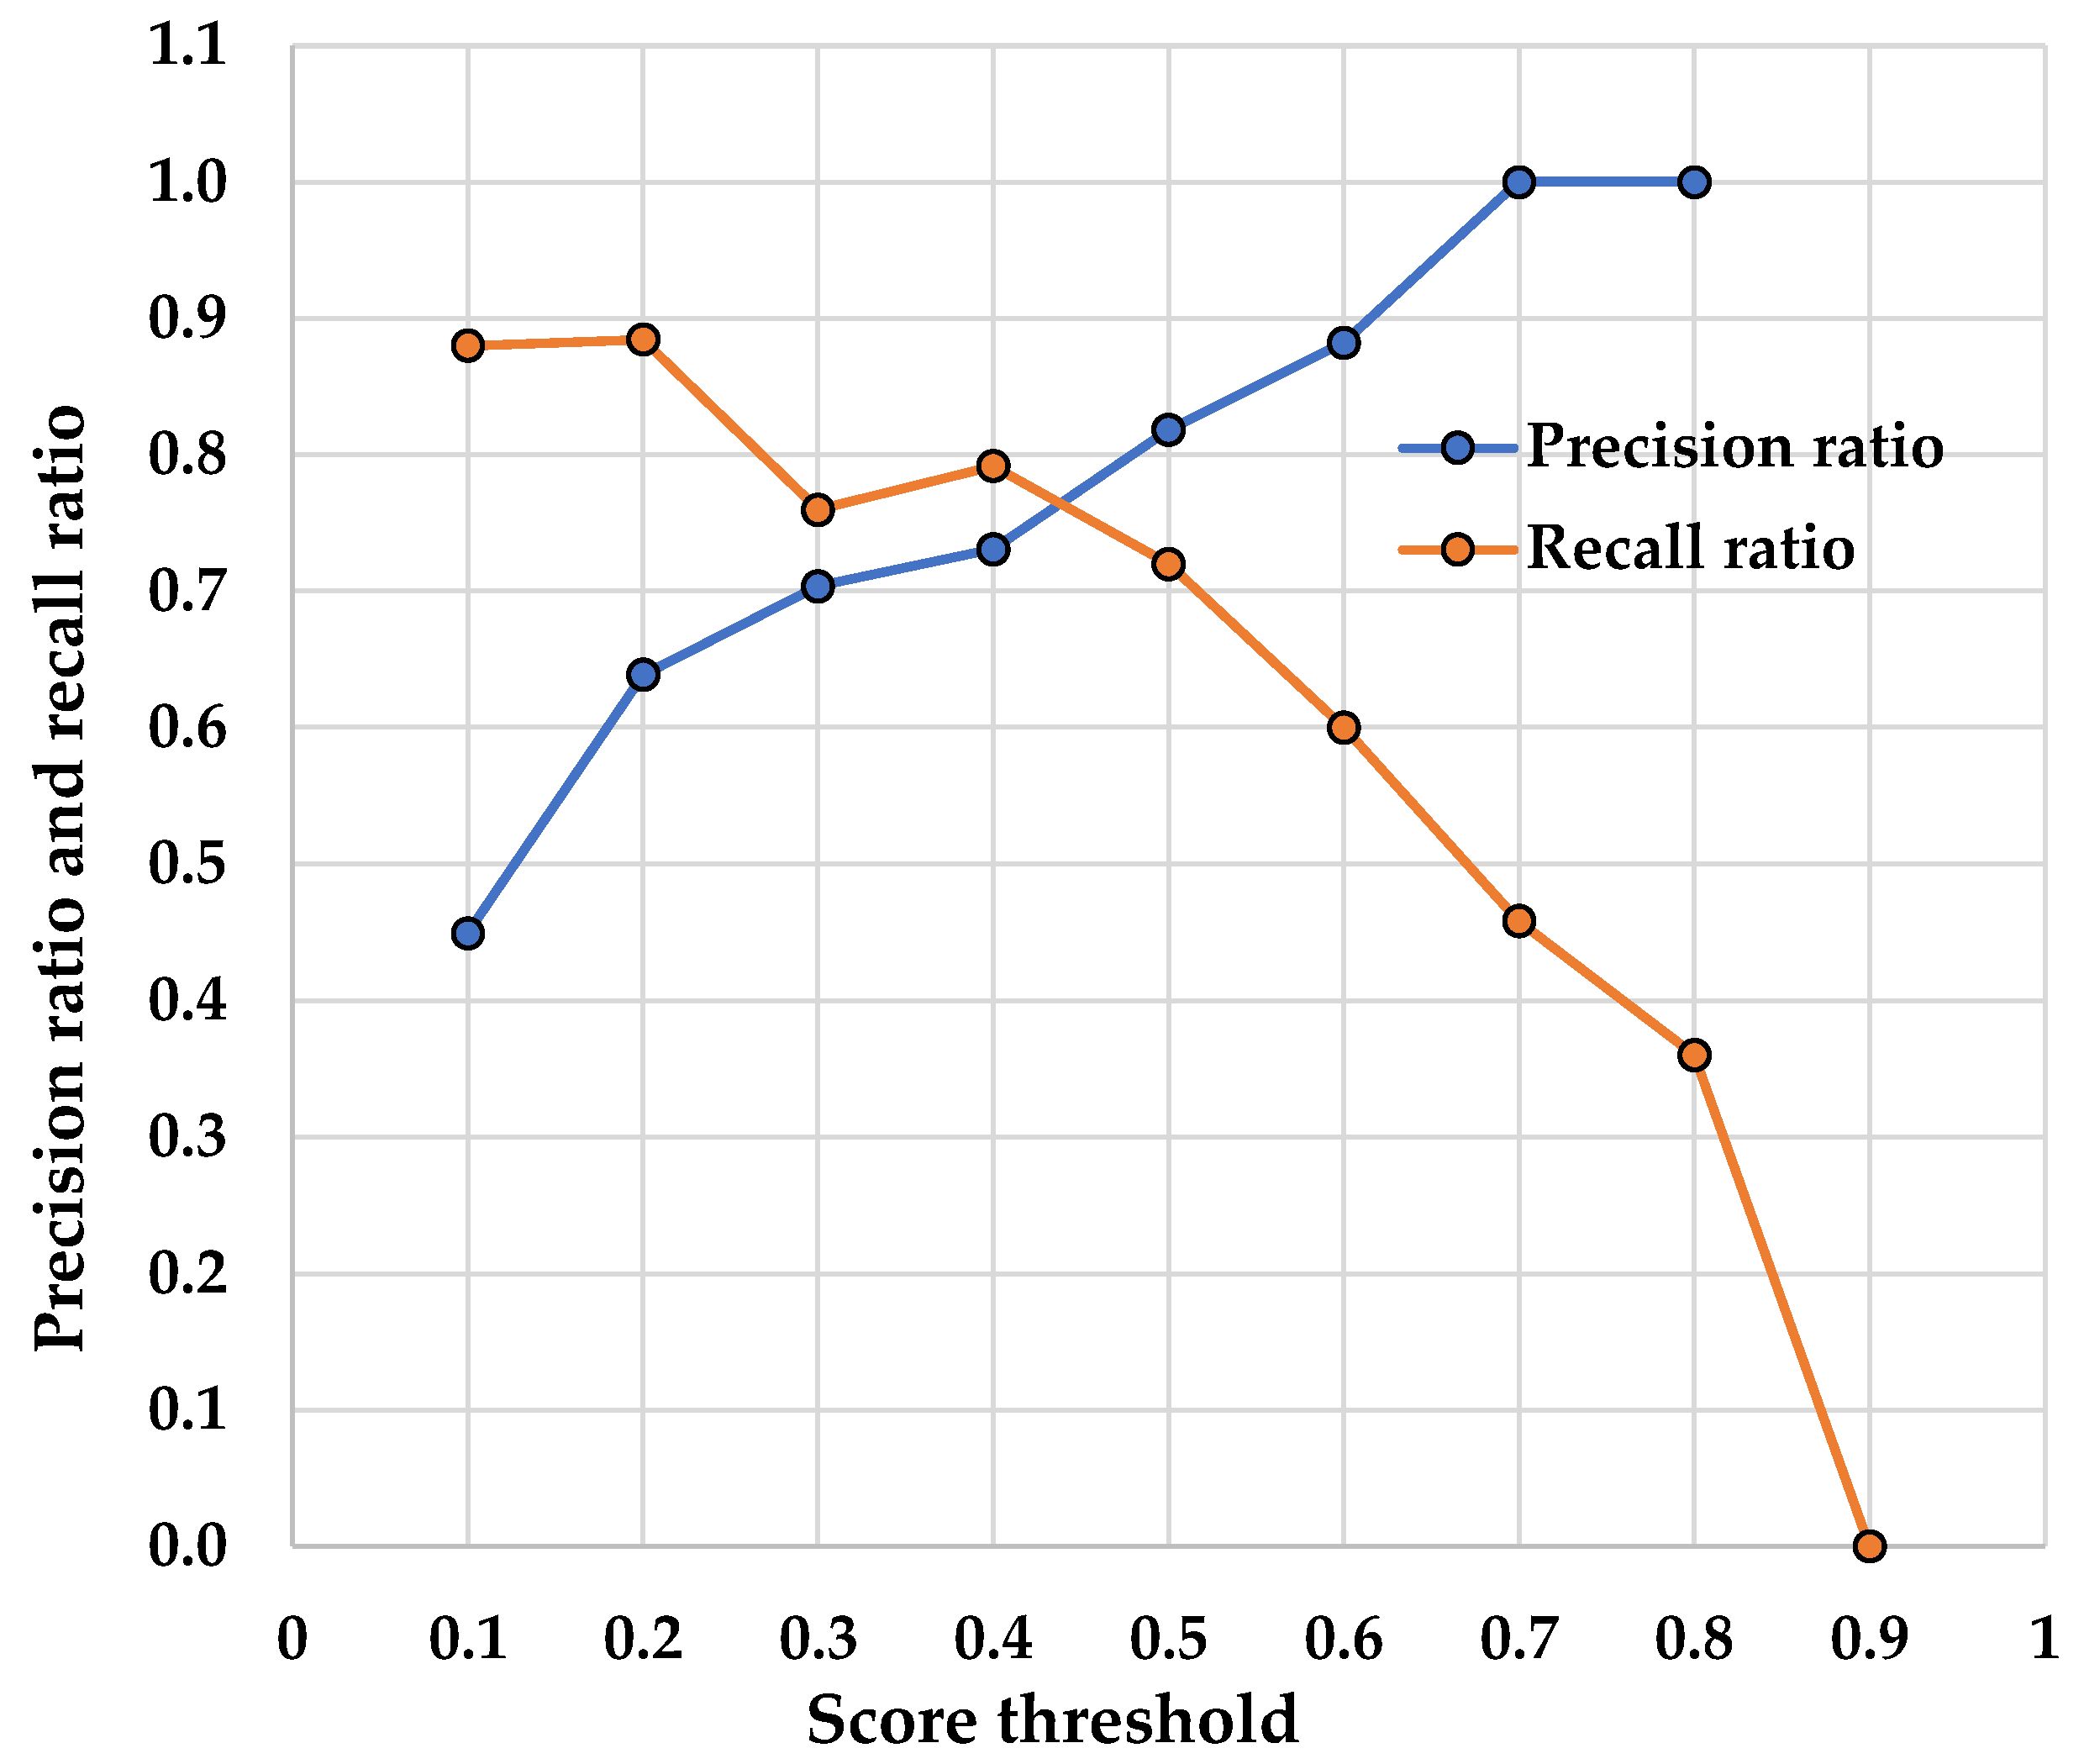
5.3. Accuracy Verification of Reflector Detection Model

When a subject is detected using YOLO v5, a detection score is computed for each detection. In this study, the detection score threshold was changed every 0.1 from 0.1 to 0.9, and the recall ratio, precision ratio, and F-value were computed for each score threshold. Recall ratio means that are positive are predicted to be positive. Precision ratio means that percentage of data predicted to be positive is actually positive. F-value means that the F-number is the harmonic mean of the recall and precision, and expresses the goodness of the model. The formula for each indicator is as follows. Where TP is the number of true positives, FP is the number of false positives and FN the number of false negatives. F-score is the harmonic mean of Recall and Precision.
P r e c i s i o n = T P ( T P + F P )
R e c a l l = T P ( T P + F N )
F   V a l u e = 2 ( P r e c i s i o n × R e c a l l ) ( P r e c i s i o n + R e c a l l )
Thereafter, the score threshold with the highest F-value was considered to be the optimal threshold for this model. Figure 9 and Table 3 show the results of changing the score threshold and performing reflector detection using the test data. We confirm that the precision ratio and recall ratio are in a tradeoff relationship, and a threshold arises between 0.4 and 0.5, at which the recall ratio and precision ratio invert. The F-value was 0.77 at a score threshold of 0.5, and the accuracies of the reflector detection model in this study can be described by a precision ratio, recall ratio, and F-value of 0.82, 0.72, and 0.77, respectively. Furthermore, when the score threshold was 0.5, 18 locations were a true positive (TP), four were a false positive (FP), and seven were a false negative (FN) among the 13 test data samples (reflectors in 25 places).
From the above, it can be observed that the reflector detection model obtained in this analysis occasionally overlooks subjects and makes incorrect detections, however, it is generally able to detect reflectors.

6. Summary and Pending Issues

6.1. Summary

In this study, we used the object detection algorithm YOLO v5 to construct a reflector-kit detection model that we previously proposed. When we used 39 test data samples to verify the accuracy of the model, results with a precision ratio of 0.82, recall ratio of 0.72, and F-value of 0.77, were obtained with a score threshold of 0.5. In addition, by conferring geographic coordinates on the detection location coordinates in images obtained using YOLOv5, it was possible to identify reflector setup locations in GIS. We believe that the results of this study will be useful for identifying victim reflector setup locations when reflector kits are practically implemented.

6.2. Pending Issues

The increasing amount of learning and test data poses an open issue. We shall conduct continuous reflector setup experiments and attempt to improve the sample size and model accuracy. In addition, the reflector detection model in this analysis cannot distinguish the reflector shapes. Consequently, to ascertain the reflector shape, we intend to design a method that is capable of conferring SAR image information on detected geographic coordinates; we can then simultaneously determine σ 0 and the detection results. In addition, special cases will also be considered, such as when the set-up reflectors are extremely close to each other.
Finally, to construct a reflector detection model in this study, we used images with and without reflectors present as the test data. However, when this method is practically implemented, reflectors are presumably detected from a single SAR image (10 × 10 km image in this study). In this case, an overwhelming increase in FP detections is a concern. Consequently, we propose that future work should include a means to reduce FP detections after reflector detection in a single SAR image. The method proposed in this study is a trial, and further studies are needed for practical use in the future. It is also necessary to study the effect of improving efficiency when applying this method.

Author Contributions

Conceptualization, Y.M. and M.F.; methodology, Y.M. and M.F.; software, M.F.; validation, M.F. and J.T.; formal analysis, Y.M. and T.S.; investigation, Y.M.; resources, R.F.; data curation, R.F.; writing—original draft preparation, Y.M.; writing—review and editing, M.F.; visualization, Y.M.; supervision, M.F. and J.T.; project administration, M.F.; funding acquisition, M.F. All authors have read and agreed to the published version of the manuscript.

Funding

This research received no external funding.

Institutional Review Board Statement

Not applicable.

Informed Consent Statement

Not applicable.

Data Availability Statement

Data sharing does not apply to this article.

Acknowledgments

Our deepest gratitude to Yuichi Fukuda of Stainless Co., Ltd., for their cooperation in the development of the victim location and needs ascertainment kit.

Conflicts of Interest

The authors declare no conflict of interest.

References

  1. Statistics Bureau, Ministry of Internal Affairs and Communications. 5. An International Comparative View of the Elderly. Available online: https://www.stat.go.jp/data/topics/topi1135.html (accessed on 10 June 2021).
  2. Cabinet Office Japan, Disaster Management in Japan: Persons Requiring Special Help during Disasters. Available online: http://www.bousai.go.jp/taisaku/hisaisyagyousei/youengosya (accessed on 10 June 2021).
  3. Morisaki, Y.; Fujiu, M.; Furuta, R.; Takayama, J. Study of efficacy of tool for ascertaining location and needs of persons presumably requiring special consideration immediately after a large-scale earthquake disaster. J. JSCE A1 2021, 77, 649–658. [Google Scholar] [CrossRef]
  4. Morisaki, Y.; Fujiu, M.; Furuta, R.; Takayama, J. Development of a radar reflector kit for older adults to use to signal their location and needs in a large-scale earthquake disaster. Remote Sens. 2021, 13, 1883. [Google Scholar] [CrossRef]
  5. Morisaki, Y.; Fujiu, M.; Suwa, T.; Furuta, R.; Takayama, J. Detection location and needs from kits set up immediately after a large-scale earthquake disaster by vulnerable people: Using yolov5 and time series sar images. Intell. Inform. Infrastruct. 2021, 2, 314–323. [Google Scholar]
  6. Github: Ultralytics yolov5. Available online: https://github.com/ultralytics/yolov5 (accessed on 10 June 2021).
  7. Osaragi, T.; Oki, T. A real time synchronous system for collecting, sharing, and utilizing disaster information. Trans. AIJ 2017, 82, 2451–2459. [Google Scholar] [CrossRef] [Green Version]
  8. Hiruta, M.; Tsuruoka, Y.; Tada, Y. A proposal of a disaster information sharing system. IEICE Tech. Rep. Inf. Process Soc. Jpn. 2012, 112, 5–8. [Google Scholar]
  9. Jeong, B.; Zama, S.; Takizawa, O.; Endo, M.; Shibayama, A. Development of a disaster information collection system using cellular phones. J. JAEE 2011, 9, 102–112. [Google Scholar] [CrossRef] [Green Version]
  10. Sugii, K.; Sekizawa, A.; Okabe, H.; Endo, M.; Zama, S.; Araiba, K. Necessity of structuring an effective scheme of acquiring disaster information by fire departments just after an earthquake. J. Soc. Saf. Sci. 2008, 10, 89–96. [Google Scholar]
  11. Miura, H.; Midorikawa, S.; Matsuoka, M. Accuracy improvement of building damage detection using high-resolution SAR images observed from different directions. J. JAEE 2015, 15, 7_390–7_403. [Google Scholar] [CrossRef] [Green Version]
  12. Hasekura, K.; Gokon, H.; Koshimura, S.; Meguro, K. Verification of a method for determining analysis area of building damage in a tsunami affected area by using L-band SAR data. J. Soc. Saf. Sci. 2016, 29, 47–52. [Google Scholar]
  13. Sato, H.; Miyahara, B.; Okatani, T.; Koarai, M.; Sekiguchi, T.; Yagi, H. Detection of landslide surface deformation triggered by the 2011 off the Pacific coast of Tohoku earthquake using InSAR image. J. Jpn. Landslide Soc. 2014, 51, 41–49. [Google Scholar] [CrossRef] [Green Version]
  14. Li, C.; Zhang, G.; Shan, X.; Zhao, D.; Li, Y.; Huang, Z.; Jia, R.; Li, J.; Nie, J. Surface rupture kinematics and coseismic slip distribution during the 2019 Mw7.1 Ridgecrest, California earthquake sequence revealed by SAR and optical images. Remote Sens. 2020, 12, 3883. [Google Scholar] [CrossRef]
  15. Jiang, J.; Fu, X.; Qin, R.; Wang, X.; Ma, Z. High-speed lightweight ship detection algorithm based on YOLO-V4 for three-channel RGB SAR image. Remote Sens. 2021, 13, 1909. [Google Scholar] [CrossRef]
  16. Tang, G.; Zhuge, Y.; Claramunt, C.; Men, S. N-YOLO: A SAR ship detection using noise-classifying and complete-target extraction. Remote Sens. 2021, 13, 871. [Google Scholar] [CrossRef]
  17. Hass, F.S.; Jokar Arsanjani, J. Deep learning for detecting and classifying ocean objects: Application of YoloV3 for iceberg–ship discrimination. ISPRS Int. J. Geo-Inf. 2020, 9, 758. [Google Scholar] [CrossRef]
  18. Remote Sensing Technology Center of Japan, ASNARO-2. Available online: https://www.restec.or.jp/satellite/asnaro-2.html (accessed on 10 August 2022).
Figure 1. Aging rate in developed nations in 2018.
Sustainability 14 13895 g001
Figure 2. Proposed shape of reflectors.
Sustainability 14 13895 g002
Figure 3. Schematic of the determination of location and needs.
Sustainability 14 13895 g003
Figure 4. Analysis workflow in this study.
Sustainability 14 13895 g004
Figure 5. Example of reflector setup locations (onsite photos by authors).
Sustainability 14 13895 g005
Figure 6. Example of learning data base image.
Sustainability 14 13895 g006
Figure 7. Data augmentation of training data.
Sustainability 14 13895 g007
Figure 8. Image during augmentation processing of learning data.
Sustainability 14 13895 g008
Figure 9. Changes in precision ratio and recall ratio of each score threshold.
Sustainability 14 13895 g009
Table 1. ASNARO-2 elements.
Operating AgencyNEC (NEDO/METI)
Launch date17 January 2018
Observation items/purposeAscertaining disaster conditions, land management, resource management, etc.
OrbitSynchronous sub-recurrent orbit
Altitude505 km
Regression14 days
Regression (Japan region during emergency)1 day
Cycle95 min
Orbital inclination97.4 degrees
On-board equipment/typeXSAR (X-band synthetic aperture radar)
Observation width/ResolutionSpotlight 10 km/1 m
Stripmap 12 km/2 m
ScanSAR 50 km/16 m
PolarizationDual polarization HH/VV
Table 2. Reflector setup experiment summary and data usage.
Data UsageDate/Time of ExperimentQuadrilateral Reflectors (qty.)Hexagonal
Reflectors (qty.)
Nonagonal Reflectors (qty.)SAR Satellite Moving DirectionOff-Nadir Angle (Degrees)Radio Wave Irradiation Direction
Learning data26 May 2020534Ascending orbit43.7Leftward
28 May 2020555Descending orbit42.7Rightward
7 July 2020110Ascending orbit43.7Leftward
21 July 2020100Ascending orbit43.7Leftward
22 July 2020411Descending orbit42.7Leftward
Test data (reflectors set up)26 November 2020646Descending orbit42.7Rightward
10 December 2020522Descending orbit 42.7Rightward
Test data (reflectors not set up)11 June 2020-Descending orbit42.7Rightward
25 June 2020-Descending orbit42.7Rightward
Table 3. Precision ratio, recall ratio, and F-value of each score threshold.
Score ThresholdPrecision RatioRecall RatioF-Value
0.10.450.880.59
0.20.640.880.74
0.30.700.760.73
0.40.730.790.76
0.50.820.720.77
0.60.880.600.71
0.71.000.460.63
0.81.000.360.53
0.9-0.00-
Publisher’s Note: MDPI stays neutral with regard to jurisdictional claims in published maps and institutional affiliations.

