1. Introduction
A driving cycle (DC) is a plot of vehicle speed versus time and is used to assess a vehicle’s performance, emissions, and energy consumption [
1]. Various standard DCs, such as WLTC, FTP 75, and JC08, have been created [
2]. There is wide agreement among researchers that driving characteristics are unique due to different vehicle fleet compositions, driving behaviors, and roads [
3]. The China Light-Duty Vehicle Test Cycle for Passenger Cars (CLTC-P) is close to reality in China, but notably different from other standard DCs based on a comparison analysis [
4]. For this reason, existing standard DCs have failed to estimate exhaust pollutants and fuel consumption accurately in various countries. Several studies have therefore focused on constructing DCs using real-world driving data collected on the road. There is no local DC for estimating and testing automobile emissions in Addis Ababa, Ethiopia’s capital city, either for official purposes or for research. Standard DCs do not reflect the current scenario in Addis Ababa.
The typical DC development method used for emissions levels and fuel consumption is the Micro Trip (MT) method [
2,
5,
6], in which several researchers decide on the DC duration based on their experience and previous DC durations. During DC development, they randomly select and chain MTs until the desired DC duration is obtained and repeat this step several times to obtain candidate cycles. The authors of [
5] initially opted for a DC duration of between 1200 s and 1300 s and developed two DCs with a duration of 1216 s and 1261 s. To develop the DC for hybrid buses in the city of Zhengzhou in China, Peng et al. (2015) determined the duration of the designed DC to be 1200 s [
7]. Similarly, the authors of [
6] decided on a DC duration of 1200 s. The authors of [
8] developed three DCs for different routes separately, randomly constituting a DC until the required cycle duration was achieved. However, the DCs developed by this method are not repeatable and the cycle length is not representative of actual conditions. Furthermore, the DC duration has an impact on emission and fuel consumption estimates. Adopting a methodology for DC length based on obtained real-time data can therefore be more representative than using conventional DC durations described in the literature. In order to resolve these issues, in the present study a trip-based method of DC development is proposed.
During DC development, the classification method is applied to kinematic segments to cluster them into heterogonous classes based on statistical properties. Several researchers have applied principal component analysis (PCA) using the k-means clustering method [
5,
6,
9,
10,
11]. The authors of [
12] applied PCA to reduce fifteen characteristic parameters to three factor scores, Liu et al. (2018) applied PCA to reduce fifteen kinematic characteristics values to four principal components based on the eigenvalue [
10], and Zhou et al. (2017) reduced eight driving parameters to three principal components using PCA [
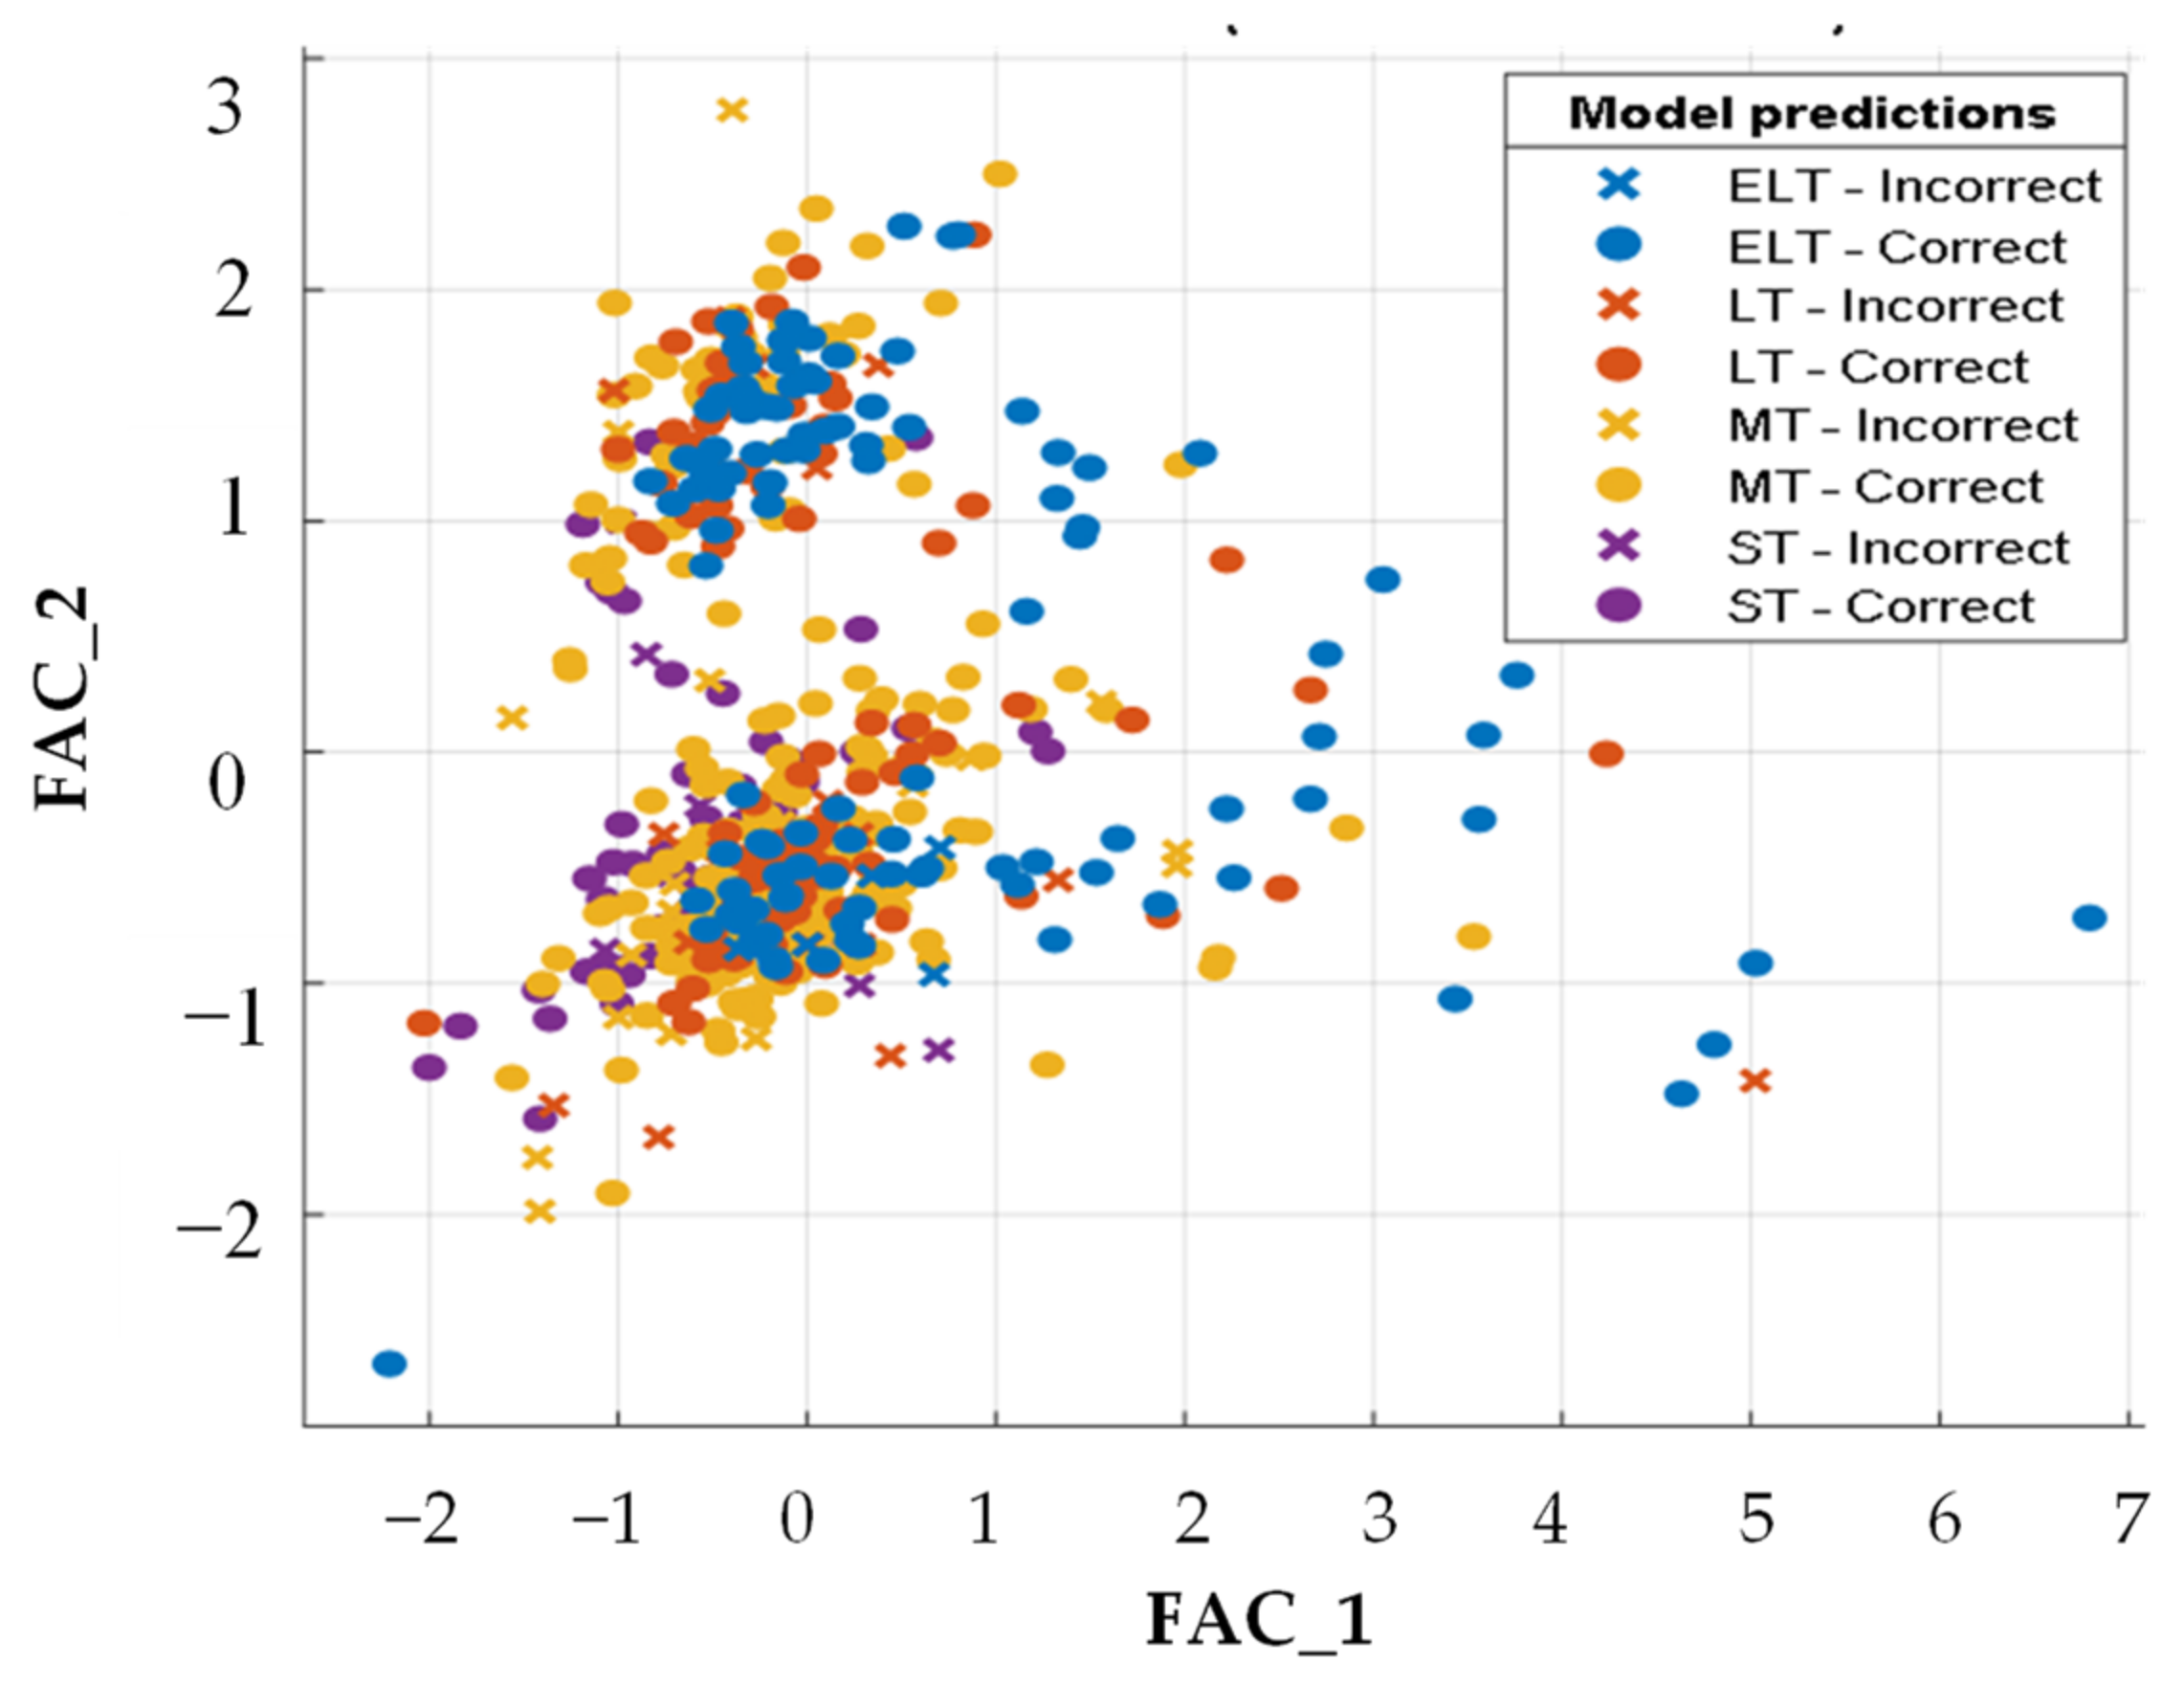
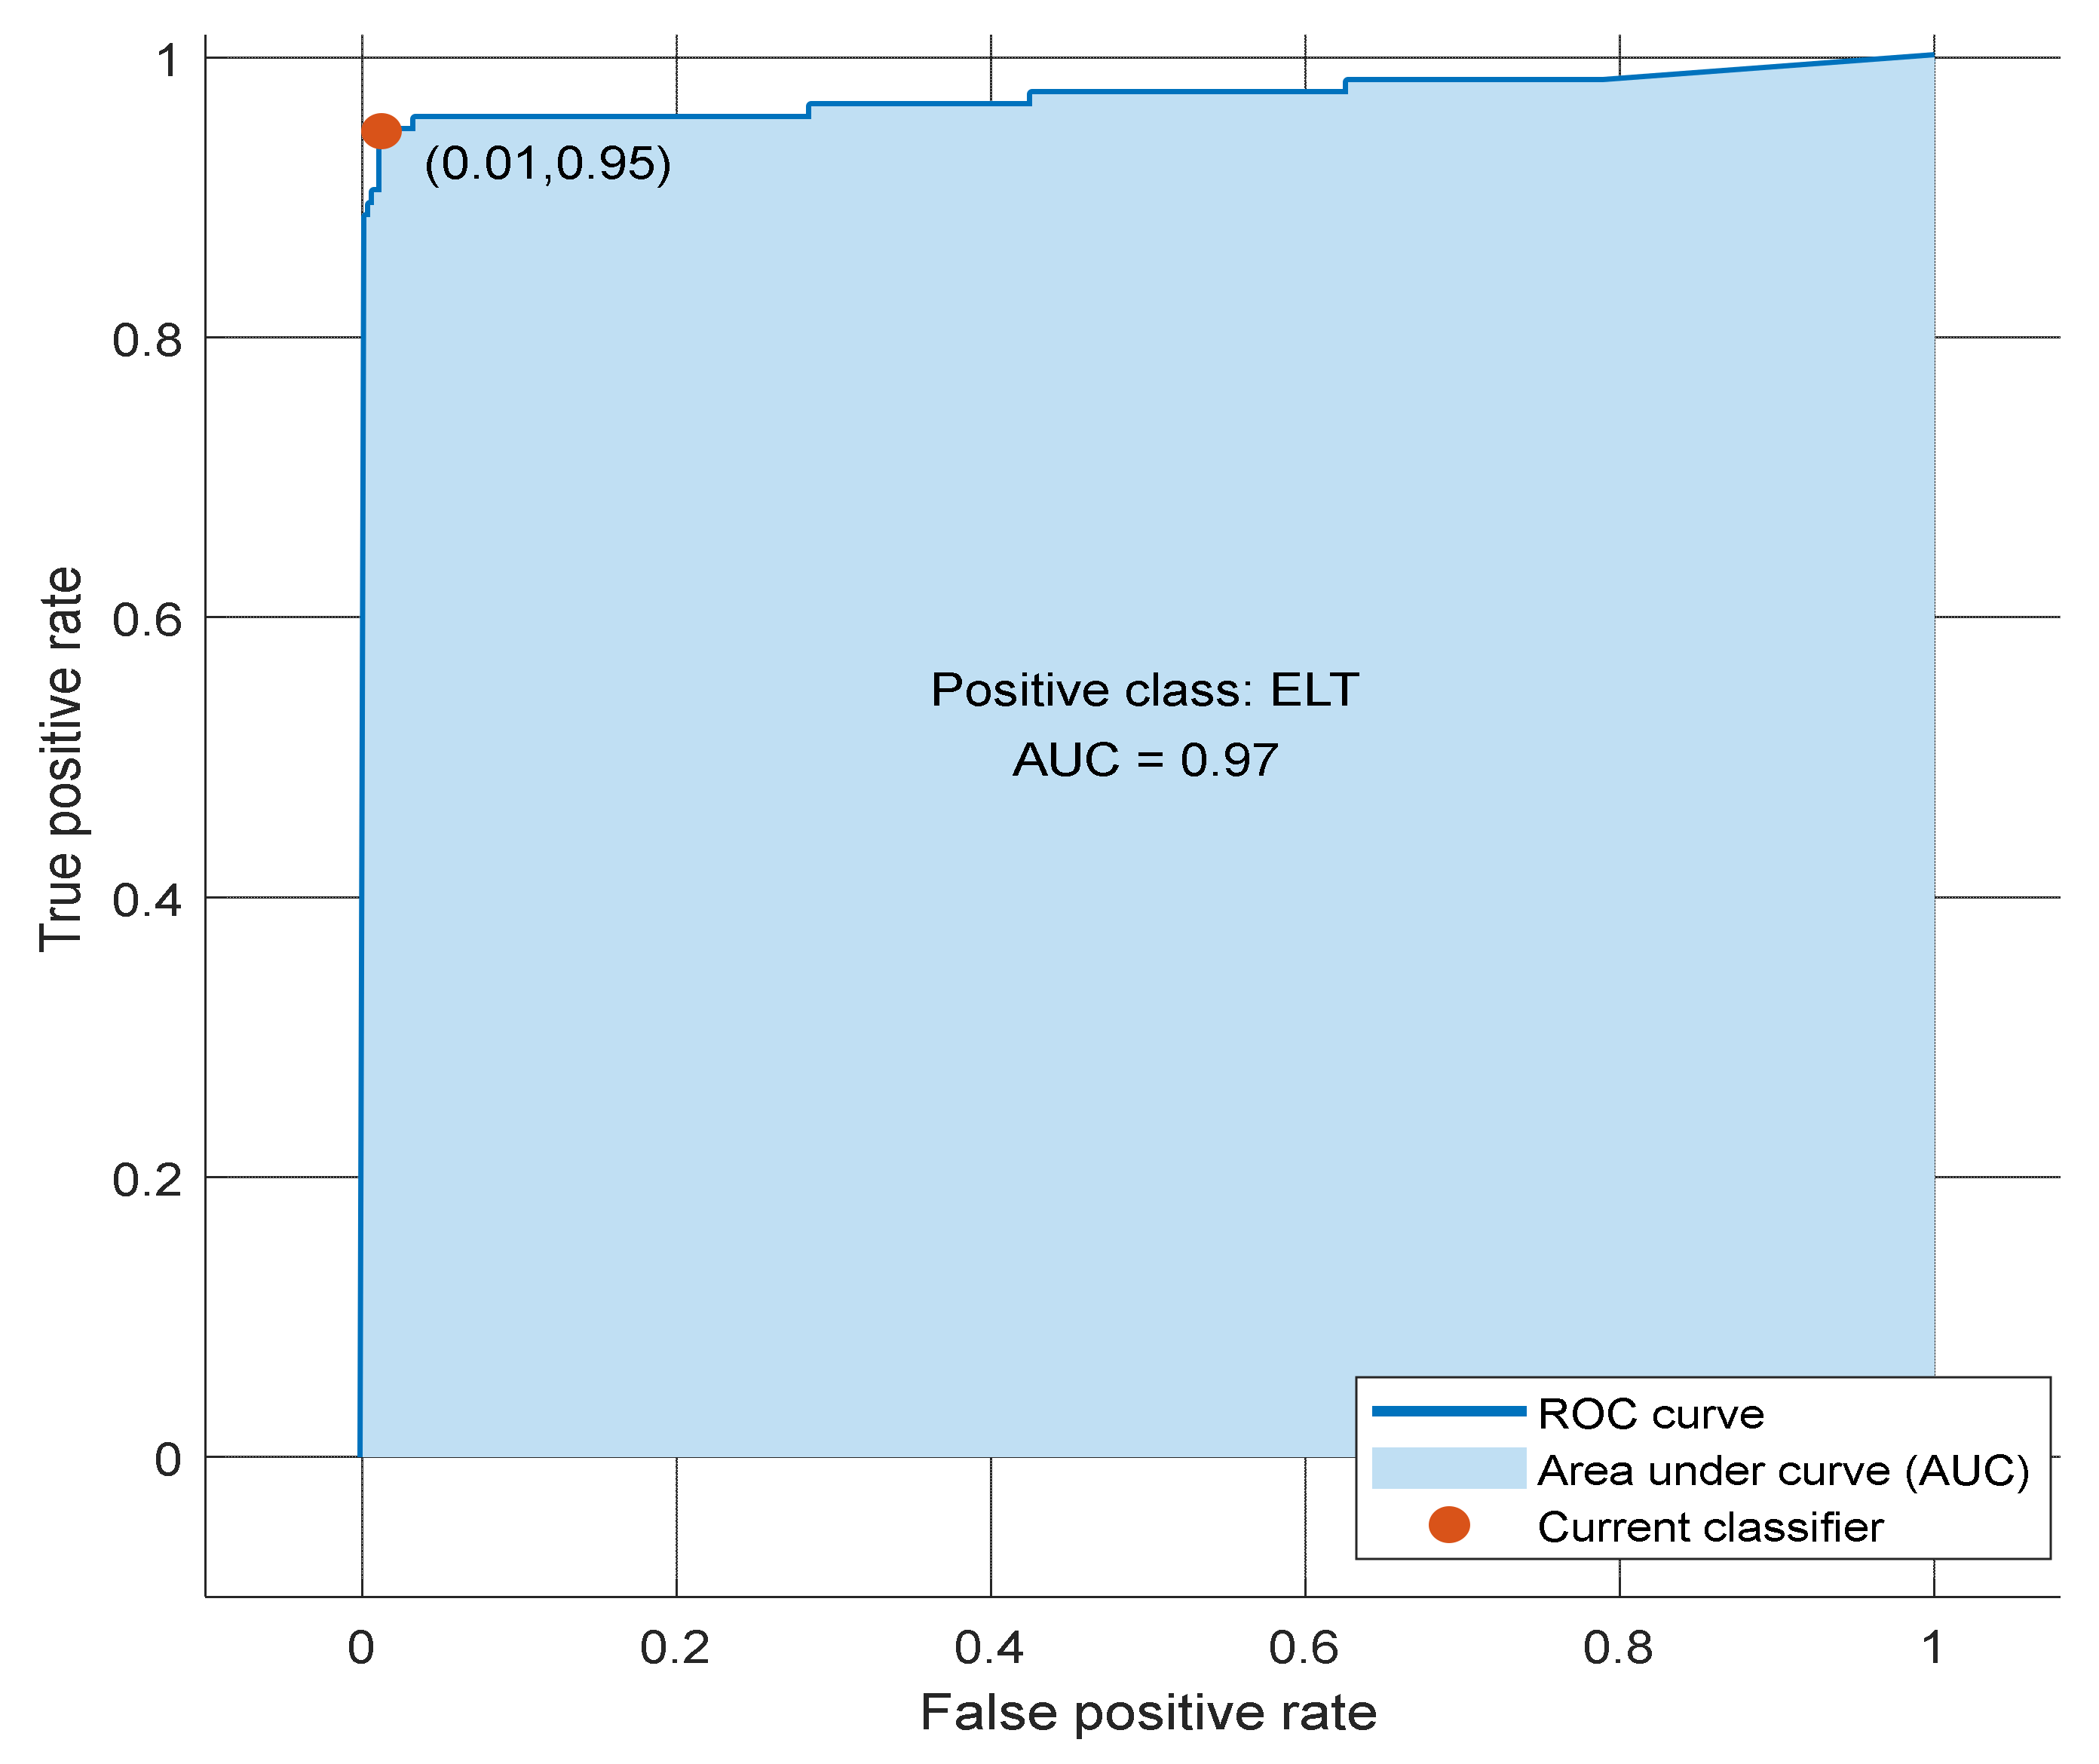
13]. However, there has been no evaluation of which clustering method offers the best performance with PCA. Therefore, in order to identify the best clustering method, a machine classification learner was applied using MATLAB. This trains the model to classify data using supervised machine learning algorithms. All classification learner methods available were applied to the input dataset, and the algorithms then computed the accuracy scores using the observations.
Machine learning currently offers the best theoretical foundation for DC prediction with deep learning [
14]. Chen et al. (2019) used a DC prediction method based on a convolutional neural network [
15], while Qiu et al. (2018) used a recurrent neural network-based technique to develop DCs for light-duty vehicles in Beijing [
16]. To improve fuel economy, Zhao et al. (2018) proposed a deep reinforcement learning framework for hybrid electric vehicle power control [
17].
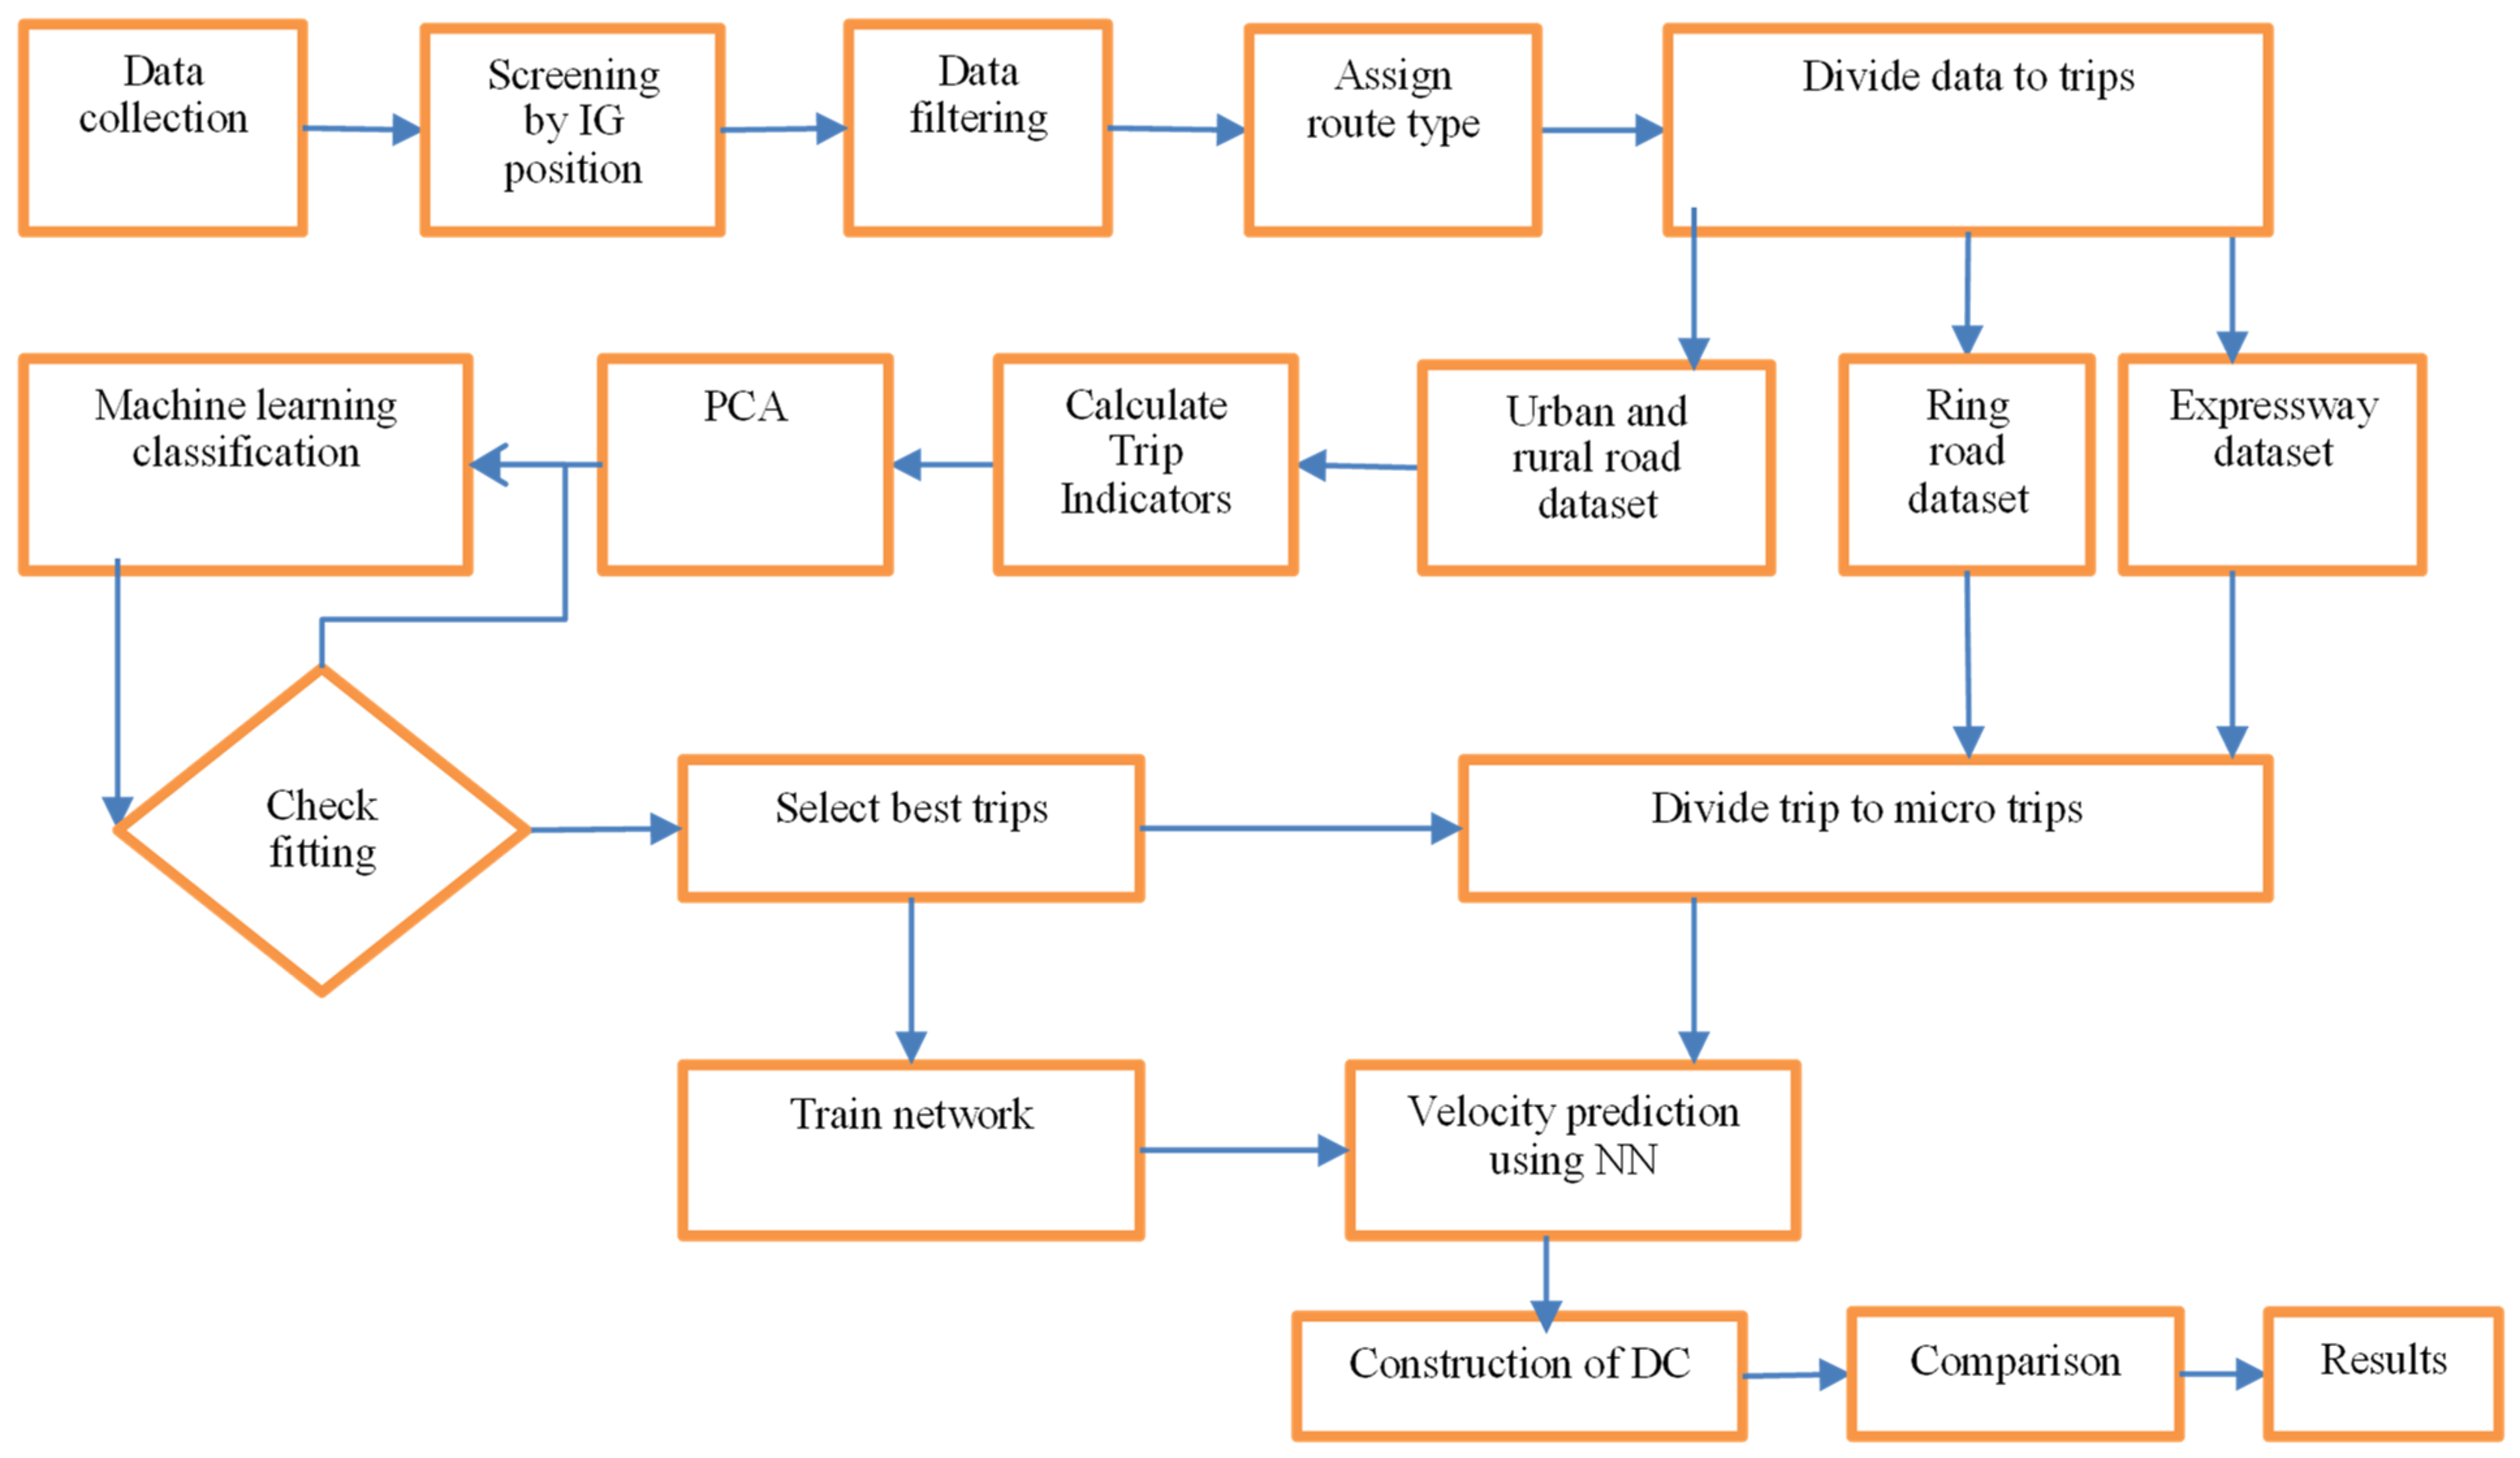
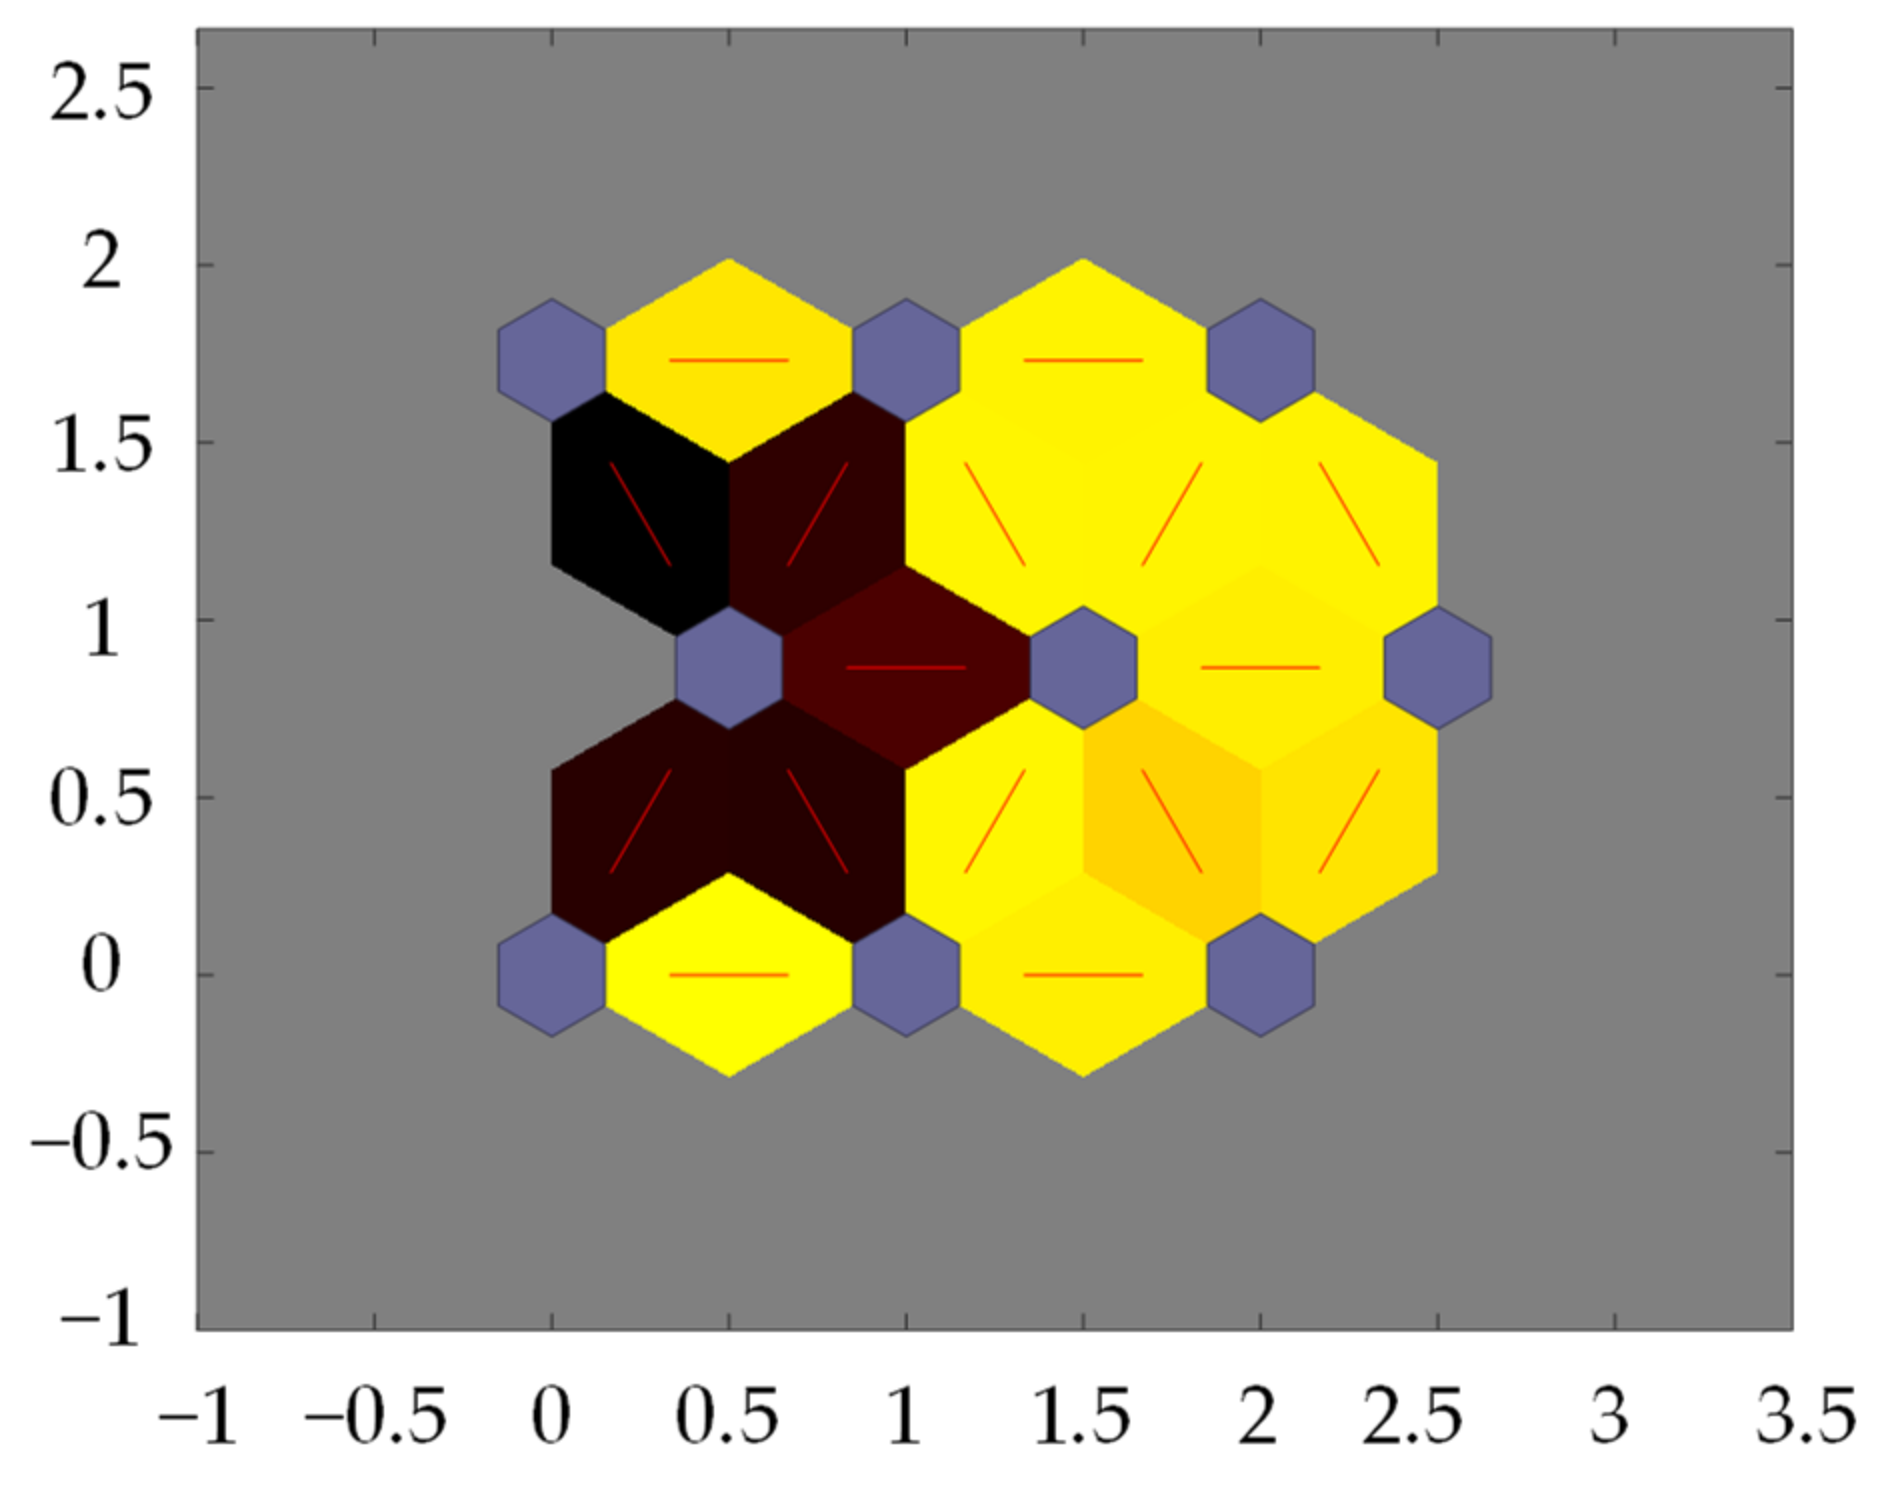
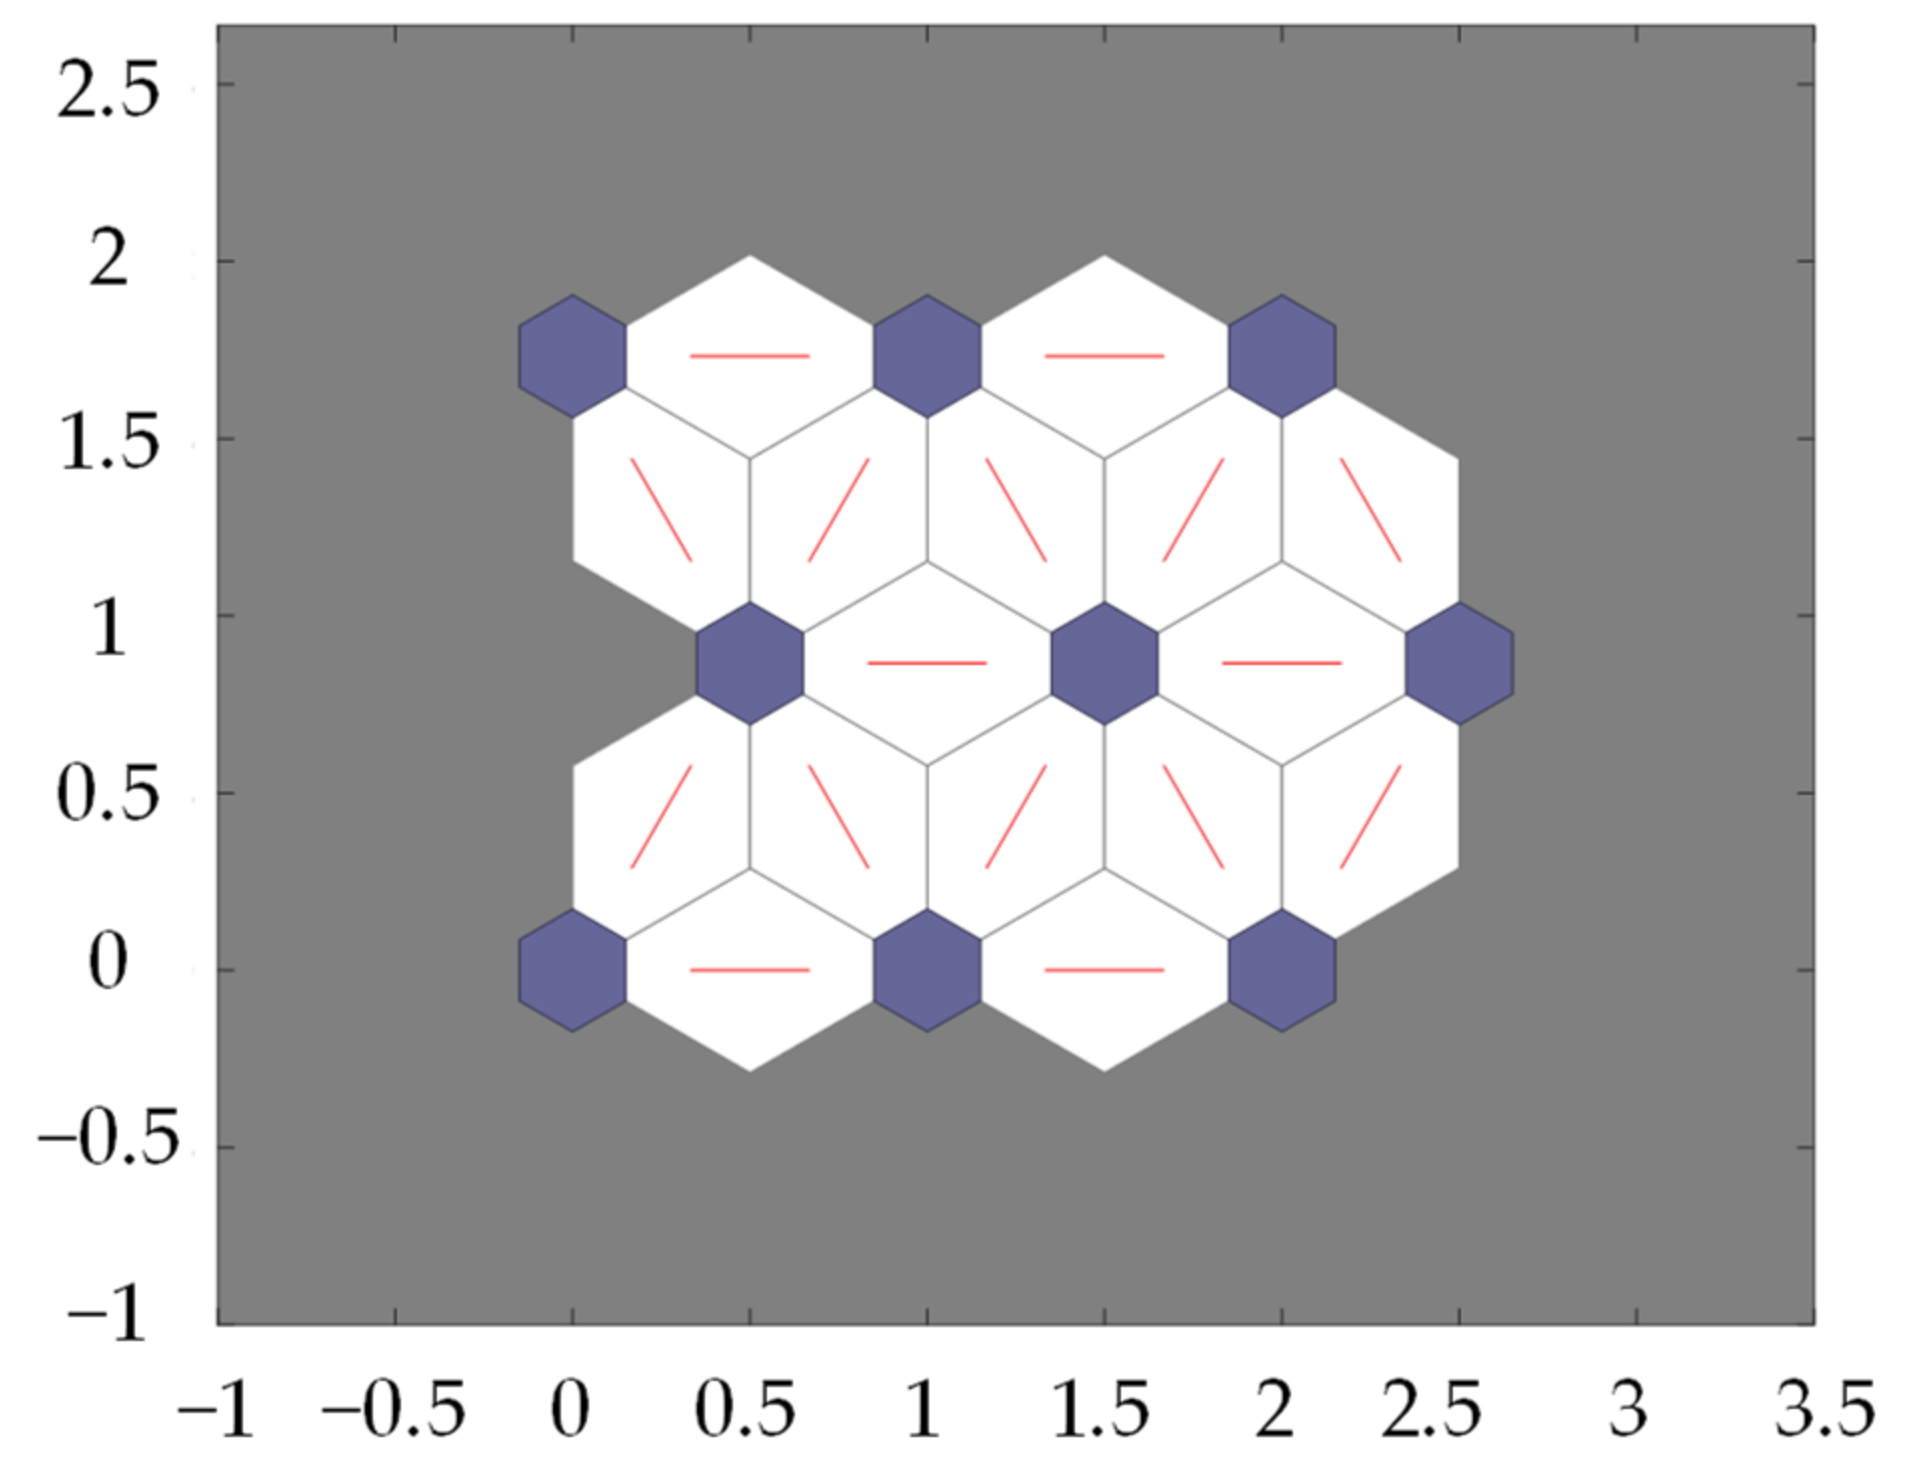
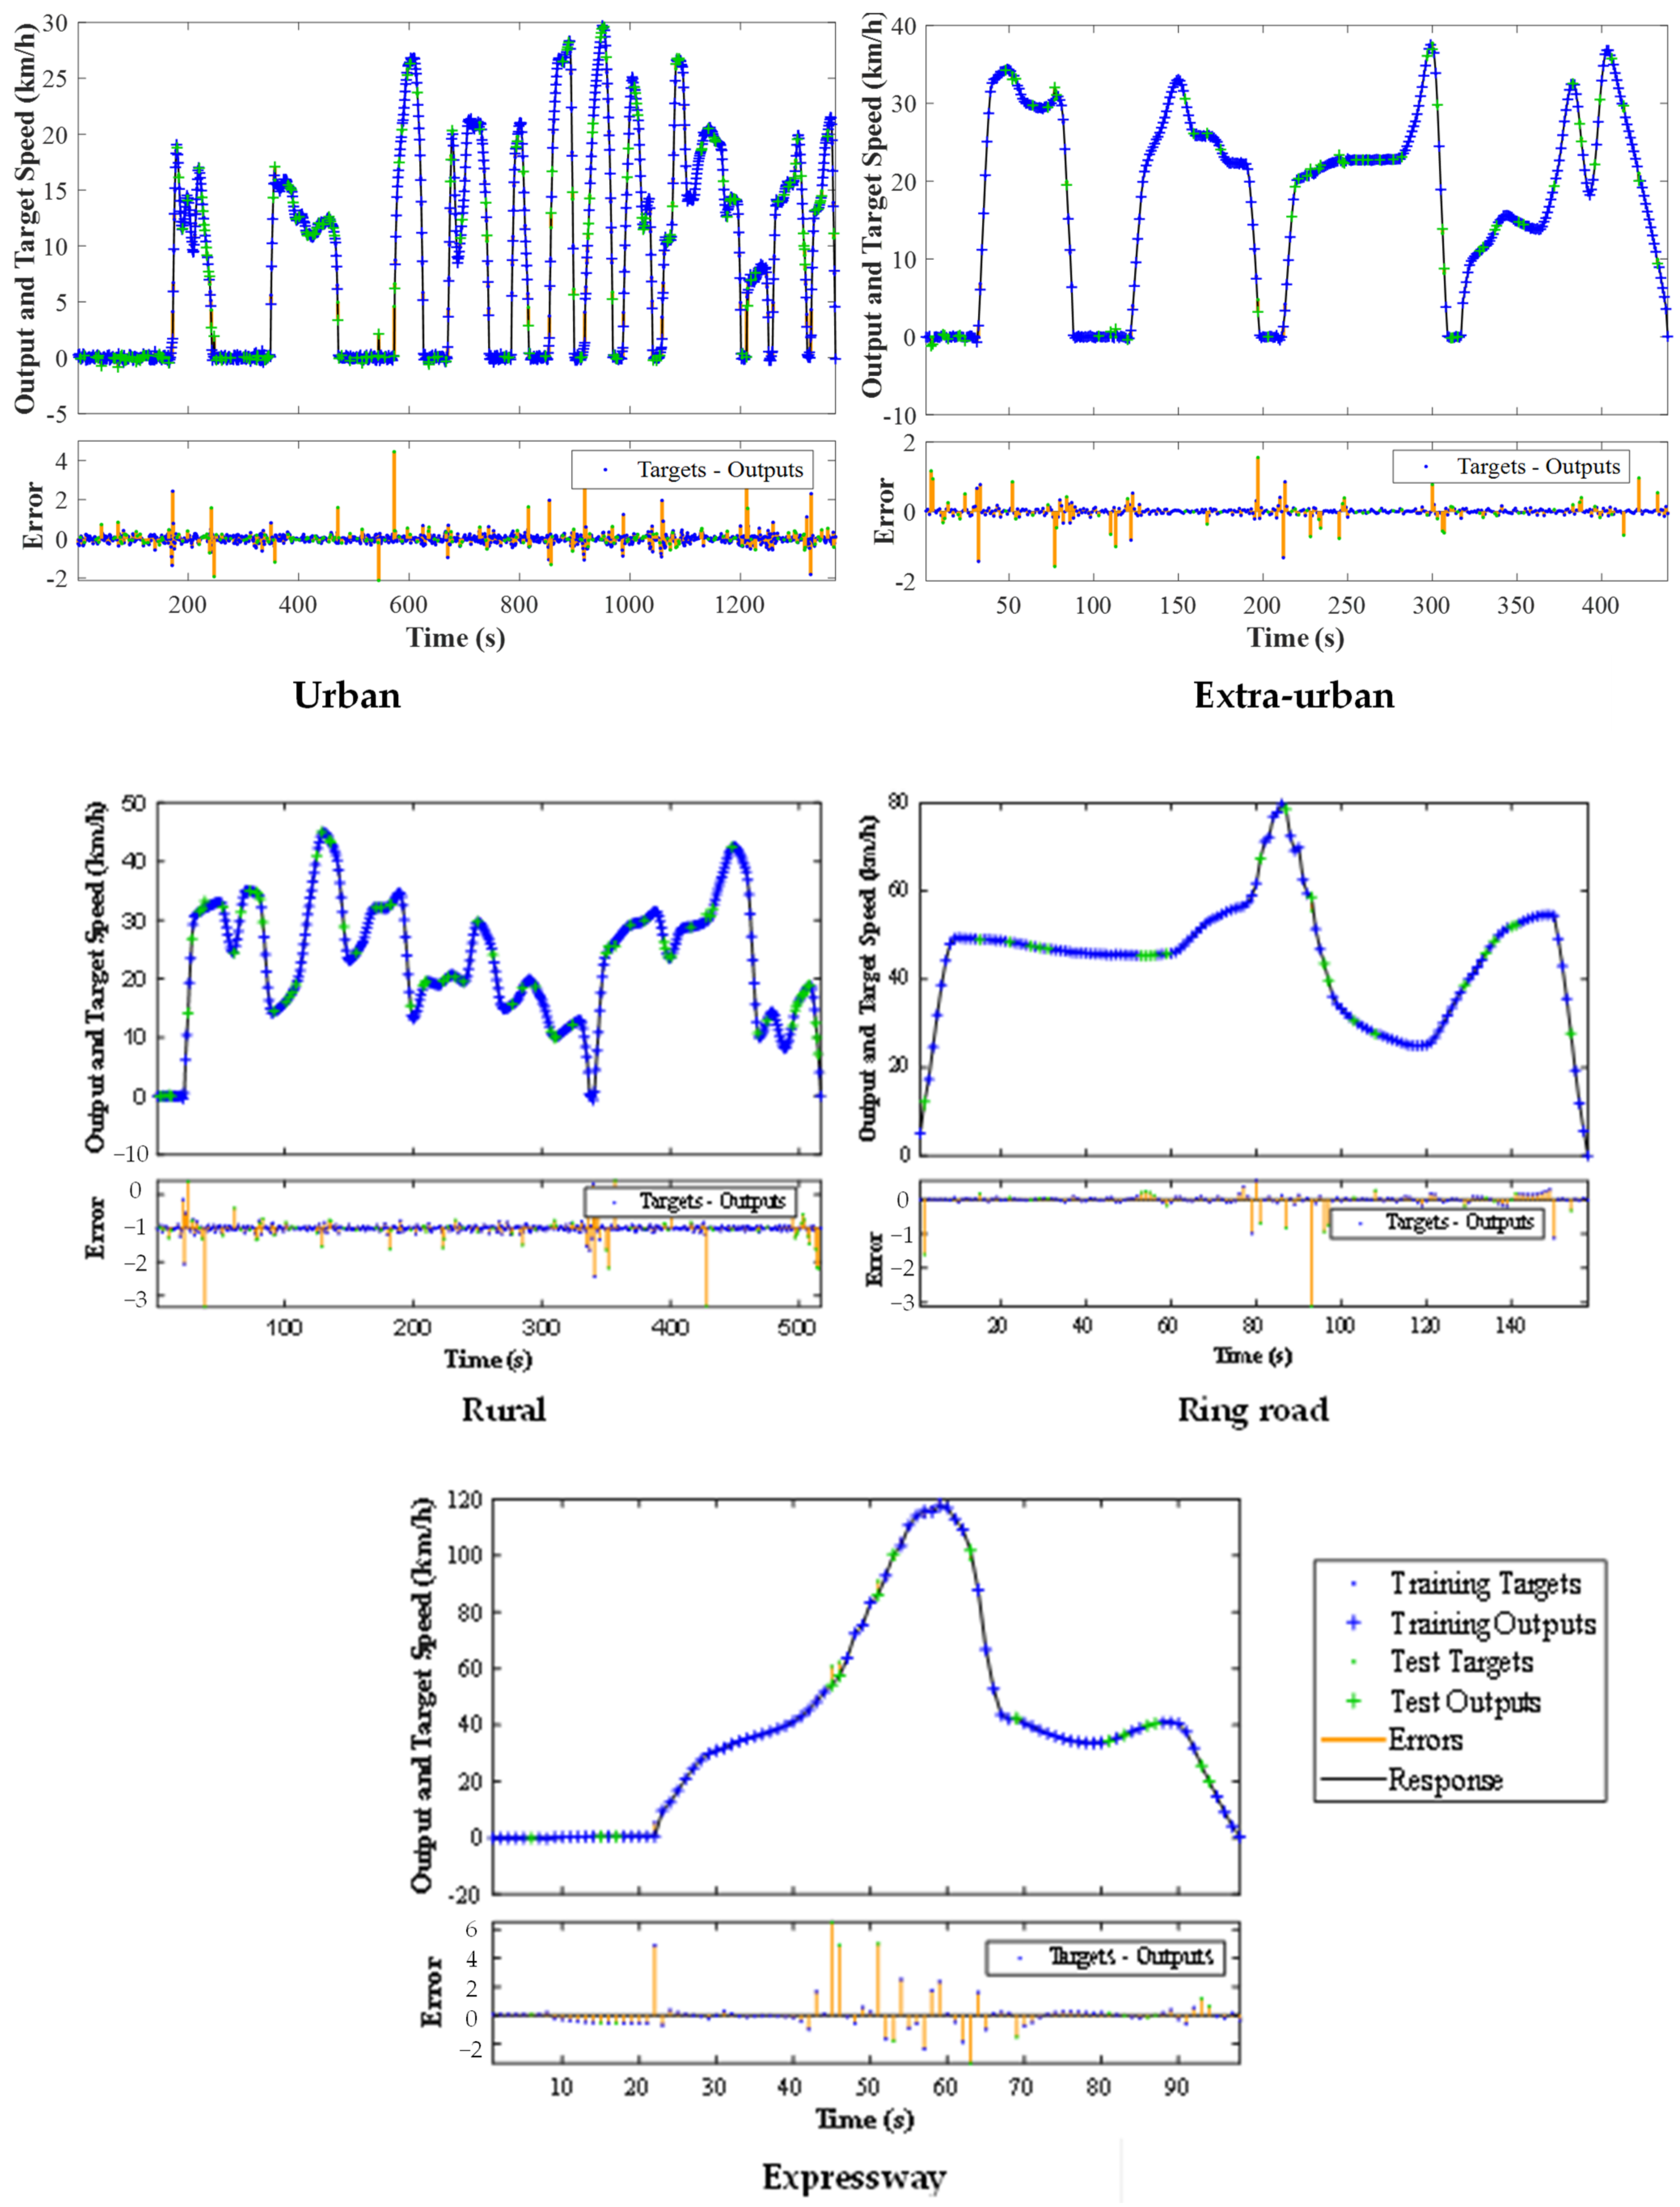
Inspired by the recent breakthrough in machine learning, this study proposes the use of principal component analysis (PCA) and neural network (NN) prediction methods to develop a DC. To demonstrate the significance of the proposed methodology in this study, the authors also developed the DC using the MT method using the same data used for the NN method. Then, the authors compared the developed DCs with processed experimental (target) data using characteristic parameters to evaluate their representativeness. The real-time driving data used in this study were taken from five vehicles using a global positioning system (GPS) in Addis Ababa city. By means of MATLAB, outliers were found and filled in using shape-preserving cubic interpolation (PCHIP), then the Bayes wavelet signal denoising technique was used to remove noise from the data. Subsequently, seventeen trip indicators were generated for each trip after the denoised data were separated into trips based on predetermined criteria. The dimensions of the trip indicators were then reduced using PCA. After the NN clustering divided the trips into highly diverse categories, the best trip selection followed. In order to train the NN to predict the vehicle speed for each road type, Bayesian regularization with a back-propagation training algorithm was used. The predicted speeds were then joined to generate a representative Addis Ababa DC.
The main aim of this project was to create the Addis Ababa DC using real-time data from passenger vehicles. The Addis Ababa DC was developed based on the data collected, evaluating their characteristic indicators and comparing them with the produced cycle and standard DCs. The analysis results indicate that the developed Addis Ababa DC using NN prediction is more representative of real-time collected data than the MT method and is significantly different from standard DC characteristic parameters.
4. Discussion
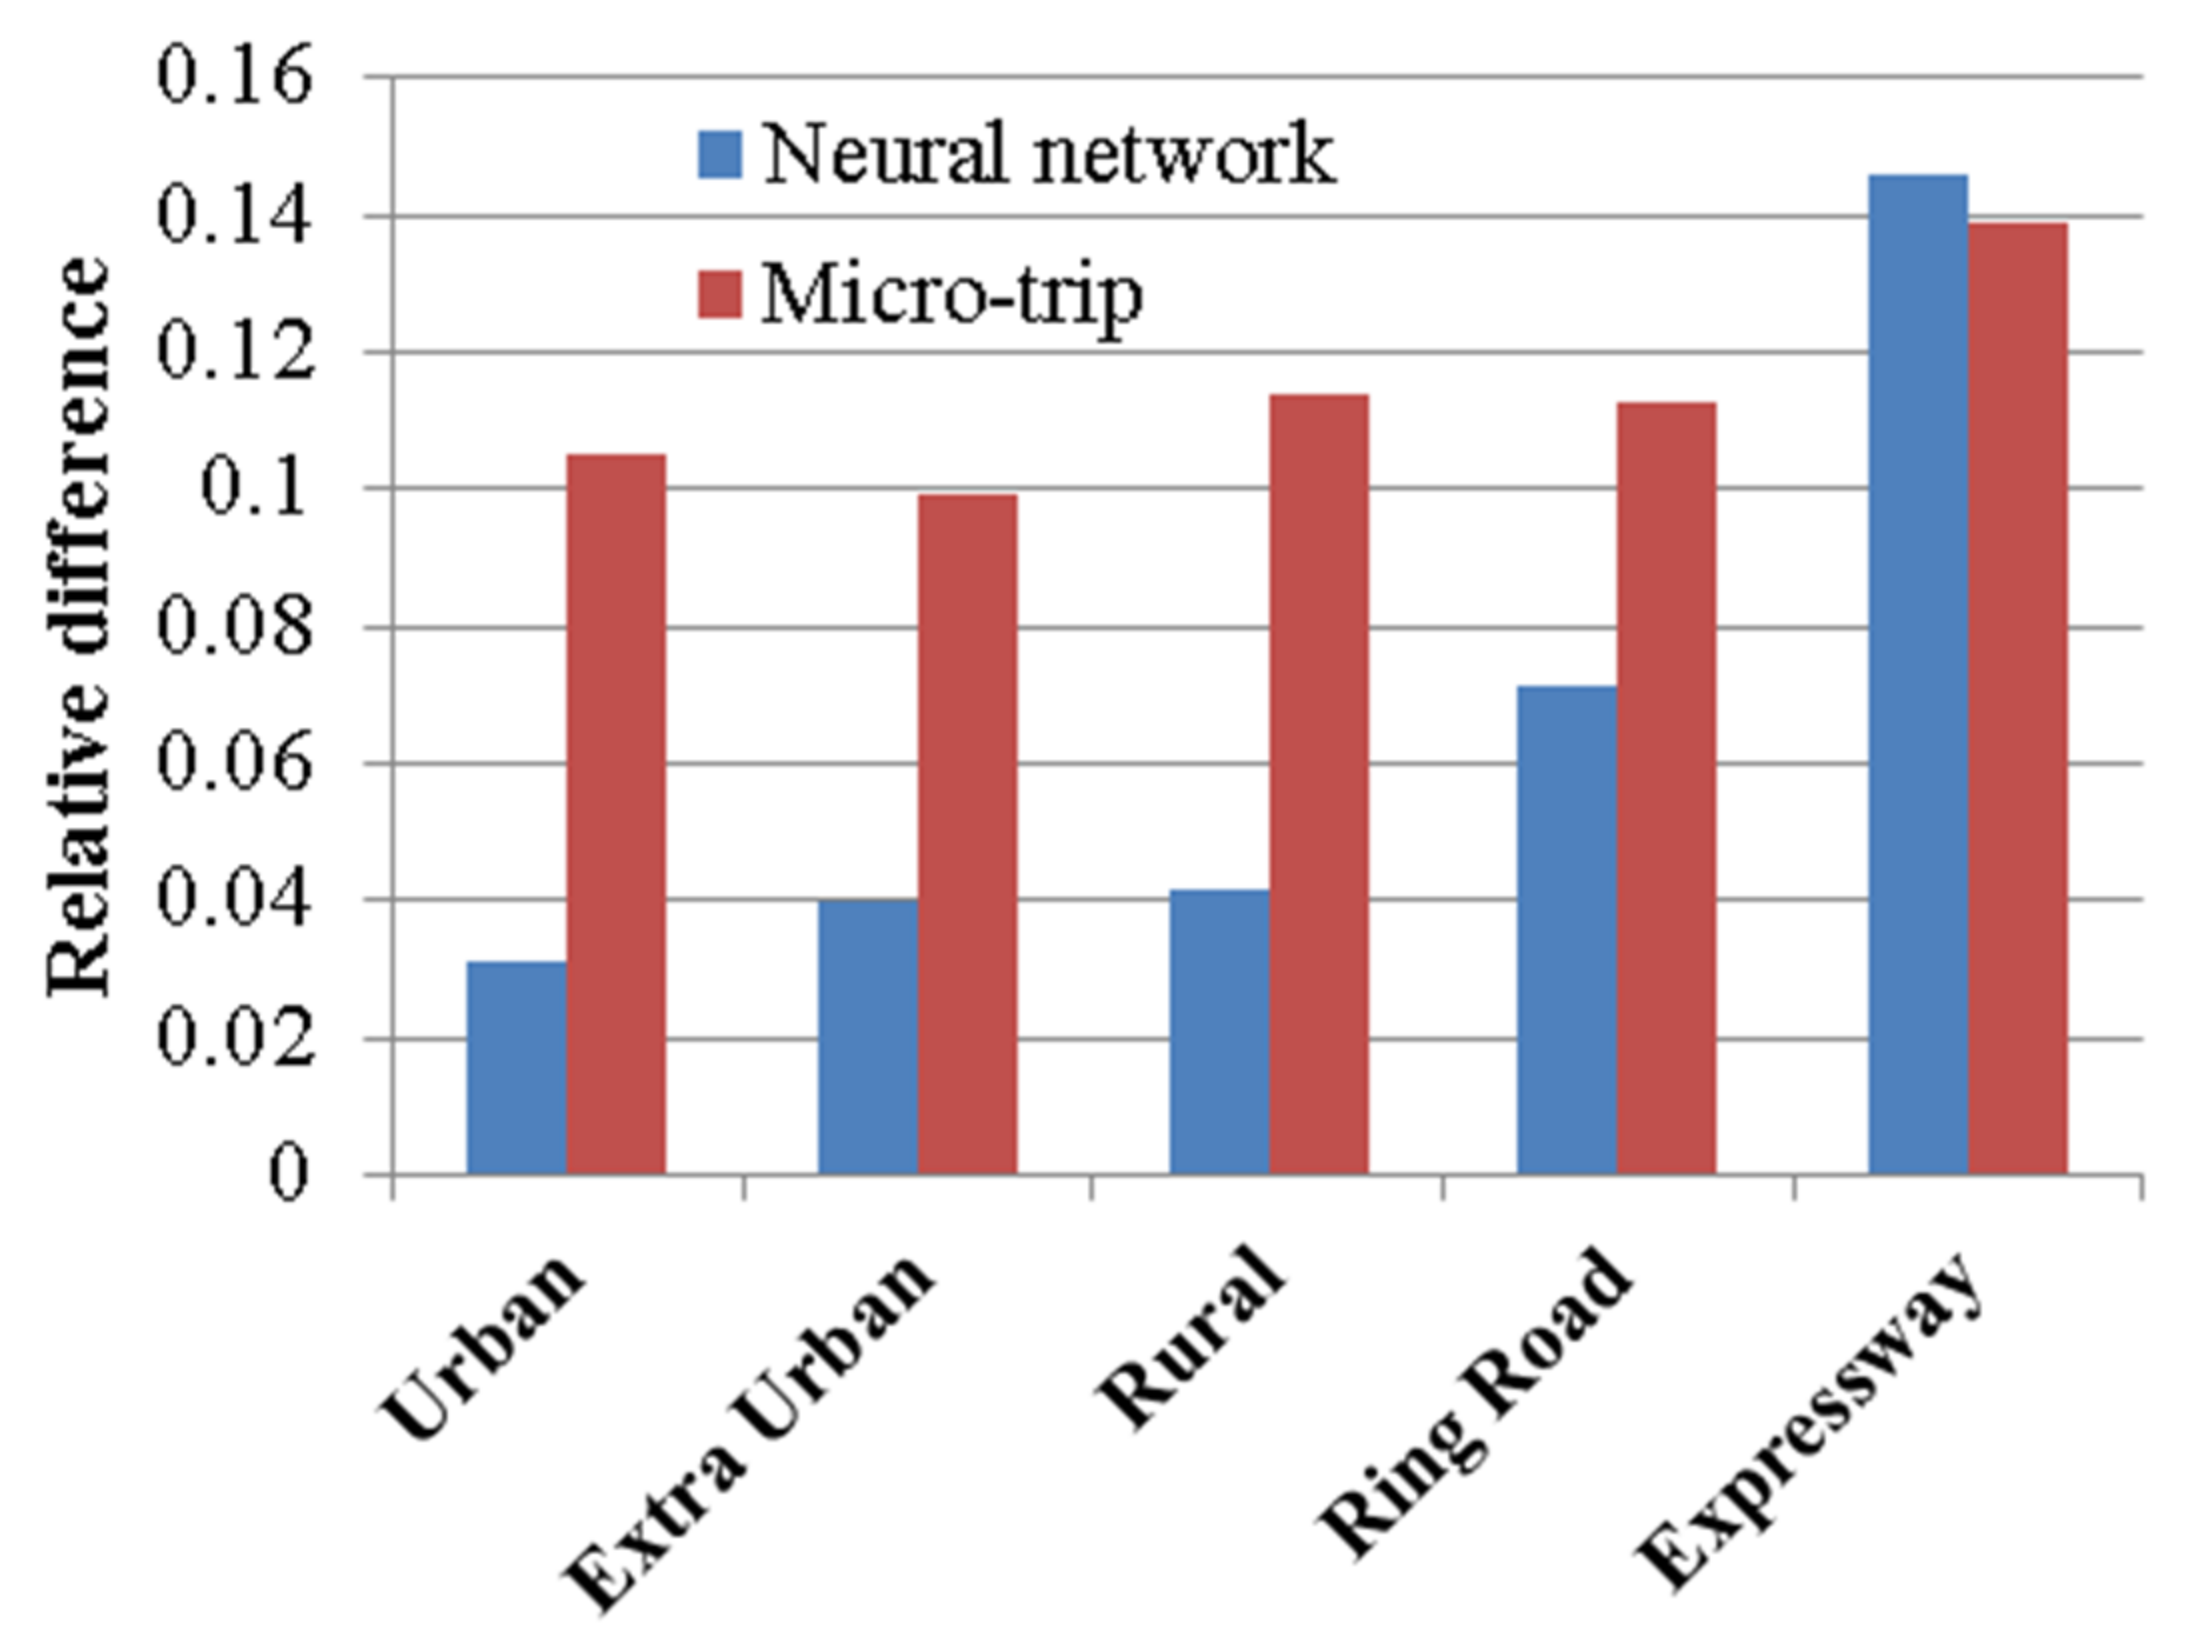
Following the application of the two approaches described above, we determined each method’s corresponding DC and evaluated how well the DCs corresponded to the driving circumstances in Addis Ababa. The values obtained for the paired CPs of each route compared to the target are given in
Figure 20. We used all of the CPs provided in
Table 9 to evaluate the representativeness of the developed DCs. With regard to the urban, extra-urban, rural, ring road, and expressway sections, the applied NN method represents 96.91%, 96%, 95.81%, 92.85%, and 85.3%, respectively, compared with the target data. However, the MT method represented 89.48%, 90.1%, 88.6%, 88.73%, and 86.1% of the urban, extra-urban, rural, ring road, and expressway sections, respectively. This result indicates that the NN method improved the degree of representativeness by 7.43%, 5.9%, 7.21%, and 4.11% for the urban, extra-urban, rural, and ring road sections, respectively. For the NN prediction method, the resulting DC precisely depicts all the CPs that describes each route compared with the MT method except for the expressway section. Due to the expressway’s extended travel distances without stops, we noticed that the paired CPs for the NN method are quite close to the maximum established deviation. Additionally, compared with the training data for the other routes, fewer data were used to train the NN on the expressway.
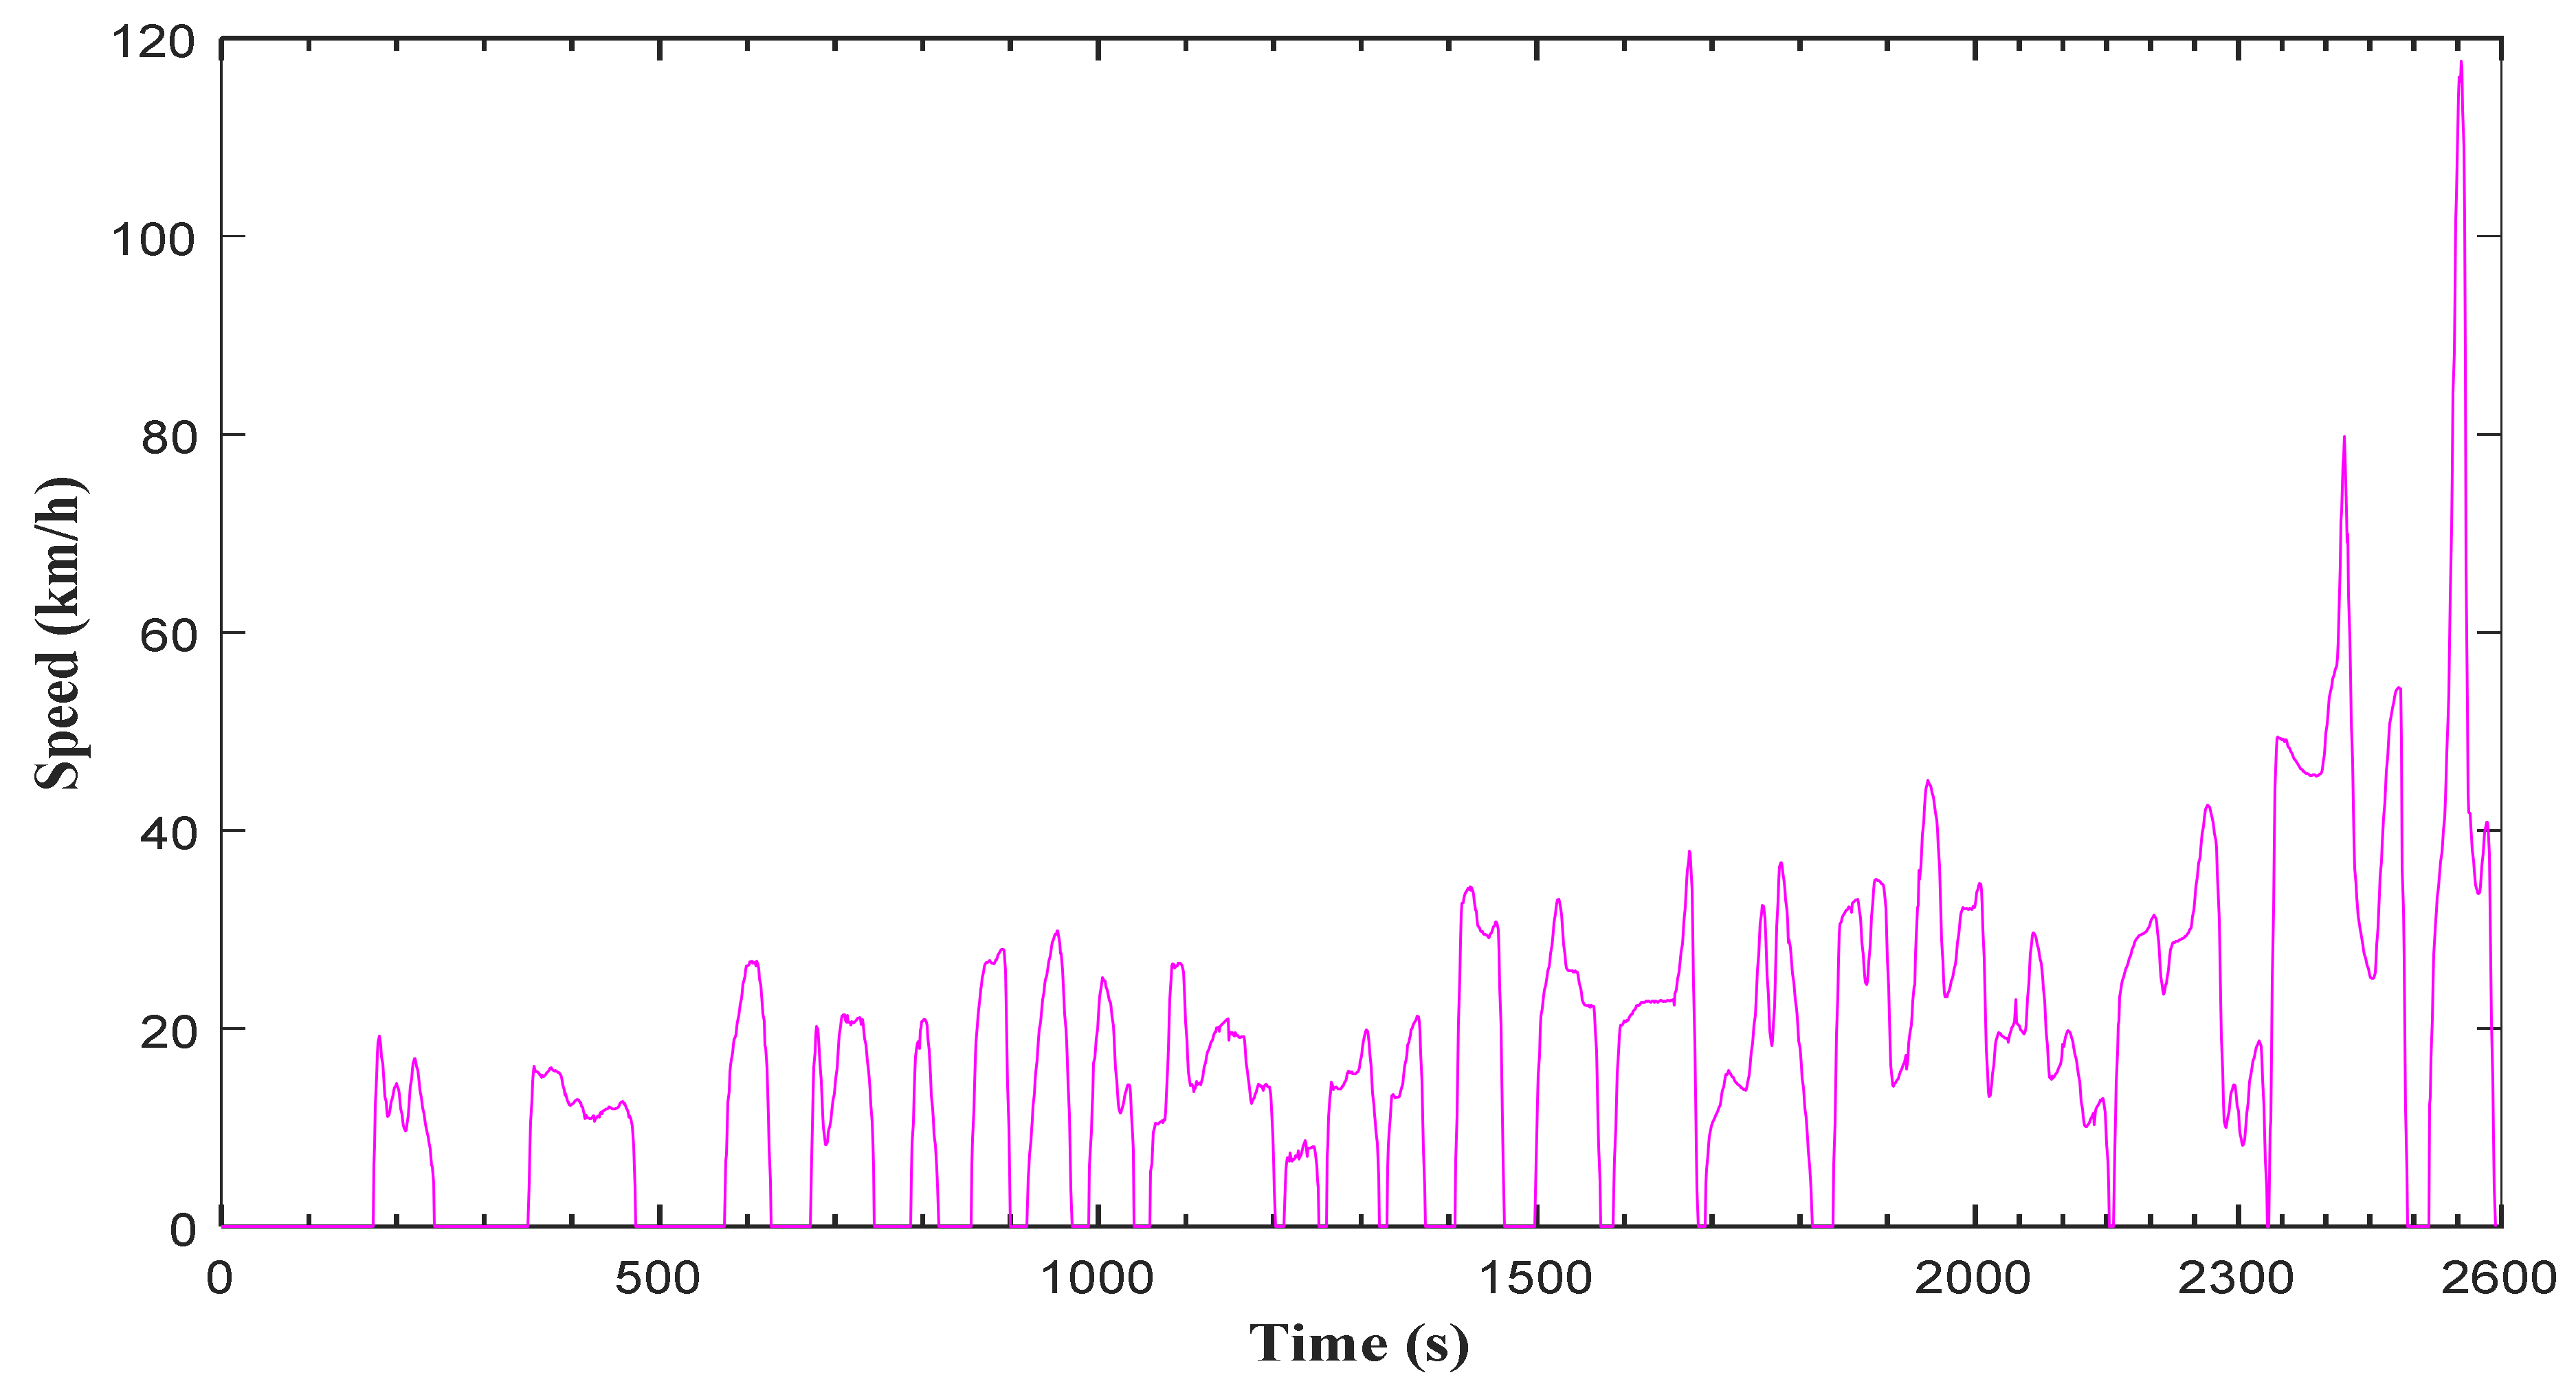
The duration characteristics of DCs developed using the NN prediction and MT methods were compared. From the comparison of duration characteristics, the DC developed by the NN method is longer (2594 s), while the DC developed using the MT method is relatively short (1539 s). The DC duration obtained using NN prediction is very close to the daily trip average duration of 3051 s. The distance of the DC obtained using NN-based prediction is longer (11.885 km), and the MT-based cycle distance is shorter (8.732 km). However, the daily average trip distance of the collected data is 13.667 km, which is very close to the distance of the DC obtained using NN prediction with a relative difference of 0.13.
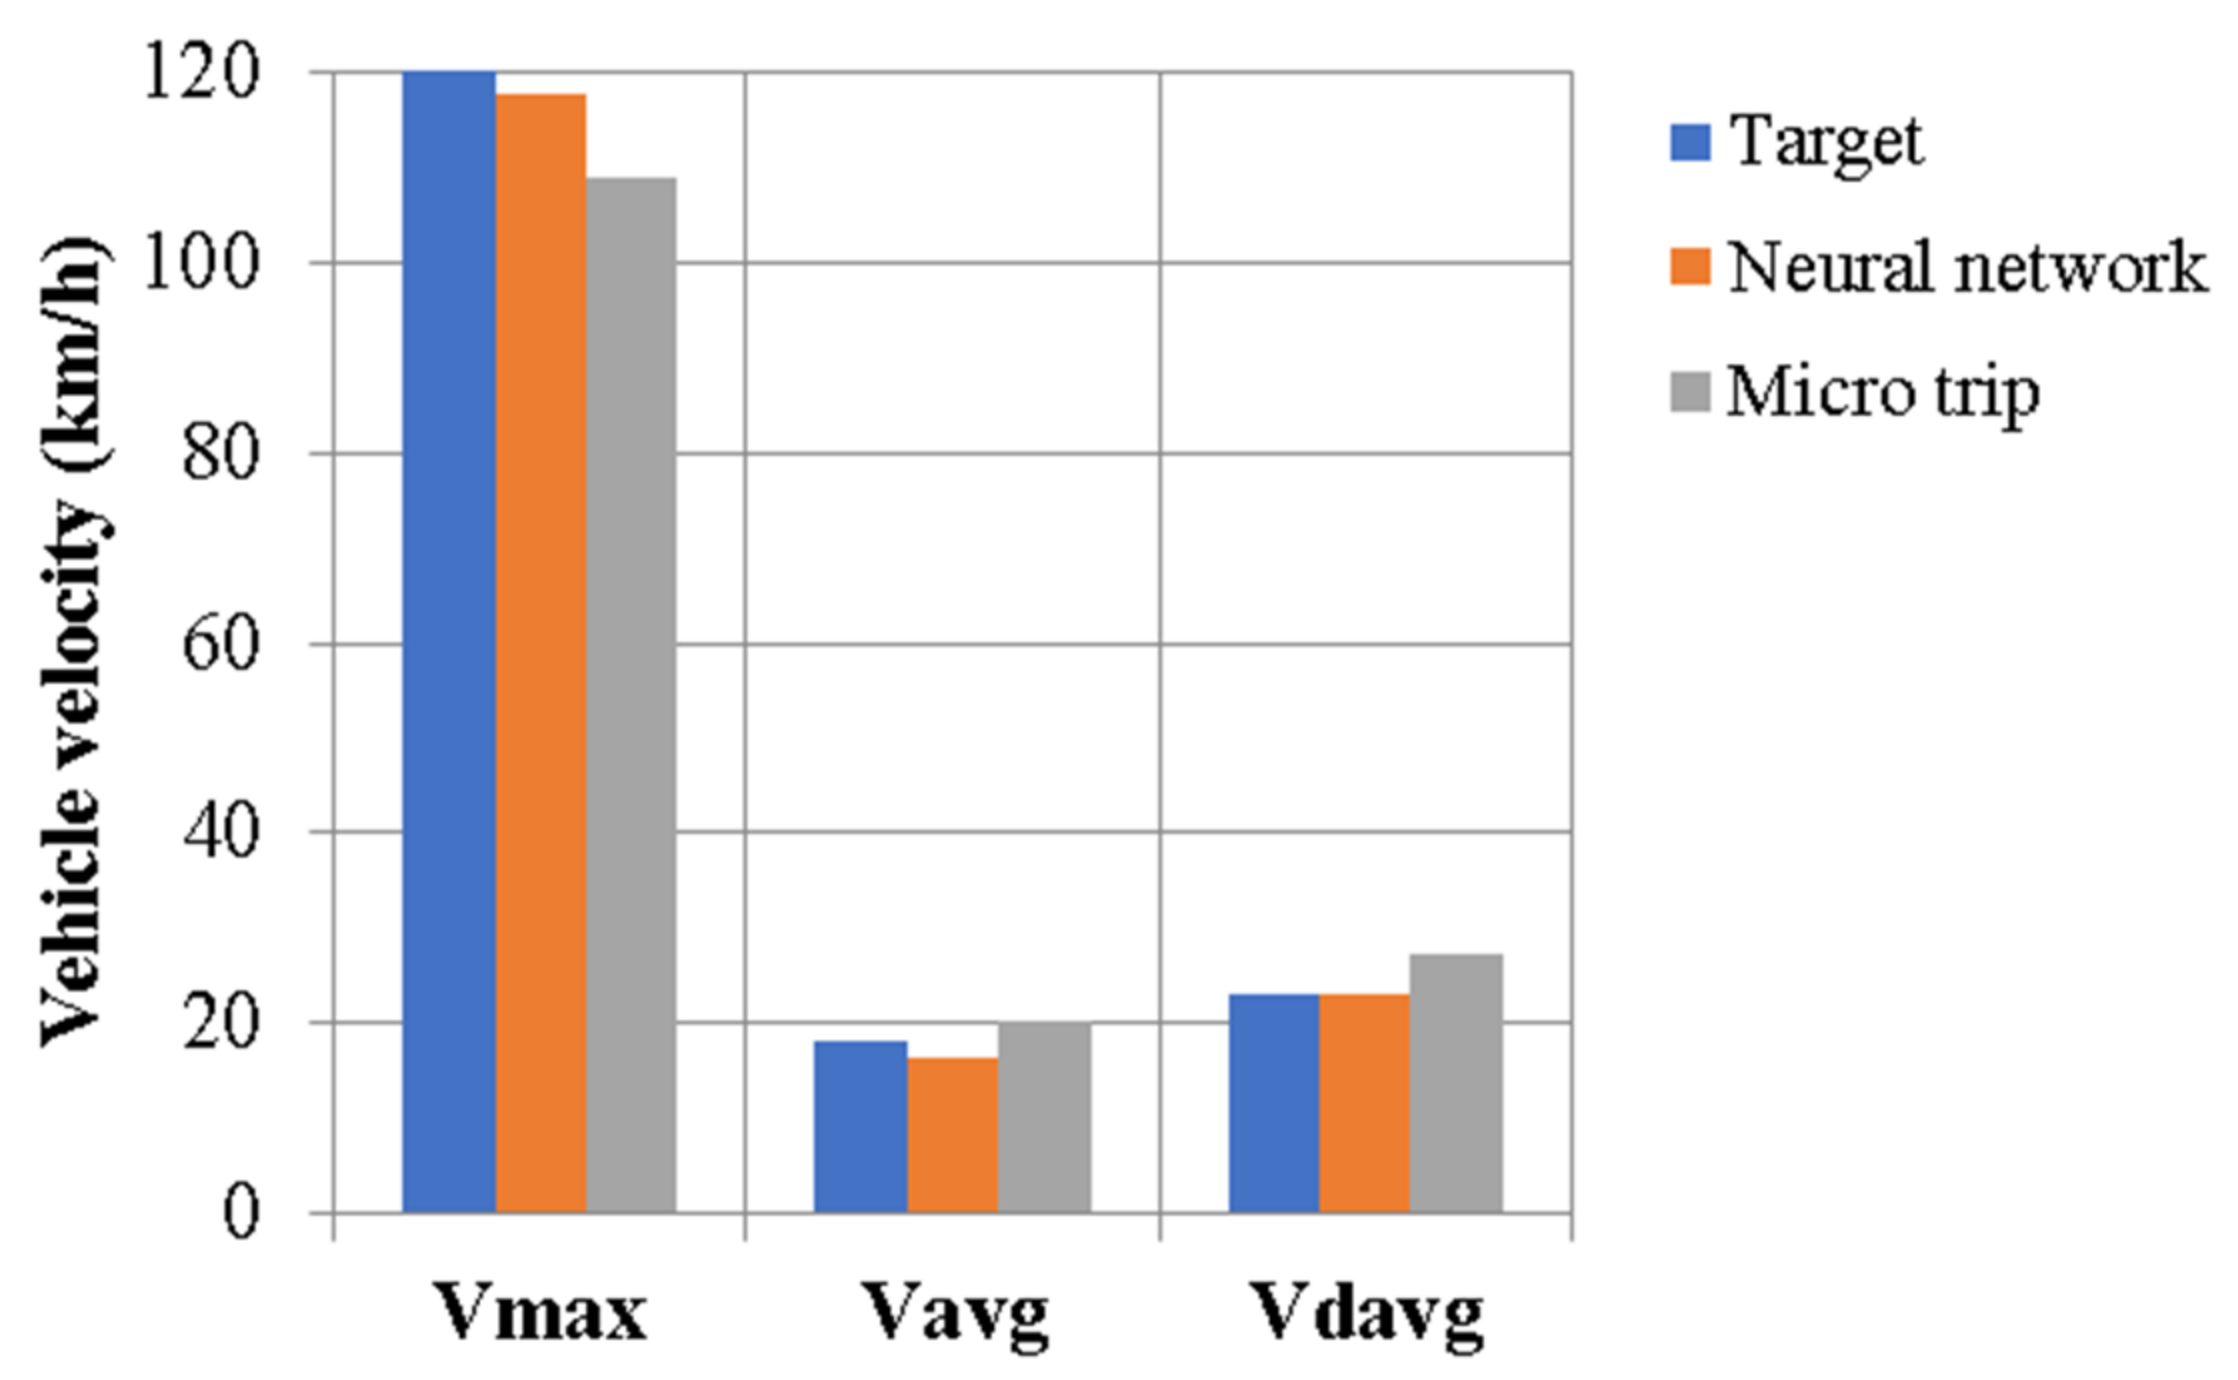
Figure 21 shows the comparison of vehicle velocity characteristics of the processed experimental data and the DCs developed using the two methods. From the perspective of the maximum velocity, average velocity, and average driving velocity, the NN method is the closest to the target compared with the MT method. This means that the speed distribution of the NN method is consistent and representative of the actual driving conditions of Addis Ababa city.
From the point of view of the maximum acceleration and deceleration, the NN-based DC has a relative deviation of 0.005 and 0.023 and the MT method has a relative deviation of 0.116 and 0.016 from the target, respectively. From the comparison of the average acceleration and deceleration, it was found that the NN-based DC is closest to the target data compared with the MT-based DC. Additionally, the values of the acceleration-related parameters of the DC developed using the NN are higher than those of the MT-based cycle, indicating that the acceleration and deceleration processes are more aggressive than the MT method.
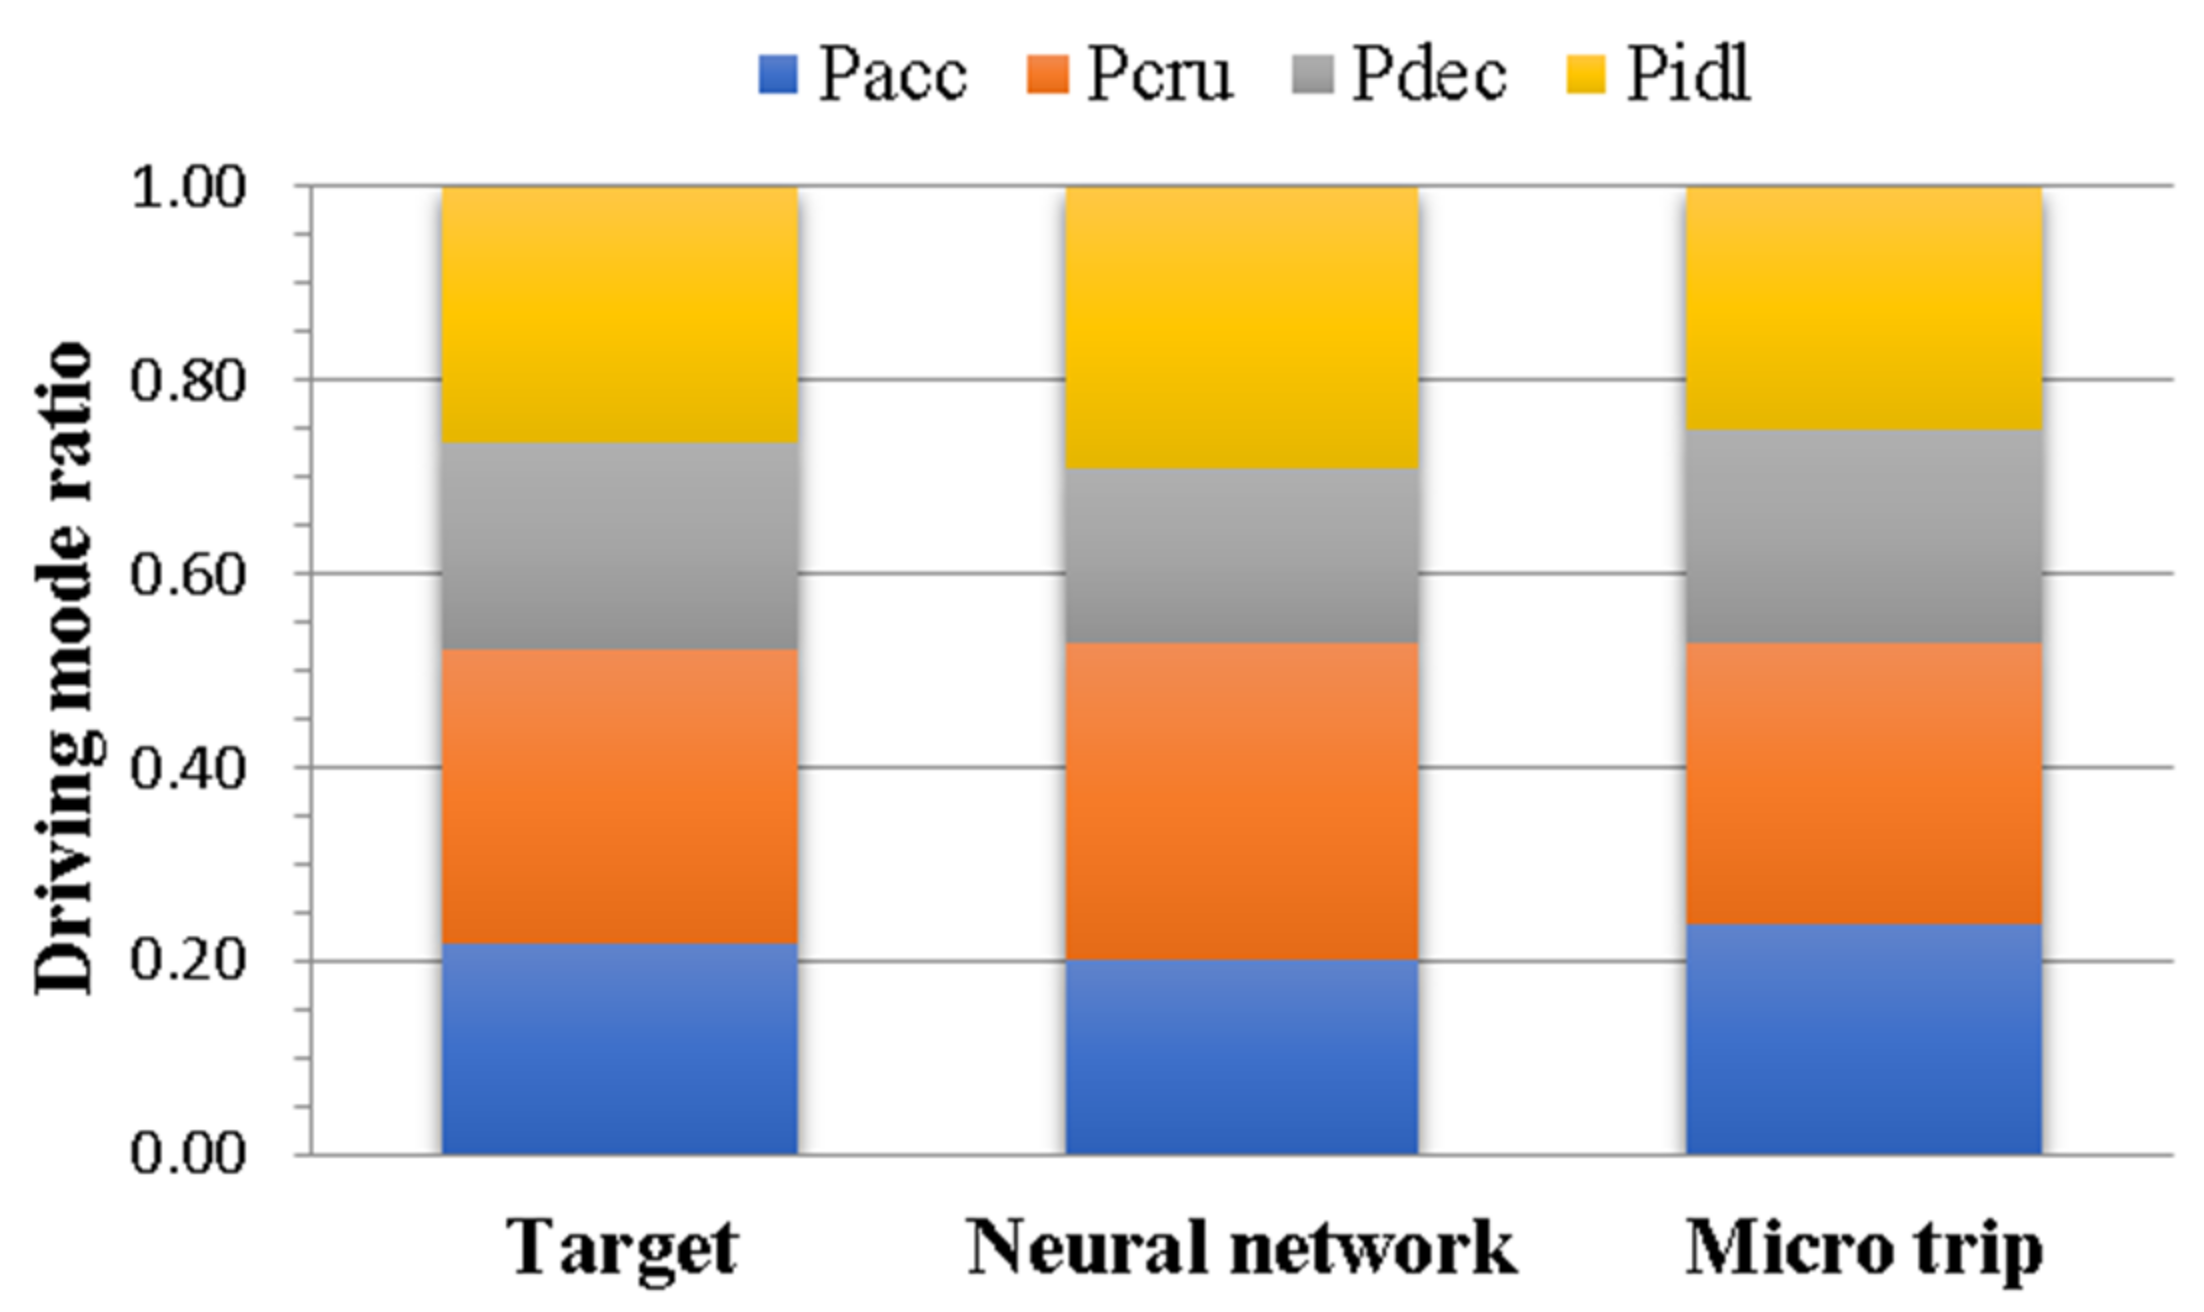
From the distribution of the driving mode ratio of the idle, acceleration, deceleration, and cruising times, the driving modes of the developed DCs are very close to the processed experimental data as shown in
Figure 22. However, the deviation of the driving modes of the MT-based cycle is smaller than that of the NN method.
The DC developed using NN prediction is closer to the results of the processed experimental data compared with the DC developed using the MT method in terms of all characteristic parameters. We also found that all CPs of the DC developed using the MT method were within the threshold except for the average deceleration (Decavg). As shown in
Table 10, the DC developed using NN prediction has smaller deviations than the DC developed using the MT method, which has a relative difference (RD) of 0.056 and 0.111, respectively. This indicates that the cycle developed using the NN improved the degree of representativeness by 5.5% compared with the MT method.
The NN prediction method proposed in this study, as the result demonstrates, considerably enhances the whole cycle’s representativeness by 5.5% and resolves the issue with the DC duration decision and the lower degree of representativeness of the MT method. The following factors contributed to the results: the trip method proposed in this study is the foundation for the determination of the DC duration, applying machine learning classification for clustering, and, after being processed, the collected driving data were used to train an NN, which then predicted the velocity of the DC. Therefore, the DC developed in this study using the NN method accurately represents the driving conditions in Addis Ababa.
Comparison of AADC with Standard DCs
Compared with existing standard DCs, the AADC has the capacity to describe actual traffic conditions on Addis Ababa’s roads most accurately. A comparison of characteristic indicators from the FTP-75, WLTC, CLTC, collected data, and final DC developed in this study (AADC) was performed (
Table 11). The results show that the method proposed in this study solved the problem of determining the DC duration. The relative difference of the AADC, WLTC, FTP-75, and CLTC was −0.056, 0.528, 0.398, and 0.344, respectively. This indicates that, compared with existing DCs in other countries, the AADC developed here better suits the actual road and traffic conditions in Addis Ababa in terms of all characteristic parameters used in this study. Additionally, the characteristic parameters of the developed AADC are closer to the data sources and are thus representative.
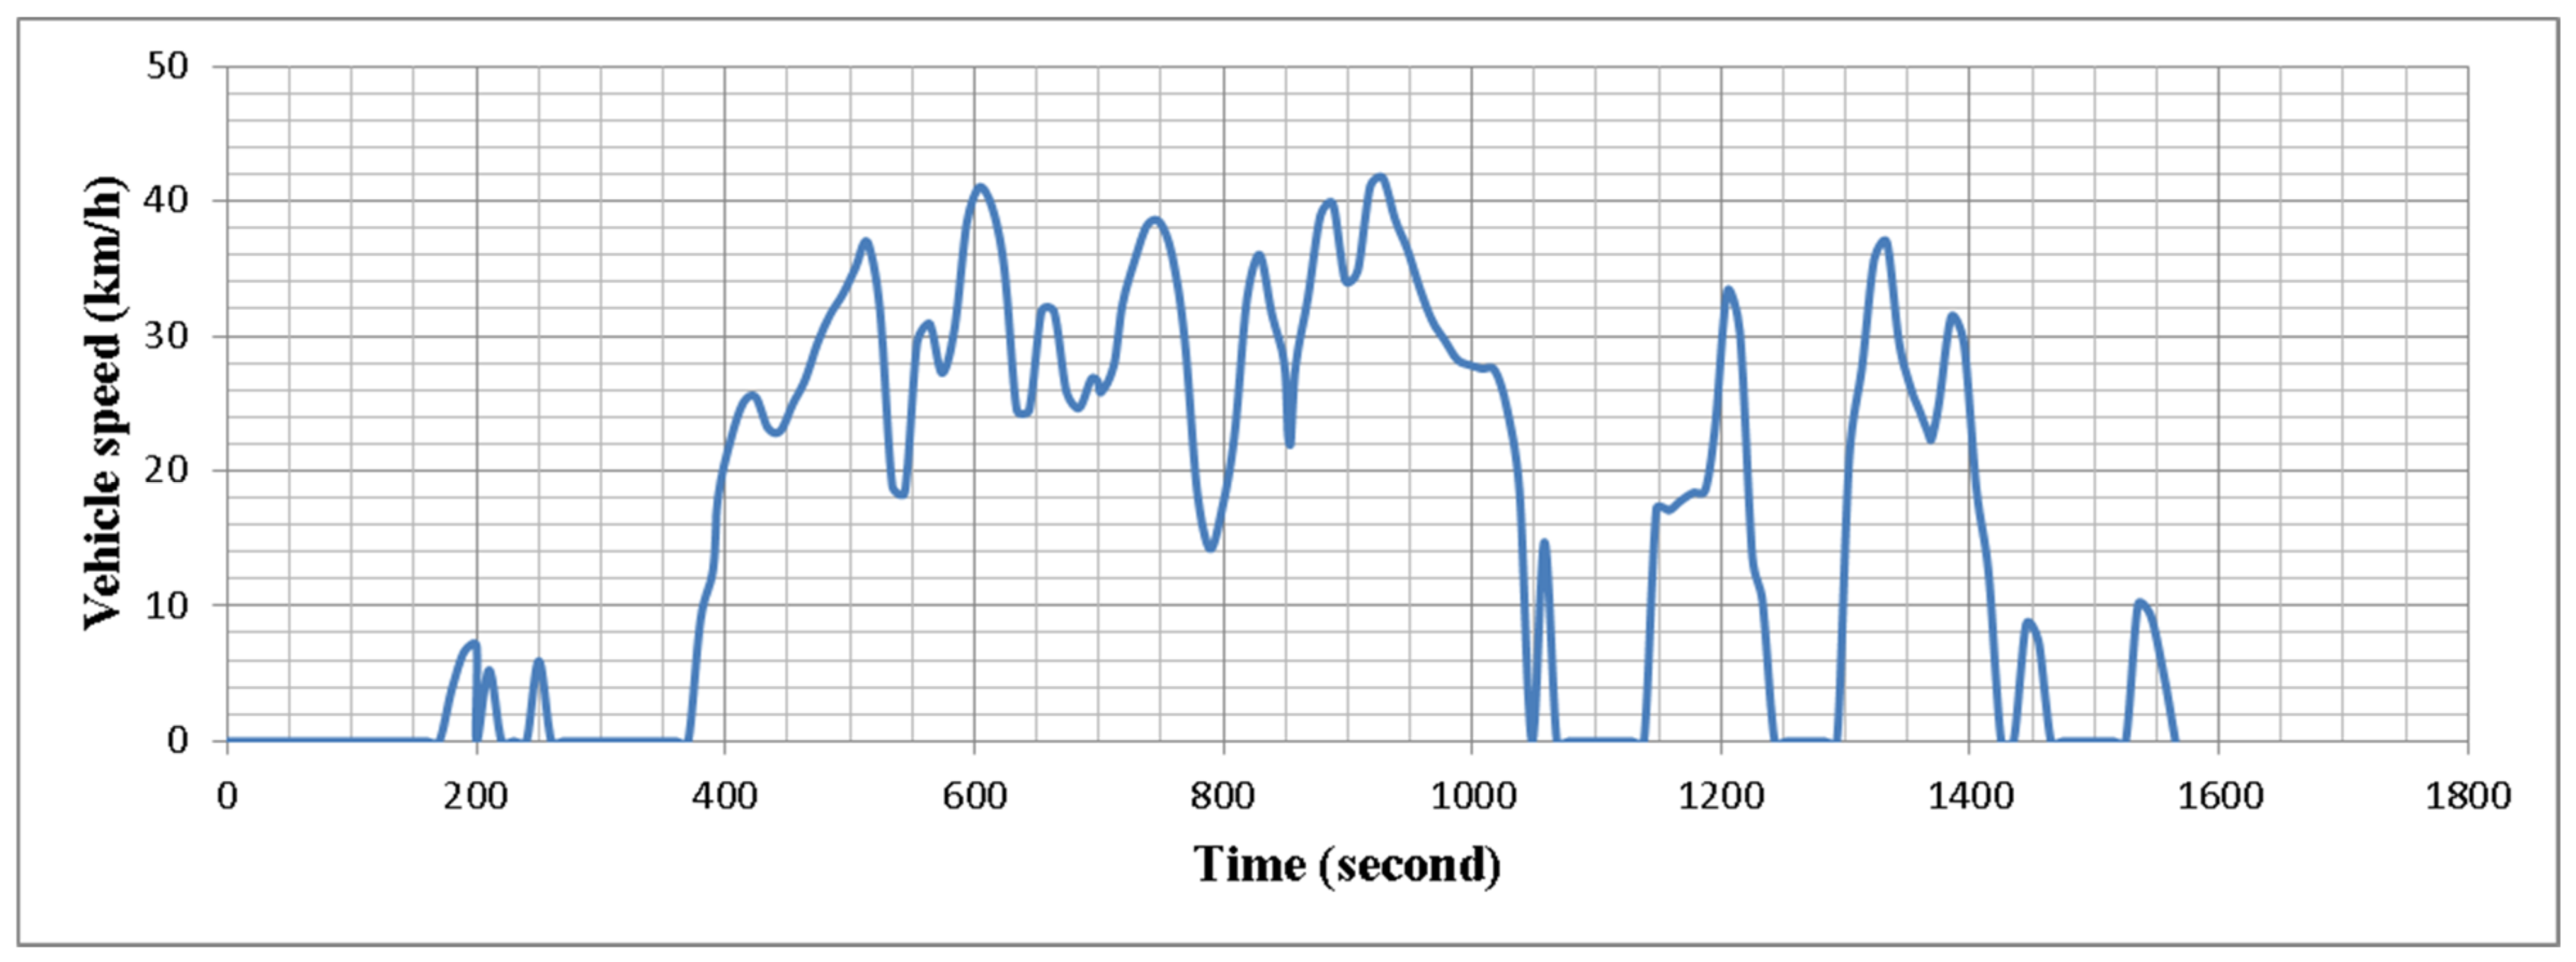
When looking at acceleration-related indicators, the driving characteristics for the AADC were quite different from those of standard DCs. The cycles developed in this study exhibited significantly higher acceleration and deceleration rates as well as much longer idling periods than standard DCs. The frequent vehicle stops and movements due to traffic congestion and closer traffic light signals revealed long idling periods in the AADC. The developed AADC has a relatively long duration (2594 s) but a shorter trip length (11.885 km) compared with the WLTC, FTP-75, and CLTC.
5. Conclusions
The analysis of real-time driving data collected from passenger vehicles in Addis Ababa using GPS devices revealed that standard DCs deviate considerably from the actual conditions, and therefore an Addis Ababa DC should be developed and used for the evaluation of vehicle emissions and fuel consumption.
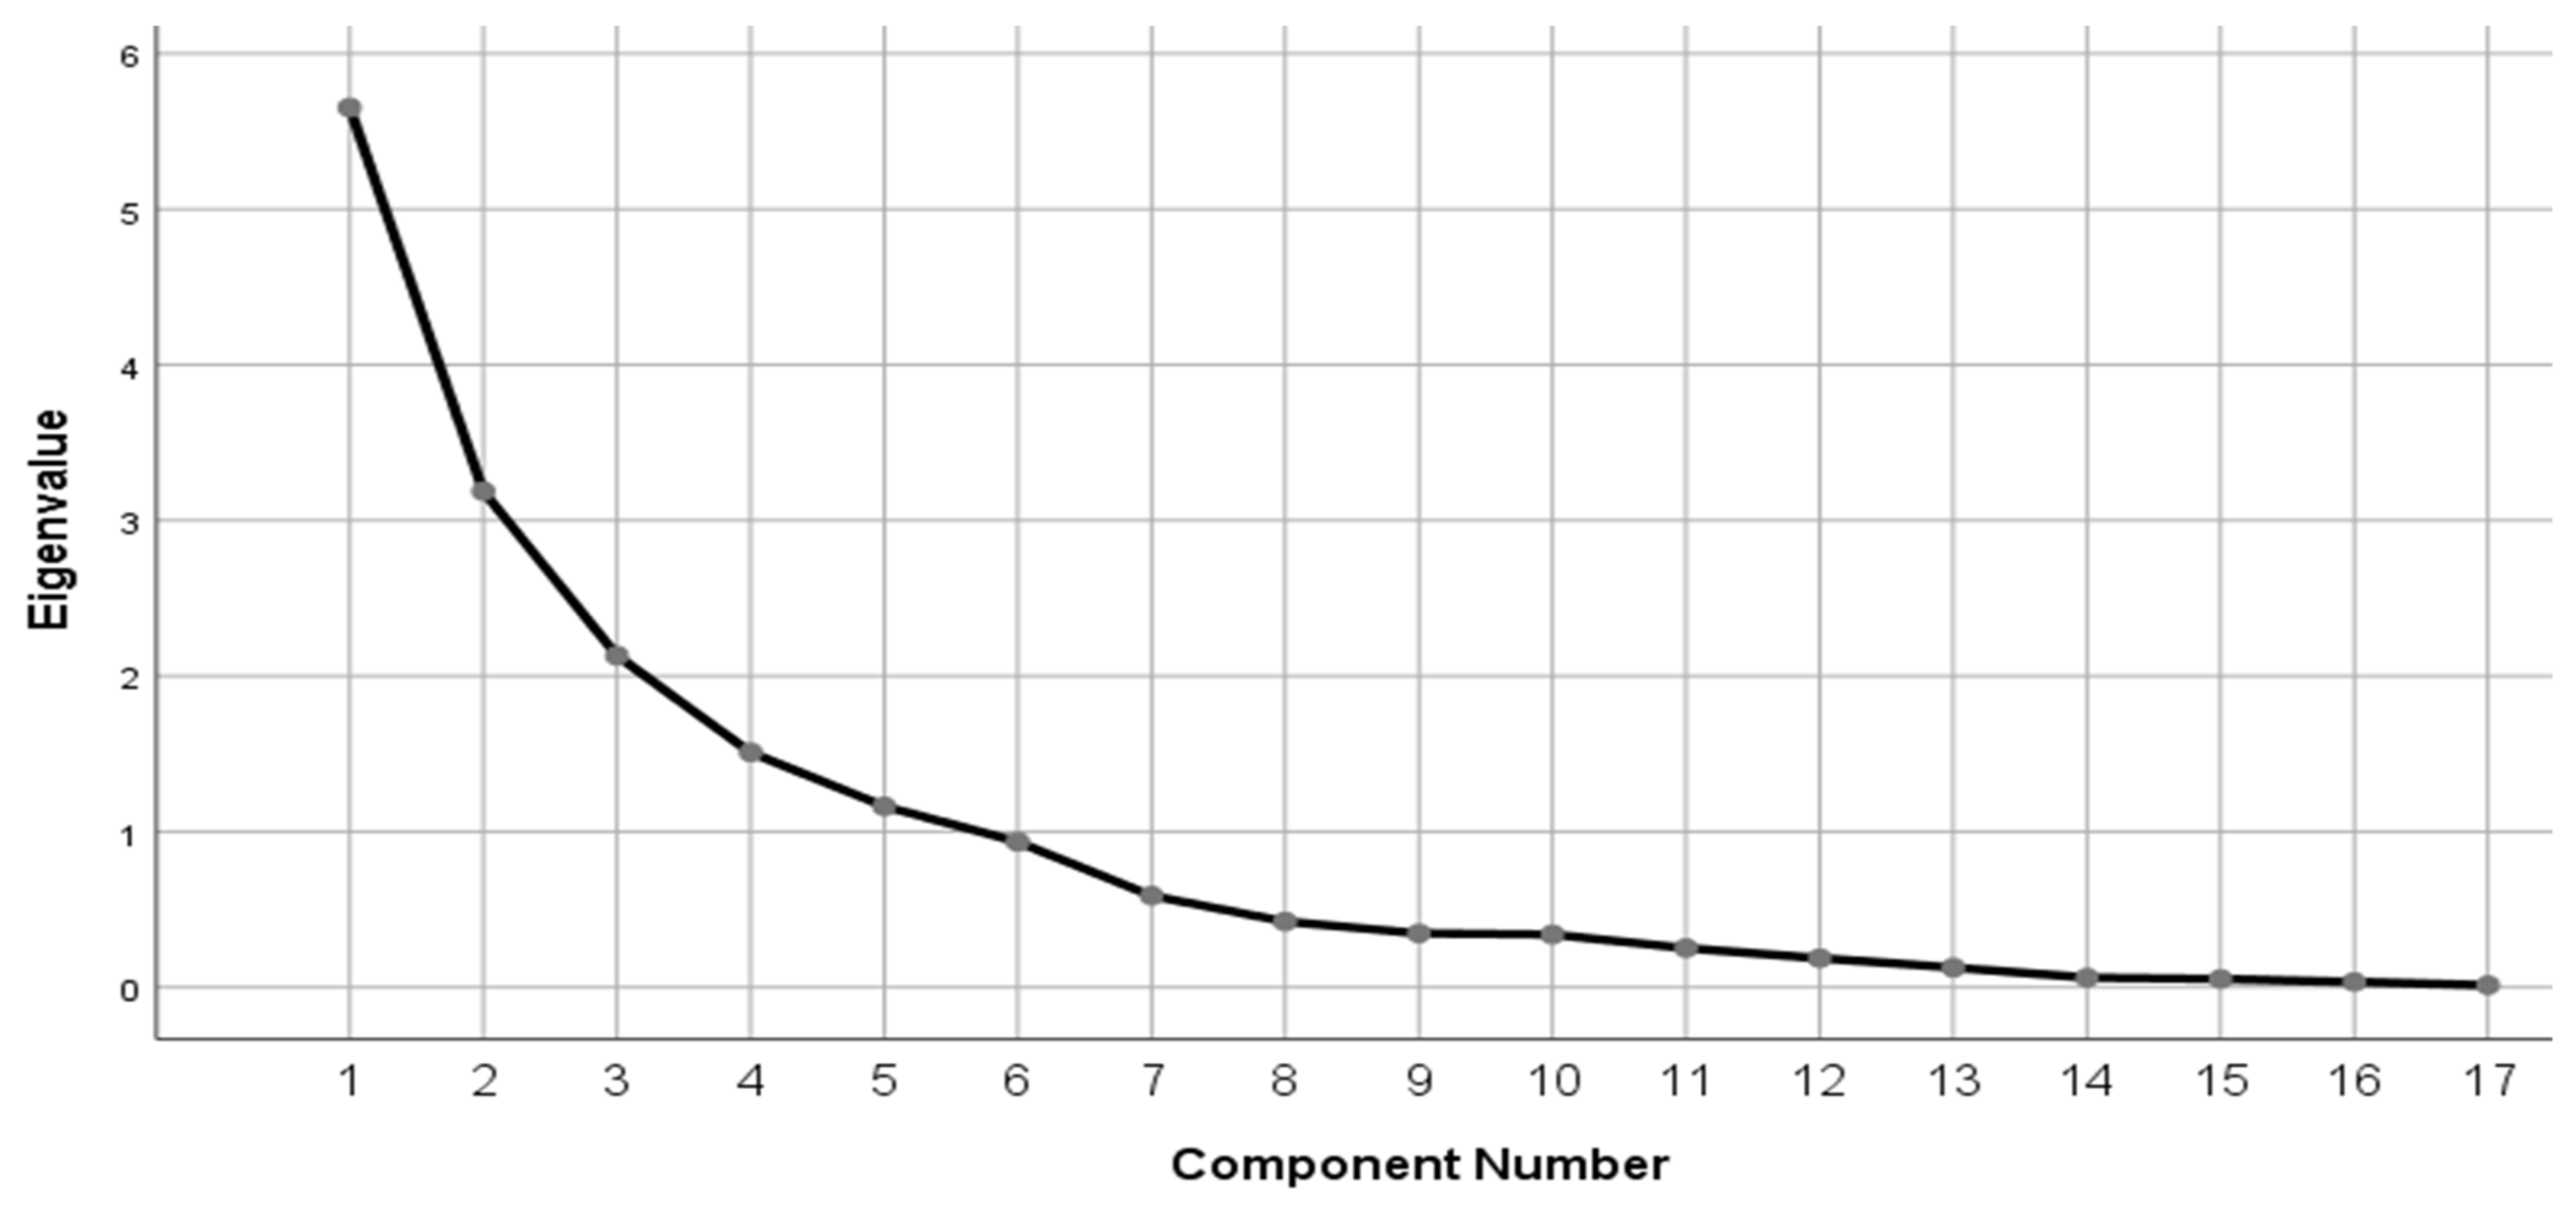
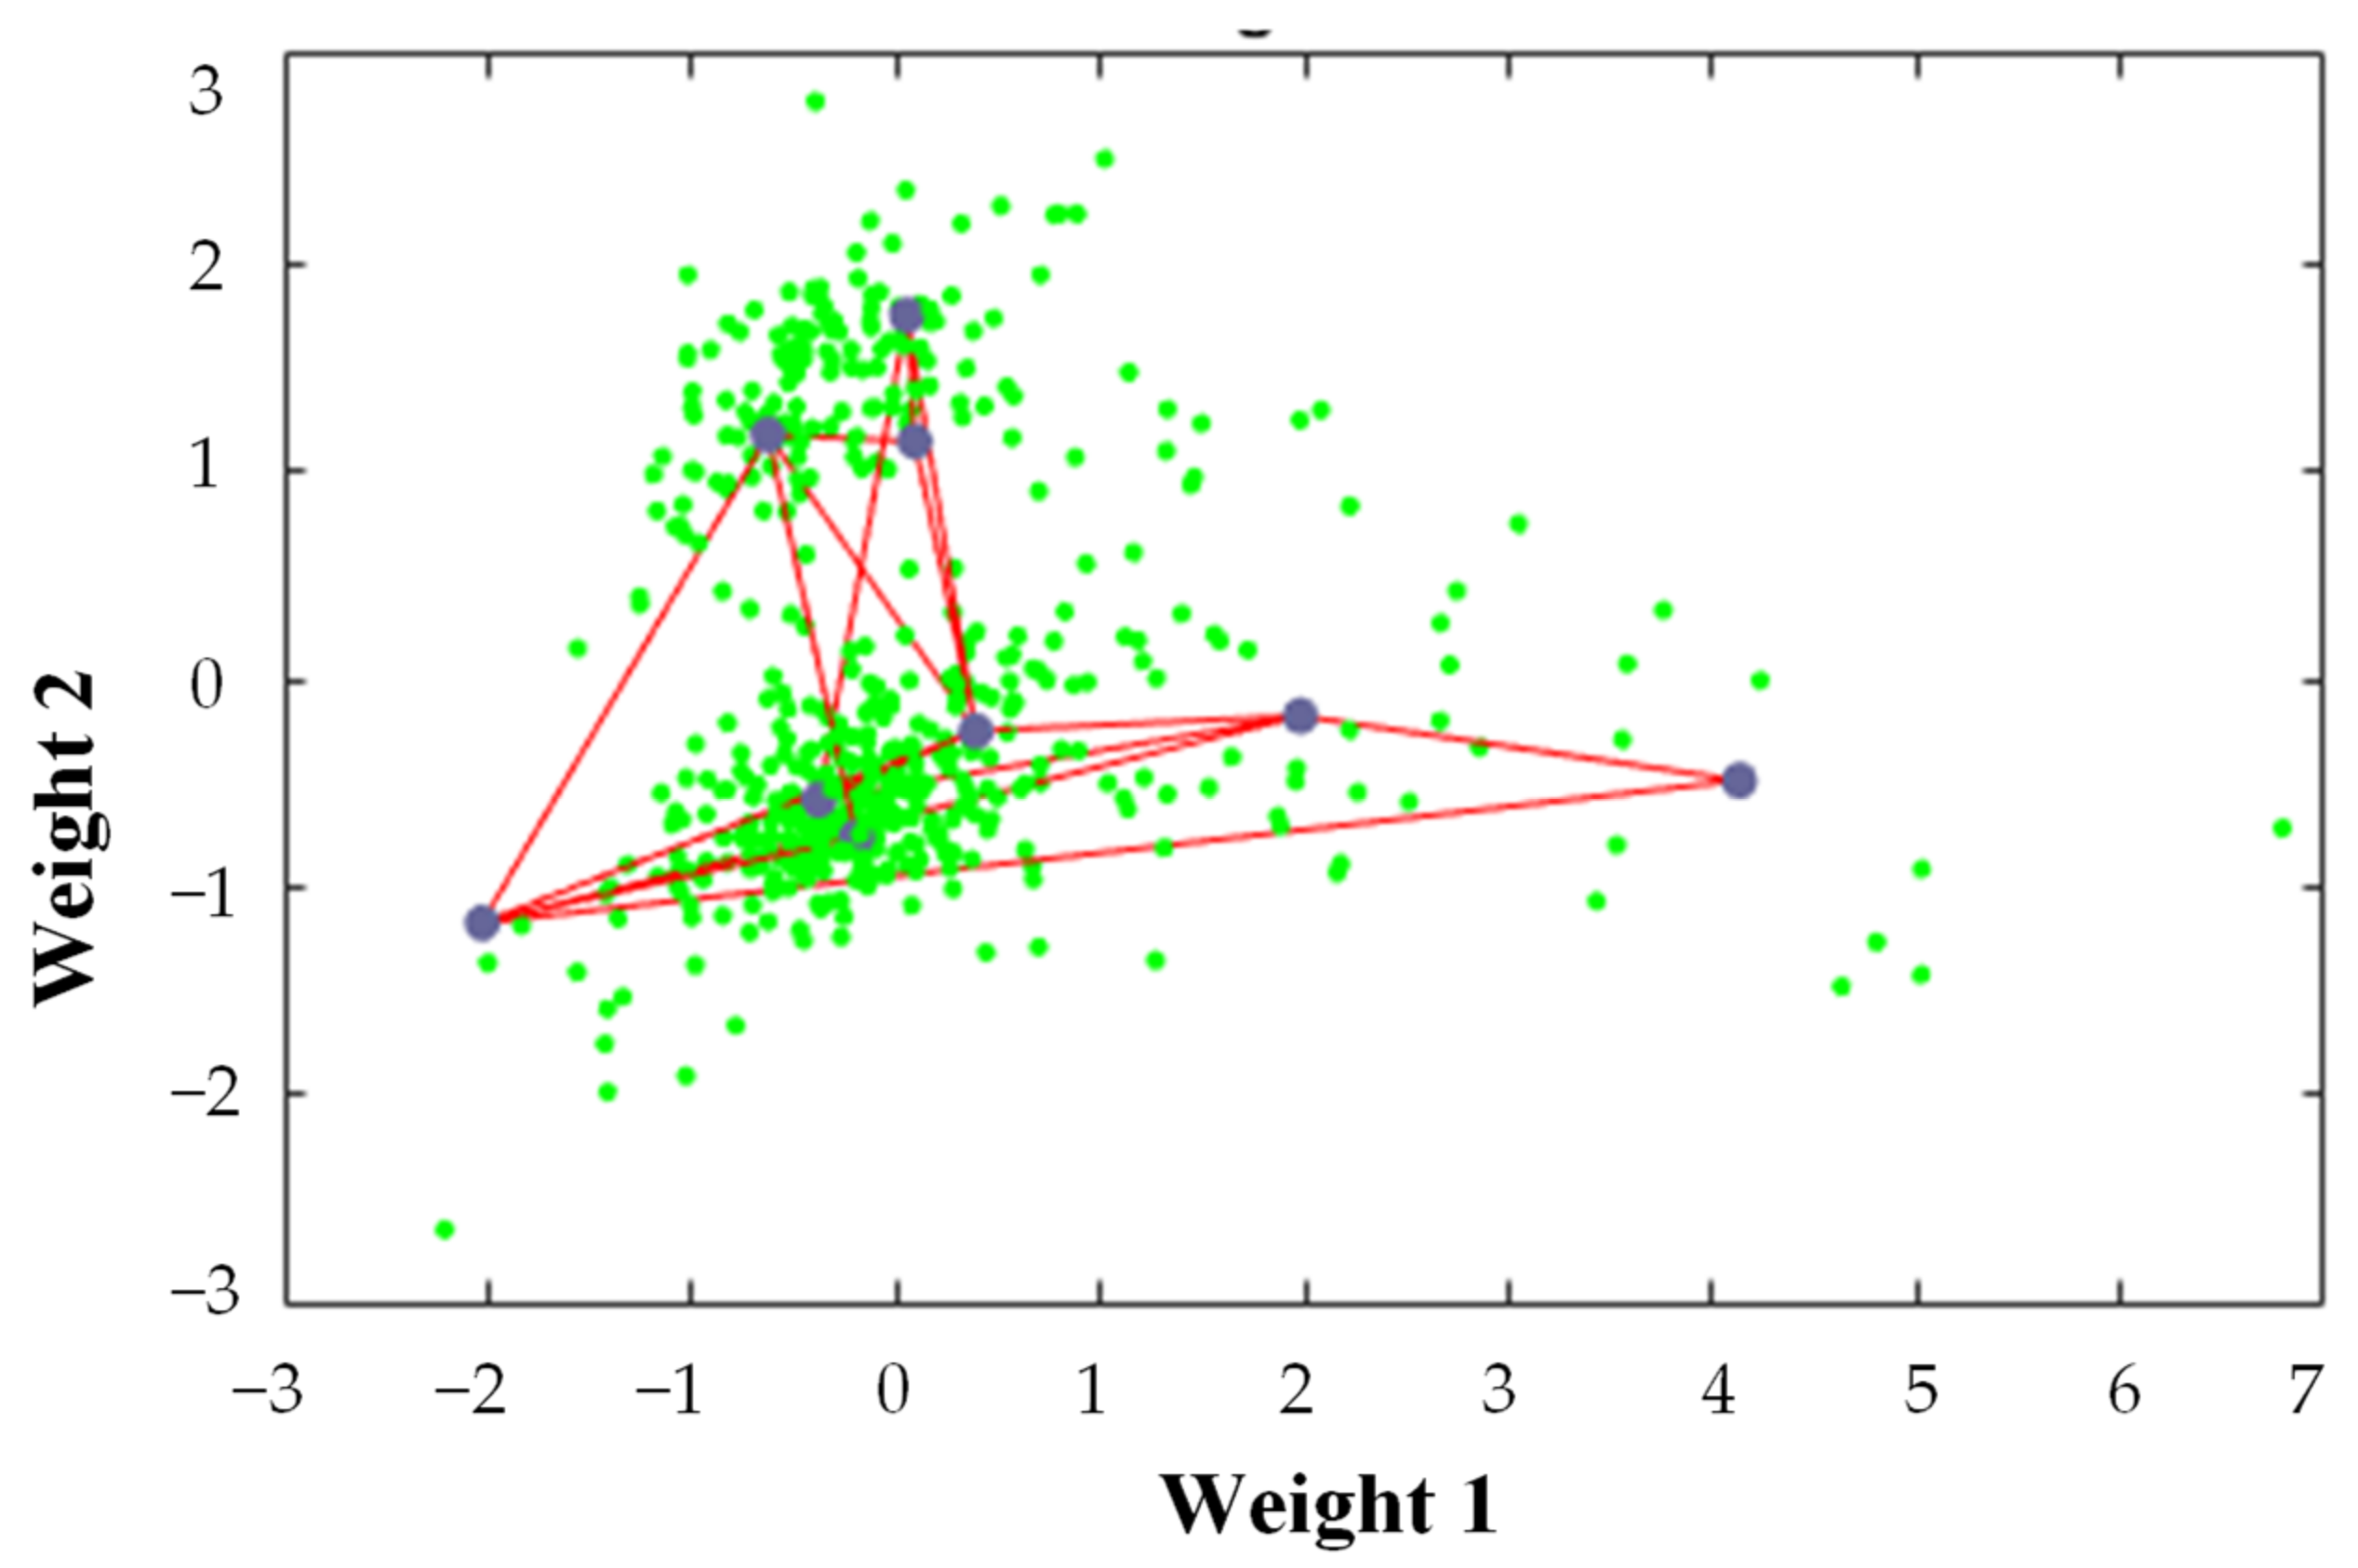
In this study, a trip-based approach combining principal component analysis and neural network prediction was proposed in order to construct a representative DC and compared with the micro trip approach to DC development in order to solve the issue of having to determine DC duration based on experience and the literature. The collected data were divided into 726 trips. Using eigenvalue decomposition, principal component analysis reduced the 17 trip indicators to five principal components. The machine classification learner results indicate that the neural network classifier had an accuracy of between 82.9% and 86.5%. The applied neural network algorithm classified 527 trips into nine clusters based on the factor scoring of each trip.
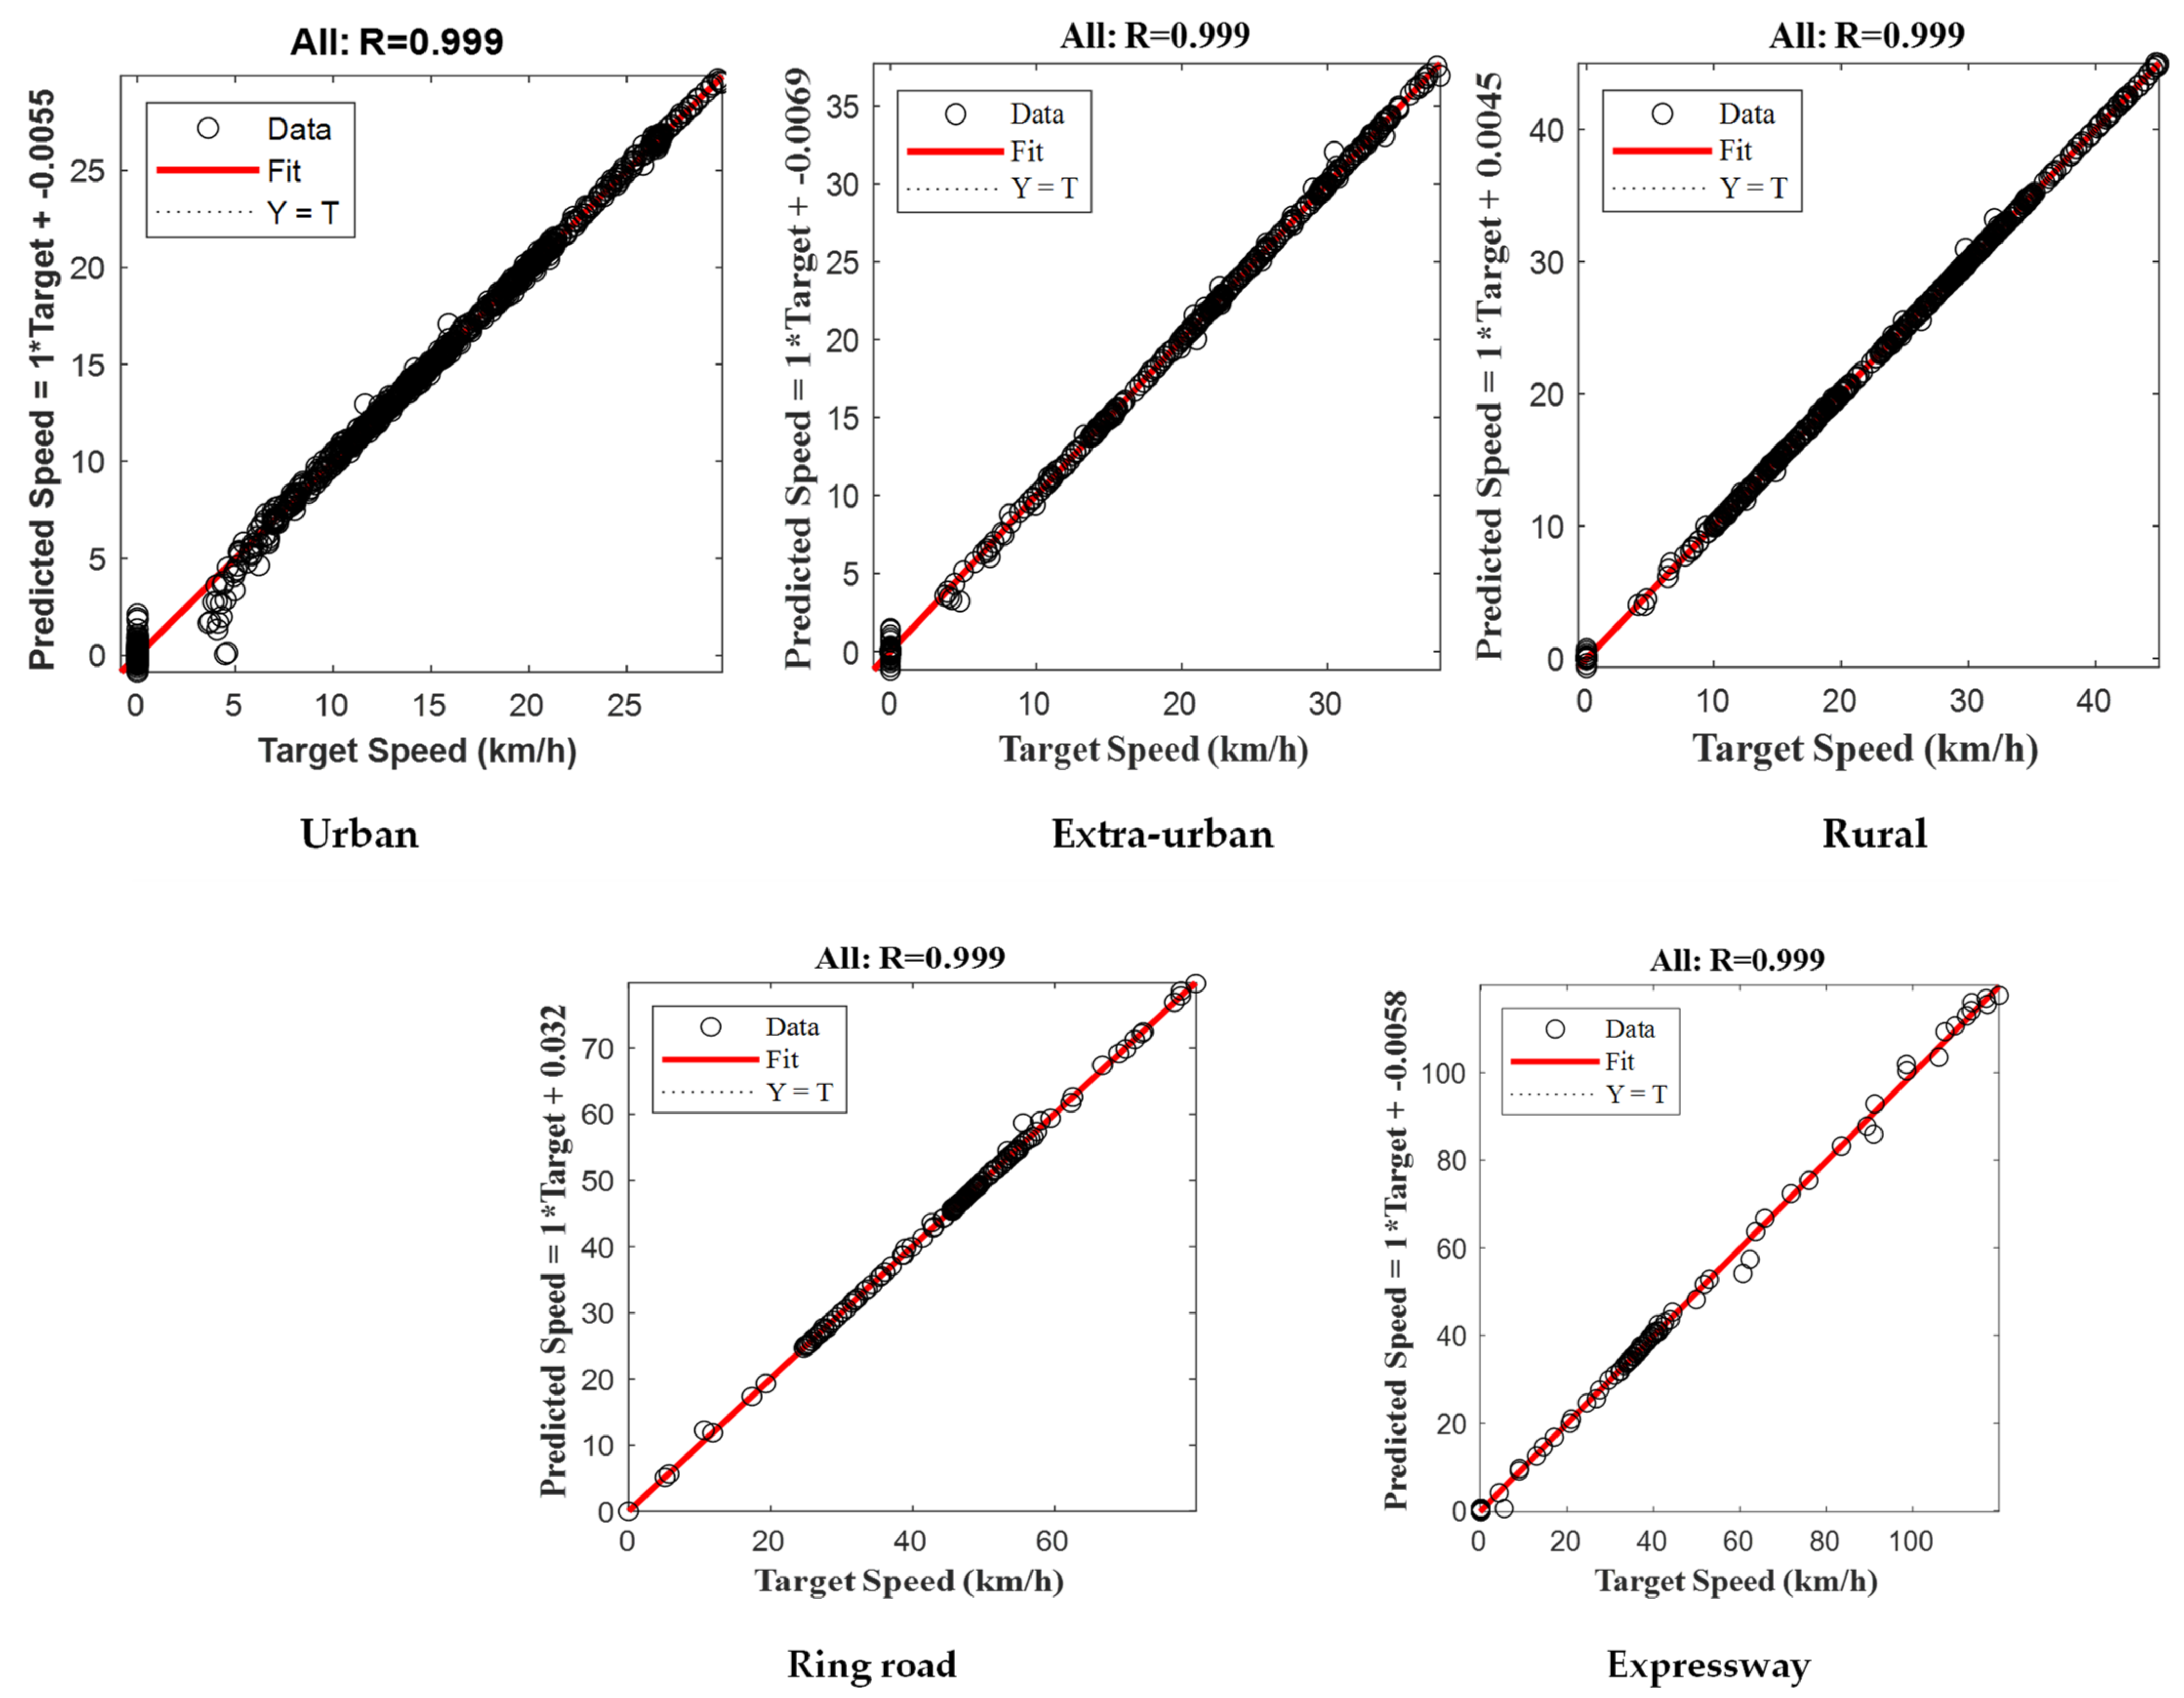
After training the neural network, the Addis Ababa DC speed was predicted with an overall R-value of 0.99, indicating the best fit between the input and target parameters. The comparative analysis of the neural network and micro trip methods with processed experimental data showed a relative difference of 0.056 and 0.111, respectively. Additionally, compared with the daily average trip length, the DC duration and distance obtained using the neural-network-based method show the smallest deviations of 0.14 and 0.13, respectively. The results of the comparison show that the DC created using the neural-network-based method more accurately represents the actual driving conditions in Addis Ababa compared with the micro trip method due to the application of the trip approach, machine learning classification, and neural-network-based speed prediction. Additionally, compared with standard DCs, it reflects the actual driving conditions more closely than WLTC, FTP-75, and CLTC. Consequently, the developed AADC can also be used for the evaluation of the emissions and fuel consumption of vehicles in Addis Ababa. We strongly suggest that the administration of Addis Ababa make the AADC the legislative driving cycle of the city. Future studies on DCs could test the proposed methodology using bulk driving data and apply weightings to trip indicators.


