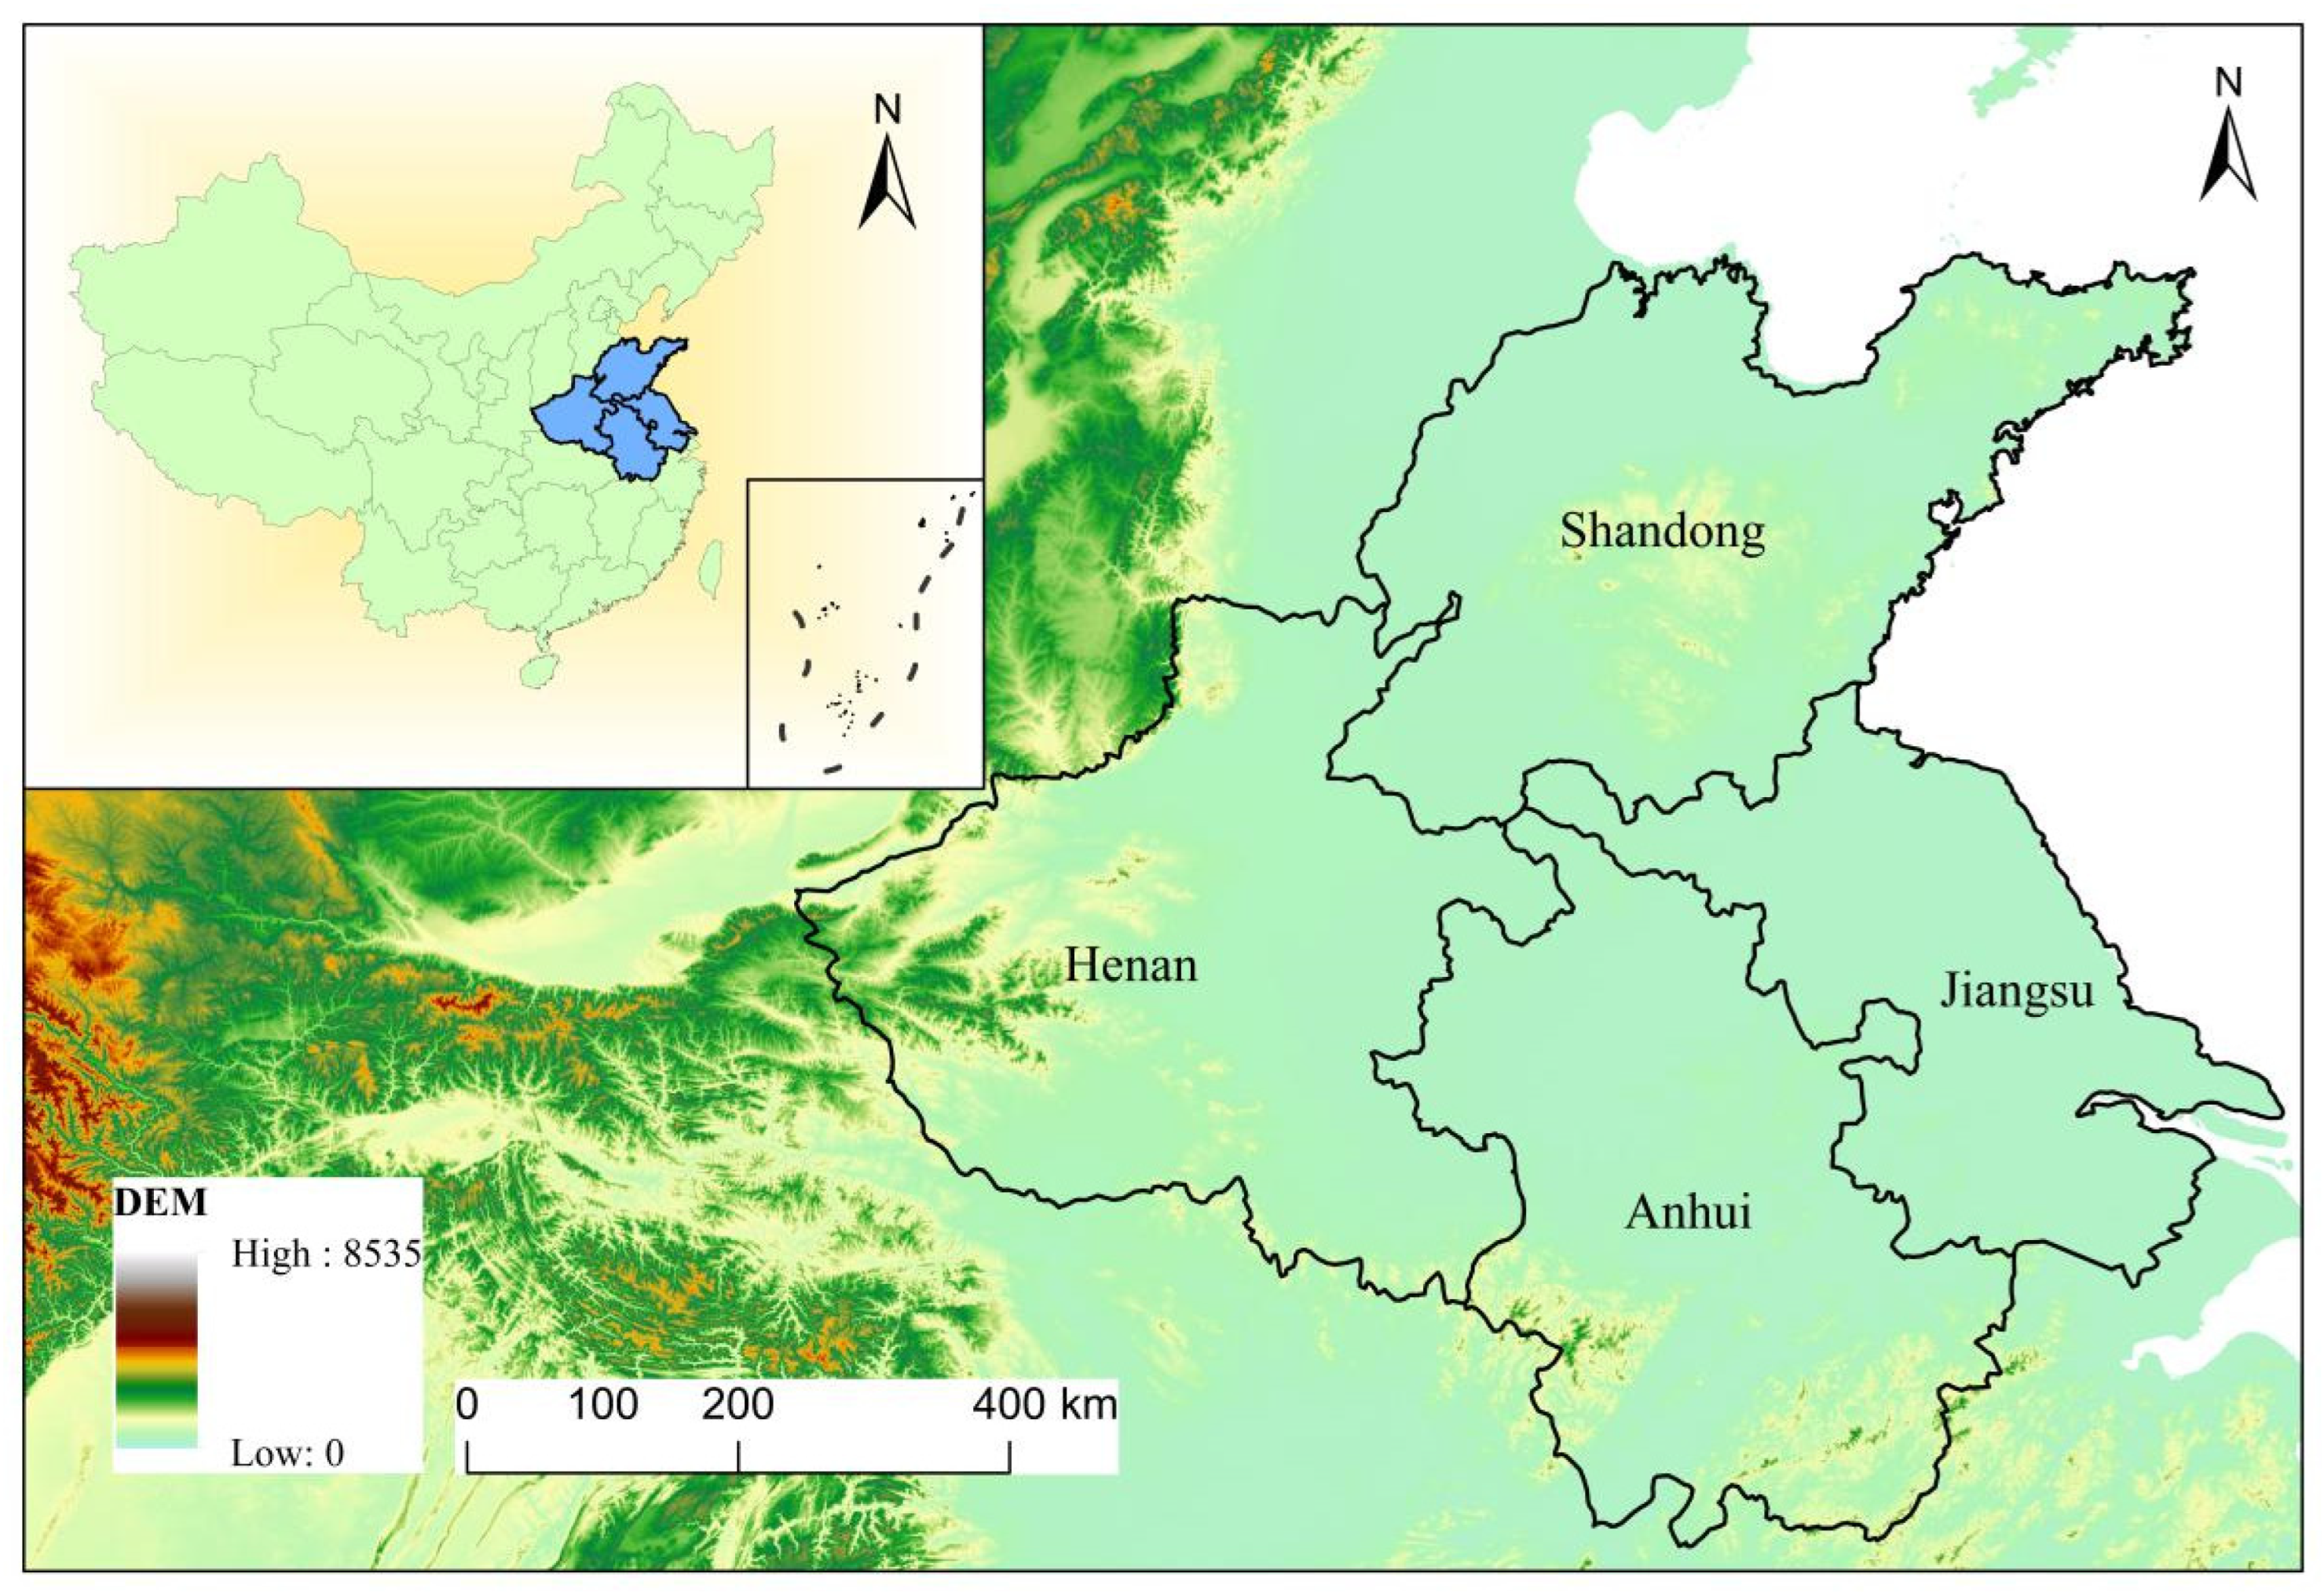
1. Introduction
In the context of global climate change, a variety of air pollutants are harmful to human health, worsen air quality, and have an impact on ecosystems; therefore, they have piqued the interest of scientists all over the world [
1,
2]. This includes extensive research on China, which, for a long period of time, has been playing the role of a producer in the global market and the production base of many developed countries, which has led to rapid economic development in China but has also caused serious environmental damage. In China, single-source air pollution, such as coal smoke and petrochemical pollution, has gradually evolved into complex air pollution. Traditional pollutants SO
2 and TSP have been well controlled, but the rapid increase in the number of motor vehicles has caused NO
X emissions to continue to rise, and regional combined air pollution characterized by absorbent aerosols (for example, carbon aerosols, dust aerosols, etc.) and O
3 is becoming increasingly severe. When these pollutants accumulate in the air and exceed the natural degradation capacity, accumulation, diffusion, transfer, and interaction occur. When they interact, they produce many other secondary pollutants, which often cause various diseases of the human body, thus endangering the survival and development of human beings. Therefore, it is very important to master the dynamics of many kinds of air pollutants in a large area. The observation methods used for air pollutants mainly include satellite remote-sensing and ground-based observations. Ground monitoring features high-accuracy features and the simultaneous obtainment of multiple atmospheric environmental parameters; however, ground-site monitoring is sparsely distributed and expensive to perform [
3]. Such defects can be avoided in satellite remote-sensing observations [
4,
5]. Thanks to the free availability of satellite monitoring data in many countries, researchers can obtain data for analysis at a very low cost, and low-cost sensors can enable the high-density monitoring of air pollutants; the data obtained from large-scale monitoring over long time scales can be used to complement traditional pollution monitoring, improve exposure estimates, and raise community awareness of air pollution [
6].
During the use of satellite monitoring data, many scholars have studied the change process of a single air pollutant. A study of atmospheric NO
X in India conducted from 2007 to 2018 determined that Indian NO
X gradually increased from 2007 to 2016, and only began to stabilize and slowly decrease in 2017. Additionally, NO
X has a strong seasonal cycle, peaking in the summer [
7]. Curier et al. [
8] examined European NO
X emission trends using OMI NO
2 tropospheric vertical column density data and the LOTOS-EUROS model. This evaluation provides a scientific evaluation algorithm. In the study of SO
2 in the Sichuan-Chongqing region of China, it was observed that the distribution of SO
2 in the region was also uneven, showing the characteristics of high pollution levels in the southeast and low pollution levels in the west, the overall fluctuation was minor, the stability was good, and the seasonal cycle was obvious: it was high in winter and low in summer. The distribution of SO
2 was closely related to PM2.5 [
9]. Kang et al. [
10] used satellite data to study the temporal and spatial distribution characteristics and variation trends of SO
2 in the global atmospheric boundary layer from 2005 to 2017. Duan et al. [
11] investigated absorption aerosols in three northeastern provinces. The present study used the Hurst exponent analysis to explore and categorize the sustainability of future absorbing aerosols. In addition, the black carbon aerosols in the Chengdu region were studied, and the results show that different, seasonal air-quality sources produce different effects; however, this effect mainly occurs in the vicinity of Chengdu and the eastern region of Chongqing [
12]. O
3 is a type of secondary pollutant that is primarily formed by the complex photochemical reaction of NO
X, CO, and VOCs in the presence of solar ultraviolet irradiation, and it is the main component of greenhouse gases and photochemical smog [
13]. There are also many studies on monitoring O
3 using satellite data, for example, Yu Ruilian et al. summarized the formation mechanisms of atmospheric O
3, the spatiotemporal distribution characteristics of atmospheric O
3 in some areas of China, the relationship between atmospheric O
3 and its precursors, and the main factors affecting the concentration of atmospheric O
3 [
14]. L Chen et al., using the total O
3 column data obtained from the European Center for Medium-Term Weather Forecast, analyzed the spatial and temporal distributions of the total O
3 column in the northwest Pacific by analyzing the spatial and temporal fields of the total O
3 column in the region, and the following conclusions were obtained. The low latitudes were the regions with the lowest total O
3 column, the zonal distribution was obvious, and the total O
3 column increased with the increase in latitude toward the Arctic [
15]. Additionally, by using the reanalysis data of the ECMWF, the variation trend of O
3 in the Northern Hemisphere in the last 33 years was studied. Studies have shown that the total O
3 in four key regions in the Northern Hemisphere (Arctic, East Asia, and north and western Europe) showed a decreasing trend from 1979 to 2011, and that since 1993 and 1994, the total O
3 in winter in the four key regions in the Northern Hemisphere presents a significant upward trend, with the greatest upward trend visible in the Arctic region [
16]. In the current paper, the progress of VOC monitoring is systematically introduced, and the main methods of VOC monitoring and evaluation are discussed from the aspects of monitoring and analysis methods, chemical-reaction activity, and health risk assessment. The characteristics of VOC concentration and source distribution in the areas where VOC research was conducted at home and abroad are compared and summarized [
17].
It can be observed that many scholars have made use of satellite remote-sensing data to analyze different pollutants in different regions. Since the use of satellite data can analyze the changing process of atmospheric pollutants on larger and during longer time scales, although in a manner slightly less accurate than ground-based-site monitoring, the human, material, and financial costs are significantly reduced, including in the study of large areas of air pollution, using satellite remote-sensing and ground station data. Many people have studied the process of change between single air pollutants and two or three air pollutants, but with the O3 pollution problem becoming increasingly more serious since air pollution control no longer focuses on a single pollutant, it is necessary to study the relationship between O3 and other common pollutants using long time-scale data.
The main point of the present paper is to study the spatial correlations between different pollutants and O
3 and to show whether this kind of pollutant is related to the change in and generation of O
3 through the correlation to assess the region in the multi-pollutant coordinated governance of key control indicators. Secondly, as an important air pollutant, HCHO is considered to be carcinogenic and genotoxic to living organisms and an important precursor of O
3 production in the environment; therefore, the human body as well as the ecological environment is exposed to non-negligible harm. In recent years, the research conducted on the concentration of HCHO in the atmosphere has decreased, and many scholars have focused on the detection and analysis of indoor HCHO [
18]. Simultaneously, the temporal and spatial variations of atmospheric HCHO are analyzed by using remote-sensing data.
Finally, the research area presented in this paper is the newly designated key area of air pollution control in China, and it is also an important economic area in China, where both heavy and light industries are well developed. This area demonstrates obvious characteristics of regional air compound pollution, which limits the sustainable development of regional social economy in the future, causing harm to public health. However, previous studies have done little to analyze the region’s atmospheric environment. As a result, the region must conduct an air pollution analysis [
19,
20].
We are inspired to work on this research primarily based on the government’s attention to the study area and the necessity for environmentally sustainable development. This paper has clearly demonstrated which pollutants might be decreased by industrial transformation and other alternative activities, as well as in which regions it is required to restrict emissions of associated pollutants during a specific season to minimize air pollution, supplementing the studies on air pollution in this area and also offering some theoretical foundation for developing air pollution control measurements.
The paper is organized as follows: the “Research Area” section describes the research area’s geographical location, natural conditions, economic development, etc.; the “Data and methods” section provides the research methods and formulas utilized in this study; the ”Results and Discussion” section presents the findings of our study and discusses the complexity of the influencing factors of air pollution in the area and the association between diverse pollutants. Conclusions are given in the “Conclusions” section.
4. Results and Discussion
4.1. Multi-Pollutant Time Change
Figure 2 is a line graph of monthly changes using the remote sensing data of five pollutants from January 2011 to November 2020. The blue solid line is the overall change trend line of the pollutant, the equation is the trend line equation, the blue broken line is the average value, the red broken line is the maximum value, and the green broken line is the minimum value. NO
2 has a relatively obvious change cycle. It reaches the highest value from December to January of the following year, then starts to decline, and reaches the lowest value in July each year. Some months will appear higher than the previous month or the next month. The overall change shows a downward trend year by year. SO
2 had no discernible change cycle before January 2016, and the maximum fluctuation range was large. After 2016, the change cycle became stable and the maximum value and the gap between the minimum value and the average value also began to decline around January each year. The highest value is achieved and the lowest value is reached in July. Absorptive aerosols (UVAI) had an understandable change cycle, reaching the highest value in January each year and reaching the lowest value in July each year, and the overall change trend was not obvious. The change cycle of O
3 is stable, reaching the highest value between March and April every year, and reaching the lowest value between November and December every year, appearing in a slight downward trend as a whole. The change cycle of HCHO is likewise relatively stable. Synthesizing the temporal change process of five different pollutants, the different high and low values in different periods are mainly related to local temperature, illumination, energy consumption, etc. From July to March of the following year, the temperature gradually decreases. The fuel required for heating has greatly increased, resulting in intensified emissions of NO
2, SO
2 and UVAI in the region. From March to August, the temperature gradually increased, the solar radiation increased, the rainfall increased, the vegetation coverage increased, and HCHO and O
3 emissions intensified.
4.2. Spatial Distribution of Multi Pollutants
Figure 3 displays the geographic distribution of the four pollutants in the study area.
When the annual average distribution of HCHO changed, the high-value areas were primarily concentrated in the northern Shandong province and the border area between Shandong and Henan province. These two high-value areas served as the center of the distribution, which gradually decreased to the surrounding areas. Eastern Henan, northern Anhui, and a tiny portion of western Jiangsu were all included in the sub-high value area. The research area’s HCHO concentration was at its lowest during the winter, and it was at its highest during the summer (June, July, and August). The distribution law of North High and South Low is shown.
The study area’s northern Shandong province was home to the majority of the high-value areas in the fluctuation of the yearly average distribution of NO2. Overall, there was a tendency for values to be higher in the north and lower in the south; the low-value area is primarily found in the southwest of the provinces of Anhui and Henan, with values rising from the southwest to the northeast. Winter (December, January, and February) north of the study area had the highest concentrations of NO2, whereas summer and the southwest of the research area had the lowest concentrations.
The low-value area was in the south and gradually shrank from north to south in the mean annual distribution change of UVAI. The high-value area was concentrated in the north. We can see that UVAI is more seasonal and extreme than the other three air pollutants, with the lowest values in summer covering the entire study area and the highest values in winter covering the entire study area. Autumn and spring show the main trend of high north and low south. Liaocheng was the main area, and the west of Shandong province was the main high-value area.
The annual distribution of SO2 was more symmetrical, with Liaocheng having the highest value and Anhui and Liaocheng provinces having the lowest value. Winter had the highest SO2 column concentration among the four seasons. Winter was followed by autumn (September, October, and November), while spring and summer were comparable. In all four seasons, the north had a high SO2 column concentration whereas the south had a low one.
4.3. A Comparison of the Evolution of Various Contaminants before and after COVID-19’s Onset
After the outbreak, many countries and regions have adopted a series of policies and regulations to limit the spread of the virus, including implementing strict quarantines, prohibiting large-scale private and public gatherings, restricting private and public transportation, encouraging social distancing, implementing curfews, and even block the entire city. Locking down cities can greatly improve environmental quality, and the more industrialized cities have more significant air quality improvements during the blockade [
30].
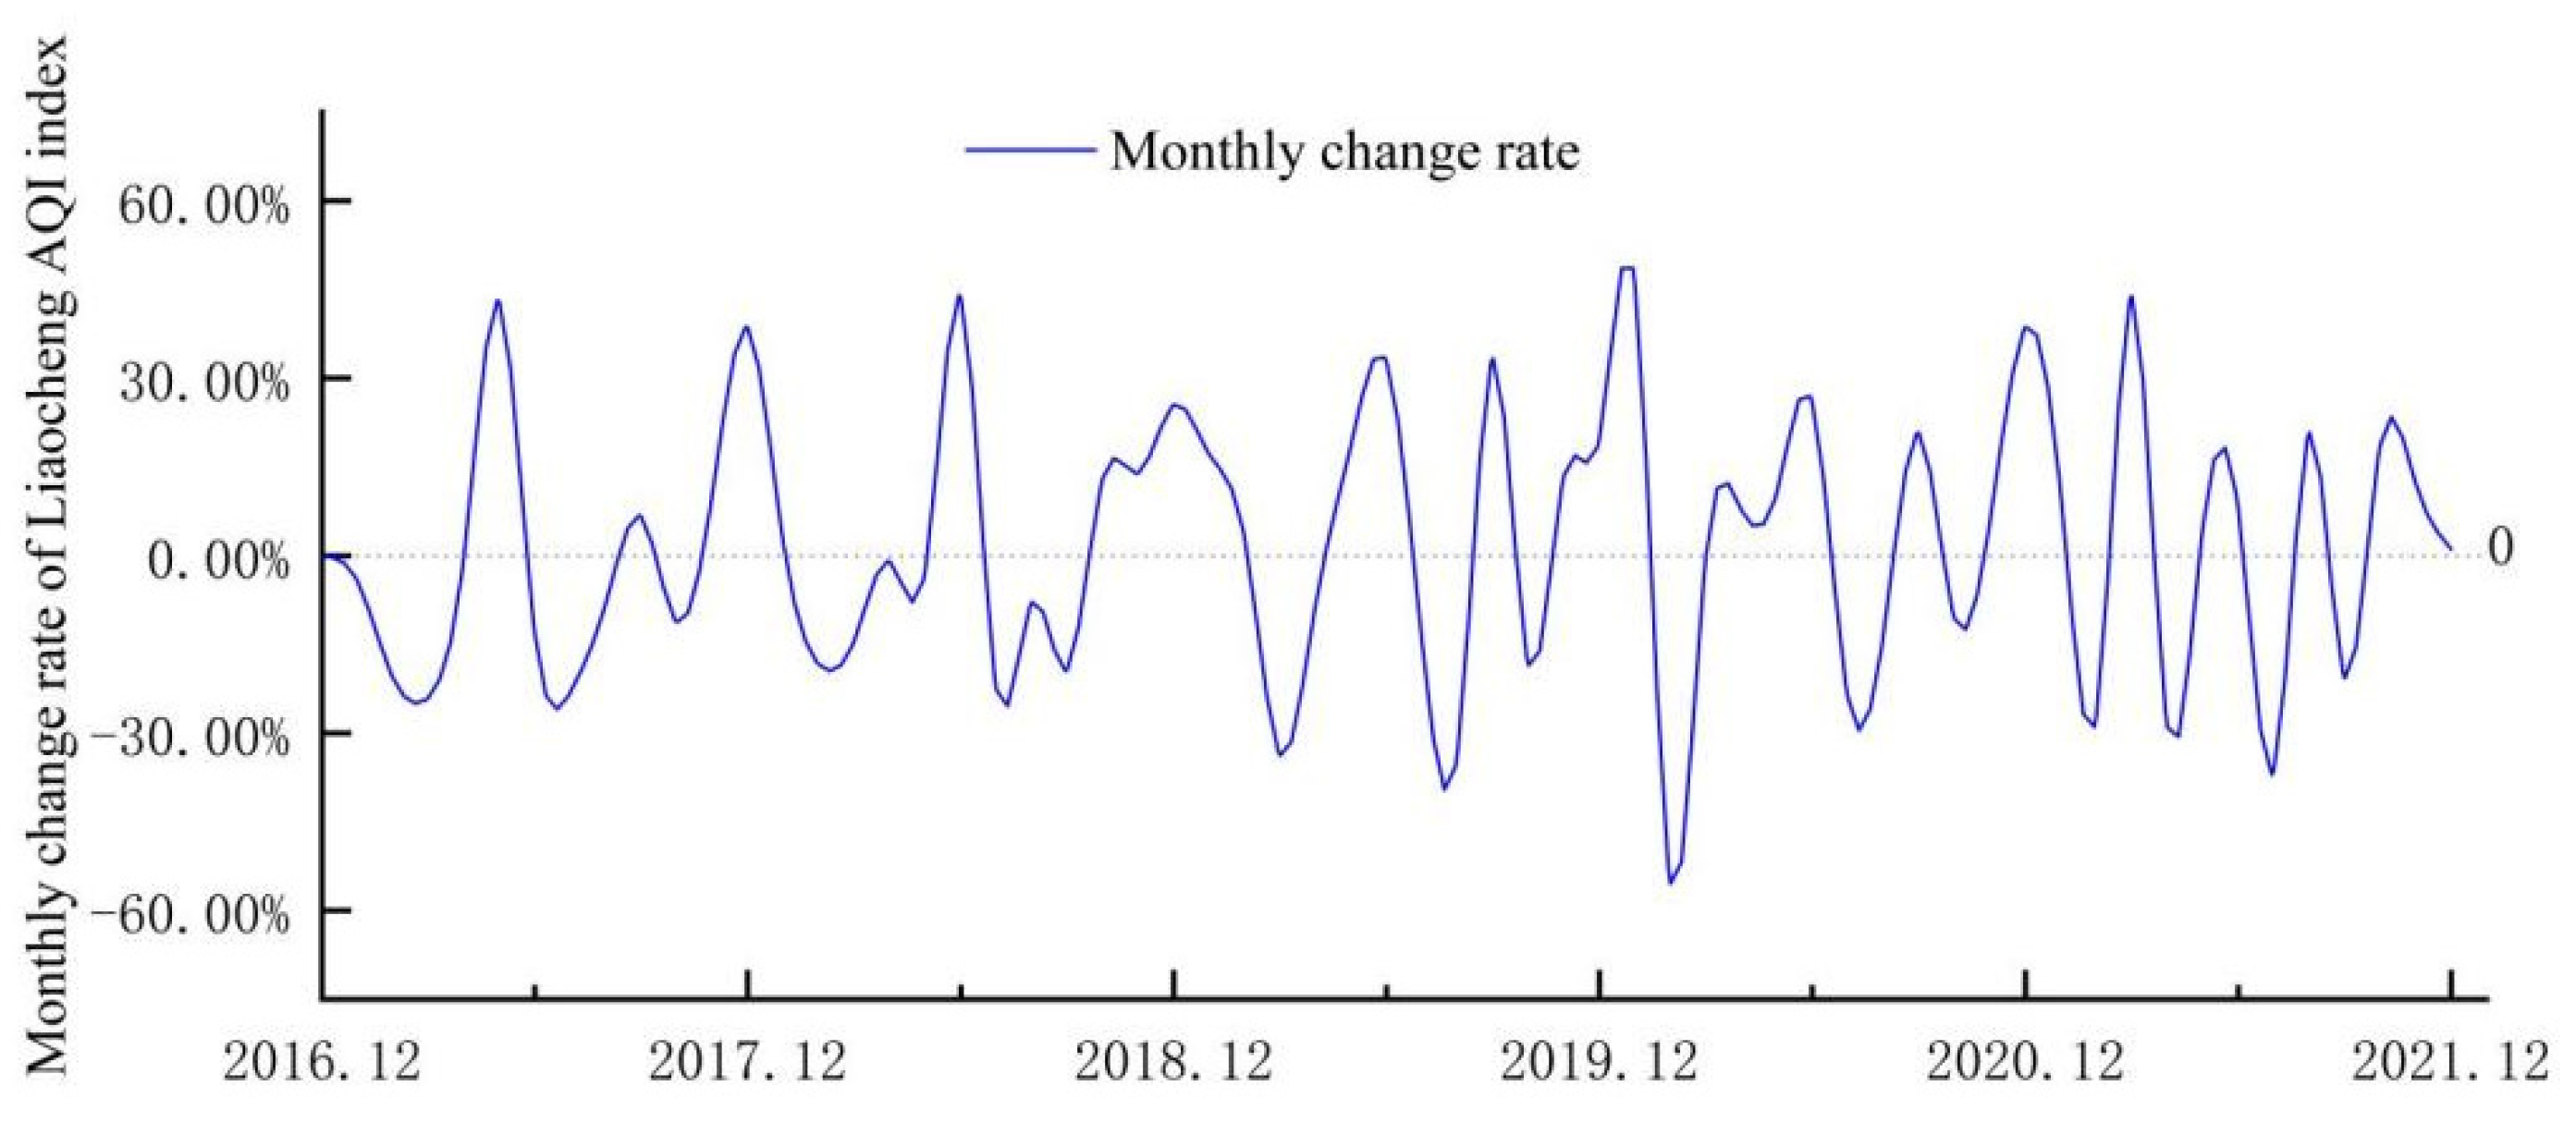
First, assess the impact of the epidemic on the emission of air pollutants. Taking Liaocheng, a key air pollution city in the study area, as an example, the Liaocheng atmospheric AQI (Air Quality Index) index is used to analyze the increase or decrease rate of AQI before and after the epidemic. Make a distinction chart of the monthly change rate of the Liaocheng AQI index from January 2017 to December 2021(
Figure 4). The maximum decline rate occurred in March 2020, reaching −55.43%, which was the month with the largest decline since 2017. This decline far exceeded the decline from February to March in previous years. It originated from the shutdown of local public enterprises and production during the epidemic, and the residents managed at home. It can be shown that the epidemic has indeed brought a positive impact on regional air quality. Therefore, we continue to analyze the overall changes of various pollutants in the study area in 2020 compared to 2019.
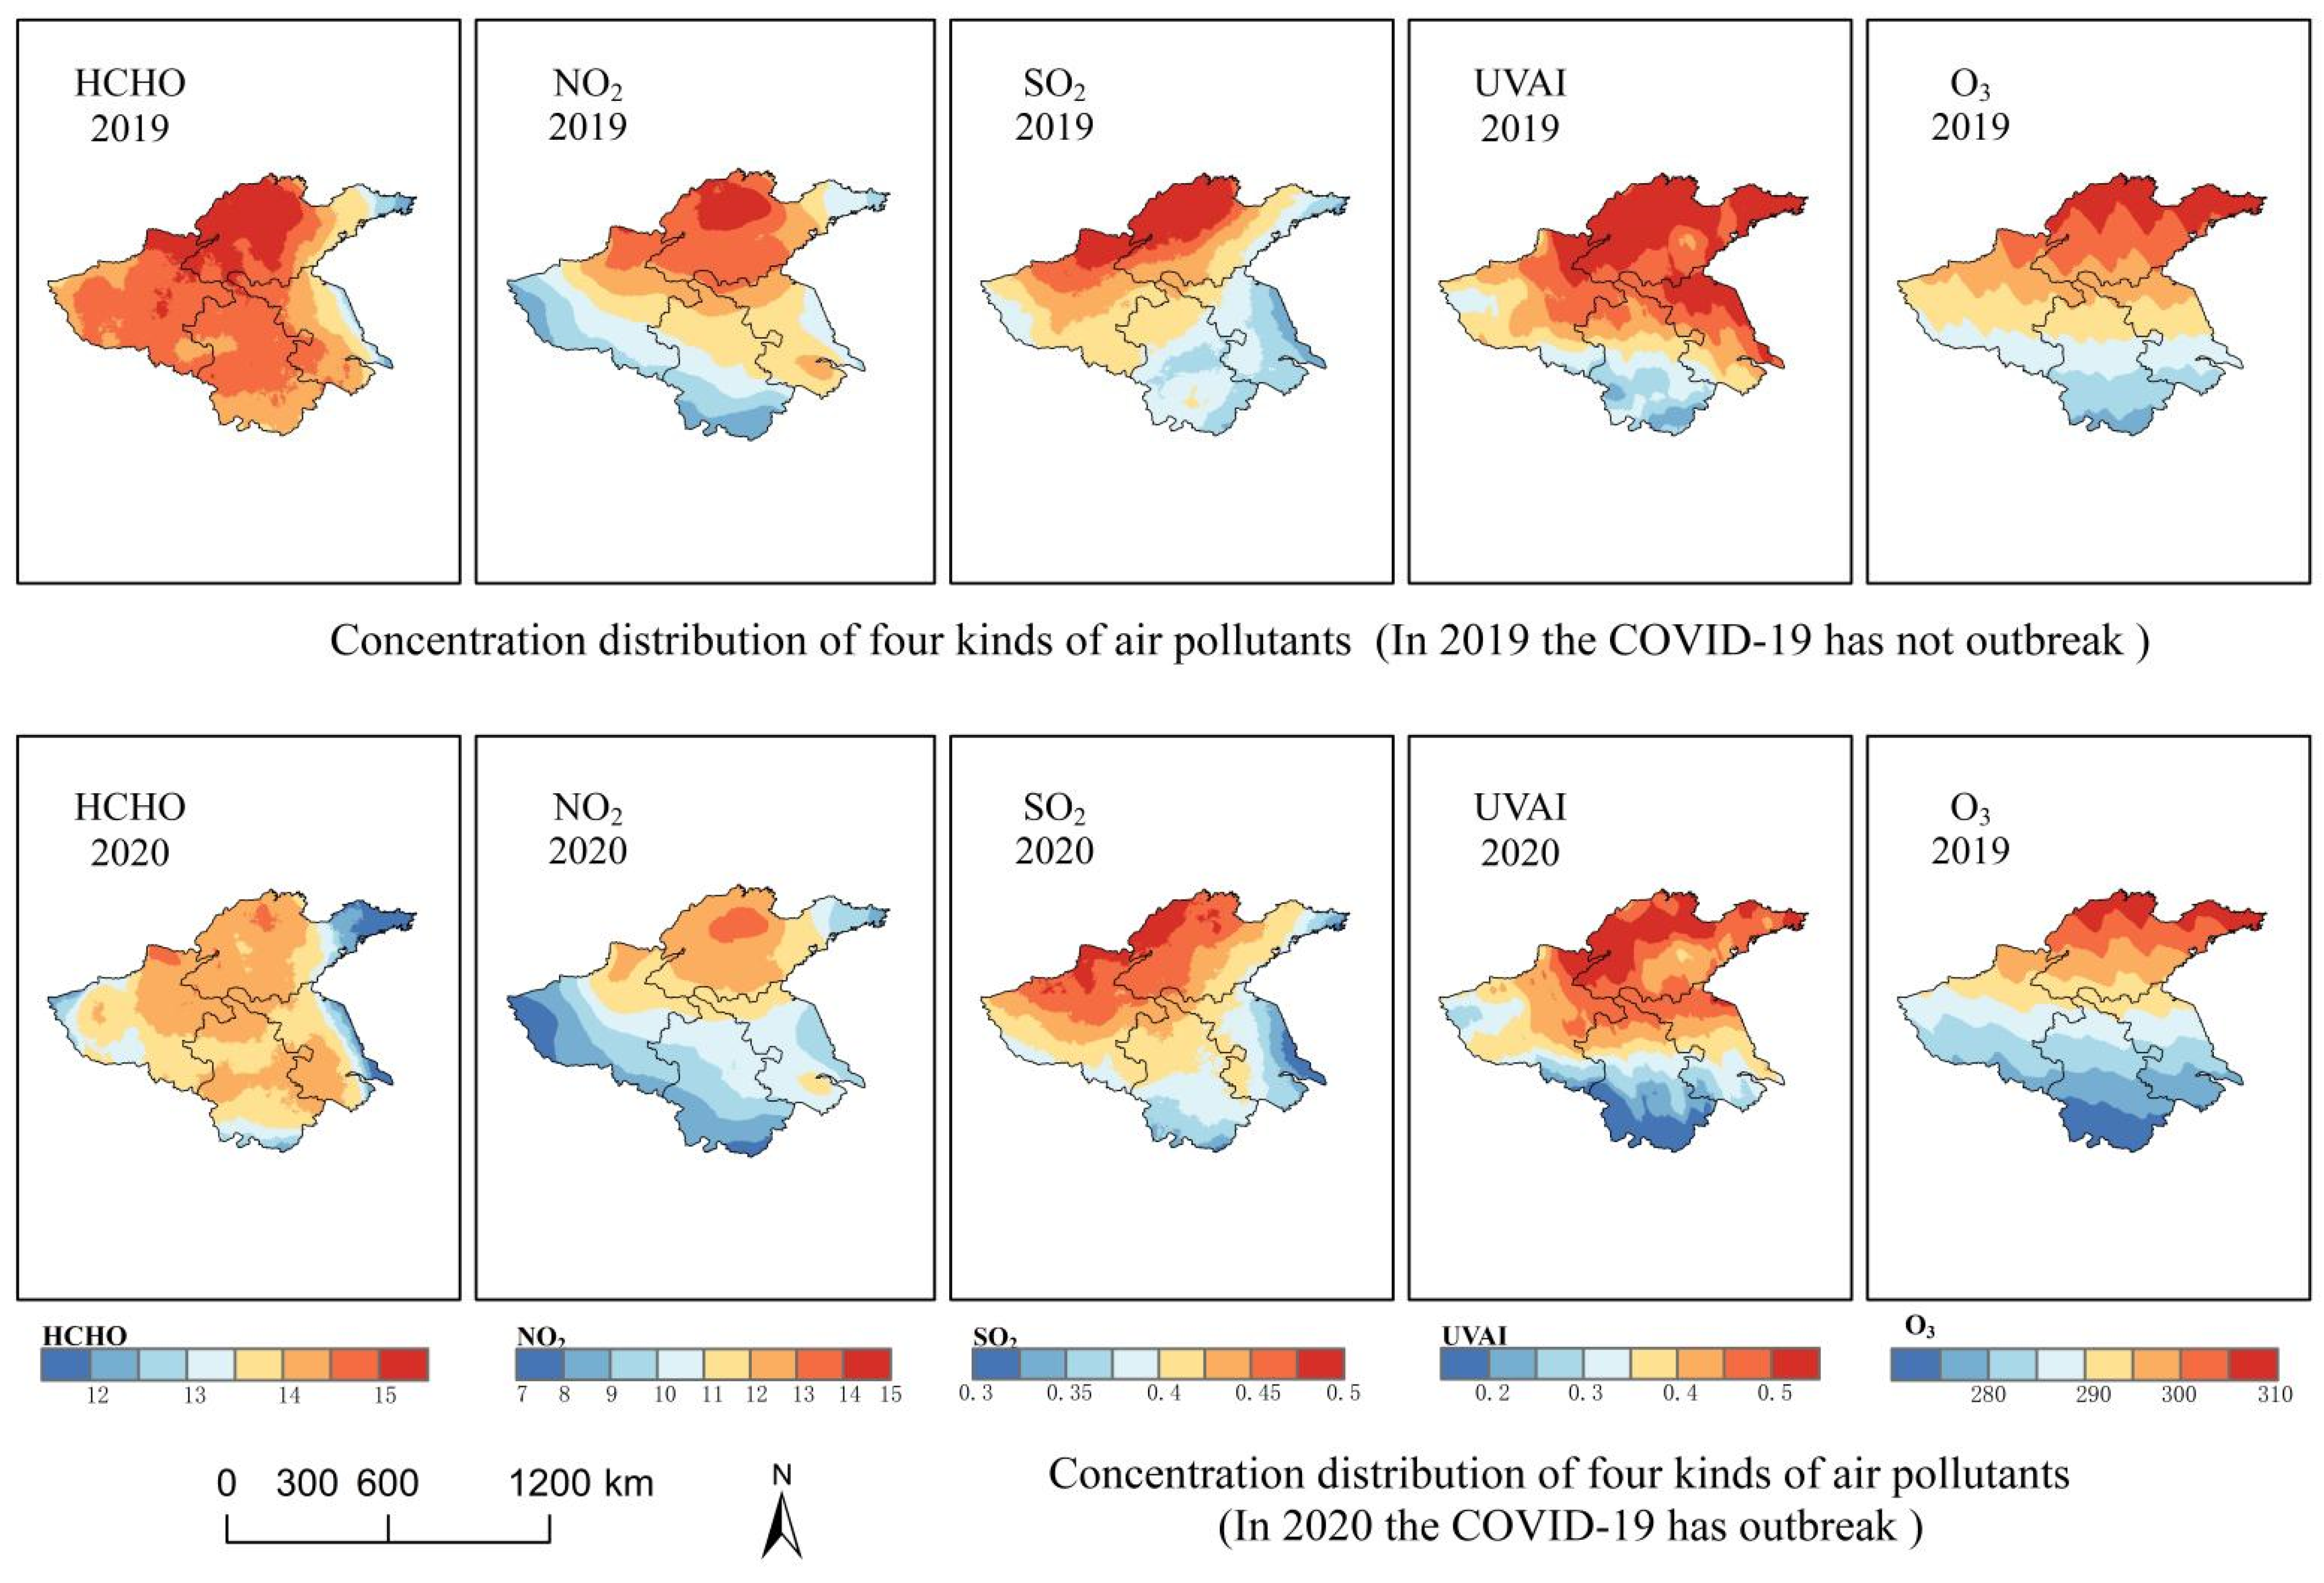
The different grades in the epidemic scenario before and after the change were calculated by comparing changes in four air pollutants between the year before and the year after the breakout of COVID-19, as well as an examination of how much human activity affects air pollution. As can be seen from
Figure 5 and
Figure 6, the four pollutants have greatly reduced, four pollutants in high-value areas concentrated in the north of the research area will now be discussed one by one, along with the findings of the calculation. The seventh level area in 2020 was 45% smaller than it was in 2019, the eighth level area was 5% smaller than it was in 2019, and the eighth level area was 17% smaller than it was in 2019. The eighth-level area was 17% smaller in 2020 than it was in 2019, and the seventh-level area was also 17% smaller. The eighth-level area was 4% smaller in 2020 than it was in 2019, but the seventh-level area was 13% larger. In 2020, the UVAI eighth-level area was 8% smaller than it was in 2019, and the seventh-level area was 14% smaller (
Figure 5 and
Figure 6).
In conclusion, the areas of HCHO, NO2, and UVAI dropped in 2020 compared to the areas of the 2019 high-value region, with HCHO experiencing the greatest decrease, followed by NO2. The size of the 2020 high-value region declined dramatically when compared to that of the 2019 high-value region, despite a decrease in the SO2 eighth level, while the seventh level grew. To slow the spread of the virus after the breakout in China, the Chinese authorities put an embargo on the entire nation. All forms of transportation by land, ocean, and air have come to a complete halt. No discernible decrease in SO2 occurred during the process. The area of high-value areas of numerous air pollutants decreased in 2020 compared to 2019 primarily because the main SO2 emissions were released during the regular operation of heating in the winter while other sources of air pollution stopped emitting. It is undeniable that COVID-19 has had a detrimental effect on both human health and the global economy, but it has also helped to reduce air pollution.
4.4. Spatial Stability of Multi Pollutants
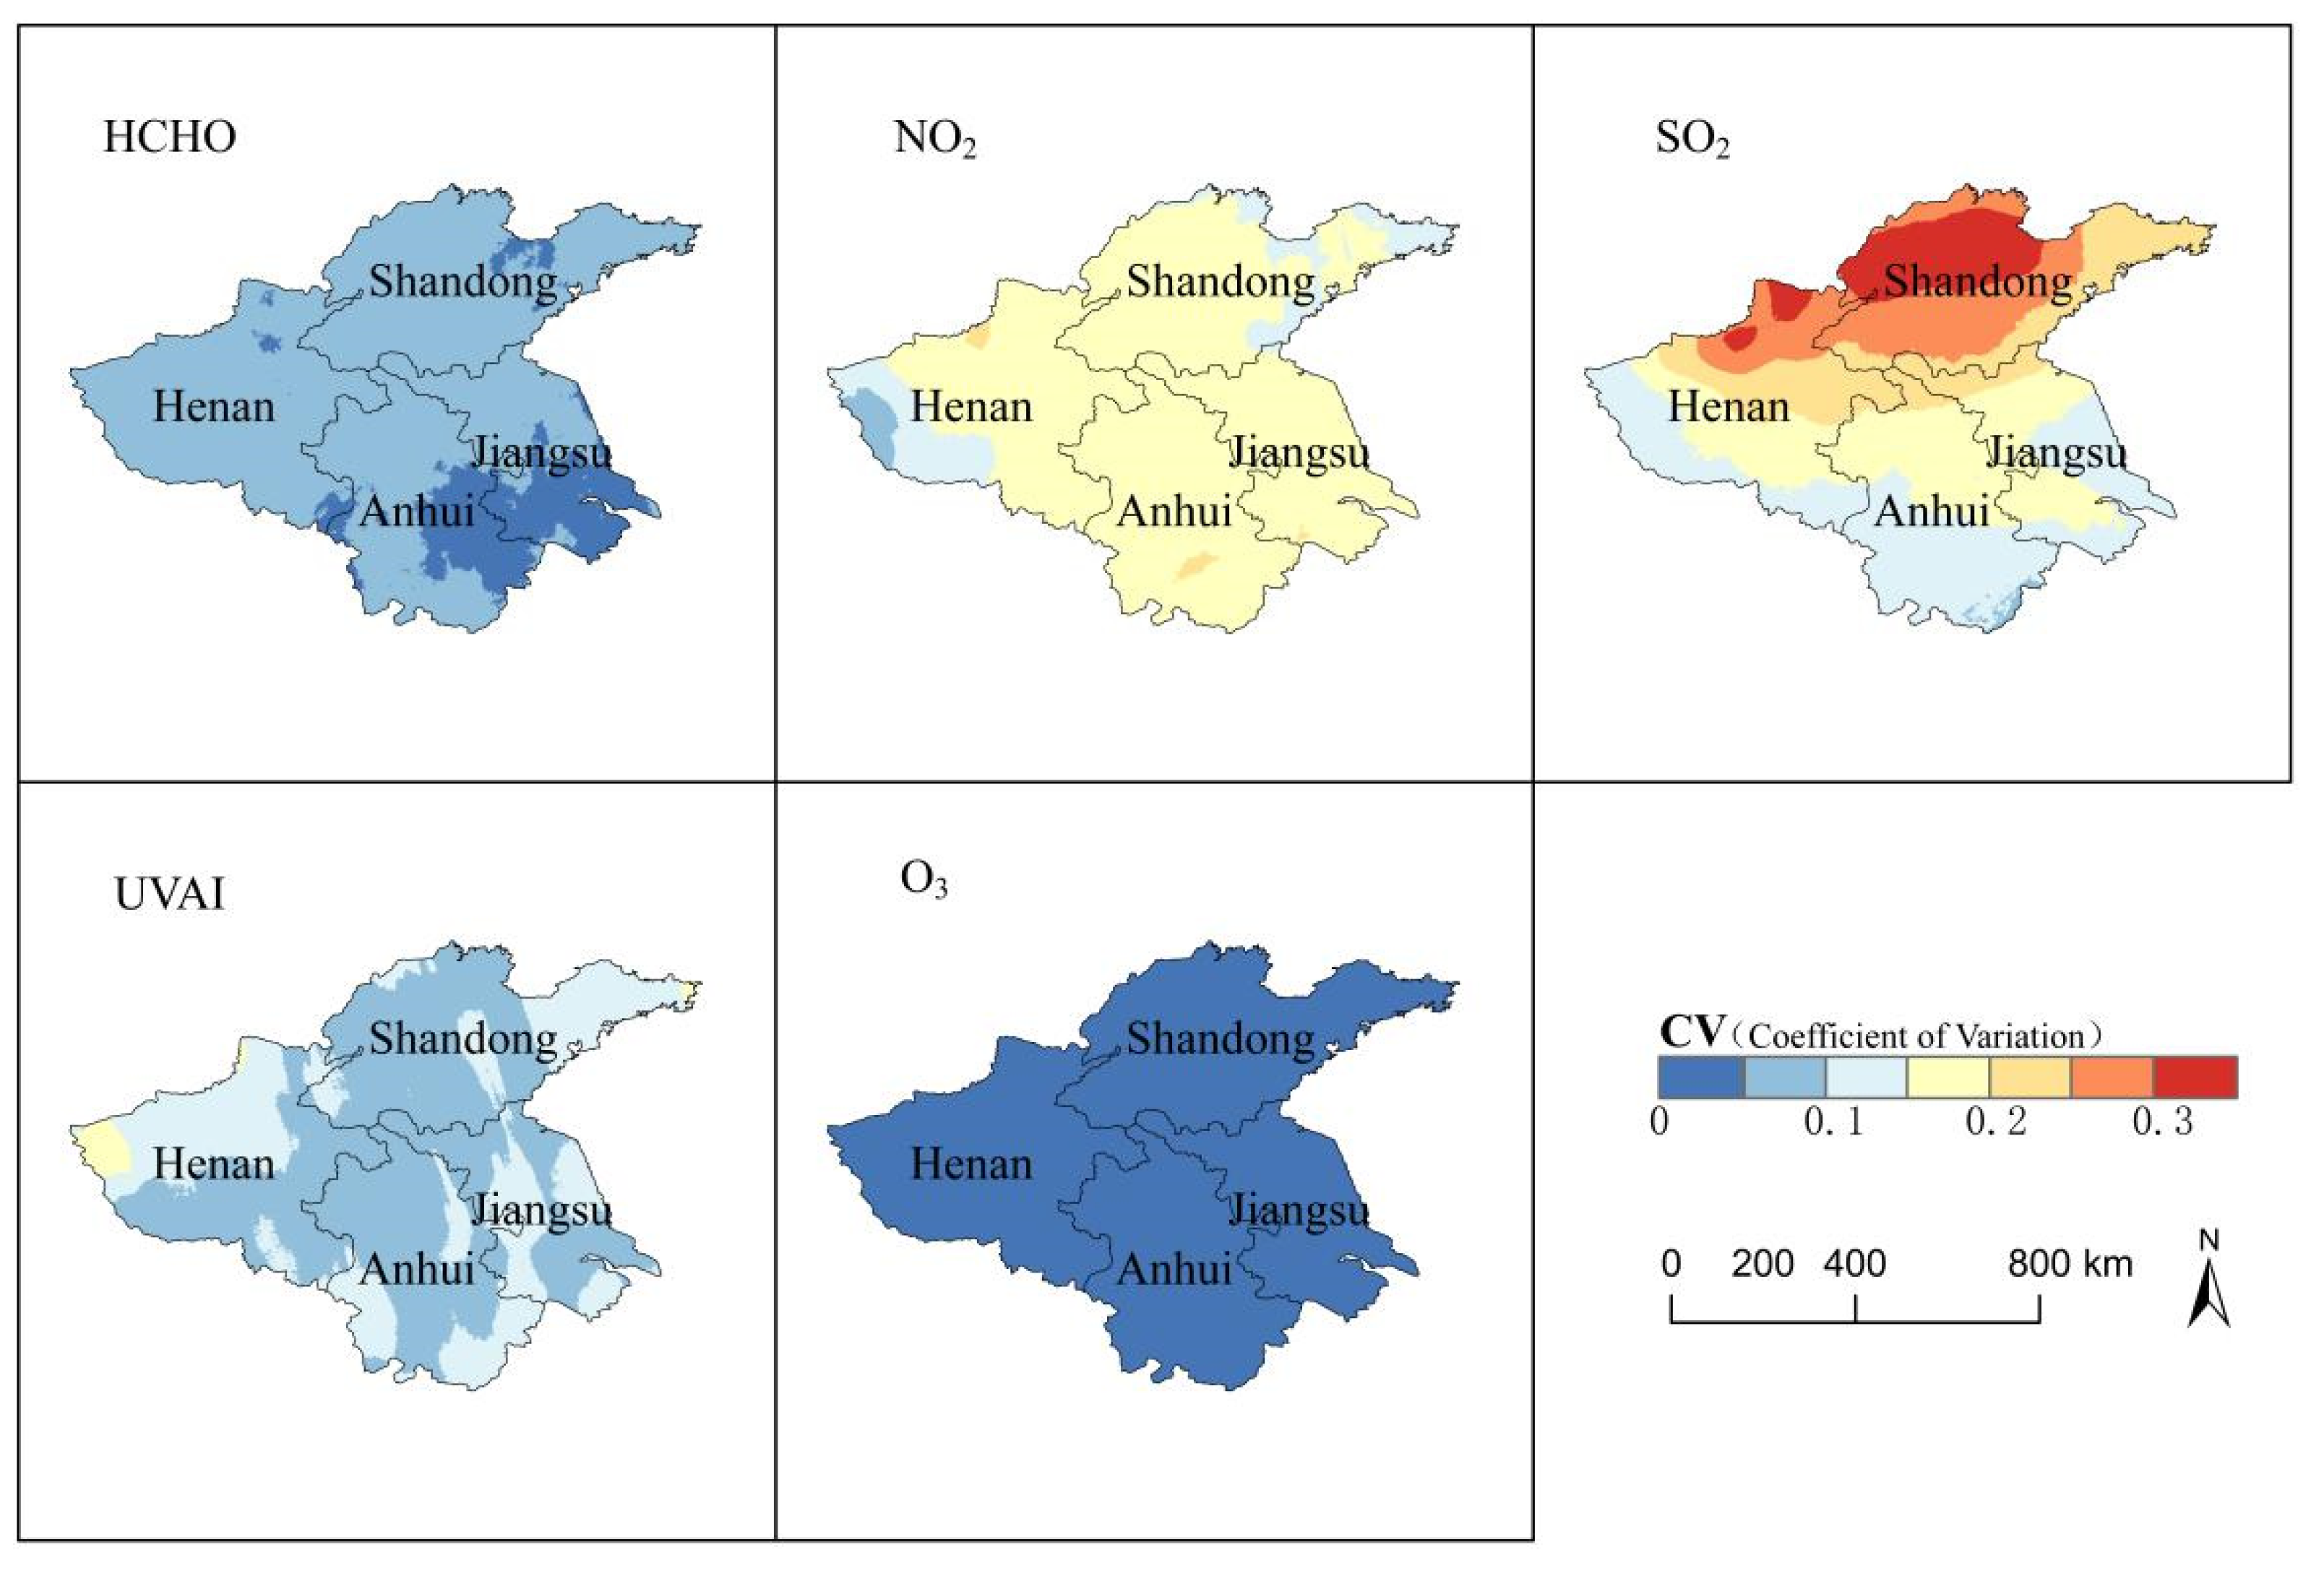
By determining the coefficient of variation for four different contaminants in the research area, the spatial stability of several pollutants was examined (
Figure 7). There were no obvious differences in the stability of HCHO, and the CV coefficient for the entire region was less than 0.05, indicating that HCHO tended to be stable in terms of year-over-year change. The stability of NO
2 ranged from 0.2 to 0.1, and the stability was generally stable; the CV coefficient for the vast majority of the study area is approximately 0.15. The small-area area in the west of Henan Province has a wider range of fluctuation than the rest of the region, while the stability of SO
2 exhibits obvious strip change. The stability of UVAI also does not exhibit obvious fluctuation, and the relative fluctuation amplitude in the large area is small. The CV coefficient gradually decreased from north to south, with less area in southern Henan, higher stability, and smaller fluctuation in southern Anhui, and southeastern Jiangsu. The CV coefficient of the small-area area in the north of Shandong province and the north of Henan province is above 0.3, the fluctuation is greater and the stability is poor. O
3 is extremely stable throughout the entire region, with little volatility and stability lower than 0.05. The spatial-temporal distribution pattern of atmospheric multi-pollutants in Jiangsu Shandong Henan Anhui urban agglomeration in 2010–2021 is composed of the spatial-temporal distribution of the remaining four pollutants in the study area, with the exception of SO
2, which is unstable in some locations.
4.5. Transmission Path Analysis of Multi Pollutants
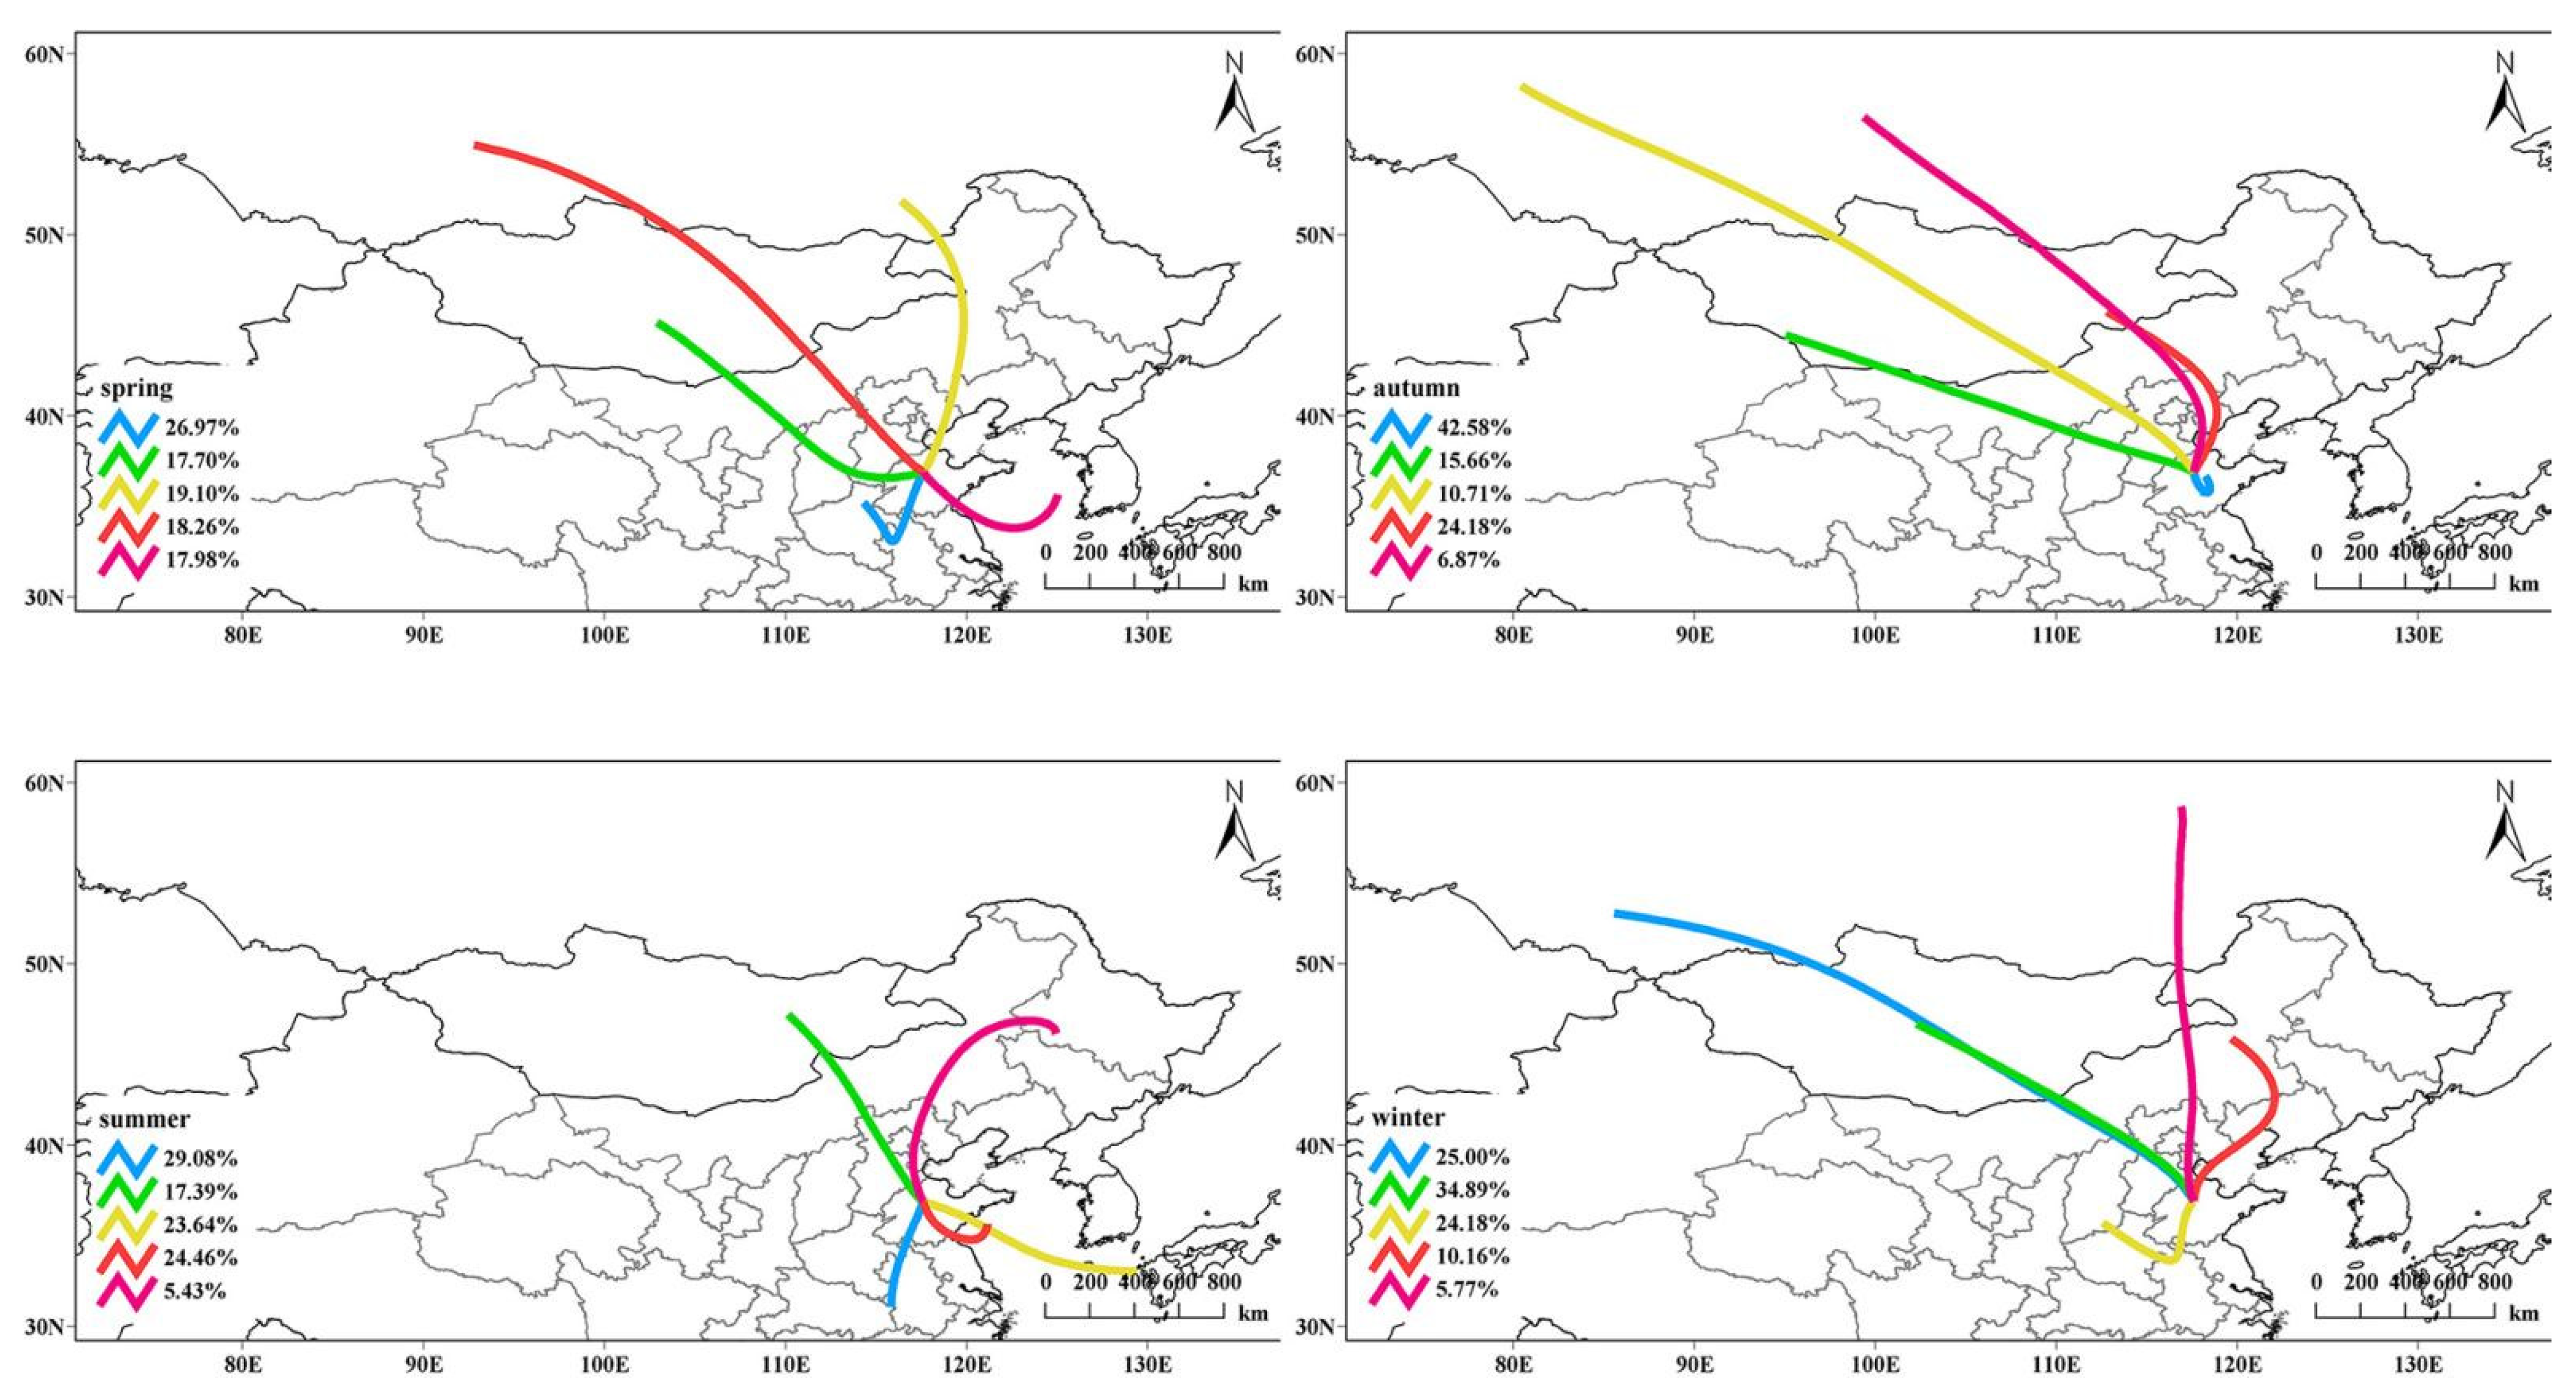
It was established from the aforementioned analysis that the high-value point in the northern part of the study area was quite close to that in the northern part of the study region. According to the data released by the Shandong Provincial Department of Ecology and Environment in April 2021, there are 168 cities in the country, of which Heze, Zibo, Linyi, and Liaocheng in Shandong province are in the bottom position in the country; combined with the four-pollutant distribution maps, it was determined that the high-value areas of various pollutants were in Liaocheng City; therefore, they were set as high-value points. The backward trajectory model was used to simulate the atmospheric transport in Liaocheng throughout the four seasons (
Figure 8). The air mass trajectories in various seasons were examined using cluster analysis after a significant number of transport trajectories were obtained. There were five key directions in which the cluster analysis was performed. When compared to the northwestern direction, the southwestern direction of air mass transport was shorter, accounting for 26.97% of the total. In spring, the air mass from the northwest to Inner Mongolia and Mongolia was more abundant, with the green and red trucks accounting for 35.96%, the yellow tracks from the north 19.1%, and the southeast 17.98%. Northeast air mass transport accounted for 5.43% of summer air travel, while the northwest air mass transport reduced to 17.39%. It was observed that more transportation came from the southeast coast in summer, including long- and short-distance travel with the predominating coastal sea–land breeze. However, the air mass transport from the southeast ocean area increased, accounting for 48.1% in both offshore and open seas. In the fall, 42.58% of the tracks originated in the south, while 57.42% were from the northwest. Autumn has a dominant northwest breeze, although the south has no significant airflow. Winter air masses were still dominated by those from the northwest, making up 59.89% of the total, while those from other directions were weaker. In conclusion, the majority of the year’s long-distance air traffic originated from the northwest of Liaocheng, whereas the majority of the province’s short-distance air traffic originated from its local region and the southeast coast. Inner Mongolia, in the northwest, is an area with abundant and high mineral deposits from which it is simple to transport significant quantities of sand to the Shandong Peninsula. Air currents transport weighty volumes of pollutants into Shandong province from the Beijing–Tianjin–Hebei region where the industry is well developed.
4.6. Multi-Pollutant Correlation Analysis
According to the data obtained from the remote-sensing monitoring of O
3, the months of March to September were split into O
3-occurrence periods, while the remaining months were non-O
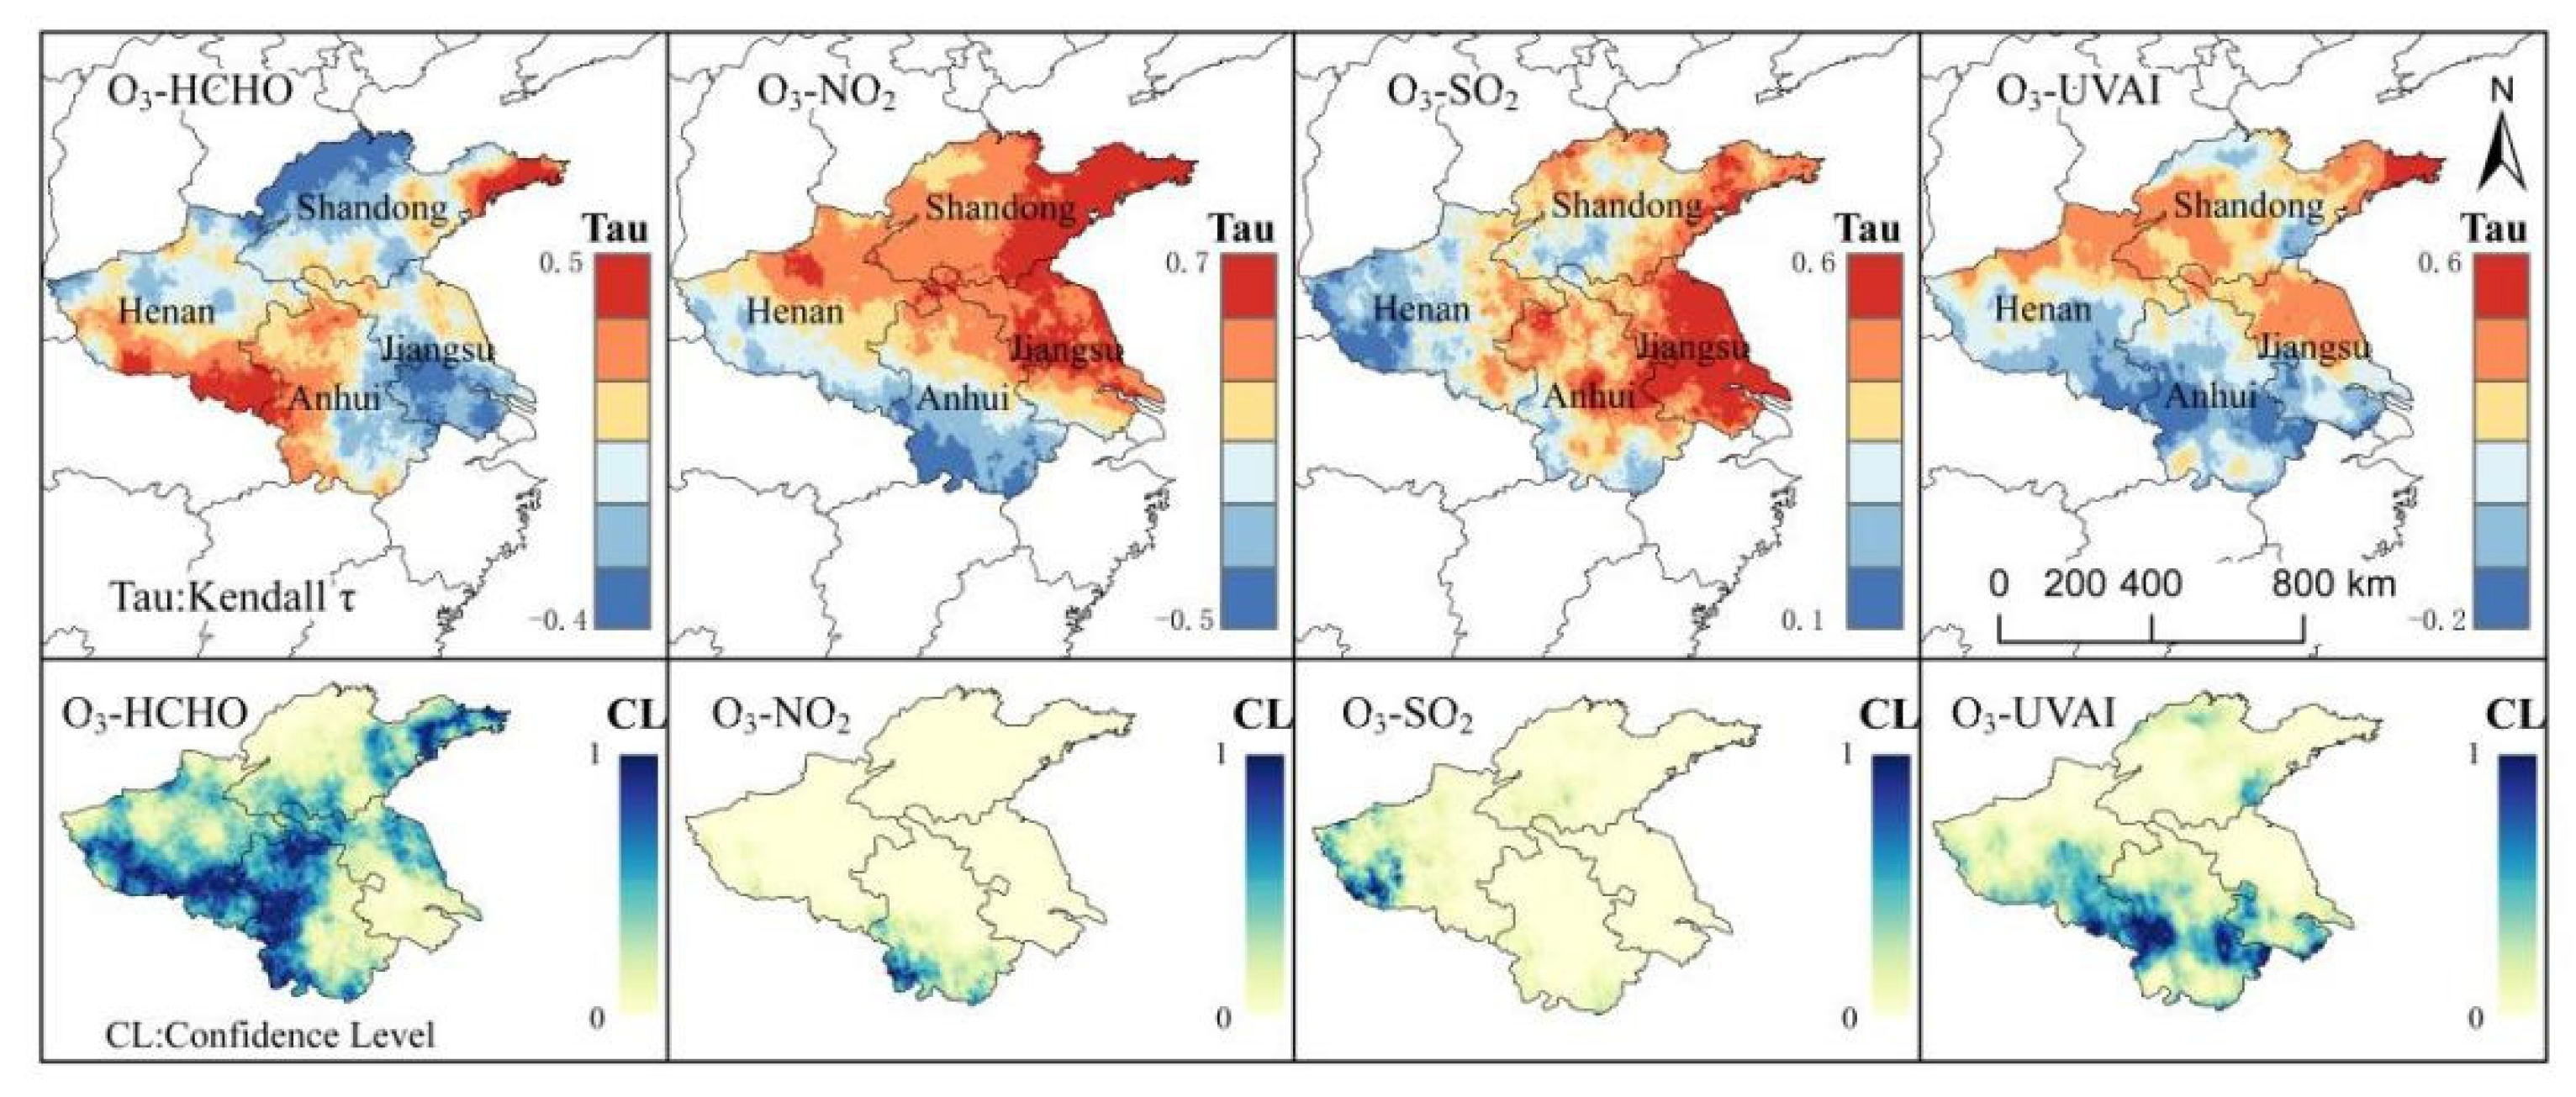
3-occurrence periods. This study calculated the spatial correlation between different air contaminants and O
3 during the O
3-generation period (
Figure 9), and its reliability was verified. The results indicate that O
3 and HCHO have a strong positive link in the northeast and southwest of the research area, where it accounts for 18% of the total. On the other hand, the south and north have a strong negative correlation, where it accounts for 32.5% of the total with excellent reliability. The northeastern corner of the study area, where the positive correlation area accounts for 53% of the area, presents the highest reliability, and the south of the study area, where the negative correlation area accounts for 4% of the area, has the highest credibility value. However, the rest of the region presents neither a strong nor positive relationship with the region. The areas with a positive connection between O
3 and SO
2 are primarily in the eastern region of the research area. A total of 39% of the region presented a good correlation, and the dependability was high. The mild, negative association between O
3 and UVAI was located to the south of the study area, while a positive correlation was focused in the study area’s northeastern corner and center, which accounted for 45% of the entire region. The method by which various contaminants participate in the production of O
3 is primarily responsible for the correlation discrepancy. This process is examined further in the subsequent O
3-sensitivity investigations performed in this study.
4.7. O3 Sensitivity Analysis
The main sources of O3 production in the study area are identified using FNR indicators based on satellite data products. Seasons are distinguished primarily to highlight differences between them, and the distribution and content of possible O3-producing variables vary according to the season. When the FNR ratio is less than 1, VOCs control can be assumed, when the ratio is between 1 and 2, VOCs-NOX cooperative control can be assumed, and when the ratio is larger than 2, NOX control can be assumed.
The O
3 control area was calculated using the 10-year mean value of the four seasons to obtain the main long-term control pollutants in different areas in the study area. The seasonal FRN values of the study area (
Figure 10) reveal that in the spring, Shandong, northern Henan, and southeastern Jiangsu are VOCs-controlled areas, accounting for 18% of the total area, while southwestern Henan and southern Anhui are NO
X-controlled areas, the VOCs-NO
X coordination-control area accounted for 3%, and the VOCs-NO
X coordination-control area only accounted for 26% in. In the fall, VOCs were only in control of a tiny portion of Shandong province; VOCs-NO
X was in charge of the remainder. In the winter, VOCs were under cooperative control with NO
X in the southwest of Jiangsu province and the southeast of Anhui province, making up 44% of the overall area.
In conclusion, because the amount of HCHO in the air is lower in the spring, fall, and winter than it is in the summer, the study area is primarily a VOCs control area and a cooperative control area. In the VOCs Control Area, where NOX is more prevalent, the rise in VOCs creates the conditions for the production of O3, making VOCs the main controlling factor, it is crucial to control organic emissions in the area. Since there is a high concentration of HCHO in the air during the summer, the study region is primarily in an area under NOX management. Since HCHO is abundant in the NOX-controlled area, it is necessary to strengthen NOX control to prevent the creation of O3.
