Article

Constitutive Behaviour of a Clay Stabilised with Alkali-Activated Cement Based on Blast Furnace Slag

1
Institute for Sustainability and Innovation in Structural Engineering (ISISE), Department of Civil Engineering, University of Minho, 4800-058 Guimarães, Portugal
2
Chemistry Research Centre-Vila Real (CQ-VR), Department of Engineering, University of Trás-os-Montes e Alto Douro, 5000-801 Vila Real, Portugal
3
School of Engineering, Newcastle University, Newcastle upon Tyne NE17RU, UK
4
Institute for Sustainability and Innovation in Structural Engineering (ISISE), Institute of Science and Innovation for Bio-Sustainability (IB-S), Department of Civil Engineering, University of Minho, 4800-058 Guimarães, Portugal
*
Author to whom correspondence should be addressed.
Sustainability 2022, 14(21), 13736; https://doi.org/10.3390/su142113736
Submission received: 13 September 2022 / Revised: 16 October 2022 / Accepted: 19 October 2022 / Published: 23 October 2022
(This article belongs to the Section Waste and Recycling)

Abstract

:
Alkaline cements have been extensively tested for soil stabilisation in the last decade. However, only a few studies have focused on the assessment of such performance by establishing the constitutive behaviour of the cement. In this paper, we focus on the mechanical behaviour, using triaxial testing of a clay with high water content stabilised with an alkali-activated binder and the subsequent prediction of the experimental stress–strain response using a kinematic hardening constitutive model initially developed for natural clays. Monotonic consolidated undrained triaxial tests were conducted on reconstituted and stabilised clay specimens cured for 28 days to evaluate the effects of cementation on the overall shear behaviour. Alkali-activated binder was synthetised from blast furnace slag and sodium hydroxide. Scanning electron microscopy (SEM), energy dispersive spectroscopy (EDS), and X-ray diffraction (XRD) were performed to study the microstructure, whereas leachate analyses were performed after 28 and 90 days of curing to investigate the contamination potential. The main product formed was calcium aluminosilicate hydrate (C-A-S-H) with a low CaO/SiO2 ratio, and no risk of soil contamination was found. The compressibility and undrained shear strength in the pre-yield state was found to be independent of the initial mean effective stress (p0), unlike what was observed in the post-yield state, where the shear strength seemed to be affected by p0. The model provided reliable predictions of the experimental results and captured the main features of the artificially cemented clay for the tested p0 range. Such studies are fundamental to establish adequate confidence in such alternative binders—an essential aspect if their use is to become widespread in the near future.

1. Introduction

Soft, clay-rich soils are frequently used in geotechnical engineering practice. These soils, known to be potentially problematic due to their undesirable geotechnical properties, such as high water content, low strength, and susceptibility to large settlements, are significantly challenging. Many stabilisation methods based on the addition of cementing agents (e.g., ordinary Portland cement (OPC), lime, slag, fly ash, etc.), such as deep mixing, shallow soil mixing, and jet grouting, are now routinely applied to increase the bearing capacity, reduce deformability, and control the swelling of these soils. Although many cementing binders have been developed, OPC is still the most extensively used binder due to its availability and effectiveness.
Cement production is one of the main factors affecting environmental pollution, with considerable amounts of CO2 and air pollutants, including SO2, NOX, CO, and particulate matter (PM), released into the atmosphere [1]. Approximately 90% of CO2 emissions of industrial origin are related to the cement industry [2], accounting for approximately 8% of global CO2 emissions [3]. To address this issue, efforts have been made to develop low-carbon-footprint binders with similar performance to that OPC in recent years.
Alkali-activated binders have attracted considerable research attention due to their potential. These binders are synthesised from amorphous Si-Al-based waste in an alkaline environment. When OPC, blast furnace slag, or cement kiln dust are used as calcium-based precursors to blend with aluminosilicate precursors, the hydration products consist of a mixture of C-S-H (calcium silicate hydrate) and C-(N)-A-S-H (calcium-sodium aluminosilicate hydrate)-type gels [4,5]. Calcined clays (e.g., metakaolin), fly ash, or mine waste with high silica and alumina and low calcium contents lead to the formation of a three-dimensional, essentially amorphous aluminosilicate gel [6]. Development has progressed to the level of ultra-high-performance concretes suitable for structural applications [7,8] and, with adequate behaviour in terms of durability [9] and sustainability.
Researchers have extensively reported the effectiveness of adding alkali-activated binders with distinct precursors for soil stabilisation, including fly ash [10,11,12], blast furnace slag [13,14], a blend of fly ash and blast furnace slag [15,16], and metakaolin [17,18]. Alternative activators have been proposed; for example, calcium carbide residue was used to activate coal gangue [19]. Another recent innovation is the use of calcined lateritic soils as a precursor, with very effective results [20]. Even expansive soils were successfully stabilised with a fly ash-based alkaline cement [21], which proved very effective, especially in comparison with Portland cement. The focus of such studies has not been solely on mechanical performance, as the potential for durability enhancement has also been targeted. Results reported by Luo et al. [22] show that after 90 days of immersion in a 2.5% sodium sulphate solution, geopolymer-stabilised soil showed higher strength and lower erosion than Portland-cement-based control specimens.
Regarding the shear behaviour of stabilised materials, studies are still scarce, which was a main motivation for the present study. Nevertheless, authors have reported general increases in stiffness and of the peak and residual shear strength after stabilisation, regardless of the curing period. Furthermore, Abdullah et al. [23] reported that confining stress has a considerable influence on the stress–strain behaviour and pore pressure development of clay stabilised with a fly ash/granulated slag geopolymer. Corrêa-Silva et al. [24] and Rios et al. [25] observed a stress–strain behaviour typical of cement-treated soils when studying the behaviour of sandy clay and silty sand stabilised with alkali-activated blast furnace slags and fly ash, respectively. The same authors [24] also reported that confinement stress has a significant impact on the shear strength of treated soils, with an increase in both peak and residual deviatoric stresses with increased initial mean effective stress. Increased normalised shear strength/stiffness and a tendency for dilation were also observed during the shear phase with increasing overconsolidation ratio (OCR). Sargent et al. [26] reported higher values of maximum dilatation for an alluvial soil stabilised with alkali-activated blast furnace slag than those observed in reconstituted and undisturbed soil under the same confining stress. The authors associated this trend with the onset of softening behaviour caused by the breakdown of the cementitious bonding structure.
Understanding the shear behaviour of stabilised clays is of considerable importance for strength and deformation analysis in engineering practice. Numerous constitutive models for cement-treated clays have been developed by extending the constitutive models representing the ‘natural bond’ for natural clays to the ‘artificial cementation bond’ structured for stabilised clays [27,28]. However, these models refer to Portland-cement-based stabilisation. For the calibration of such models, triaxial response data are essential, and the data published on this subject are limited when alkali-activated binders are used to stabilise soft soils.
The aim of the present study is to investigate the mechanical behaviour (based on triaxial tests) of a reconstituted and stabilised clay with high initial water content using alkali-activated blast furnace slag after curing for 28 days. Monotonic consolidated undrained (CU) triaxial tests based on a wide range of initial mean effective stress (p0) and isotropic compression tests were undertaken for both materials, using hall-effect transducers for a more accurate measurement of the deformations of the specimens. Scanning electron microscopy (SEM), energy dispersive spectroscopy (EDS), and X-ray diffraction (XRD) tests were carried out to characterise the microstructure of the soil–binder matrices, whereas environmental performance was assessed through analysis of the leachate collected after 28- and 90-day curing periods. The triaxial test data were then used to explore the capacity of a kinematic hardening constitutive model, as proposed by Rouainia and Muir Wood [29], to predict the experimentally observed stress–strain behaviour for both reconstituted and stabilised clay specimens. This model was previously implemented in a finite element code and has been extensively applied to a wide range of geotechnical problems under monotonic and cyclic behaviour on natural, remoulded, and overconsolidated clays [30]. However, all these studies were developed using Portland cement as the stabilizing agent.

2. Kinematic Hardening Constitutive Model

Rouainia and Muir Wood [29] proposed a kinematic hardening model for natural clays with loss of structure. The input model parameters required for the numerical simulations are summarized in Table 1. The model, formulated within the framework of kinematic hardening with elements of bounding surface plasticity, is an extension of the modified Cam clay that can describe the behaviour of reconstituted clays, in which an extra yield surface or bubble was introduced inside an external bounding surface and moves around with the current stress state according to a kinematic hardening rule. This model was formulated in order to include the effects of damage to the structure caused by irrecoverable plastic strains due to sampling, laboratory testing, or geotechnical loading.
The model considers three elliptical surfaces, i.e., the bubble surface, the structure surface, and the reference surface (Figure 1). The elastic strain region is bounded by the bubble surface, within which the initial stress state must lie. When the stress path moves beyond the bubble boundary, there is a translation motion of the bubble until the bubble and structure surface come into contact. The structure surface contains information about the magnitude and anisotropy of the structure. It assumes the role of the bounding surface and controls the development of destructuration when the structure surface approaches the reference surface during plastic loading. When the structure and reference surfaces coincide, the soil completely loses the initial structure and is referred to as reconstituted or fully remoulded soil. The model describes the essential phenomena of pre-failure behaviour of natural clays, including the stiffness variation with strain, volumetric change accompanying distortion, and peak strength at small strains.

3. Materials and Laboratory Testing

3.1. Materials

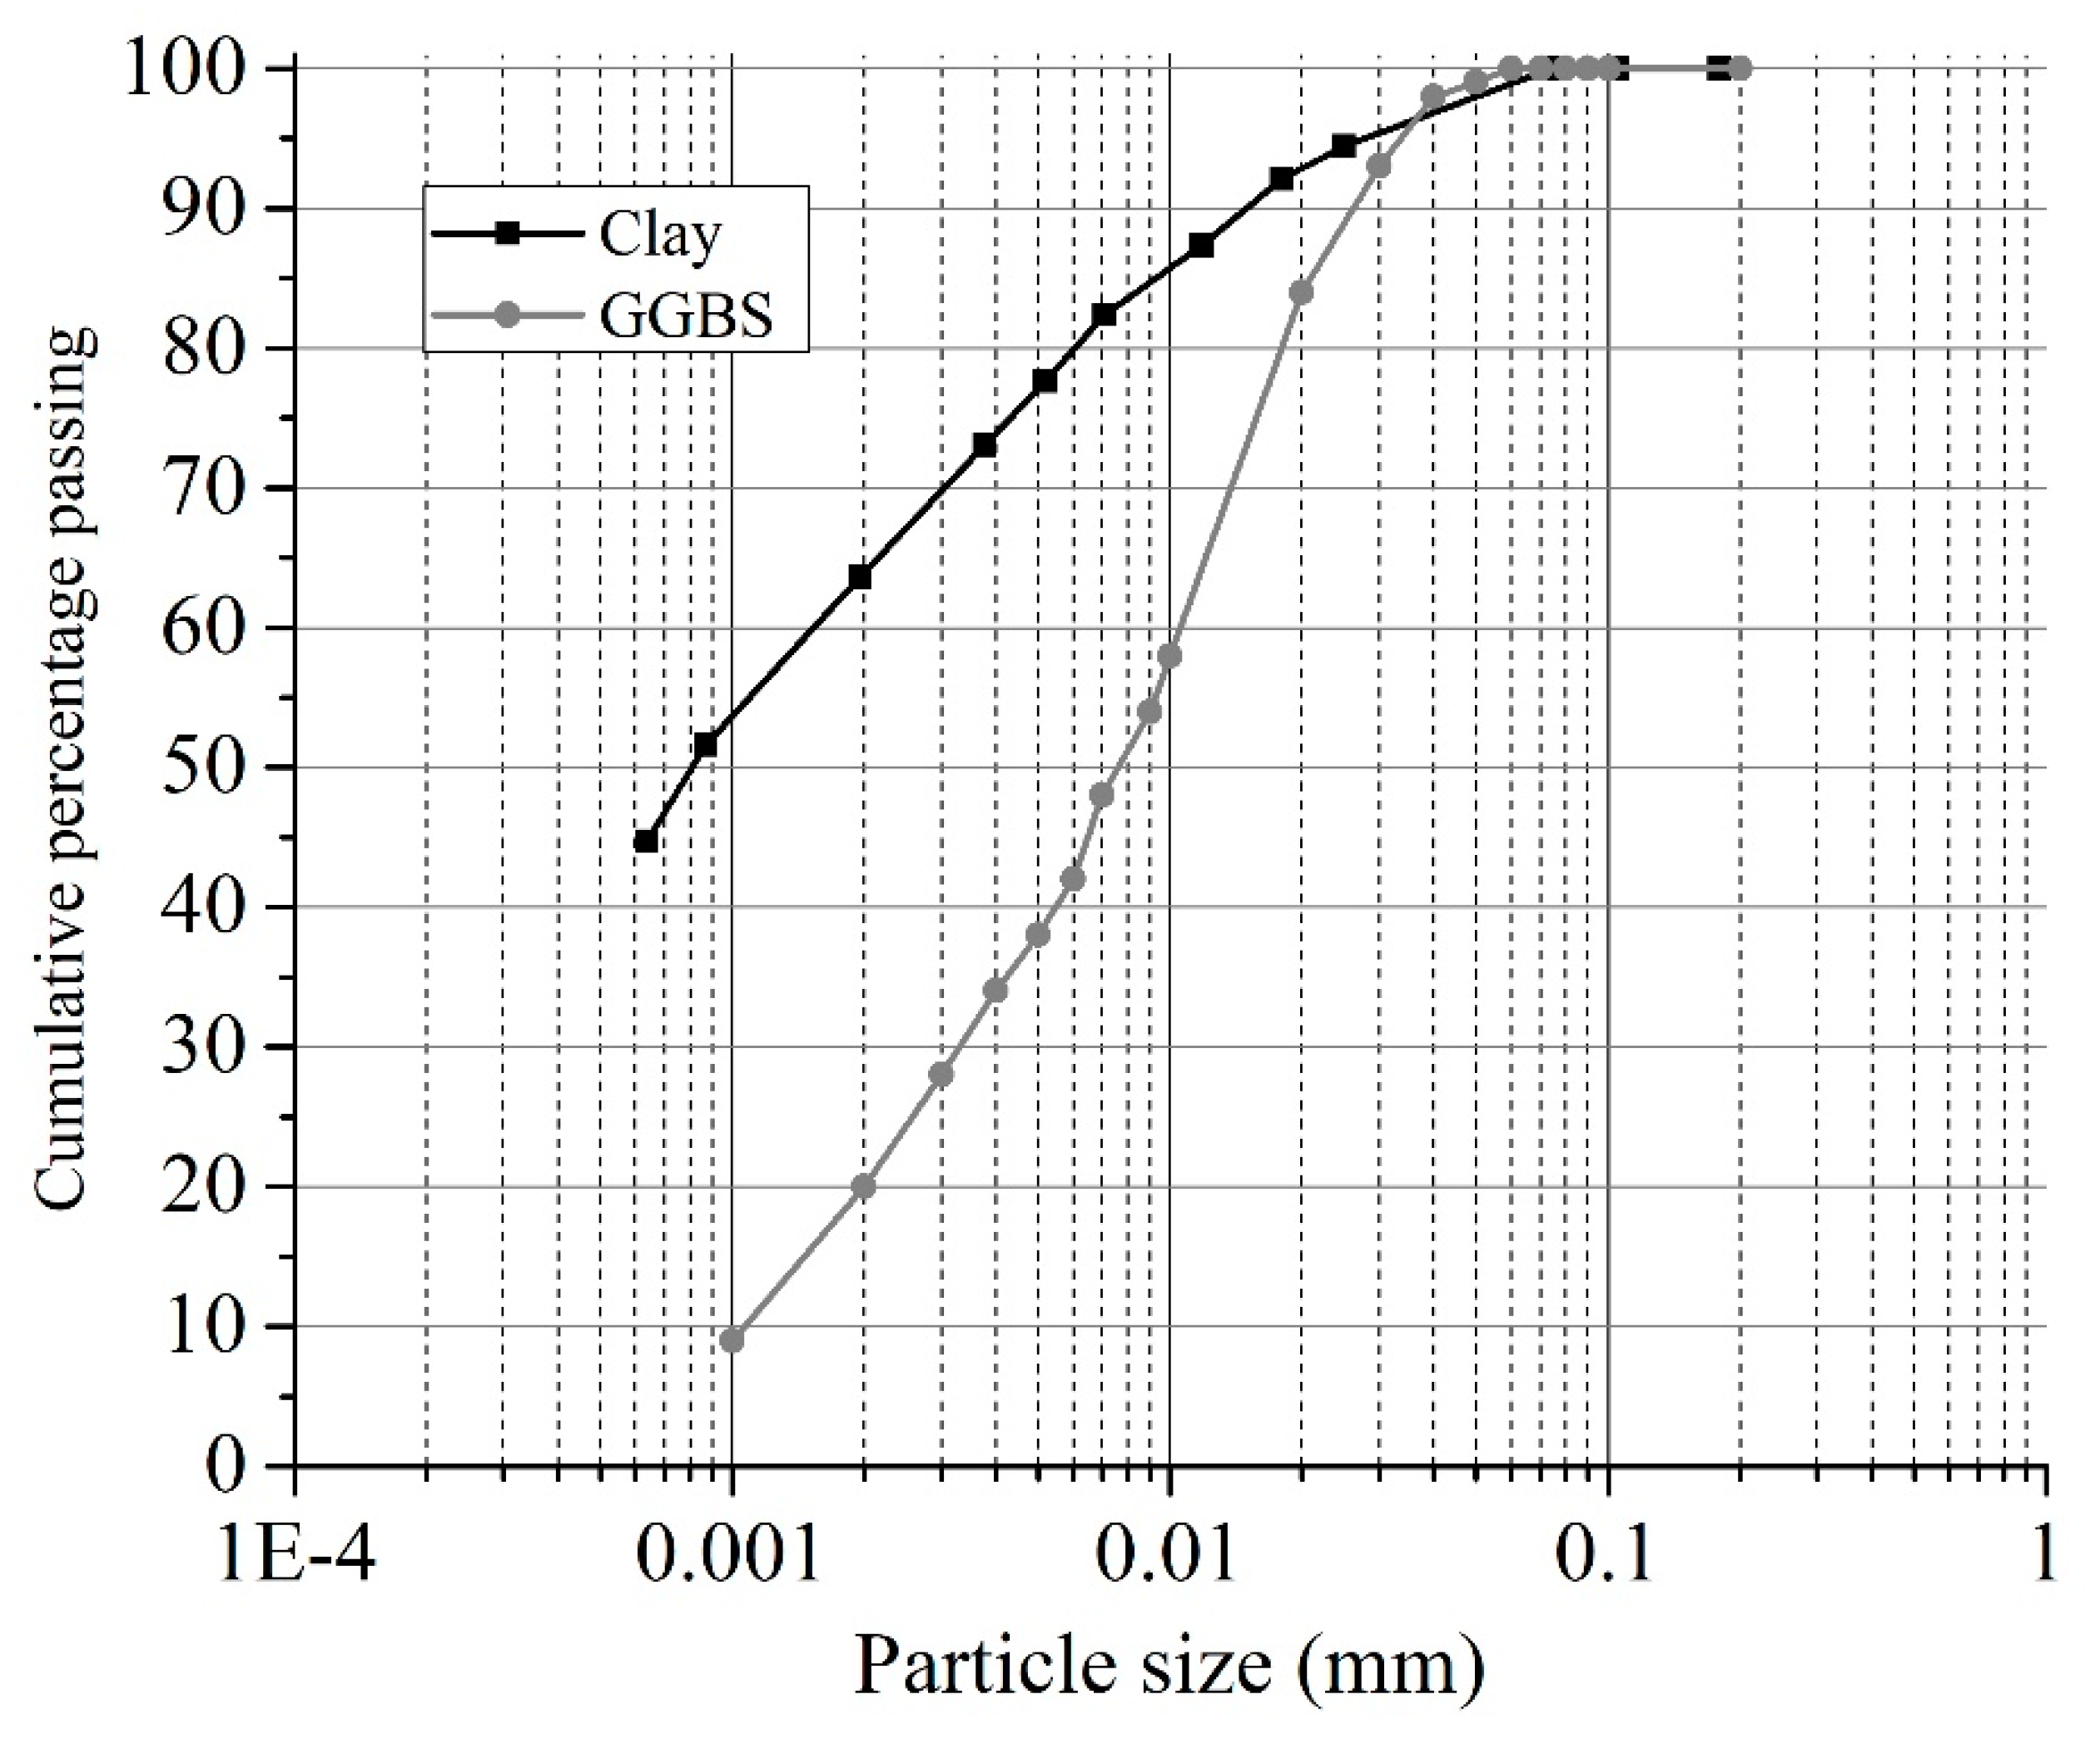
The clay was collected in the north of Portugal and is mainly composed of kaolinite. According to the unified soil classification [31] and the AASHTO system used for highway construction purposes [32], the soil is classified as CH clay with high plasticity and fits into the A-7-6 group classification, with a group index of 47. It is a poor-quality soil in terms of its geotechnical properties. with a high plasticity index and is therefore suited to stabilisation. The grading curve and the physical properties of the clay are shown in Figure 2 and Table 2, respectively. Chemical analysis of the clay showed high aluminium oxide (Al2O3) and silicon dioxide (SiO2) contents in a total mass of 96.73% (Table 3).
The binder used to stabilise the clay is composed of two parts of ground granulated blast furnace slag (GGBS) and one part of sodium hydroxide (NaOH) in dosages of 5%, 10%, 12.5%, and 15% (by soil dry weight) and was developed by Sargent et al. [26]. The blast furnace slags were supplied by Hanson Cements Ltd. in granulated form and are characterised by a density of 2.4–3 Mg/cm3 at 20 °C and pH of 10–12 (DEV-S4—eluate according to EN 12457-4) (Figure 2). It is an amorphous precursor with a light-grey colour, mainly formed by oxides of calcium (CaO), aluminium (Al2O3), and silicon (SiO2), in a total of ≅85.55 wt.% (Table 3). The granulated NaOH is a commercial alkali activator with a white colour. The grains were dissolved in distilled water before being added to the clay and GGBS.

3.2. Specimen Preparation and Binder Selection

Reconstituted soil specimens were built based on the slurry consolidation method described by Liu et al. [37]. Dried clay was mixed with an initial water content (ω) of 65% (5% higher than the liquid limit, Table 2.) using a kitchen appliance. The clay slurry was placed inside the consolidation equipment and consolidated under incremental loading until a dry density (ρd) of 1.16 Mg/m3 and a water content of 44% were reached. The maximum applied stress was approximately 55 kPa. The specimen was then extruded, placed on a rotating pedestal, and trimmed with a height and diameter of approximately 140 mm × 70 mm. Finally, the specimen was wrapped and cured in a climatic chamber at a temperature and humidity of 20 °C ± 1 °C and 95%, respectively.
The stabilised clay specimens were prepared by initially mixing the dried clay with GGBS in the amounts referred to in Table 4. The NaOH was separately dissolved in 44% distilled water. The liquid phase was then added to the solid materials, and an additional manual mix was performed in order to obtain a final homogeneous mixture. Next, the mixture was statically compacted based on ASTM D 1632 [38] into PVC moulds with 140 mm height × 70 mm diameter, with ρd and ω of 1.16 Mg/m3 and 44%, respectively, equal to the reconstituted clay specimens. The specimens were kept inside the moulds, wrapped with cling film, and cured under controlled conditions; they were only extruded before starting the tests.
A short campaign of unconfined compressive strength (UCS) tests was conducted after curing for 28 days (Table 5) to define a suitable binder dosage to enhance the clay strength up to engineering application requirements, which are typically in the range of 300 kPa ≤ UCS ≤ 3000 kPa for most deep/shallow soil-mixing scenarios [39]. The specimens were not saturated before testing and were tested under monotonic displacement control at a rate of 0.18 mm/min.
The stabilised specimen strengths observed after 28 days of curing were higher than those observed in the reconstituted clay specimens, even for the lowest binder dosage. However, the degree of strength development changed significantly with the binder dosage. The minimum dosage of GGBS-NaOH required to satisfy the EuroSoilStab criterium was 10%; therefore, the binder used to stabilise the clay was composed of 10%GGBS-NaOH. For 10%GGBS-NaOH, the NaOH was dissolved in water at a concentration of 1.89 molal.

3.3. Laboratory Testing

Monotonic CU triaxial and isotropic compression tests were performed on reconstituted and stabilised clay specimens after 28 days of curing according to BS 1377 8 [40] for 10 kPa ≤ p0 ≤ 1200 kPa to investigate the mechanical behaviour of both materials in terms of peak deviatoric strength, pore pressure response, stress path, failure envelopes, compressibility, and yield stresses. The results were used to calibrate the model parameters. Table 6 summarises the triaxial tests. Under triaxial compression, all specimens were sheared at a loading rate of 5 μm/min. An external LVDT was installed on the top of the triaxial chamber to measure the external axial strains. The local strains were measured with hall-effect transducers (two axial and one radial) installed at the mid-height of the specimens to characterise the behaviour of the materials at low strain (εa) levels (εa ≥ 0.001%). The OCR was applied on the reconstituted clay specimens during the consolidation phase, increasing the effective stress to the maximum desired value (pmax) and then reducing it to the final value (pfinal), which is equal to the p0 applied during the shear phase. The OCR corresponds to the ratio of pmax to pfinal.
SEM-EDS and XRD analyses were carried out on unpolished reconstituted and stabilised clay specimens after 28 and 90 days of curing. Small pieces of stabilised clay specimens were soaked in acetone and dried according to the method described by Zhang and Scherer [41] to guarantee that the chemical reactions were stopped at the desired curing time.
XRD analysis is a well-established method for mineralogical characterisation. Most soil minerals are crystalline structures, and upon interaction with X-rays, a specific diffraction pattern is produced. The XRD spectra of the materials were recorded with a PANalytical X’Pert MPD diffractometer using the λ = 0.154 nm Kα line of a Cu anode (Bragg—Brentano geometry) equipped with an X’Celerator detector. The spectra were obtained at room temperature, between 8° and 60° (2θ), using a step of 0.017° with 100 s/step.
SEM-EDS analysis was conducted to visualise the microstructure and morphology of the particles and to determine the elemental composition of specific areas. SEM analyses were performed on a FEI Quanta 400 scanning electron microscope, with 30 kV, in low-vacuum mode (1.3 mbar), avoiding the deposition of a conductive layer. The device was coupled with an EDAX EDS analyser.
Leachate tests were performed according to EN 12457-4 [42] on reconstituted and stabilised clay specimens after 28 and 90 days of curing to assess the risk of soil contamination. This standard specifies information on leaching of granular waste or sludges at a liquid/solid ratio of 10 L/kg for particle sizes below 10 mm. A specimen of approximately 90 g was collected and placed into a bottle with 0.9 L of leachant (in this case, distilled water) for 24 h and shaken at a rotation speed of 20 rpm. The eluates were then collected according to the procedure described by the standard and analysed. The leachate results were compared with the limit values of inert waste defined by Annex IV of the Portuguese Law Decree n. 183 [43]. This law establishes in which kinds of landfills waste can be deposed, classified in one of three categories, namely: landfills for inert waste, which have strict limit values; landfills for non-hazardous waste; and landfills for hazardous waste.

4. Results and Discussion

4.1. Microscopy Analyses

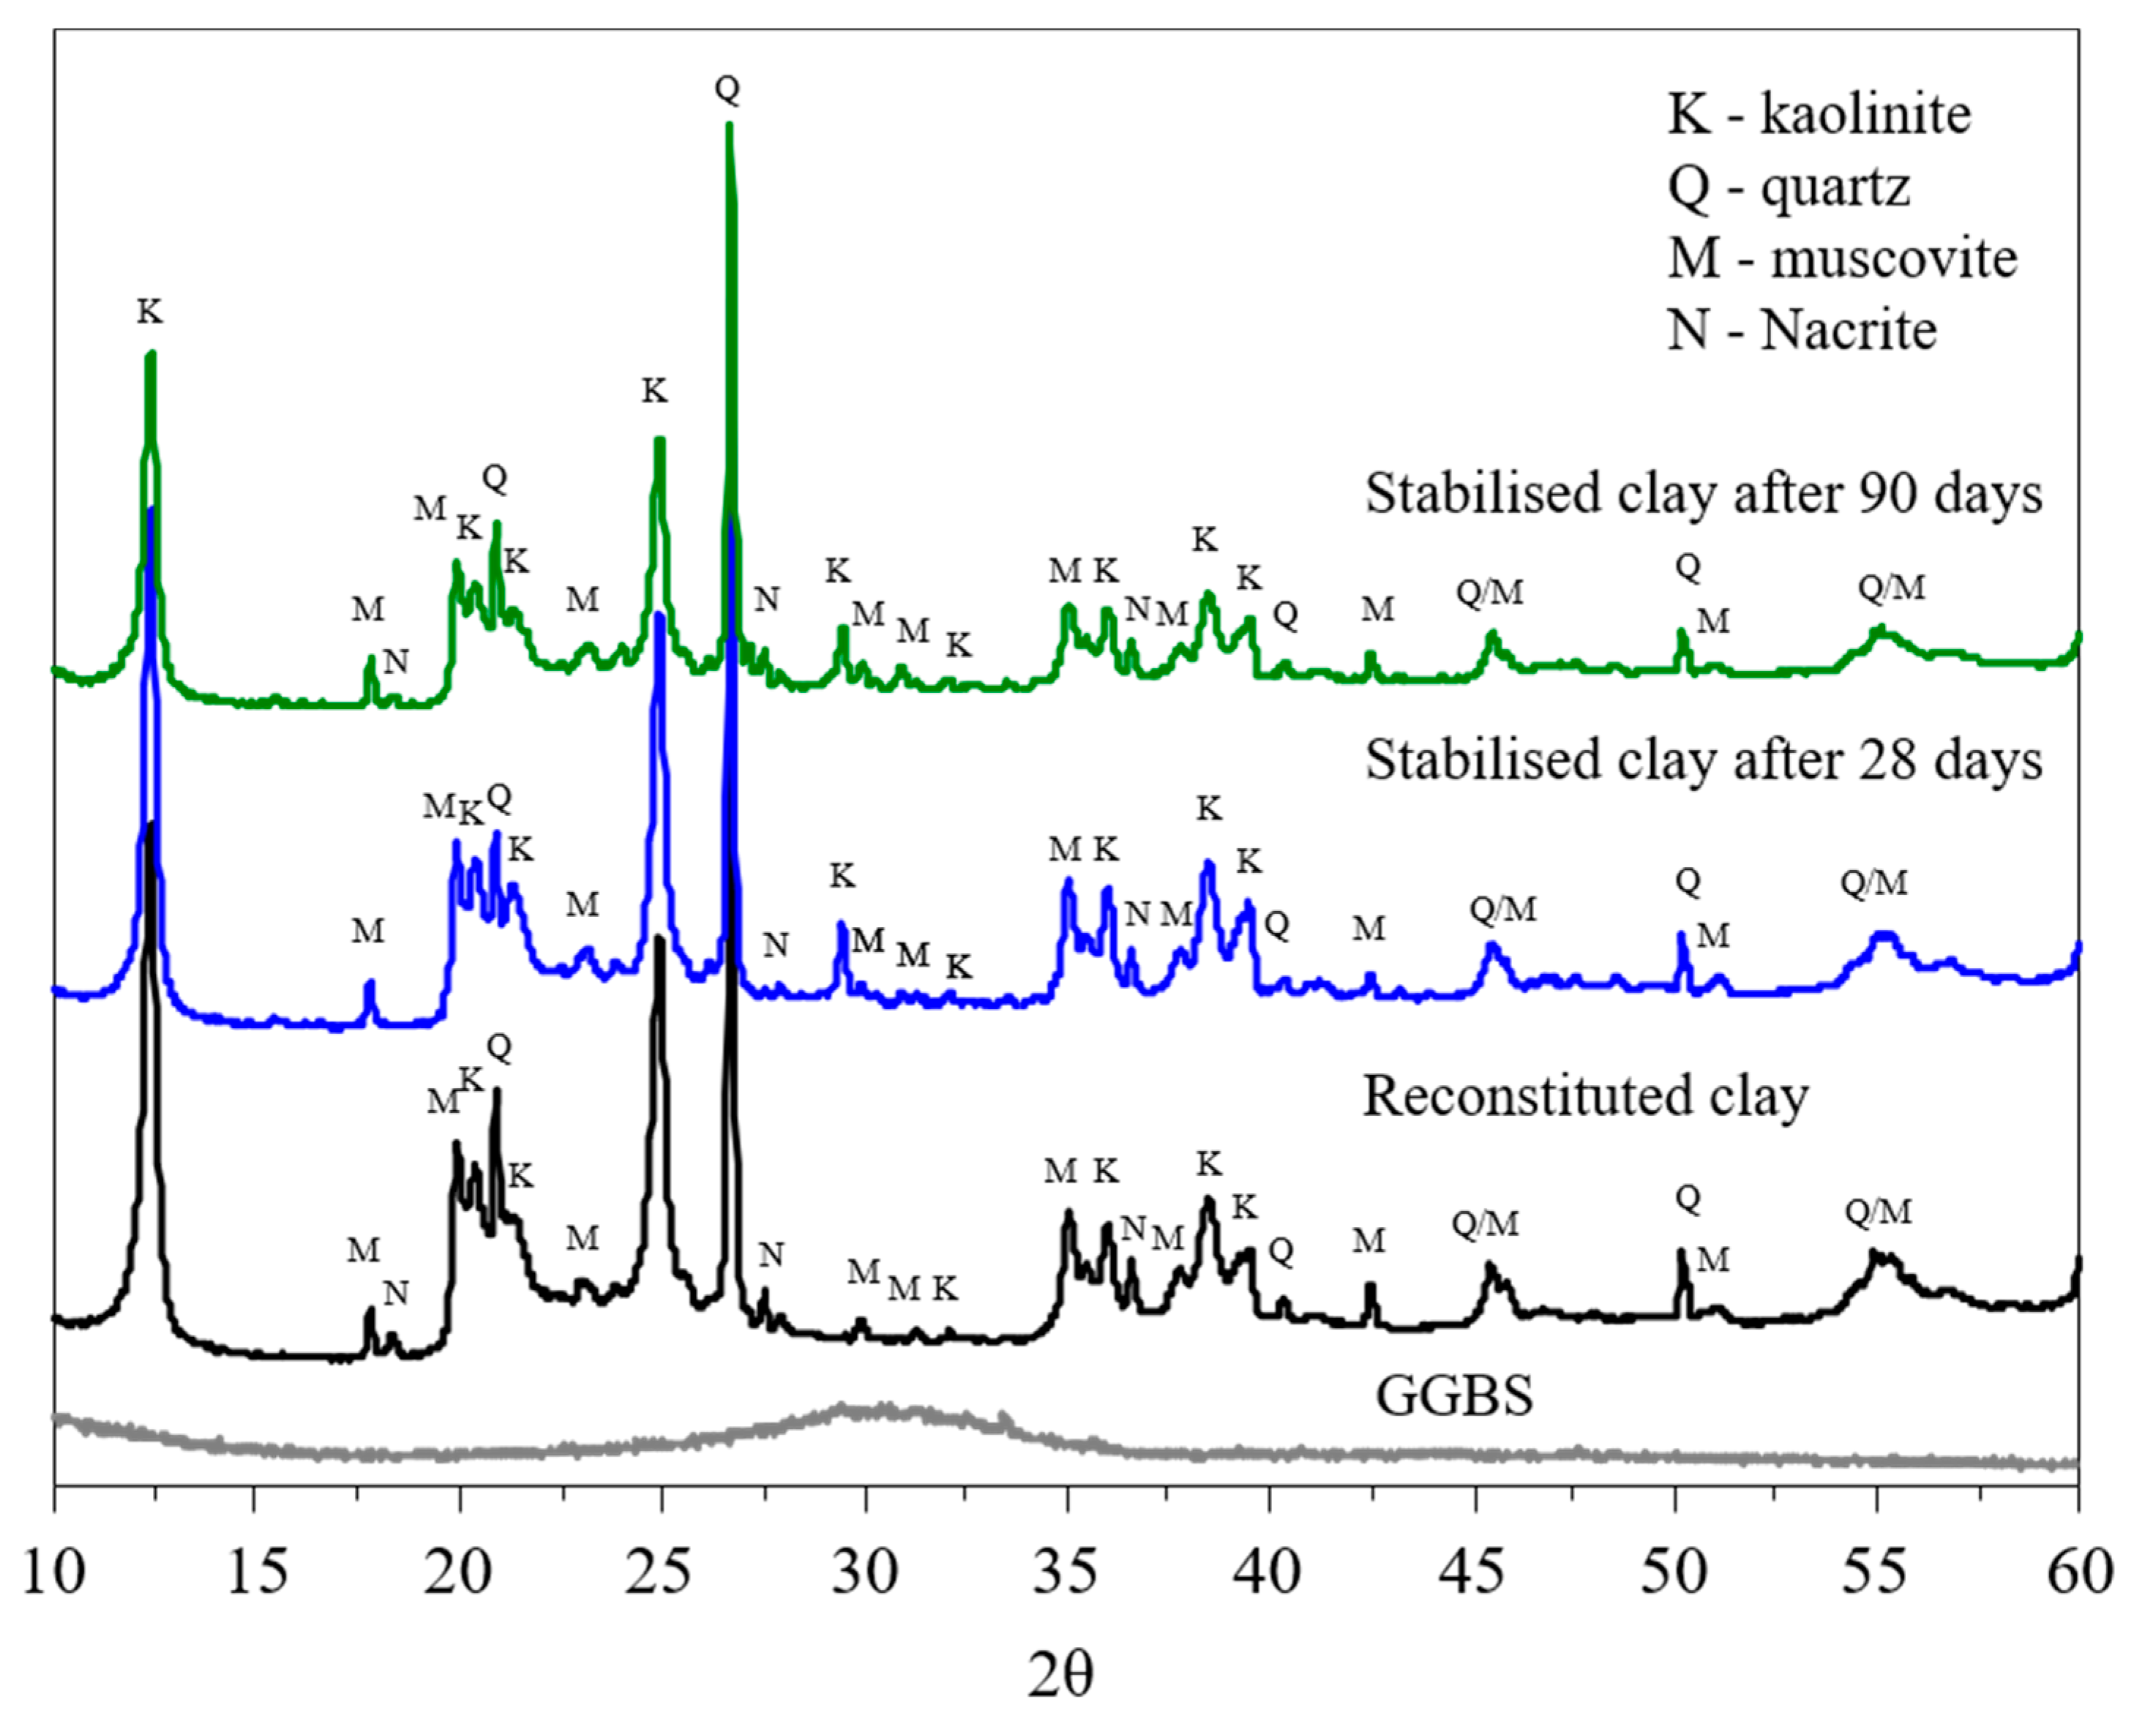
The XRD spectrum obtained for each material is shown in Figure 3. The major crystalline minerals found within the clay were kaolinite (K), quartz (Q), and muscovite (M). Nacrite (N) was also detected, which is a clay mineral and a form of kaolinite. Kaolinite is a very stable clay mineral composed of strongly connected silica and alumina plates. No peak was detected in the GGBS spectrum, indicating that the precursor is practically an amorphous material.
The clay spectrum composition after adding 10% GGBS-NaOH is very similar to the original clay spectrum, with no new mineral phase detected after 28 and 90 days. The main differences observed are with respect to the peak intensities, which were lower on the stabilised clay after 28 days. After 90 days, these intensities were even lower than after 28 days, suggesting the dissolution of some mineral phases and the possible formation of cementitious gel [25]. More precisely, these reduced peaks are essentially muscovite, kaolinite, and quartz and are located at approximately 12.5 2θ, 20 2θ, 25 2θ, between 35 2θ and 40 2θ, and between 45 2θ and 50 2θ.
The SEM images were taken at magnifications of 300×, 100×, and 300×, and are presented in Figure 4a–c, respectively. Examples of EDS spectra recorded for each material are shown in Figure 4d.
As shown in Figure 4a, the reconstituted clay has a discontinuous structure due to the absence of gel, making voids more visible. Unlike the gel, the clay particles shown in Figure 4a have a well-defined shape and boundaries and a smooth surface texture. After adding 10% GGBS-NaOH (Figure 4c), the soil matrix seems to be denser and homogeneously covered by a layer of amorphous gel, with the soil particles surrounded and bonded by the cementitious gel. Physically, the pores or air spaces decreased, and the gel seems to act as a binding substance, creating more connections and increased cohesion between the clay particles. There is also no specific orientation of the clay particles before (Figure 4a) and after stabilisation (Figure 4b,c) indicating that the two clays have identical properties in all directions (isotropic materials). Figure 4b shows a larger area of stabilised clay, which is characterised by a compacted matrix without loose or unbound particles. The cracks in darker areas are the result of the process of specimen preparation.
The EDS spectrum of the reconstituted clay shows the presence of high aluminium oxide (Al2O3) and silicon dioxide (SiO2) contents (wt.% ≅ 96.73%) and trace amounts of Fe2O3, K2O, and Na2O (Figure 4d and Table 3).
A more detailed quantitative analysis was conducted on the stabilised clay after 28 days of curing, comprising 10 points on one SEM image, to estimate the gel composition. According to the EDS data, Si and Al were the elements with the highest concentrations. Na and Ca were also detected, with average contents of 4.63% and 3.22%, respectively, suggesting the formation of an N, C-A-S-H-type gel with a composition of 0.002 ≤ CaO/SiO2 ≤ 0.234 and 0.446 ≤ Al2O3/SiO2 ≤ 0.725. The average weight ratios were CaO/SiO2 = 0.05 and Al2O3/SiO2 = 0.67; the CaO/SiO2 ratio is significantly lower than usually observed. For instance, Garcia-Lodeiro et al. [44] reported ratios of 0.72 ≤ CaO/SiO2 ≤ 1.94 in a C-A-S-H system. Such a difference is explained by the incorporation of only a small amount of blast furnace slag into the system (90% clay, 6.67% GGBS, and 3.33% NaOH), as well as by the use of a precursor with high SiO2 content (≅35.92%; Table 3).

4.2. Shear Behaviour

4.2.1. Isotropic Compression

Figure 5 shows the isotropic compression curves in a “1 + initial void ratio (1 + e0) − logarithmic mean stress (log p’)” space. The slopes of the normal compression (λ) and swelling (k) lines and the yield stress (py) determined according to the Casagrande method are summarised in Table 7.
A stiffer behaviour was observed on the stabilised clay, with slopes of λ and κ reduced by 6.4 and 1.1 times, respectively, compared with the reconstituted clay. For the reconstituted clay, the onset of irrecoverable or plastic strain is a well-defined py point at 55 kPa. This yield stress is the result of the stress history applied during specimen preparation. After adding 10% GGBS-NaOH, the py increased significantly to 745 kPa. However, the py point observed on the stabilised clay compression curve is not as well-defined as that observed in its reconstituted state. The use of higher axial stresses could result in a more well-defined linear virgin compression zone. We believe that the variation in py was caused by the development of strong cementation bonds within the matrix of the stabilised clay. The pre-yield state (p0 < py) is characterised by low compressibility, with the soil structure restraining the essentially recoverable deformation. In the post-yield state (p0 < py), a gradual breakdown of the cement bonds occurred as the mean effective stress (p’) increased.
The formulation of the kinematic hardening model requires the parameter values of λ and κ in the ln p’(kPa)-ln (1 + e) space. These values were determined according to Equation (1) and are summarised in Table 7.
λ * = λ 1 + e 0     and   k * = k 1 + e 0

4.2.2. Consolidated Undrained Shear Behaviour

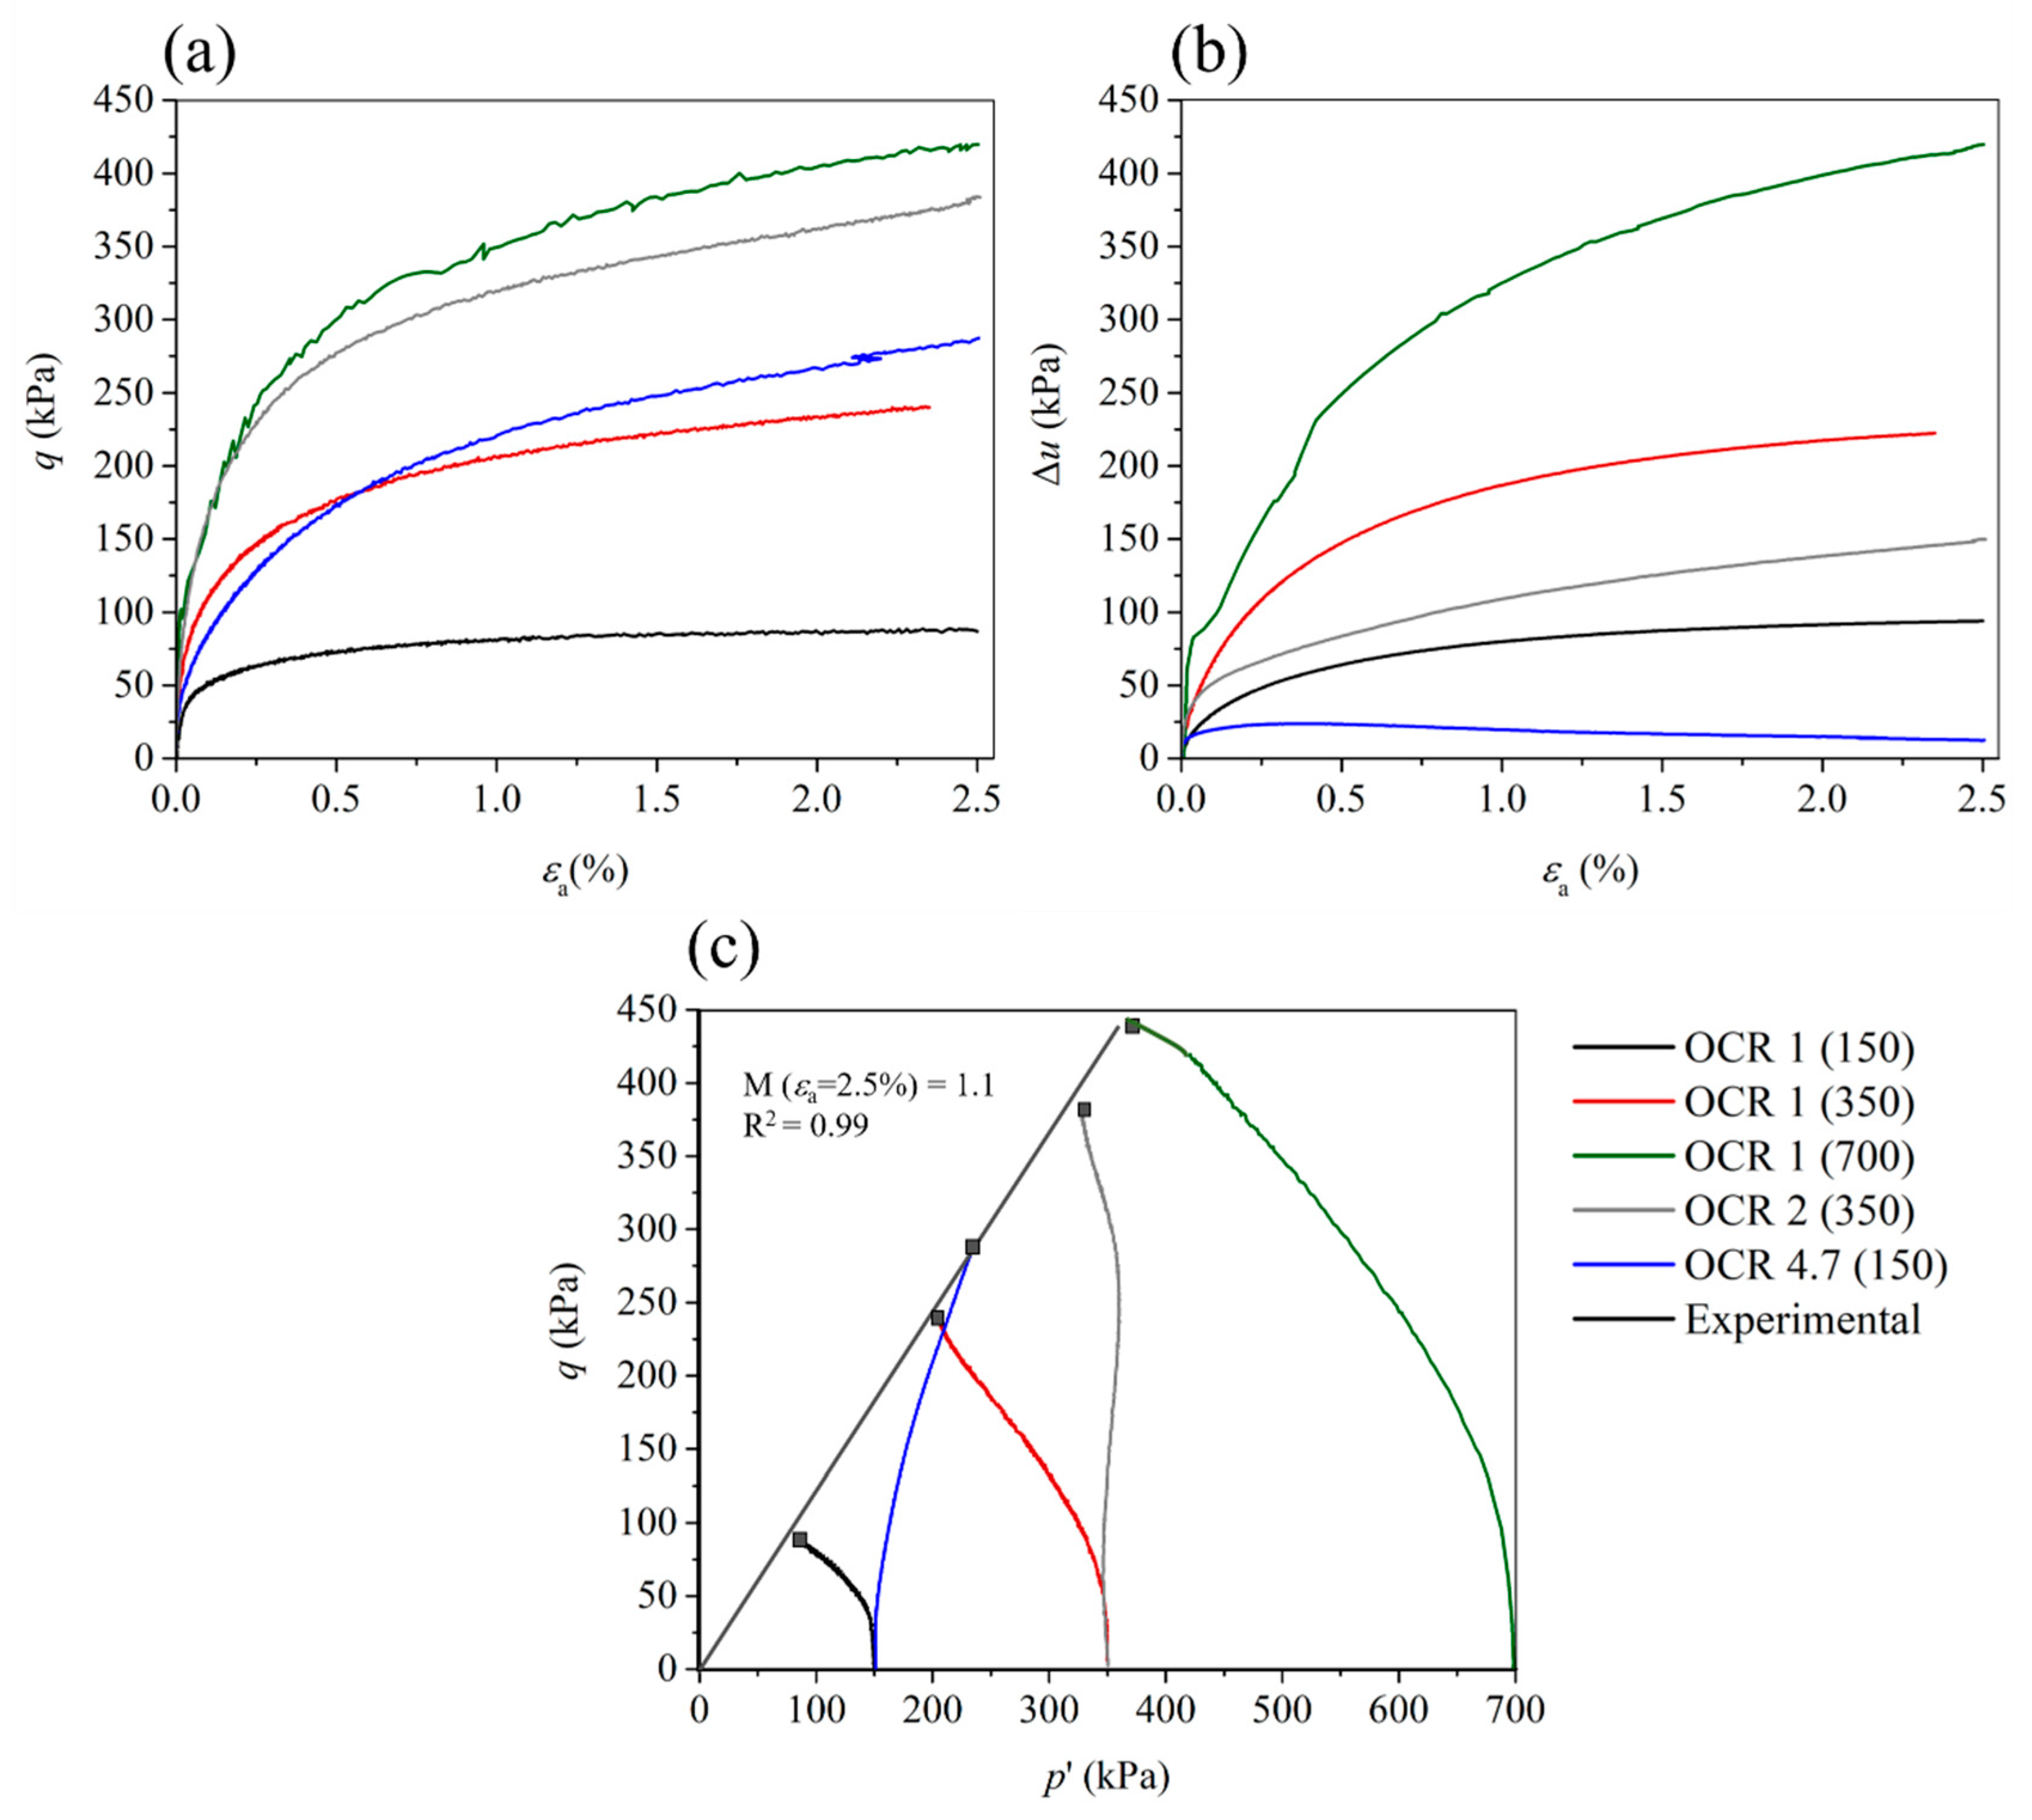
The experimental q (kPa)-εa (%), Δu (kPa)-εa (%), and q (kPa)-p’ (kPa) curves obtained in triaxial tests for the reconstituted clay are shown as solid lines in Figure 6.
A behaviour typical of normally consolidated clays was observed for specimens consolidated with p0 values higher than the isotropic yield stress (p0 > py) (OCR 1 (150), OCR 1 (350), OCR 1 (700)), with the absence of peak deviatoric strengths (Figure 6a) and increase in pore pressures up to the end of the tests (Figure 6b). The increase in pore pressure resulted in a shift of stress path to the left after yielding and before failure (Figure 6d). In the OCR 4.7 (150), the impact of the OCR is clear. Although it is not noticeable in the pore pressure development (Figure 6b) Figure 6d shows a typical stress path of overconsolidated clays, with a slight decrease in the pore pressure before specimen failure, shifting the stress path to the right. The impact of p0 and OCR is clear in the stress–strain curves. There was an increase in the deviatoric strength for εa ≈ 2.5% (Figure 6a) with increased OCR and p0.
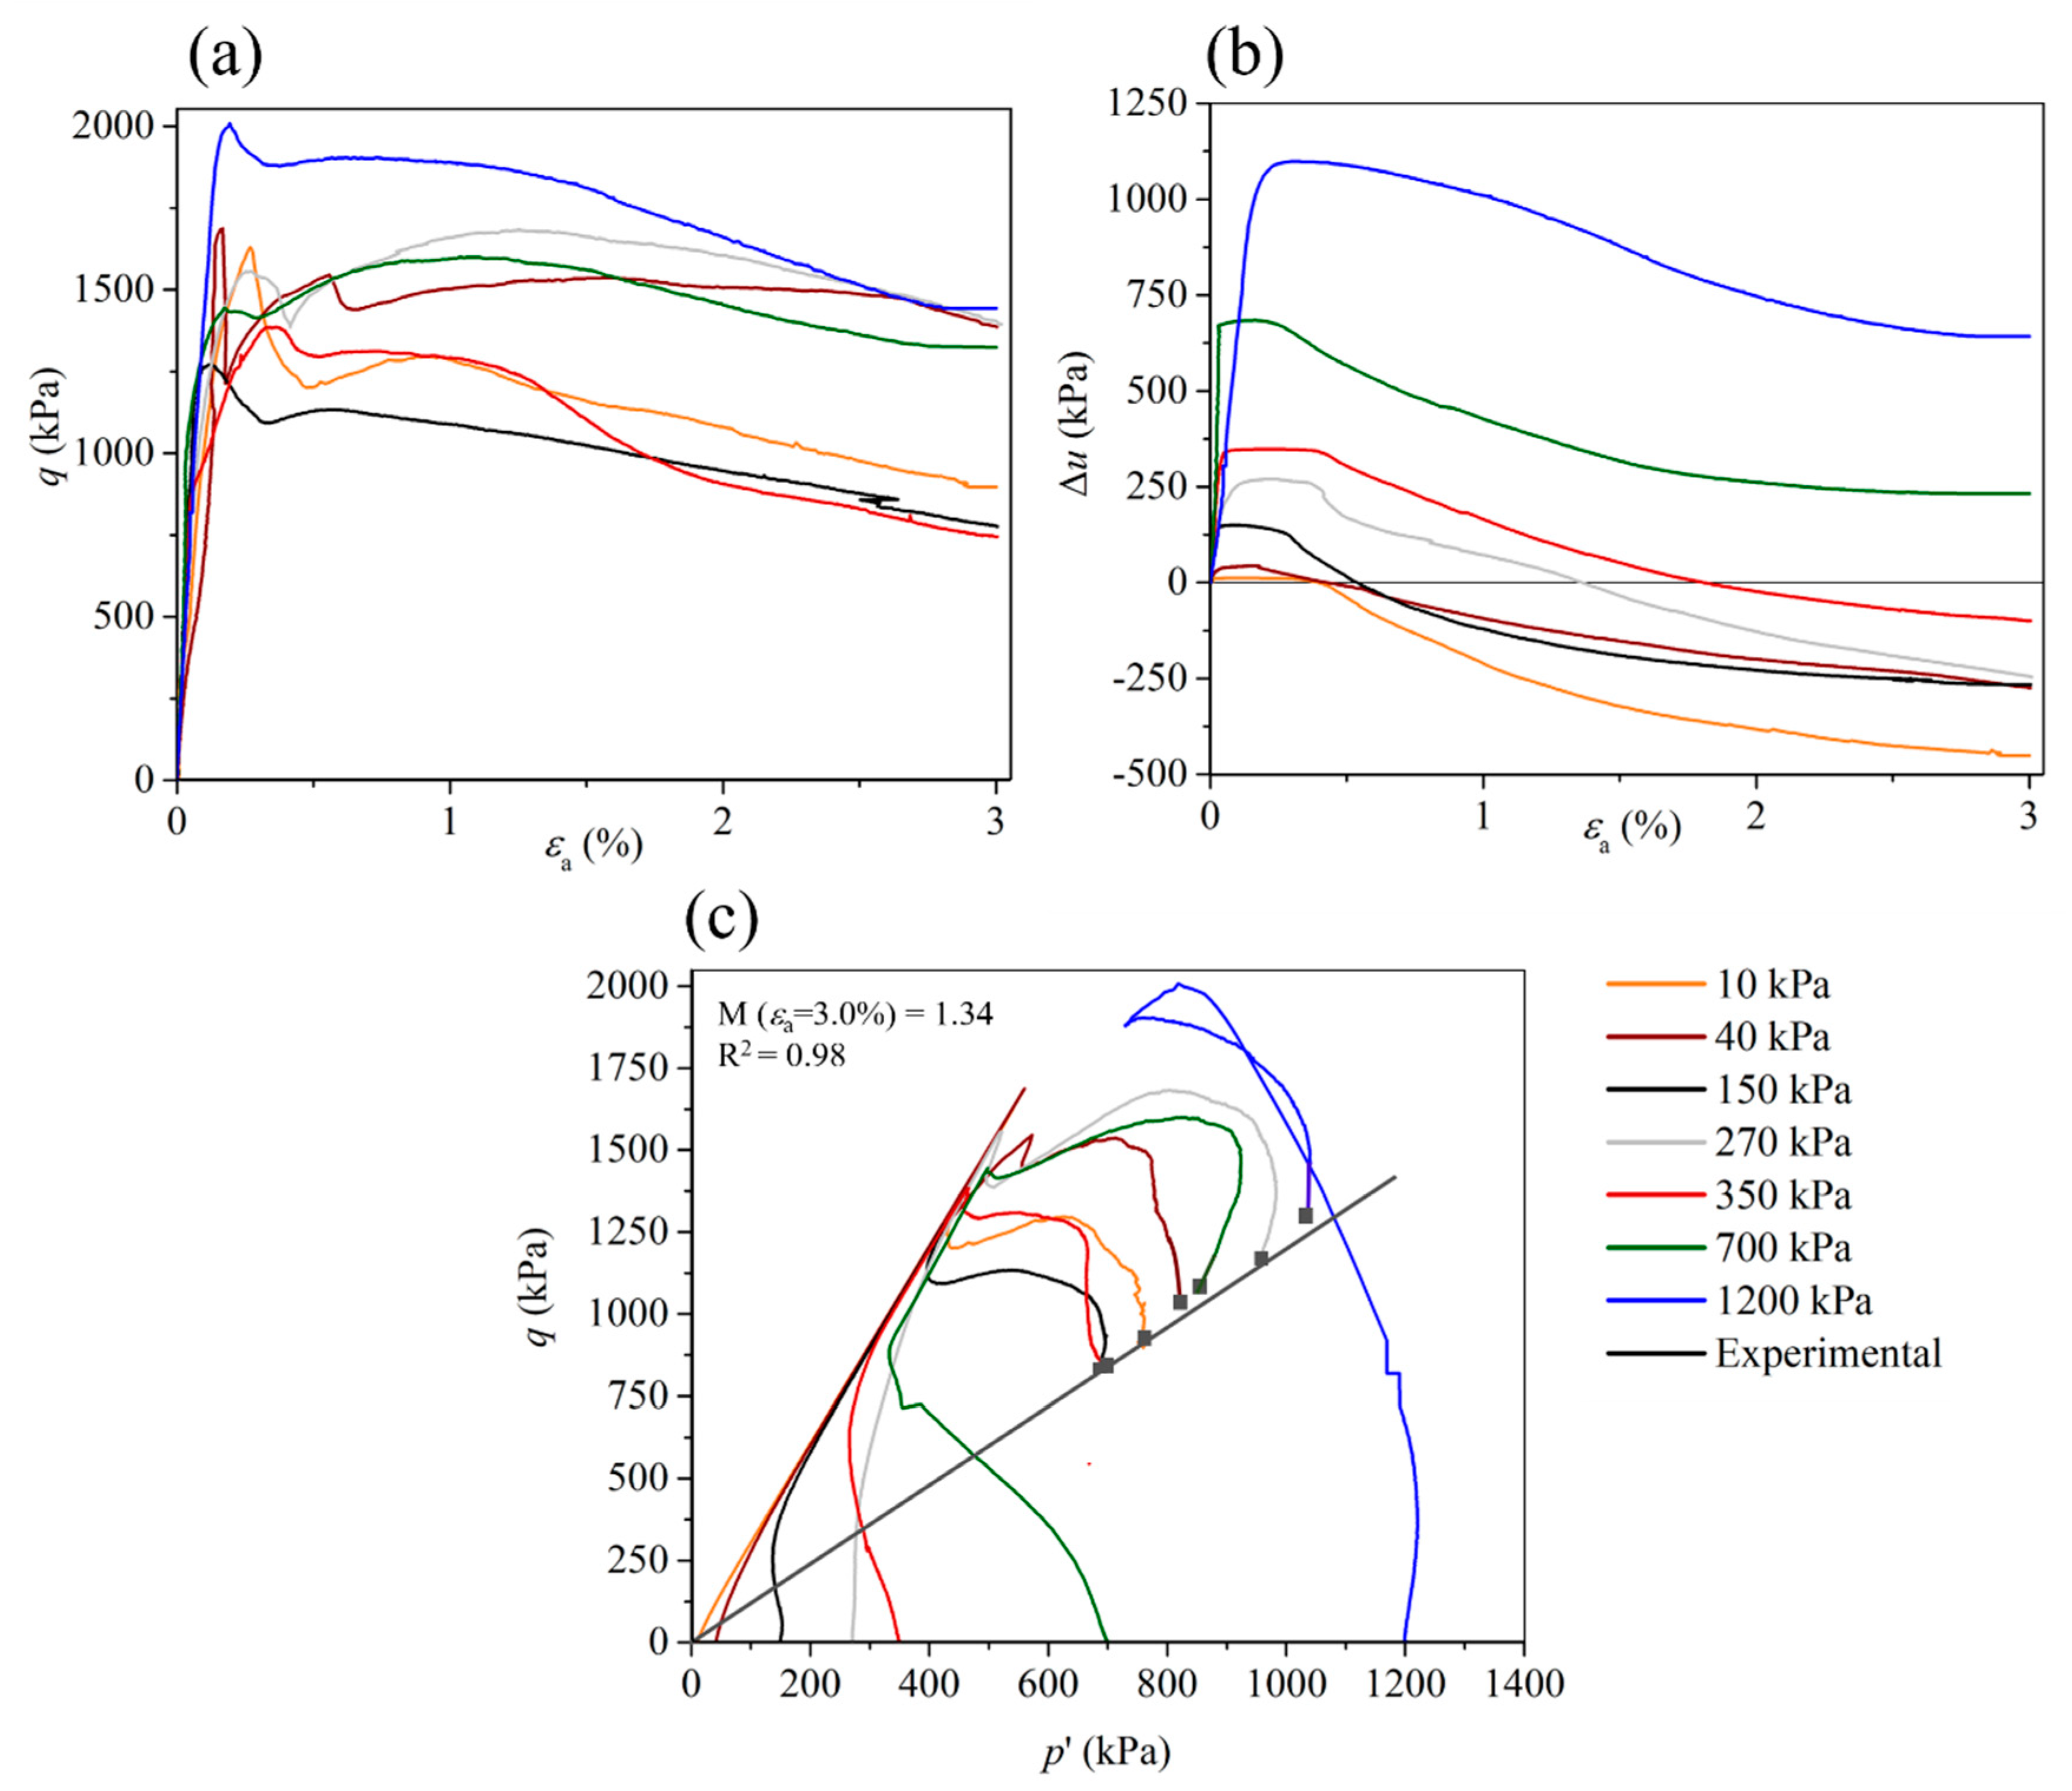
The experimental q (kPa)-εa (%), Δu (kPa)-εa (%), and q (kPa)-p’ (kPa) curves obtained in triaxial tests for the stabilised clay after 28 days are represented in Figure 7 by solid lines. The stress–strain behaviour of the clay changed significantly after the addition of 10%GGBS-NaOH (Figure 7a). This behaviour is characterised by increased values of the peak/post peak deviatoric strength compared to the reconstituted state and by almost linear stress–strain behaviour before a peak, followed by a softening until the end of the tests. The reconstituted clay exhibited nonlinear stress–strain curves before the maximum stress and strain-hardening behaviour for higher p0 values (OCR 1 (350) and OCR 1 (700); Figure 6a). Deviatoric shear strengths (Figure 7a) for εa ≈ 2.5% up to 10, 3.5 and 3.3 times higher than those recorded for the reconstituted clay (Figure 6a) were observed after stabilisation for p0 = 150 kPa, 350 kPa, and 700 kPa, respectively. The peak deviatoric strengths were observed for εa > 0.15% and εa < 1%.
In the pre-yield state (for p0 < py), strain-softening behaviour was observed (Figure 7a) with increased deviatoric stress up to the peak value, followed by a reduction to a lower value of q. The stress–strain curves overlap, with similar values of peak deviatoric strength, even with increasing p0. We believe that this behaviour was caused by the artificial cementation effect within the soil matrix when the state of stress was within the state boundary surface. We believe that, similar cement-treated clays, for p0 < py, the development of artificial cementation within the clay matrix led to an almost insignificant change of the fabric during the consolidation phase (i.e., reorientation of the clay particles); therefore, the increase in p0 did not affect the peak deviatoric strength. In the post-yield state (for p0 > py), strain-softening behaviour post peak strength was also observed for p0 = 1200 kPa (Figure 7a). However, in this case, there was a more evident increase in the peak deviatoric strength, indicating that under this condition, both the progressive breakdown of the cementation and the change in the fabric contributed to the enhancement of the peak strength.
An increase in the pore pressure up to the peak strength at low strain levels followed by a decrease until the end of the test was observed for p0 < py (Figure 7b). In contrasts to observations in the q (kPa)-εa (%) plot (Figure 7a), the trend of u shown in Figure 7b shows that p0 had a significant impact on pore pressure generation, with an increase in the peak of pore pressure with increased p0 in pre-yield and post-yield states. For specimens with p0 ≤ 350 kPa, once u had peaked and started decreasing, it decreased to negative values. For p0 = 1200 kPa (p0 > py) (Figure 7b), there was also an increase in the pore pressure up to the peak and then a slight decrease until the end of the tests. More stable values of u were measured for εa > 2.5%.
For p0 < py, the stress paths are situated on the dry side of the critical state in Figure 7c; first, there was an approach to the peak strength, and then the stress paths shifted to the right before the end of the tests. For p0 > py (i.e., p0 = 1200 kPa), the stress path is similar to that observed for normally consolidated or lightly overconsolidated clays, located on the wet side and shifting to the left after the peak strength before the end of the test.
Behaviour similar to that presented in Figure 7, i.e., two distinct shear responses at p0 values lower (pre-yield state) and higher (post-yield state) than py due to artificial cementation, was also described by other authors in clays stabilised with distinct binders, such as cement, a super-absorbent polymer mixed with ordinary Portland cement and hydrated lime, or fly ash [45,46,47,48].
Regarding the linear region of the stress–strain curves shown Figure 7a, they are almost overlapped, suggesting that the p0 applied on the stabilised clay specimens did not influence the initial stiffness. In other words, no significant increase in stiffness was observed with increased p0.
The shear strength parameters and failure envelopes determined in triaxial tests using the Mohr–Coulomb criterion are shown in Table 8. The shear strength parameters were calculated at εa = 2.5% and εa = 3% for the reconstituted and stabilised clay, respectively.
The reconstituted clay was characterised by a null cohesion (c) at εa = 2.5% under total and effective stresses due to the break of interparticle bonding within the matrix soil during specimen preparation. At εa = 2.5%, a friction angle (ϕ) of 26° was obtained for the clay under effective stress, whereas that obtained under total stress was 13°. In terms of effective peak strength, the stabilised clay failure was characterised by c’ = 429 kPa (induced by the artificial cementation) and ϕ’ of 28°. Under total stress, the peak strength parameters were c = 606 kPa and ϕ = 10°. At εa = 3%, the ϕ was 34°, whereas the ϕ was 12°. These results suggest that the cementation not only added cohesion between clay particles but also made them coarser, increasing their effective friction angle. At εa = 3%, the c’ was null due to the total breakdown of the cementation welding and distortion of the clay fabric during shear. Under total stress, the stabilised clay presented a post-peak c of 375 kPa and ϕ of 12°, which is nearly equal to the ϕ observed before adding 10% GGBS-NaOH.
The failure modes observed on the reconstituted and stabilised clay specimens were quite distinct. Reconstituted specimens exhibited a slight enlargement of the middle section, whereas the stabilised specimens showed the formation of localised shear bands with slopes near to 45°, corresponding to positive dilatancy associated with shear deformation (Figure 8). This is consistent with the decrease in pore pressure recorded from peak deviatoric stress in the Δu (kPa)-εa (%) curves (Figure 7b).

4.3. Leachate Analysis

Table 9 presents the results of the leachate analyses and the limit values for a material to be considered as ‘inert waste’ according to Annex IV of the Portuguese Law-Decree no. 183/2009. Table 9 shows that the concentrations of all elements are below the limit values, so the analysed materials can be classified as ‘inert waste’ in both curing ages. Therefore, the addition of 10% GGBS-NaOH to clay, in addition to considerably improving its mechanical behaviour, resulted in a material classified as inert waste that is unlikely to represent a risk in terms of soil contamination according to thresholds provided by Portuguese Law Decree no. 183/2009.

5. Model Calibration and Predicted Stress–Strain Curves

The kinematic hardening model has 12 input parameters (see Table 1). The fitted set of parameters for the reconstituted and stabilised clay cured for 28 days is shown in Table 10 and Table 11, respectively. The majority of the parameters was manually fitted by means of a trial-and-error procedure (best fitting between the experimental curves with the calibrated curves). The triaxial test results were crucial during this task, as they helped with the estimation of these parameters. Details about the calibration process are presented below.
The first step in the calibration process was the establishment of the initial conditions of the tests, that is, the size of the surfaces (pc0), centre of the bubble yield surface ( α ¯ ), and the centre of the structure surface ( α ^ ) or r0 and η0, in addition to the drainage conditions (drained or undrained).
Within the elastic domain, the response of the model is isotropic, and the elastic properties are expressed by the bulk and shear moduli (K and G) which depend on the pressure (p’). Two parameters are required to describe the elastic behaviour, namely κ* and ν. The ν was fixed at to 0.45 for both the reconstituted and stabilised clays, which is a value close to 0.5 because the triaxial tests were conducted under undrained conditions.
The elastic parameter (κ*) and the plastic/elastic–plastic parameter (λ*) determined in log p’-(1 + e) scale (Table 7) were first converted to the ln p’-ln (1 + e) scale using Equation (1). Both κ* and λ*, which control the stiffness in the elastic region and the peak position on the stress–strain curves, respectively, were introduced into the model and then manually calibrated for each material and p0 applied in the tests. Lower values of κ* were fitted for the stabilised clay cured for 28 days compared to its reconstituted state, which is in line with the isotropic compression results presented in Figure 5.
The parameter M, which controls the geometry of the surfaces, was determined based on the triaxial test results presented Figure 6 and Figure 7 according to the shearing resistance in effective stresses of the reconstituted (ϕ’= 26° at εa = 2.5%) and stabilised (ϕ’= 34° εa = 3%) clay. Although the tests were stopped shortly after failure, the trend of the results suggests that no drop in strength would have occurred under continued strain. Moreover, the initial rapid pore-pressure build-up observed in both materials, which was reduced to a negligible rate when the tests were stopped, together with M adjusted (i.e., R2 value) to close to 1, validate the presented results (see Figure 6b,c and Figure 7b,c). The M parameter was characterised by a straight line with a slope of 1.1 (R2 ≈ 0.99) and 1.34 (R2 ≈ 0.98) for the reconstituted and stabilised clay, respectively.
For the reconstituted clay, the parameter pc0 was also defined based on the triaxial tests, considering the correspondent OCR, according to Equation (2).
p c 0 = p   m a x 2   and   O C R = p   m a x p   f i n a l
where:
  • p m a x is the maximum pressure applied during the consolidation phase; and
  • p   f i n a l is the final pressure applied during the consolidation phase, which was equal to p0 at the beginning of the shear phase.
The applied pmax was 700 kPa for OCR 4.7 (150) and OCR 2 (350) specimens, in agreement with the values of the parameter pc0 introduced in the model (Table 10).
For the stabilised clay, the parameter pc0 was not directly determined based on the triaxial tests. The development of artificial cementation within the clay matrix led to the enlargement of the structure surface, which implies that both the size of the surfaces (represented by pc0) and parameter r0, which describes the relative sizes of the structure and references surfaces, increased to unknown values. The values of these two parameters were then manually fitted using a trial-and-error procedure (best fitting between the experimental and calibrated curves). The parameter pc0 was varied from 84 kPa–362 kPa (reconstituted clay) to 475 kPa–610 kPa (stabilised clay), whereas the parameter r0 was varied from 1.2 (reconstituted clay) to 2–5 (stabilised clay) (Table 10 and Table 11). The parameter r0 was fixed close to 1 for the clay, as it is a reconstituted soil, meaning that the structure and reference surfaces have the same shapes. The increase in r0 led to a higher and sharper peak in the stress–strain relationship predicted by the model. On the reconstituted clay specimens, the increase in p0 led to an increase in pc0. However, no trend was observed on the stabilised clay. These parameter values are in line with the observed experimental behaviour, whereby the peak and post-peak strengths increased with increased p0 for the clay (Figure 6a), unlike the stabilised clay specimens (Figure 7a).
According to the SEM images presented in Figure 4, both reconstituted and stabilised clays were idealized as isotropic materials, i.e., η0 = 0.
Destructuration is controlled by two parameters, A and k. Parameter A controls the relative contribution of distortional and volumetric plastic strains during destructuration, in the range of 0 < A < 1. For the reconstituted clay, A was fixed to 1, so the destructuration process was entirely caused by the distortional component of the damaged strain, which predominantly occurs under undrained conditions (Table 10). For the stabilised clay, the best fit between the experimental and the calibrated curves was achieved for A values close to 0 (Table 11). The parameter k expresses the rate of damage to the structure with plastic strain, and it was manually calibrated for both materials for the p0 applied during the shear phase. A reduction in k increases the peak strength and stiffness because the rate of destructuration is reduced.
The remaining three parameters introduced by the bubble surface, i.e., the ratio of sizes of the bubble and the reference surface (R), the stiffness interpolation parameter (B), and the stiffness interpolation exponent (Ψ), were fitted using a trial-and-error procedure until a good match between the experimental and calibrated curves was achieved. The increase in B led to a higher peak in the stress–strain plot and an increase in the plastic-hardening modulus. An increased value of Ψ led to softer behaviour from small to large strain levels or, in other words, to lower values of the overall deviatoric strength response. Lower values of R led to a stiffer response in the low-strain region, with increased values of peak and residual strengths.
Figure 9a–c and Figure 10a,b present the experimental stress–strain curves and the predicted curves using the kinematic hardening model. Solid lines represent the experimental behaviour determined through triaxial tests, whereas the dotted lines represent the model predictions using the fitted set of parameters presented in Table 10 and Table 11.
The good fit between the experimental stress–strain curves and the predicted curves using the kinematic hardening model revealed the potential of the model for application in different materials than for which it was initially formulated. The model accurately predicted the trend of the strain-hardening behaviour observed for the reconstituted clay before peak strength (Figure 9a). The experimental strain-softening behaviour for almost all stabilised clay specimens was also well-predicted by the model for the wide range of applied p0 values (Figure 10a). The peak and post-peak shear strengths predicted by the model also generally coincide with those observed in the tests. The smooth response suggests that plastic deformations and hardening occurred as the bubble began to move inside the structure surface. The dependence of the shear modulus on the mean effective stress, together with the variation in plastic stiffness as the bubble approached the structure surface, allow to model more accurately predict the non-linearity of these curves. All the predicted effective stress paths for the reconstituted clay (Figure 9b) are similar to the experimental data and converge toward the critical state line.

6. Conclusions

The mechanical behaviour of reconstituted and stabilised clay with high water content was investigated after 28 days of curing by means of consolidated undrained triaxial tests. The clay was stabilised using an alkali-activated binder composed of 10% GGBS-NaOH. The stress–strain curves for both materials were predicted using a kinematic hardening constitutive model formulated for natural clays. This was the first attempt to use this constitutive model in artificially cemented clays. SEM-EDS and XRD analyses, as well as leachate tests, were carried out after 28 and 90 days to complement the experimental campaign. The main conclusions of this research are summarized below.
  • The main gel phase formed was N, C-A-S-H, with a low CaO/SiO2 ratio. No risk of soil contamination was detected after adding 10% GGBS-NaOH to the clay in both curing periods.
  • The mechanical behaviour of the clay drastically changed after adding the binder, with increased peak/post-peak shear strengths and yield stress, which indicates the potential of the alkali-activated binder, even when applied to soils with high water content. We believe that for p0 < py, the consolidation phase did not have a significant impact on the rearrangement of the clay particles; therefore, the increase in p0 did not lead to an increase in peak/post-peak shear strength, and the stress path was located on the dry side of the critical state. For p0 > py, we believe that both the fabric and cemented structure contributed to the strength. The stress path is located on the wet side of the critical state. Concerning the shear strength parameters, the binder added cohesion to the clay matrix and made the particles coarser, increasing the friction angle.
  • The stress–strain curves for both reconstituted and stabilised clay were accurately predicted using the kinematic hardening model for the wide range of applied p0 values, demonstrating the potential of the model to be applied in artificially cemented clays, in addition to natural and reconstituted clays.
Additional studies, in particular triaxial tests, are necessary. These additional studies should be conducted using different confining pressures, including different test types (e.g., isotropic compression tests, overconsolidated tests, etc). A more complex approach is required to establish increased confidence levels, which will enable the widespread application of such alternative cements.

Author Contributions

Conceptualization, N.C. and T.M.; methodology, N.A and M.R.; validation, N.C, T.M and N.A.; formal analysis, M.R; investigation, M.C.-S. and N.A.; resources, N.C and T.M.; writing—original draft preparation, M.C.-S. and T.M.; writing—review and editing, T.M. and N.C.; supervision, N.A. and T.M.; project administration, N.C. and T.M. All authors have read and agreed to the published version of the manuscript.

Funding

This work was funded by the Project “MINECO- New Eco-innovative Materials for Mining Infra” with reference ERA-MIN/0002/2018 and by a Ph.D. scholarship with reference SFRH/BD/132692/2017 financed by the Portuguese Foundation for Science and Technology (FCT) and the European Social Fund (FSE).

Data Availability Statement

The model used during the study is available online at https://www.icevirtuallibrary.com/doi/10.1680/geot.2000.50.2.153 (accessed on 18 October 2022). All data generated and used during the study are available from the corresponding author by request.

Conflicts of Interest

The authors declare no conflict of interest.

List of Symbols

νPoisson ratio
ΨStiffness interpolation exponent
ωWater content
λSlope of the normal compression line
ϕFriction angle
λ*Slope of normal compression line in ln p’-ln (1 + e) space
η0Anisotropy of initial structure
εaAxial strain
ρdDry density
εqShear strain
ΔuPore pressure variation
ADestructuration strain parameter
BStiffness interpolation parameter
cCohesion
ccCompression index
crRecompression index
C-S-HCalcium silicate hydrate
CSLCritical state line
e0Initial void ratio
EsecSecant stiffness modulus
GSpecific gravity
GShear modulus
GGBSGranulated blast furnace slags
GmaxMaximum shear modulus
kDestructuration parameter
kSlope of the swelling line
k*Slope of swelling line in ln p’-ln (1 + e) space
LLLiquid limit
MCritical state stress ratio
OCROverconsolidation ratio
OPCOrdinary Portland cement
pfinalFinal effective stress applied during consolidation phase
pmaxMaximum effective stress applied during consolidation phase
pEffective mean stress
p0Initial mean effective stress
pyYield stress
pc0Initial centre of reference surface
PIPlasticity index
PLPlastic limit
qDeviatoric stress
qpeakPeak deviatoric strength
RRatio of size of bubble and reference surface
r0Initial degree of structure
tsTravel time of the S-wave
ρd,maxMaximum dry density
ωoptOptimum water content

References

  1. Lei, Y.; Zhang, Q.; Nielsen, C.; He, K. An inventory of primary air pollutants and CO2 emissions from cement production in China, 1990–2020. Atmos. Environ. 2011, 45, 147–154. [Google Scholar] [CrossRef]
  2. Xi, F.; Davis, S.J.; Ciais, P.; Crawford-Brown, D.; Guan, D.; Pade, C.; Shi, T.; Syddall, M.; Lv, J.; Ji, L.; et al. Substantial global carbon uptake by cement carbonation. Nat. Geosci. 2016, 9, 880–883. [Google Scholar] [CrossRef] [Green Version]
  3. Andrew, R.M. Global CO2 emissions from cement production. Earth Syst. Sci. Data. 2018, 10, 195. [Google Scholar] [CrossRef] [Green Version]
  4. Zhang, S.; Keulen, A.; Arbi, K.; Ye, G. Waste glass as partial mineral precursor in alkali-activated slag/fly ash system. Cem. Concr. Res. 2017, 102, 29–40. [Google Scholar] [CrossRef] [Green Version]
  5. Palomo, Á.; Kavalerova, E.; Fernández-Jiménez, P.; Krivenko, A.; García-Lodeiro, O.; Maltseva, I. A review on alkaline activation: New analytical perspectives. Mater. Construc. 2015, 64, e022. [Google Scholar] [CrossRef] [Green Version]
  6. Davidovits, J. Geopolymer Cement a Review; Technical Paper; Geopolymer Science and Technics: Saint-Quentin, France, 2013; Volume 21, pp. 1–11. [Google Scholar]
  7. Xu, S.; Yuan, P.; Liu, J.; Pan, Z.; Liu, Z.; Su, Y.; Li, J.; Wu, C. Development and preliminary mix design of ultra-high-performance concrete based on geopolymer. Constr. Build. Mater. 2021, 308, 125110. [Google Scholar] [CrossRef]
  8. Lao, J.C.; Xu, L.Y.; Huang, B.T.; Dai, J.G.; Shah, S.P. Strain-hardening Ultra-High-Performance Geopolymer Concrete (UHPGC): Matrix design and effect of steel fibers. Compos. Commun. 2022, 30, 101081. [Google Scholar] [CrossRef]
  9. Wetzel, A.; Middendorf, B. Influence of silica fume on properties of fresh and hardened ultra-high performance concrete based on alkali-activated slag. Cem. Concr. Compos. 2019, 100, 53–59. [Google Scholar] [CrossRef]
  10. Cristelo, N.; Soares, E.; Rosa, I.; Miranda, T.; Oliveira, D.V.; Silva, R.A.; Chaves, A. Rheological properties of alkaline activated fly ash used in jet grouting applications. Constr. Build. Mater. 2013, 48, 925–933. [Google Scholar] [CrossRef] [Green Version]
  11. Cristelo, N.; Miranda, T.; Oliveira, D.V.; Rosa, I.; Soares, E.; Coelho, P.; Fernandes, L. Assessing the production of jet mix columns using alkali activated waste based on mechanical and financial performance and CO2 (eq) emissions. J. Clean. Prod. 2015, 102, 447–460. [Google Scholar] [CrossRef]
  12. Miranda, T.; Leitão, D.; Oliveira, J.; Corrêa-Silva, M.; Araújo, N.; Coelho, J.; Fernandez-Jimenez, A.; Cristelo, N. Application of alkali-activated industrial wastes for the stabilisation of a full-scale (sub)base layer. J. Clean. Prod. 2020, 242, 118427. [Google Scholar] [CrossRef]
  13. Fasihnikoutalab, M.H.; Pourakbar, S.; Ball, R.J.; Unluer, C.; Cristelo, N. Sustainable soil stabilisation with ground granulated blast-furnace slag activated by olivine and sodium hydroxide. Acta Geotech. 2020, 15, 1981–1991. [Google Scholar] [CrossRef]
  14. Sargent, P.; Hughes, P.N.; Rouainia, M.; White, M.L. The use of alkali activated waste binders in enhancing the mechanical properties and durability of soft alluvial soils. Eng. Geol. 2013, 152, 96–108. [Google Scholar] [CrossRef]
  15. Singhi, B.; Laskar, A.I.; Ahmed, M.A. Investigation on Soil–Geopolymer with Slag, Fly Ash and Their Blending. Arab. J. Sci. Eng. 2016, 41, 393–400. [Google Scholar] [CrossRef]
  16. Yi, Y.; Li, C.; Liu, S. Alkali-activated ground-granulated blast furnace slag for stabilization of marine soft clay. J. Mater. Civ. Eng. 2015, 27, 04014146. [Google Scholar] [CrossRef]
  17. Zhang, M.; Guo, H.; El-Korchi, T.; Zhang, G.; Tao, M. Experimental feasibility study of geopolymer as the next-generation soil stabilizer. Constr. Build. Mater. 2013, 47, 1468–1478. [Google Scholar] [CrossRef]
  18. Zhang, M.; Zhao, M.; Zhang, G.; Nowak, P.; Coen, A.; Tao, M. Calcium-free geopolymer as a stabilizer for sulfate-rich soils. Appl. Clay Sci. 2015, 108, 199–207. [Google Scholar] [CrossRef]
  19. Li, Y.; Li, J.; Cui, J.; Shan, Y.; Niu, Y. Experimental study on calcium carbide residue as a combined activator for coal gangue geopolymer and feasibility for soil stabilization. Constr. Build. Mater. 2021, 312, 125465. [Google Scholar] [CrossRef]
  20. Kaze, R.C.; Naghizadeh, A.; Tchadjie, L.; Adesina, A.; Djobo, J.N.Y.; Nemaleu, J.G.D.; Kamseu, E.; Melo, U.C.; Tayeh, B.A. Lateritic soils based geopolymer materials: A review. Constr. Build. Mater. 2022, 344, 128157. [Google Scholar] [CrossRef]
  21. Santhikala, R.; Chandramouli, K.; Pannirselvam, N. Stabilization of expansive soil using flyash based geopolymer. Mater. Today Proc. 2022, in press. [Google Scholar] [CrossRef]
  22. Luo, Z.; Zhang, B.; Zou, J.; Luo, B. Sulfate erosion resistance of slag-fly ash based geopolymer stabilized soft soil under semi-immersion condition. Case Stud. Constr. Mater. 2022, 17, e01506. [Google Scholar] [CrossRef]
  23. Abdullah, H.H.; Shahin, M.A.; Walske, M.L. Geo-mechanical behavior of clay soils stabilized at ambient temperature with fly-ash geopolymer-incorporated granulated slag. Soils Found. 2019, 59, 1906–1920. [Google Scholar] [CrossRef]
  24. Corrêa-Silva, M.; Miranda, T.; Rouainia, M.; Araújo, N.; Glendinning, S.; Cristelo, N. Geomechanical behaviour of a soft soil stabilised with alkali-activated blast-furnace slags. J. Clean. Prod. 2020, 267, 122017. [Google Scholar] [CrossRef]
  25. Rios, S.; Cristelo, N.; da Fonseca, A.V.; Ferreira, C. Stiffness Behavior of Soil Stabilized with Alkali-Activated Fly Ash from Small to Large Strains. Int. J. Geomech. 2017, 17, 04016087. [Google Scholar] [CrossRef] [Green Version]
  26. Sargent, P.; Rouainia, M.; Diambra, A.; Nash, D.; Hughes, P.N. Small to large strain mechanical behaviour of an alluvium stabilised with low carbon secondary minerals. Constr. Build. Mater. 2020, 232, 117174. [Google Scholar] [CrossRef]
  27. Horpibulsuk, S.; Liu, M.D.; Liyanapathirana, D.S.; Suebsuk, J. Behaviour of cemented clay simulated via the theoretical framework of the Structured Cam Clay model. Comput. Geotech. 2010, 37, 1–9. [Google Scholar] [CrossRef]
  28. Yapage, N.; Liyanapathirana, D. A review of constitutive models for cement-treated clay. Int. J. Geotech. Eng. 2019, 13, 525–537. [Google Scholar] [CrossRef]
  29. Rouainia, M.; Wood, D.M. A kinematic hardening constitutive model for natural clays with loss of structure. Géotechnique 2000, 50, 153–164. [Google Scholar] [CrossRef]
  30. Elia, G.; Rouainia, M. Investigating the cyclic behaviour of clays using a kinematic hardening soil model. Soil Dyn. Earthq. Eng. 2016, 88, 399–411. [Google Scholar] [CrossRef]
  31. ASTM D 2487; Standard Practice for Classification of Soils for Engineering Purposes (Unified Soil Classification System). ASTM International: West Conshohocken, PA, USA, 2011. [CrossRef]
  32. AASHTO M 145-91; Standard Specification for Classification of Soils and Soil-Aggregate Mixtures for Highway Construction Purposes. American Association of State and Highway Transportation Officials: Washington, DC, USA, 2017.
  33. BS 1377 2; Methods of Test for Soils for Civil Engineering Purposes-Part 2: Classification Tests. British Standard Institution: London, UK, 1990.
  34. NP 83; Determination of the Volume Weight of Solid Particles. Portuguese Standard: Caparica, Portugal, 1965.
  35. BS 1377 4; Method of Test for Soils for Civil Engineering Purposes—Part 4: Compaction-Related Tests. British Standard Institution: London, UK, 1990.
  36. BS 1377 5; Method of Test for Soils for Civil Engineering Purposes—Part 5: Compressibility, Permeability and Durability Tests. British Standard Institution: London, UK,, 1990.
  37. Liu, W.; Tang, X.; Yang, Q. A slurry consolidation method for reconstitution of triaxial specimens. KSCE J. Civ. Eng. 2017, 21, 150–159. [Google Scholar] [CrossRef]
  38. ASTM D 1632; Standard Practice for Making and Curing Soil-Cement Compression and Flexure Test Specimens in the Laboratory. ASTM International: West Conshohocken, PA, USA, 2007.
  39. EuroSoilStab. Development of Design and Construction Methods to Stabilise Soft Organic Soils: Design Guide Soft Soil Stabilisation; European Commission: Brussels, Belgium, 2002. [Google Scholar]
  40. BS 1377 8; Methods of Test for Soils for Civil Engineering Purposes—Part 8: Shear Strength Tests (Effective Stress). British Standard Institution: London, UK, 1990.
  41. Zhang, J.; Scherer, G.W. Comparison of methods for arresting hydration of cement. Cem. Concr. Res. 2011, 41, 1024–1036. [Google Scholar] [CrossRef]
  42. EN 12457-4; Characterisation of Waste-Leaching-Compliance Test for Leaching of Granular Waste Materials and Sludges—Part, 4: One Stage Batch Test at a Liquid to Solid Ratio of 10 L/kg for Materials with Particle Size Bellow 10 mm (withot or with Size Reduction). British Standard Institution: London, UK, 2002.
  43. Law Decree n. 183. Legal Regime for the Deposition of Landfill Waste; Republic Diary n. 153/2009, Series I of 2009-08-10; Ministry of Environment, Territorial Planning and Regional Development: Lisbon, Portugal, 2009; Volume 153, pp. 5170–5198. (In Portuguese)
  44. Garcia-Lodeiro, I.; Palomo, A.; Fernández-Jiménez, A.; Macphee, D.E. Compatibility studies between N-A-S-H and C-A-S-H gels. Study in the ternary diagram Na2O–CaO–Al2O3–SiO2–H2O. Cem. Concr. Res. 2011, 41, 923–931. [Google Scholar] [CrossRef]
  45. Horpibulsuk, S.; Miura, N.; Bergado, D.T. Undrained Shear Behavior of Cement Admixed Clay at High Water Content. J. Geotech. Geoenviron. Eng. 2004, 130, 1096–1105. [Google Scholar] [CrossRef]
  46. Kamruzzaman, A.H.; Chew, S.H.; Lee, F.H. Structuration and Destructuration Behavior of Cement-Treated Singapore Marine Clay. J. Geotech. Geoenviron. Eng. 2009, 135, 573–589. [Google Scholar] [CrossRef]
  47. Bian, X.; Cao, Y.-P.; Wang, Z.-F.; Ding, G.-Q.; Lei, G.-H. Effect of Super-Absorbent Polymer on the Undrained Shear Behavior of Cemented Dredged Clay with High Water Content. J. Mater. Civ. Eng. 2017, 29, 04017023. [Google Scholar] [CrossRef]
  48. Efthymiou, S.; Kavvadas, M. The Behavioural Framework of a Lightly Cemented High Plasticity Clay Under Low Effective Stresses. Geotech. Geol. Eng. 2019, 37, 4269–4283. [Google Scholar] [CrossRef]
Figure 1. Rouainia and Muir Wood [29] model surfaces.
Sustainability 14 13736 g001
Figure 2. Particle size distributions of the clay and GGBS.
Sustainability 14 13736 g002
Figure 3. XRD spectrum results.
Sustainability 14 13736 g003
Figure 4. SEM images of the reconstituted (a) and stabilised clay after 28 (b) and 90 (c) days and the respective EDS data (d).
Sustainability 14 13736 g004
Figure 5. Isotropic compression response of the reconstituted and stabilised clay after 28 days of curing.
Sustainability 14 13736 g005
Figure 6. Triaxial test results for the reconstituted clay: (a) q (kPa)-εa (%), (b) Δu (kPa)-εa (%), (c) q (kPa)-p’ (kPa).
Sustainability 14 13736 g006
Figure 7. Triaxial test results for the stabilised clay after 28 days: (a) q (kPa)-εa (%), (b) Δu (kPa)-εa (%), (c) q (kPa)-p’ (kPa).
Sustainability 14 13736 g007
Figure 8. Stabilised clay specimen (a) before testing and (b) after failure for p0 = 350 kPa.
Sustainability 14 13736 g008
Figure 9. Experimental and predicted curves from triaxial tests for the reconstituted clay: (a) q (kPa)-εa (%), (b) local zoom of q (kPa)-εa (%) graph between 0 and 0.75%, (c) q (kPa)-p’ (kPa).
Sustainability 14 13736 g009
Figure 10. Experimental and predicted curves from triaxial tests for the stabilised clay: (a) q (kPa)-εa (%), (b) local zoom of q (kPa)-εa (%) graph between 0 and 0.5%.
Sustainability 14 13736 g010
Table 1. Model parameters [29].
Symbol
mRatio of Extension and Compression Strengths
pc0Initial Centre of Reference Surface
Elastic/elastic–plastic parameters introduced by the modified Cam clay type of modelk*Slope of swelling line in ln p’(kPa)–ln (1 + e) space
λ*Slope of normal compression line in ln p’(kPa)–ln (1 + e) space
MCritical-state stress ratio
νPoisson ratio
Parameters introduced by the bubble modelRRatio of bubble size and reference surface
BStiffness interpolation parameter
ΨStiffness interpolation exponent
Parameters introduced by the structure surfaceADestructuration strain parameter
kDestructuration parameter
η0Anisotropy of initial structure
r0Initial degree of structure
Table 2. Physical properties of the clay.
Atterberg limits [33]Liquid limit58%
Plastic limit15%
Plasticity index43%
Specific gravity [34]G2.57
Compaction [35]Optimum water content20.4%
Maximum dry density1.44 Mg/m3
Oedometer test (a) [36]Compression index0.274
Recompression index0.048
(a) Reconstituted soil specimen built based on the slurry consolidation method described by Liu et al. [37], with water content (ω) and dry density (ρd) of 44% and 1.16 Mg/m3, respectively.
Table 3. Clay and GGBS compositions obtained from EDS analysis of two specimens for each material, each comprising 10 points.
Element (wt.%)Al2O3CaOCuOFe2O3K2OMgOMnONa2OSO3SiO2TiO2
Clay38.130.090.040.60.960.77-0.30.2358.6
GGBS12.3437.290.170.351.168.920.61-2.5535.920.69
Table 4. Binder dosages.
Binder Two Parts of GGBS–One Part of NaOH
Soil (%)Water (%)GGBS (%)NaOH (%)
5% GGBS-NaOH95443.331.67
10% GGBS-NaOH90446.673.33
12.5% GGBS-NaOH87.5448.334.17
15% GGBS-NaOH8544105
Table 5. UCS test results after 28 days of curing.
BinderUCSmax (kPa)
Reconstituted clay54
5% GGBS-NaOH130
10% GGBS-NaOH2780
12.5% GGBS-NaOH4170
15% GGBS-NaOH5570
Table 6. Triaxial tests.
MaterialSpecimen IDOCRpmax (kPa)pfinal (kPa) = p0 (kPa)
Reconstituted clayOCR 1 (150)1150150
OCR 1 (350)1350350
OCR 1 (700)1700700
OCR 2 (350)2700350
OCR 4.7 (150)4.7700150
Stabilised clay1011010
4014040
1501150150
2701270270
3501350350
7001700700
1200112001200
Table 7. Isotropic compression results for the reconstituted and stabilised clay after 28 days.
Materiallog p’−(1 + e) Spaceln p’−ln (1 + e) Space
λ λ*κ*
Reconstituted clay0.24210.00830.10930.0037
Stabilised clay after 28 days0.03810.00740.01720.0034
Yield stress (py) (kPa)55745
Table 8. Shear strength parameters.
Effective StressTotal Stress
PeakPost PeakPeakPost Peak
c’ (kPa)ϕ’ (°)c’ (kPa)ϕ’ (°)c (kPa)ϕ (°)c (kPa)ϕ (°)
Reconstituted clay--026--013
Stabilised clay429280346061037512
Table 9. Leachate results and the limit values established by Law Decree no. 183/2009 for inert waste.
ElementLimit Values for ‘Inert Waste’ (mg/kg) (Annex V Law No. 183/2009)Leachate Results
ClayStabilised Clay after 28 DaysStabilised Clay after 90 Days
As0.50.00.30.3
Cr0.50.010.00.0
Cu2.00.00.00.0
Ni0.40.00.00.1
Pb0.50.00.00.0
Zn4.00.00.00.0
Clorets80013.113.012.7
Sulphate10009.3104.849.8
Table 10. Fitted set of kinematic hardening model parameters for reconstituted clay proposed in [29].
Model ParameterReconstituted Clay
OCR 1 (150)OCR 1 (350)OCR 1 (700)OCR 2 (350)OCR 4.7 (150)
pc084186362350352
k*0.0001480.000130.0001920.0000810.000108
λ*0.040.0630.10.80.1
M1.11.11.11.11.1
ν0.450.450.450.450.45
R0.30.230.190.10.14
B88888
Ψ2.82.83.23.53.8
A11111
k4.60.80.84.64.6
η000000
r01.21.21.21.21.2
Table 11. Fitted set of kinematic hardening model parameters for stabilised clay after 28 days of curing.
Model ParameterStabilised Clay after 28 Days
p0 = 10 kPap0 = 40 kPap0 = 150 kPap0 = 270 kPap0 = 350 kPap0 = 700 kPap0 = 1200 kPa
pc0610610475475475475580
k*0.000020.0000350.0000320.0000230.000020.000010.00013
λ*0.020.0350.030.0250.050.030.025
M1.31.31.31.31.31.31.3
ν0.450.450.450.450.450.450.45
R0.030.030.030.030.030.030.03
B2441.62.51.90.9
Ψ1.81.81.85.55.55.55.1
A0.10.10.10.10.50.30.3
k3.112.81.33.51.151.15
η00000000
r02.052.052.055555
Publisher’s Note: MDPI stays neutral with regard to jurisdictional claims in published maps and institutional affiliations.