Abstract
The crop production and limited freshwater resources in the Central Rift Valley (CRV) Lake Basin of Ethiopia have been facing pressure from warmer and drier climates. Thus, irrigation with the goal of increasing water use efficiency and the productivity of rainfed agriculture is vital to address climate effects, water scarcity, and food security. This study is aimed at assessing the sustainability of winter wheat production under climate change, and irrigation as an adaptation measure to improve yield, crop water productivity (CWP), and irrigation water productivity (IWP) in the CRV of Ethiopia. AquaCrop is applied to evaluate the effects of climate change and simulate irrigation as an adaptation measure. The analysis covers the baseline (1981–2020) and future (2026–2095) periods with each period categorized into three rainfall years (wet, normal, and dry). The future period is described using two representatives’ concentration pathways (RCP4.5 and PCP8.5) scenarios. The results under rainfed and future climate conditions show that the winter wheat yield and CWP are projected to be lowered as compared to the baseline period. Most importantly, a significant reduction in wheat yield and CWP is noticed during the dry years (−60% and −80%) compared to the wet years (−30% and −51%) and normal years (−18% and −30%), respectively. As compared to rainfed agriculture, irrigation significantly reduces the risk of wheat yield decline and improves the CWP. Irrigation is also able to improve the CWP of rainfed wheat production ranging from 0.98–1.4 kg/m3 to 1.48–1.56 kg/m3. A projected CWP improvement of 1.1–1.32 kg/m3 under irrigation is possible from 0.87–1.1 kg/m3 under rainfed conditions. The study concludes that optimizing irrigation as a climate-change-adapting strategy in the CRV has a more pronounced positive impact to the rainfed production system, especially for the dry and normal years.
1. Introduction
Climate change explains 30–50 percent of the global water productivity and crop yield variability [1]. This is mostly because of water shortages, which is directly or indirectly connected with rainfall variability [2,3,4,5]. Climate change, water, and agriculture interact strongly [6]. That is why a change in rainfall could have a substantial impact on agricultural production and food security [7]. Thus, studying the possible climate change impacts on crop production and productivity is important to ensure sustainability of the agricultural sector [8,9,10,11].
Earlier studies of climate change consequences on agriculture over the world, using crop models such as AquaCrop, CERES-maize, CORAC, and EPIC models [7,12,13,14], have suggested that elevated temperature negatively affects most crops, limits crop yield, and leads to complex growth responses. However, the effect of rising temperature can vary widely between crops and environment. For example, a 1 °C rise in temperature throughout the growing period may reduce wheat production by about 3–10 percent [15] while winter wheat productions may decrease by 5–35 percent [16], and corn yield may decline by 2.4–45.6% [17]. Predictable rainfall reductions in arid and semiarid regions of the world, where water is already limited, can have dramatic impacts on crop production [17]. For example, in France, winter wheat production may decline by more than 20 percent due to the shortening of growth periods caused by the future increase in temperature combined with rainfall reduction [18]. In Egypt, simulations showed about 11 to 20 percent declines in wheat yield with a 1 °C rise in temperature.
In Ethiopia, wheat yield could reduce by 2 to 30 percent with a projected 1 °C temperature rise [9]. Currently, the food security policy in Ethiopia focuses mainly on the production of wheat, particularly irrigated wheat production, which is the second most important staple crop and a major pillar for food security for the country [19]. In Ethiopia, wheat covered more than 12.8 percent of the total cultivated area in the period of 2004/2005 and 2007/2008, which accounted for 13 percent of total crop production [20]. Ethiopia highly relies on rainfed wheat production, but the country is characterized by significant rainfall variability with the annual rainfall varying from 250 to 1100 mm over the country. The more pronounced rainfall variation is in the central rift valley (CRV) [21,22]. The rainfall in the summer season (July to September) accounts for 55 percent, and the winter and spring seasons only contribute 30 and 15 percent of the annual rainfall amount, respectively [21,23,24,25]. Due to uneven rainfall spatial distribution over the country [21,26], wheat cultivation and expansion over the different regions of Ethiopia have been supplemented by irrigation for the last few years. For example, irrigated wheat crop has been extensively grown in Afar, Amhara, Oromia, Southern Nations, Nationalities, and Peoples’ (SNNP), and Somali regions of the country. In Ziway Lake Basin (ZLB), located in the Oromia region along the CRV, both rainfed and irrigated wheat production have been practiced, but more attention has been given to expanding irrigated wheat production, especially during the drier season [26].
For a long-term sustainable irrigation water management, it is vital to quantify and evaluate the possible future effects of climate change on water availability and crop production [27,28]. In the Rift Valley Lake Basin of Ethiopia, researchers have predicted a wide range of climate change trends and its effects on rainfall and temperature, including changes in water availability [27,29,30]. For example, by the end of this century, the average temperatures in the ZLB are expected to increase by 1.34 to 2.58 °C, while rainfall is expected to show considerable variation [30]. In addition, rapid population growth and development in this region would likely increase the risk in water availability and agricultural production [28,31]. It is important for researchers, policymakers, and water resource managers to understand basin hydrological processes and climate change effects to propose approaches for tackling food and water scarcity [11].
Field experiments help to examine crops’ response in terms of yield and crop water productivity in real-world settings [32,33]. However, they are time-consuming, expensive, and difficult to maintain over extended periods of time such as for climate change studies. In addition, the outcomes of field data are influenced by agronomic, soil, and meteorological situations during the experiment [34]. Instead, process-based crop models can be considered. Crop models simulate the effects of irrigation management techniques under long-term interannual climatic variability that includes a future climate change [3,32,33,35,36,37,38]. Process-based simulation models that incorporate current and future climatic conditions, such as CO2 concentration, temperature, and rainfall variations generated by global climate models (GCMs), have been widely used for crop production and assessments [35,36]. One of such models is AquaCrop, which is developed by the Food and Agriculture Organization (FAO) to assess the response of the environment and management on yield and water productivity [39]. This model incorporates normalized crop water productivity that makes the core of its water-driven growth engine. AquaCrop simulates crop yields as a function of water use in rainfed, supplemental, deficit, and full irrigation scenarios [40,41]. Thus far, this model has been tested successfully for different cereal crops, such as wheat, maize, rice, tomato, potato, and cotton, including several vegetables [40,41,42,43,44]. When compared to other models, Aqua-Crop is relatively simple to use and allows simulating crop performance and productivity under different climate conditions [41]. The model requires a few sets of input data and parameters, which are relatively easy to obtain [40].
It has been projected that the ZLB would generally experience an increase in temperature and decrease in rainfall that could lead to warmer and drier climate conditions [27,29,30]. Several previous studies have also evaluated the impacts of this climate change on the hydrology of the ZLB and have reported an overall decline in freshwater resources availability of the basin [29,45,46]. Given the ongoing winter wheat irrigation expansion in the ZLB [47] and the absence of research on the implications of climate change on winter wheat production, this study focuses on crop productivity and water use efficiency under rainfed and ongoing irrigation practices. In the wake of climate change, this information becomes more important for a country such as Ethiopia for which wheat crop nowadays is considered to be the pillar of food security. The future climate change considers the representative concentration pathways (RCP) of 4.5 and 8.5 emission scenarios. These numbers refer to radiative forcing values in Wm-2 by the end of the 21st century relative to preindustrial values [48,49]. RCP4.5 assumes that greenhouse gas (GHG) emissions will reach their peak value around the mid-century due to the intervention of mitigation measures. In contrast, the worst-case RCP8.5 assumes a continuous rise in GHG emission values through the 21st century due to business as usual [48].
The objective of this study is to assess the sustainability of winter wheat production under climate change and irrigation as an adaptation measure to improve yield, crop water productivity (CWP), and irrigation water productivity (IWP) in the CRV of Ethiopia. AquaCrop is applied to evaluate the effects of climate under the baseline (1981–2020) and future (2026–2095) periods, which are categorized into three rainfall years (wet, normal, and dry).
2. Materials and Methods
2.1. Study Area
Ziway Lake Basin (ZLB) is located in the Adami Tullu-Jiddo Kombolcha Woreda of the East Shewa Zone of the Oromia Region, Ethiopia (Figure 1). The basin is located about 150 km south of Addis Ababa, the capital city, and specifically between 38°00′–39°30′ East and 7°00′–8°30′ North. The town of Ziway (recently renamed Batu) is located on the lake’s western shore. Ziway Lake, located approximately 1636 meters above mean sea level (amsl), has a maximum water depth of 4 meters, a total basin area of approximately 7300 km2, and a lake volume of 1.5 million cubic meters [50]. ZLB experiences the monsoon agro-climate zone characteristics.
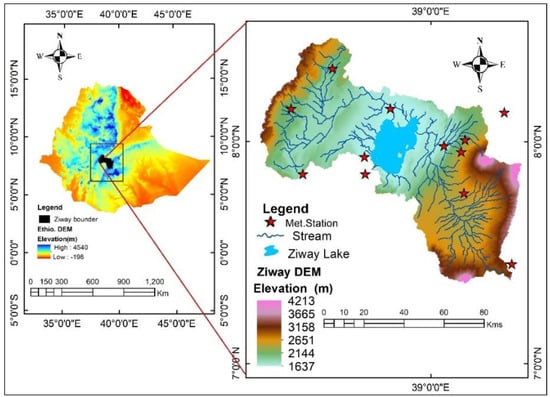
Figure 1.
Location map and the topography height of the Ziway Lake Basin.
The rainfall patterns in the ZLB are generally affected by the annual oscillation of the inter-tropical convergence zone that forms the wet summer from June to September [51]. The mean annual rainfall of the basin spatially varies from 250 mm to 1100 mm for the period 1986 to 2010, with a noticeable temporal variation at a monthly timescale. The rainfall amount during the winter wheat growing season (from mid-January to early May) is ~212 mm, which only accounts for 30% of the total annual rainfall. The mean annual temperature ranges approximately from 15 °C at the highlands to 25 °C close to the lake. The major land cover in the basin is smallholder agricultural lands, such as the Meki-Batu farmer union (MBU) and flower farm. The vegetation cover is characterized by extensively overgrazed Acacia Combretum in open woodland, whereas deciduous woodlands occupy the escarpments [52].
2.2. Data
2.2.1. Climatic Data
We collected secondary datasets and inputs into the AquaCrop model from the Adami Tullu Agricultural Research Center (ATARC) and Batu Soil Research Center (BSRC), we obtained climate data from the National Meteorological Agency (NMA) of Ethiopia and climate models. The observed meteorological data for the baseline period (1981 to 2020) include daily maximum and minimum temperature, and rainfall for the period. For the future period (2026–2095), we downscaled rainfall and minimum and maximum temperatures under RCP4.5 and 8.5 scenarios obtained from the CMPI5 model and bias-corrected as explained in our earlier study [30]. We calculated the reference evapotranspiration (ETo) using the ETo calculator [53].
2.2.2. Crop and Irrigation
We used the default winter wheat parameters in AquaCrop [54]. Based on information gathered from ATARC, the irrigated winter wheat in the area grows from mid-January to early May. We gathered the current irrigation practice for the 2016/2017 experimental period (Table 1) from Kulumsa Agricultural Research Center (KARC).

Table 1.
Current irrigation practices of winter wheat at farm level (source: KARC).
2.2.3. Soil
The soils in the ZLB were characterized by loam with mean sand, silt, and clay percentages of 45.8, 32.1, and 22.4%, respectively [55]. Based on our field survey evidence obtained from a field expert and BSRC, the soils of the study area have good physio-chemical properties for plant growth. Based on this evidence and irrigation provision, we assumed that farmers are encouraged to maintain optimal growing conditions (i.e., fertility and biotic stresses fully controlled).
Assuming that the average ground water table is ≥2 m depth [56], we did not consider moisture supply from the capillary rise to the root zone. We also assumed that the initial soil moisture was at field capacity.
2.3. AquaCrop Model
The AquaCrop model is a simplification of the soil–water–plant and climate interactions that require minimum input data, which are readily available or can easily be collected [57,58]. The AquaCrop model is used to estimate the effects of climate-related parameters, such as rainfall, air temperature, and atmospheric concentrations of carbon dioxide (CO2) [57]. The model was successfully applied at different places in Ethiopia [59,60]. AquaCrop assesses the response of crop yield to water [61]. Crop development, agricultural transpiration, biomass generation, and yield creation are the four phases that are used to model crop yield [39,55]. The model drives crop growth by simulating daily soil water balance. The daily transpiration and evaporation fluxes are calculated separately using the canopy cover as a factor: evaporation is proportional to the area of soil not covered by vegetation, and transpiration is proportional to canopy cover, which is proportional to the degree of soil cover [62]. Then, using a normalized biomass water productivity parameter, transpiration is converted to biomass. The relationship between biomass and the harvest index (HI) can subsequently be used to calculate crop yield [57]. Four water stress coefficients are used to predict the crop’s stomata conductance, canopy senescence, leaf growth, and yield response to water stress, such as stomata closure, leaf expansion, canopy senescence, and the change in HI [39,57]. This value makes AquaCrop a useful tool to simulate crop water productivity under water stress and rainfed conditions [57]. To emphasize the distinct reactions of biomass (B) and HI to water stress, the final crop yield is separated into B and HI, as described in Equations (1) and (2) [63].
where Y is the final crop yield (kg/m2), fHI is a multiplier that considers the stresses that adjust the HI from its reference value, HIo is the reference HI (%), B is the total aboveground biomass (kg/m2), WP* is the water productivity normalized for climate (kg/m2), and Tr is the crop transpiration (mm) (Equation (3)). Tr is described as follows using the crop coefficient method [64]:
where Ks is the stress coefficient, KCTrx is the crop coefficient for maximum crop transpiration, CC* is the canopy cover adjusted for micro-advective effects, and ETo is the reference evapotranspiration (mm) as determined by the FAO Penman–Monteith equation.
The seasonal crop water consumption is the sum of daily Tr and evaporation (E), where the daily E is calculated as follows [64]:
where KCErX is the evaporation coefficient.
2.4. Rainfall Category Years
The rainfall category years indicate the amount of rain that falls during the growing season of the crops. Various studies have used different classifications of rainfall category year that is, wet, normal, and dry to examine crop productivity. Rainfall years can be classified based on the number of rainfall days in a year [65] or by comparing annual rainfall to the long-term average value [66]. In this study, we used empirical frequency analysis (EFA) to categorize rainfall years based on the amount of rain during the winter wheat growing season [4,61]. The EFA follows four steps: (1) rank rainfall during the winter wheat planting season of each year in descending order for n number of years; (2) assign a rank of m to each descending order, with 1 for the highest seasonal rainfall value and n for the lowest seasonal rainfall value; (3) calculate the empirical probability (P) using the Weibull’s equation as shown in Equation (5) [67], and (4) categorize the years into wet, normal, and dry based on the P value [68,69]: ‘wet’ year if P ≤ 25%; ‘normal’ year if P is between 25% and 75%; ‘dry’ year if P ≥ 75%.
After applying the EFA for both the baseline (1983–2020) and future (2026–2095) periods, we identified and categorized the years as wet, normal, and dry rainfall years. The 40-year baseline period was categorized to have ten, twenty-one, and nine years of wet, normal, and dry years, respectively. The 70-year future period was categorized into wet, normal, and wet years consisting of sixteen, thirty-one, and twenty-two years under RCP4.5 and seventeen, thirty-five, and eighteen years under RCP8.5.
The baseline rainfall in the wet years ranged from 248 to 457 mm with a mean value of 331 mm. The normal years ranged from 160 to 238 mm with a mean value of 206 mm, whereas the rainfall in the dry years varied from 106 to 176 with a mean of 133 mm (Figure A1a). The future RCP4.5 rainfall in the wet years ranged from 236 to 442 mm with a mean value of 324 mm, that in the normal years ranged from 142 to 213 with a mean value of 185 mm, and that in the dry years ranged from 81 to 160 mm with a mean value of 130 mm under RCP4.5 (Figure A1b). The RCP8.5 rainfall value in the wet years ranged from 223 to 438 mm with a mean value of 301 mm, that in the normal years ranged from 138 to 205 mm with a mean value of 174 mm, and that in the dry years ranged from 65 to 135 mm with a mean value of 97 mm (Figure A1c). The rainfall during the growth period of winter wheat exhibited a higher variability, with a coefficient of variation (CV) of 34, 37, and 45% under baseline, RCP4.5, and RCP8.5, respectively. Table 2 summarizes the mean annual rainfall values under baseline, RCP4.5, and RCP8.5 conditions for the wet, normal, and dry category years.
Table 2.
Mean annual rainfall under rainfall category year.
2.5. Crop Water Productivity and Irrigation Water Productivity
Crop water productivity (CWP) is the grain yield produced per unit water consumption [57]. It is a comprehensive physiological indicator for evaluating the suitability of crop growth and water use [39] and calculated using Equation (6).
where CWP is the crop water productivity (kg/m3), Y is the grain yield (kg/ha), and ETa is the actual evapotranspiration over the winter wheat growing season (mm/season); 10 is a unit conversion factor.
Irrigation water productivity (IWP) is the yield produced per unit of irrigation water use [70]. It is a comprehensive indicator that reveals the level of irrigation and crop management [33,68]. IWP is estimated as:
where Yirr is the grain yield under irrigation (kg/ha), Yrf is the grain yield under rainfed condition (kg/ha), and Wirr is the amount of irrigation water (mm); 10 is a unit conversion factor.
2.6. Evaluation of Climate Change Impacts
We evaluated the impact of climate change by comparing the simulated wheat yield, CWP, and IWP for the baseline period (1981–2020) against those of the future period (2026–2095). For example, we calculated the impacts of climate change for each rainfall category years using the mean simulated yield of future and baseline as follows:
where Ych is the percent change in yield, Yf is the future simulated mean winter wheat yield of each rainfall category years, and Yb is the baseline simulated mean winter wheat yield of each rainfall category years.
3. Results
3.1. Winter Wheat Yield and Crop Water Productivity under Rainfed Conditions
Figure 2 shows the yield, change in yield, and CWP of rainfed winter wheat production in wet, normal, and dry years for both baseline and future climate conditions. The yield during the baseline period ranged from 5.0 to 5.3 ton/ha with an average of 5.1 ton/ha for wet years and 4.0 to 5.0 ton/ha with an average of 4.2 ton/ha for the normal years (Figure 2a). Related to the baseline scenario, the projected yield tended to show an overall decrease. Figure 2b shows the average change in winter wheat yield (%) during the wet, normal, and dry rainfall years under RCP4.5 and RCP8.5 scenarios. Under future RCP (4.5 and 8.5) climate scenarios, a potential decrease in winter wheat yield was simulated in all rainfed category years (wet, normal, and dry) compared to the baseline period. Yet, a higher yield reduction was simulated in the wet years (−30% and −51%) compared to the normal years (−18% and −30%). Conversely, the decrease in yield was substantially the highest in the dry years (−60% for RCP4.5 and −80% for RCP8.5) compared to the reduction in wet and normal years, with a significant yield reduction under RCP8.5 than RCP4.5 (Figure 2b). RCP8.5 was predicted to cause a warmer (a larger increase in temperature) and drier (low rainfall) climate than that of the RCP4.5 scenario. High evapotranspiration (water demand) and low moisture availability explain the pronounced yield reduction under the RCP8.5 scenario compared to the RCP4.5 scenario [71]. This is because an increasing rate of future temperature leads to a negative effect on crop production and the phenological days for crops [72,73].
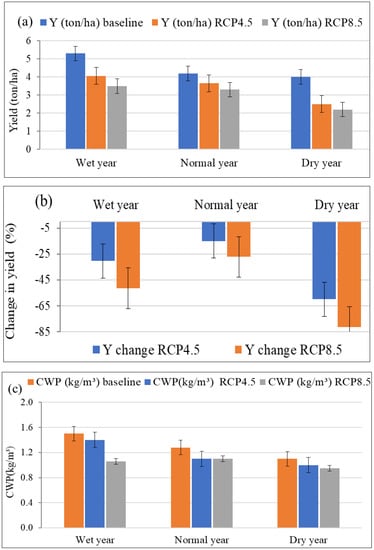
Figure 2.
Average wheat yield (a), change in yield (%) (b), and crop water productivity for the baseline and future periods in the wet, normal, and dry years (c) under rainfed condition. The error bar indicates the variation across the years identified as wet, normal, or dry years.
The CWP of winter wheat under the rainfall condition was higher during the baseline period than the future period. The average CWP in the baseline period was highest in the wet years (1.4 kg/m3) followed by the normal (1.1 kg/m3) and dry (0.98 kg/m3) years (Figure 2c). The average CWP under the future climate scenarios of RCP4.5 and RCP8.5 were comparable with the values of 1.1 kg/m3 in wet years, 1.0 kg/m3 in normal years, and 0.87 kg/m3 in dry years (Figure 2c).
3.2. Wheat Yield and Crop Water Productivity under Current Irrigation Practices
Under the baseline, the average simulated yields were 8.0 for wet years, 6.0 for normal years, and 5.0 ton/ha for dry years (Figure 3a). As compared to the baseline results, crop yield was overall expected to decrease under future climate conditions with an enhanced variability. The average simulated yields were 6.5 for RCP4.5 and 6.3 ton/ha for RCP8.5 under wet year conditions (Figure 3a). During wet years, the RCP4.5 and 8.5 scenarios were projected to reduce winter wheat yields by 17.9% and 22%, respectively. The average yield during normal years of both scenarios was low compared to the baseline yield of the normal years. The average change in yield recorded −16% and −20.6% under RCP4.5 and RCP8.5, respectively. Compared to the baseline climate condition, wheat yield significantly decreased under both RCP4.5 and 8.5 scenarios, with a respective percent decline of −12.2% and −24.4% during dry years. As observed from the results, the amount of wheat yield under the current irrigation practice recorded among each rainfall category years was different under baseline as well as future climate conditions. Winter wheat yield was affected by climate change when there was no irrigation during the entire growth period, especially under the future climate condition of dry years. The average rainfed yield under RCP4.5 and 8.5 scenarios of dry years would be 2.5 ton/ha and 2.2 ton/ha, respectively. Current irrigation practice improved the soil moisture during dry years, and significantly increased the winter wheat yield to 4.2 ton/ha and 4.0 ton/ha under RCP4.5 and 8.5 scenarios, respectively.
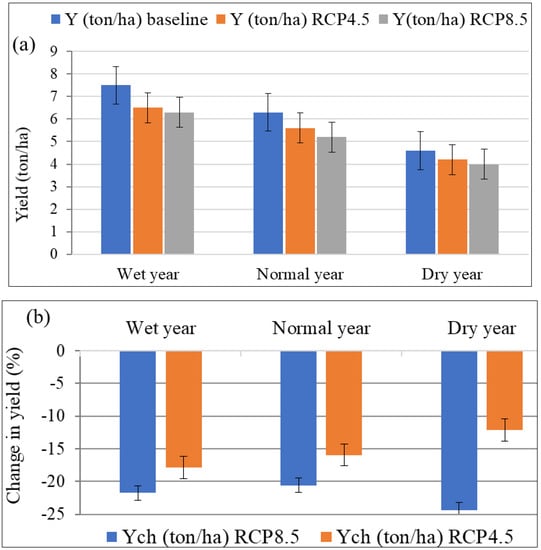
Figure 3.
Average yield (ton/ha) for irrigated wheat under baseline and future period (a) and average change yield (%) during wet, normal, and dry years under future period (b). The error bar indicates the variation across the years identified as wet, normal, or dry years.
Based on the current irrigation practices simulation, significant differences were observed in the CWP of winter wheat subjected to rainfall category years under baseline and future climate conditions. Average values of CWP under the baseline condition were 1.56, 1.45, and 1.48 kg/m3 during wet, normal, and dry years, respectively. Average values of CWP water consumption for wheat crops under the future condition were 1.32, 1.27, and 1.24 kg/m3 under RCP4.5 and 1.32, 1.20, and 1.10 kg/m3 under RCP8.5 during wet, normal, and dry years, respectively (Figure 4).
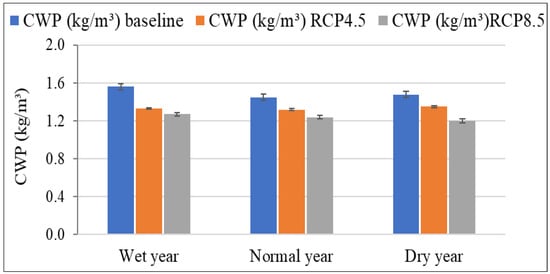
Figure 4.
Average crop water productivity (kg/m3) for irrigated wheat under baseline and climate change conditions during wet, normal, and dry years. The error bar indicates the variation across the years identified as wet, normal, or dry years.
3.3. Irrigation Water Productivity under Current Irrigation Practice
The average IWP and change during rainfall category years were different under baseline and future climate conditions (Figure 5a,b). The average IWP values during the wet years were 0.8 kg/m3 for baseline, 0.71 kg/m3 for the RCP4.5 scenario, and 0.66 kg/m3 for the RCP8.5 scenario (Figure 5a). These corresponded to change values of −12.7% and −18.5% under RCP4.5 and 8.5 scenarios, respectively (Figure 5b). The average IWP values during normal years were 0.62 kg/m3 for baseline, 0.54 kg/m3 for the RCP4.5 scenario, and 0.45 kg/m3 for the RCP8.5 scenario. The respective yield change values during these rainfall category years would be −13.2% and −27.4% under RCP4.5 and 8.5 scenarios. The average IWP values during the dry year in the baseline was 0.59 kg/m3. Compared to the baseline climate condition, the change in IWP under RCP4.5 and 8.5 scenarios would be −19.3% and −27.3% during dry years, respectively.
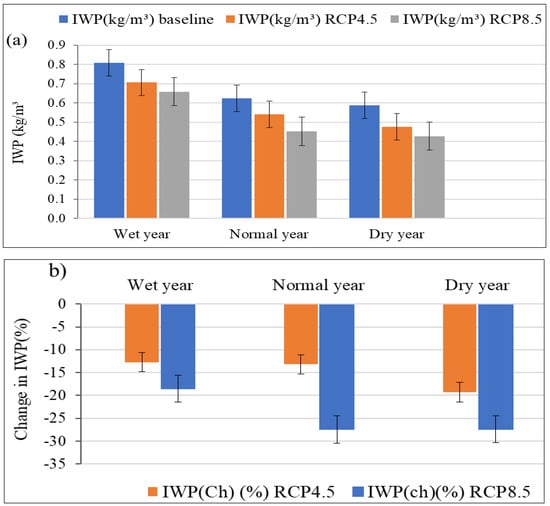
Figure 5.
Average irrigation water productivity of winter wheat under baseline and future climate (RCP4.5 and RCP8.5) in the wet, normal, and dry years (a), and average irrigation water productivity reduction under future climate in wet, normal, and dry rainfall years (b). The error bar indicates the variation across the years identified as wet, normal, or dry years.
4. Discussion
We performed the evaluation of the AquaCrop model under current irrigation practices at a field level for the winter wheat growing year of 2016/2017 (Table 3). We found a close agreement between observed and simulated values of total growth days with a PBIAS of 9% and RMSE of 10 days. The model tended to overestimate wheat yields by 10% with an RMSE of 0.5 ton/ha. Though we compared the simulated values with limited observed data, the overall results indicated that AquaCrop reasonably simulated weather and other environmental factors to predict the total crop growing days and crop yield, which encourages the application of the model for climate change impact assessment.
Table 3.
Performance evaluation of AquaCrop model for growth, yield, and crop water productivity of wheat at farm levels for the period 2016/2017.
4.1. Impact of Climate Change on Wheat Yield and Crop Water Productivity under Rainfed Condition
We investigated the impact of climate change on winter wheat yield and CWP under rainfed conditions. The potential winter wheat yield declined and varied among rainfall category years; the yield significantly declined during the dry years. Compared to the baseline climate condition, the declines in winter wheat yield and CWP were higher under future climate conditions (RCP4.5 and RCP8.5 scenarios). The two emission scenarios presented relative differences in the projected trends of greenhouse gas concentrations (in particular, CO2 concentration) [74], with different impacts on climate variables trends (in particular, rainfall and temperature) [54]. The combined effect of rainfall and temperature change might lead to a negative impact on winter wheat production [75,76,77,78]. Generally, the wheat growth highly depends on rainfall and temperature, and particularly for the anthesis and maturity stage, a rise in temperature and decrease in rainfall during winter can affect the wheat growth significantly [12,13]. For instance, a rise in temperature and decrease in rainfall at the flowering stage would restrict grain growth, and consequently early maturity, which can lead to a decrease in yield as concluded by different studies [73,75,76]. A decrease in rainfall is considered to have potentially negative impacts on winter wheat yield. For example, in southern Australia, the rainfall decreased by 28%, which caused a reduction in winter wheat yield by 27% between the years 1990 and 2015, whereas the projected wheat yield reduction was between 26% and 38%, under RCP4.5 by 2090, and between 41% and 49% under RCP8.5 [77]. The study found that by 2030, in Ethiopia, wheat farmers are projected to decline by more than 11% in annual yield [76].
4.2. Impact of Climate Change on Wheat Yield and Crop Water Productivity under Current Irrigation Condition
Under current irrigation, the winter wheat yield and crop water productivity greatly varied among rainfall category years, which is due to the inter-annual variation of rainfall. The simulated yield of winter wheat showed a clear decline under both the RCP4.5 and 8.5 scenarios related to the baseline rainfall category years. Even though the rainfall variability affected winter wheat yield, this study showed that irrigations during the initial, mid, development, and late growth stage slightly improved wheat yield relative to the rainfed scenario. For example, there was a substantial increase in yield during dry rainfall category years. Irrigation compared to rainfed production was simulated to increase the average winter wheat yield by 40% under the RCP4.5 scenario and 45% under the RCP8.5 scenario during the dry rainfall years. This result supports the evidence that irrigation can improve wheat yield relative to the rainfed condition under climate change conditions [30]. In Ethiopia, some regions count on irrigation as an adaptation response for water shortage due to the impacts of climate change. For example, Araya et al. [9] examined the impact of climate change at the regional scale (over Ethiopia regions) on winter wheat production. The authors reported that winter wheat yields are expected to decrease under rainfed conditions, while yields are expected to increase almost everywhere under irrigation conditions. For instance, there was an increase in yield due to two irrigation events during the mid-growth stage in Mekelle, Goba, and Asela of Ethiopia, by 34%, 21%, and 20%, respectively, relative to the rainfed scenario. The studies by Mostafa et al. [7] indicated that the yield decline for wheat under climate change conditions could be reduced by increasing the amount of irrigation water applied. This is due to the fact that high temperature will lead to a high amount of evapotranspiration, so it is essential to compensate the plant with an additional amount of water to overcome some of the negative effects of high temperature on the physiological processes of the plant [7].
The CWP of irrigated winter wheat simulated yields during wet, normal, and dry years of the base period were 1.56 kg/m3, 1.45 kg/m3, and 1.48 kg/m3, respectively. The results showed that the CWP could be reduced by 17.3%, 9.8%, and 9.6% for the RC4.5 scenario and 22.8%, 16.9%, and 23.3% for the RCP8.5 scenario, respectively.
According to current reports, the possibility of rainfall fluctuation and the high temperature effect on winter wheat yields would continue to rise in the future, especially in arid and semi-arid areas [77,78]. The fluctuation of rainfall in the future could increase irrigation water consumption and effectively increase the problems caused by overexploitation of surface and groundwater in the area. Recent studies by Goshime et al. [32] found that areas in the Ziway Lake Basin had water resources overexploitation for irrigation. The Ziway lake water level has been declining due to irrigation water extraction among others [45]. However, irrigation still has an important increase and stabilizes wheat yield in rainfed areas of the Ziway Lake Basin.
5. Conclusions
Due to limited water resources and irrigation abstraction in the Ziway Lake Basin (ZLB), the food production and water resources conditions are challenged by climate change, which is projected to be warmer and drier. Thus, this study assessed the impact of climate change on winter wheat yields and water productivity under rainfed and irrigation practices in wet, normal, and dry rainfall years of the ZLB.
Under rainfed conditions, the warmer and drier future climate is expected to cause an overall decrease in winter wheat yield, crop water productivity (CWP), and Irrigation Water Productivity (IWP). Most importantly, the highest reduction in winter wheat yield is expected to occur under the RCP8.5 scenario and its dry years with an average yield decrease of 80%. Although we found similar trends in winter wheat yield, CWP, and IWP under irrigated conditions, the study noticed that irrigation substantially mitigates the negative impact of climate change on winter wheat yield, CWP, and IWP. For example, under the RCP8.5 scenario and its wet, normal, and dry years, the respective average yield of winter wheat is projected to be improved by 44.4%, 36.5%, and 44.9% as compared to the baseline condition, respectively. This highlights that although the winter wheat yield values are generally declining due to climate change, irrigation mitigates the negative implications of climate change.
Overall, climate change is expected to negatively affect the crop production, water productivity, and water resources availability that challenge the sustainability of crop production in the ZLB. We, therefore, recommend a further investigation to improve irrigation strategies and crop production of the basin. This should also be tailored to crop, soil, and rainfall conditions across scales to maximize crop yield, production, and productivity in relation to the available water under the inevitable climate change.
Author Contributions
Conceptualization, A.T.H.; data curation and analysis, A.T.H.; formula analysis and methodology, A.T.H.; writing—original draft, A.T.H.; writing—review, A.T.H.; editing, A.T.H., O.T.L. and A.D.C.; supervision O.T.L., T.A. and A.D.C. All authors have read and agreed to the published version of the manuscript.
Funding
This work was financially supported by the Africa Center of Excellence for Water Management, Addis Ababa University.
Institutional Review Board Statement
Not applicable.
Informed Consent Statement
Not applicable.
Data Availability Statement
Data cannot be made publicly available; readers should contact the corresponding author for details.
Acknowledgments
The authors would like to thank the National Meteorological Agency (NMA) of Ethiopia for providing climate data. We would also like to express our sincere gratitude to the Africa Center of Excellence for Water Management, Addis Ababa University, for the support to conduct this research.
Conflicts of Interest
The authors declare no potential conflict of interests.
Appendix A

Figure A1.
Rainfall category during winter wheat growing season baseline from 1981 to 2020 (a) and future from 2026 to 2095 (RCP4.5) (b), and (RCP8.5) (c).
References
- Fujihara, Y.; Tanaka, K.; Watanabe, T.; Nagano, T.; Kojiri, T. Assessing the impacts of climate change on the water resources of the Seyhan River Basin in Turkey: Use of dynamically downscaled data for hydrologic simulations. J. Hydrol. 2008, 353, 33–48. [Google Scholar] [CrossRef]
- Ezenne, G.; Jupp, L.; Mantel, S.K.; Tanner, J.L. Current and potential capabilities of UAS for crop water productivity in precision agriculture. Agric. Water Manag. 2019, 218, 158–164. [Google Scholar] [CrossRef]
- Faramarzi, M.; Yang, H.; Schulin, R.; Abbaspour, K.C. Modeling wheat yield and crop water productivity in Iran: Implications of agricultural water management for wheat production. Agric. Water Manag. 2010, 97, 1861–1875. [Google Scholar] [CrossRef]
- Gado, T.A.; Hsu, K.; Sorooshian, S. Rainfall frequency analysis for ungauged sites using satellite precipitation products. J. Hydrol. 2017, 554, 646–655. [Google Scholar] [CrossRef]
- Sundström, J.; Albihn, A.; Boqvist, S. Future threats to agricultural food production posed by environmental degradation, climate change, and animal and plant diseases—A risk analysis in three economic and climate settings. Food Secur. 2014, 6, 201–215. [Google Scholar] [CrossRef]
- Ashraf Vaghefi, S.; Abbaspour, K.C.; Faramarzi, M.; Srinivasan, R.; Arnold, J.G. Modeling crop water productivity using a coupled SWAT–MODSIM model. Water. 2017, 24, 157. [Google Scholar] [CrossRef]
- Mostafa, S.M.; Wahed, O.; El-Nashar, W.Y.; El-Marsafawy, S.M.; Abd-Elhamid, H.F. Impact of climate change on water resources and crop yield in the middle Egypt region. AQUA Water Infrastruct. Ecosyst. Soc. 2021, 70, 1066–1084. [Google Scholar] [CrossRef]
- Kristensen, K.; Schelde, K.; Olesen, J.E. Winter wheat yield response to climate variability in Denmark. J. Agric. Sci. 2010, 149, 33–47. [Google Scholar] [CrossRef]
- Araya, A.; Prasad, P.V.V.; Zambreski, Z. Spatial analysis of the impact of climate change factors and adaptation strategies on productivity of wheat in Ethiopia. Sci. Total Environ. 2020, 731, 139094. [Google Scholar] [CrossRef]
- Gohari, A.; Eslamian, S.; Abedi-Koupaei, J.; Massah Bavani, A.; Wang, D.; Madani, K. Climate change impacts on crop production in Iran’s Zayandeh-Rud River Basin. Sci. Total Environ. 2013, 442, 405–419. [Google Scholar] [CrossRef]
- Paul, M.; Dangol, S.; Kholodovsky, V.; Sapkota, A.R.; Negahban-Azar, M.; Lansing, S. Modeling the impacts of climate change on crop yield and irrigation in the monocacy river watershed, USA. Climate 2020, 8, 139. [Google Scholar] [CrossRef]
- Iqbal, M.A.; Shen, Y.; Stricevic, R. Evaluation of the FAO AquaCrop model for winter wheat on the North China Plain under deficit irrigation from field experiment to regional yield simulation. Agric. Water Manag. 2014, 135, 61–72. [Google Scholar] [CrossRef]
- Mo, X.; Liu, S.; Lin, Z.; Guo, R. Regional crop yield, water consumption and water use efficiency and their responses to climate change in the North China Plain. Agric. Ecosyst. Environ. 2009, 134, 67–78. [Google Scholar] [CrossRef]
- Ge, T.; Sui, F.; Bai, L.; Tong, C.; Sun, N. Effects of water stress on growth, biomass partitioning, and water-use efficiency in summer maize (Zea mays L.) throughout the growth cycle. Acta Physiol. Plant. 2012, 34, 1043–1053. [Google Scholar] [CrossRef]
- You, L.; Rosegrant, M.W.; Wood, S.; Sun, D. Impact of growing season temperature on wheat productivity in China. Agric. For. Meteorol. 2009, 149, 1009–1014. [Google Scholar] [CrossRef]
- Özdoǧan, M. Modeling the impacts of climate change on wheat yields in Northwestern Turkey. Agric. Ecosyst. Environ. 2011, 141, 1–12. [Google Scholar] [CrossRef]
- Tao, F.; Zhang, Z. Adaptation of maize production to climate change in North China Plain: Quantify the relative contributions of adaptation options. Eur. J. Agron. 2010, 33, 103–116. [Google Scholar] [CrossRef]
- Gammans, M.; Mérel, P.; Ortiz-Bobea, A. Negative impacts of climate change on cereal yields: Statistical evidence from France. Environ. Res. Lett. 2017, 12, 054007. [Google Scholar] [CrossRef]
- Akinsulu, A.A.; Ajibola, S.; Odetola, S.K.; Awoyemi, D.O. Factors Influencing Meat Consumption in Ijebu-North Local Government Area of Ogun State Nigeria. J. Mark. Consum. Res. 2019, 52, 10–16. [Google Scholar] [CrossRef]
- Taffesse, A.S.; Dorosh, P.; Gemessa, S.A. Crop production in Ethiopia: Regional patterns and trends. Food Agric. Ethiop. 2013, 28, 53–83. [Google Scholar] [CrossRef]
- Hordofa, A.T.; Leta, O.T.; Alamirew, T.; Kawo, N.S.; Chukalla, A.D. Performance evaluation and comparison of satellite-derived rainfall datasets over the Ziway lake basin, Ethiopia. Climate 2021, 9, 113. [Google Scholar] [CrossRef]
- Kawo, N.S.; Hordofa, A.; Karuppannan, S. Performance evaluation of GPM-IMERG early and late rainfall estimates over Lake Hawassa catchment, Rift Valley Basin, Ethiopia. Arab. J. Geosci. 2021, 14, 256. [Google Scholar] [CrossRef]
- Desta, H.; Lemma, B.; Stellmacher, T. Limnologica Farmers’ awareness and perception of Lake Ziway (Ethiopia) and its watershed management. Limnologica 2017, 65, 61–75. [Google Scholar] [CrossRef]
- Rodríguez Díaz, J.A.; Weatherhead, E.K.; Knox, J.W.; Camacho, E. Climate change impacts on irrigation water requirements in the Guadalquivir River basin in Spain. Reg. Environ. Chang. 2007, 7, 149–159. [Google Scholar] [CrossRef]
- Ayenew, T. Environmental isotope-based integrated hydrogeological study of some Ethiopian rift lakes. J. Radioanal. Nucl. Chem. 2003, 257, 11–16. [Google Scholar] [CrossRef]
- Goshime, D.W.; Absi, R.; Ledésert, B. Evaluation and Bias Correction of CHIRP Rainfall Estimate for Rainfall-Runo ff Simulation over Lake. Hydrology 2019, 6, 68. [Google Scholar] [CrossRef]
- Musie, M.; Sen, S.; Chaubey, I. Hydrologic Responses to Climate Variability and Human Activities in Lake Ziway Basin, Ethiopia. Water 2020, 12, 164. [Google Scholar] [CrossRef]
- Shumet, A.G.; Mengistu, K.T. Assessing the Impact of Existing and Future Water Demand on Economic and Environmental Aspects (Case Study from Rift Valley Lake Basin: Meki-Ziway Sub Basin), Ethiopia. Int. J. Waste Resour. 2016, 6, 223. [Google Scholar] [CrossRef]
- Abraham, T.; Woldemicheala, A.; Muluneha, A.; Abateb, B. Earth Science & Climatic Change Hydrological Responses of Climate Change on Lake Ziway Catchment, Central Rift Valley of Ethiopia. J. Earth Sci. Clim. 2018, 9, 474. [Google Scholar] [CrossRef]
- Hordofa, A.T.; Leta, O.T.; Alamirew, T.; Chukalla, A.D. Spatiotemporal Trend Analysis of Temperature and Rainfall over Ziway Lake Basin, Ethiopia. Hydrology 2022, 9, 2. [Google Scholar] [CrossRef]
- Pascual-ferrer, J.; Pérez-foguet, A.; Codony, J.; Raventós, E. Assessment of water resources management in the Ethiopian Central Rift Valley: Environmental conservation and poverty reduction. Int. J. Water Resour. Dev. 2013, 30, 572–587. [Google Scholar] [CrossRef]
- Goshime, D.W.; Absi, R.; Ledésert, B.; Dufour, F.; Haile, A.T. Impact of water abstraction on the water level of Lake Ziway, Ethiopia. WIT Trans. Ecol. Environ. 2019, 239, 67–78. [Google Scholar] [CrossRef]
- Fikadu, R.B.; Teshome, S. Effect of drip and furrow irrigation at different irrigation levels on water use efficiency and economics of maize (Zea mays L.) at Werer, Middle Awash, Ethiopia. Afr. J. Agric. Res. 2021, 17, 1221–1228. [Google Scholar] [CrossRef]
- Ding, Z.; Ali, E.F.; Elmahdy, A.M.; Ragab, K.E.; Seleiman, M.F.; Kheir, A.M.S. Modeling the combined impacts of deficit irrigation, rising temperature and compost application on wheat yield and water productivity. Agric. Water Manag. 2021, 244, 106626. [Google Scholar] [CrossRef]
- Gerber, A.S.; Green, D.P. Field Experiments and Natural Experiments. In Oxford Handbook of Political Methodology; Box-Steffensmeier, J.M., Brady, H.E., Collier, D., Eds.; Oxford University Press: New York, NY, USA, 2008; pp. 357–381. [Google Scholar] [CrossRef]
- Kloss, S.; Pushpalatha, R.; Kamoyo, K.J.; Schütze, N. Evaluation of crop models for simulating and optimizing deficit irrigation systems in arid and semi-arid countries under climate variability. Water Resour. Manag. 2012, 26, 997–1014. [Google Scholar] [CrossRef]
- Jiang, Y.; Zhang, L.; Zhang, B.; He, C.; Jin, X.; Bai, X. Modeling irrigation management for water conservation by DSSAT-maize model in arid northwestern China. Agric. Water Manag. 2016, 177, 37–45. [Google Scholar] [CrossRef]
- Kelly, T.D.; Foster, T. AquaCrop-OSPy: Bridging the gap between research and practice in crop-water modeling. Agric. Water Manag. 2021, 25, 106976. [Google Scholar] [CrossRef]
- Rodriguez, A.V.C.; Ober, E.S. AquaCropR: Crop growth model for R. Agronomy 2019, 9, 378. [Google Scholar] [CrossRef]
- Steduto, P.; Raes, D.; Hsiao, T.C.; Fereres, E.; Heng, L.K.; Howell, T.A.; Evett, S.R.; Rojas-Lara, B.A.; Farahani, H.J.; Izzi, G.; et al. Concepts and Applications of AquaCrop: The FAO Crop Water Productivity Model. In Crop Modeling and Decision Support; Springer: Berlin/Heidelberg, Germany, 2009; pp. 175–191. [Google Scholar] [CrossRef]
- Chukalla, A.D.; Krol, M.S.; Hoekstra, A.Y. Green and blue water footprint reduction in irrigated agriculture: Effect of irrigation techniques, irrigation strategies and mulching. Hydrol. Earth Syst. Sci. 2015, 19, 6945–6979. [Google Scholar] [CrossRef]
- Reddy, V.R.; Pachepsky, Y.A. Predicting crop yields under climate change conditions from monthly GCM weather projections. Environ. Model Softw. 2000, 15, 79–86. [Google Scholar] [CrossRef]
- Diro, S.B.; Tilahun, K. Evaluation of the FAO cropwat model for deficit-irrigation scheduling for onion crop in a semiarid region of Ethiopia. J. Appl. Hortic. 2009, 11, 103–106. [Google Scholar] [CrossRef]
- Kheir, A.M.S.; Alrajhi, A.A.; Ghoneim, A.M. Modeling deficit irrigation-based evapotranspiration optimizes wheat yield and water productivity in arid regions. Agric. Water Manag. 2021, 256, 107122. [Google Scholar] [CrossRef]
- Debonne, N.; van Vliet, J.; Ramkat, R.; Snelder, D.; Verburg, P. Farm scale as a driver of agricultural development in the Kenyan Rift Valley. Agric. Syst. 2021, 186, 102943. [Google Scholar] [CrossRef]
- Mohammed, Y.; Yimam, A. Analysis of meteorological droughts in the Lake’s Region of Ethiopian Rift Valley using reconnaissance drought index (RDI). Geoenviron. Disasters 2021, 8, 13. [Google Scholar] [CrossRef]
- Ulsido, M.D.; Alemu, E. Irrigation water management in small scale irrigation schemes: The case of the Ethiopian rift valley lake basin. Environ. Res. Eng. Mang. 2014, 25, 5–15. [Google Scholar] [CrossRef]
- IPCC. Part A: Global and Sectoral Aspects. Contribution of Working Group II to the Fifth Assessment Report of the Intergovernmental Panel on Climate Change. In Climate Change 2014: Impacts, Adaptation, and Vulnerability; Field, C.B., Barros, V.R., Dokken, D.J., Eds.; Cambridge University Press: Cambridge, UK; New York, NY, USA, 2014; pp. 1–32. [Google Scholar]
- IPCC. Part B: Regional Aspects. Contribution of Working Group II to the Fifth Assessment Report of the Intergovernmental Panel on Climate Change. In Climate Change 2014: Impacts, Adaptation, and Vulnerability; Barros, V.R., Field, C.B., Dokken, D.J., Eds.; Cambridge University Press: Cambridge, UK; New York, NY, USA, 2014; p. 688. [Google Scholar]
- Legesse, D.; Ayenew, T. Effect of improper water and land resource utilization on the central Main Ethiopian Rift lakes. Quat. Int. 2006, 148, 8–18. [Google Scholar] [CrossRef]
- Alhamshry, A.; Fenta, A.A.; Yasuda, H.; Kimura, R.; Shimizu, K. Seasonal rainfall variability in Ethiopia and its long-term link to global sea surface temperatures. Water 2020, 12, 55. [Google Scholar] [CrossRef]
- Le Turdu, C.; Tiercelin, J.J.; Gibert, E.; Travi, Y.; Lezzar, K.E.; Richert, J.P.; Massault, M.; Gasse, F.; Bonnefille, R.; Decobert, M.; et al. The Ziway-Shala Lake basin system, Main Ethiopian Rift: Influence of volcanism, tectonics, and climatic forcing on basin formation and sedimentation. Palaeogeogr. Palaeoclimatol. Palaeoecol. 1999, 150, 135–177. [Google Scholar] [CrossRef]
- Raes, D.; Steduto, P.; Hsiao, T.C.; Fereres, E. Chapter 1: FAO Crop-Water Productivity Model to Simulate Yield Response to Water. In AquaCrop: Version 6.0-6.1: Reference Manual; FAO: Rome, Italy, 2018; 19p, Available online: https://www.fao.org/publications (accessed on 13 March 2022).
- Abdalhi, M.A.; Jia, Z. Crop yield and water saving potential for AquaCrop model under full and deficit irrigation managements. Ital. J. Agron. 2018, 13, 267–278. [Google Scholar] [CrossRef]
- Redi, M.; Bekele, I. Soil Fertility and Irrigation Water Characterization of Ziway prison Farm at East Shewa Zone of Oromiya, Ethiopia. Int. J. Res. Stud. Agric. Sci. 2019, 5, 44–53. [Google Scholar] [CrossRef]
- Raes, D.; Steduto, P.; Hsiao, T.C.; Fereres, E. AquaCrop—The FAO crop model to simulate yield response to water: II. Main algorithms and software description. Agron. J. 2009, 101, 438–447. [Google Scholar] [CrossRef]
- Steduto, P.; Hsiao, T.C.; Raes, D.; Fereres, E. Aquacrop-the FAO crop model to simulate yield response to water: I. concepts and underlying principles. Agron. J. 2009, 101, 426–437. [Google Scholar] [CrossRef]
- Biazin, B.; Wondatir, S.; Tilahun, G.; Asaro, N.; Amede, T. Using AquaCrop as a Decision-Support Tool for Small-Scale Irrigation Systems Was Dictated by the Institutional and Market Incentives in Ethiopia. Front. Water 2021, 3, 1–13. [Google Scholar] [CrossRef]
- Muluneh, A.; Stroosnijder, L.; Keesstra, S.; Biazin, B. Adapting to climate change for food security in the Rift Valley dry lands of Ethiopia: Supplemental irrigation, plant density and sowing date. J. Agric. Sci. 2017, 155, 703–724. [Google Scholar] [CrossRef]
- Yemane, G.; Mekonen, A.; Kassa, T. Field experimentation-based simulation of yield response of maize crop to deficit irrigation using AquaCrop model, Arba Minch, Ethiopia. Afr. J. Agric. Res. 2015, 10, 269–280. [Google Scholar] [CrossRef]
- Niu, G.; Li, Y.P.; Huang, G.H.; Liu, J.; Fan, Y.R. Crop planning and water resource allocation for sustainable development of an irrigation region in China under multiple uncertainties. Agric. Water Manag. 2016, 166, 53–69. [Google Scholar] [CrossRef]
- Hsiao, T.C.; Heng, L.; Steduto, P.; Rojas-Lara, B.; Raes, D.; Fereres, E. Aquacrop-The FAO crop model to simulate yield response to water: III. Parameterization and testing for maize. Agron. J. 2009, 101, 448–459. [Google Scholar] [CrossRef]
- Vanuytrecht, E.; Raes, D.; Steduto, P.; Hsiao, T.C.; Fereres, E.; Heng, L.K.; Vila, M.G.; Moreno, P.M. AquaCrop: FAO’s crop water productivity and yield response model. Environ. Model. Softw. 2014, 62, 351–360. [Google Scholar] [CrossRef]
- Marin, F.R.; Angelocci, L.R.; Nassif, D.S.; Vianna, M.S.; Pilau, F.G.; da Silva, E.H.; Sobenko, L.R.; Gonçalves, A.O.; Pereira, R.A.; Carvalho, K.S. Revisiting the crop coefficient–reference evapotranspiration procedure for improving irrigation management. Theor. Appl. Climatol. 2019, 138, 1785–1793. [Google Scholar] [CrossRef]
- Yang, J.; Hammer, R.D.; Thompson, A.L.; Blanchar, R.W. Predicting soybean yield in a dry and wet year using a soil productivity index. Plant Soil. 2003, 250, 175–182. [Google Scholar] [CrossRef]
- Zhao, J.; Han, T.; Wang, C. Optimizing irrigation strategies to synchronously improve the yield and water productivity of winter wheat under interannual precipitation variability in the North China Plain. Agric. Water Manag. 2020, 240, 106298. [Google Scholar] [CrossRef]
- Irmak, S.; Djaman, K.; Rudnick, D.R. Effect of full and limited irrigation amount and frequency on subsurface drip-irrigated maize evapotranspiration, yield, water use efficiency and yield response factors. Irrig. Sci. 2016, 34, 271–286. [Google Scholar] [CrossRef]
- He, W.; Yang, J.Y.; Drury, C.F. Estimating the impacts of climate change on crop yields and N 2 O emissions for conventional and no-tillage in Southwestern. Agric. Syst. 2018, 159, 187–198. [Google Scholar] [CrossRef]
- Challinor, A.J.; Wheeler, T.R. Crop yield reduction in the tropics under climate change: Processes and uncertainties. Agric. For. Meteorol. 2008, 148, 343–356. [Google Scholar] [CrossRef]
- Li, J.; Inanaga, S.; Li, Z.; Eneji, A.E. Optimizing irrigation scheduling for winter wheat in the North China Plain. Agric Water Manag. 2005, 76, 8–23. [Google Scholar] [CrossRef]
- Sullivan, R.C.; Rao Kotamarthi, V.; Feng, Y. Recovering evapotranspiration trends from biased CMIP5 simulations and sensitivity to changing climate over North America. J. Hydrometeorol. 2019, 20, 1619–1633. [Google Scholar] [CrossRef]
- Patil, R.H.; Laegdsmand, M.; Olesen, J.E.; Porter, J.R. Growth and yield response of winter wheat to soil warming and rainfall patterns. J. Agric. Sci. 2010, 148, 553–566. [Google Scholar] [CrossRef]
- Xiao, G.; Zhang, Q.; Yao, Y. Impact of recent climatic change on the yield of winter wheat at low and high altitudes in semi-arid northwestern China. Agric. Ecosyst. Environ. 2008, 127, 37–42. [Google Scholar] [CrossRef]
- Amouzou, K.A.; Lamers, J.P.A.; Naab, J.B.; Borgemeister, C.; Vlek, P.L.G.; Becker, M. Climate change impact on water- and nitrogen-use efficiencies and yields of maize and sorghum in the northern Benin dry savanna, West Africa. Field Crops Res. 2019, 235, 104–117. [Google Scholar] [CrossRef]
- Zeleke, K. Simulating Agronomic Adaptation Strategies to Mitigate the Impacts of Climate Change on Wheat Yield in South-Eastern Australia. Agronomy 2021, 11, 337. [Google Scholar] [CrossRef]
- Maharjan, K.L.; Joshi, N.P. Effect of climate variables on yield of major food-crops in Nepal: A time-series analysis. Adv. Asian Hum. Environ. Res. 2013, 1, 127–137. [Google Scholar] [CrossRef]
- Xiao, D.; Bai, H.; Liu, D.L. Impact of future climate change on wheat production: A simulated case for China’s wheat system. Sustainability 2018, 10, 1277. [Google Scholar] [CrossRef]
- Hernandez-Ochoa, I.M.; Pequeno, D.N.L.; Reynolds, M.; Babar, M.A.; Sonder, K.; Milan, A.M.; Hoogenboom, G.; Robertson, R.; Gerber, S.; Rowland, D.L.; et al. Adapting irrigated and rainfed wheat to climate change in semi-arid environments: Management, breeding options and land use change. Eur. J. Agron. 2019, 109, 125915. [Google Scholar] [CrossRef]
Publisher’s Note: MDPI stays neutral with regard to jurisdictional claims in published maps and institutional affiliations. |
© 2022 by the authors. Licensee MDPI, Basel, Switzerland. This article is an open access article distributed under the terms and conditions of the Creative Commons Attribution (CC BY) license (https://creativecommons.org/licenses/by/4.0/).