Article

Retail Apocalypse as a Differential Urbanisation Symptom? Analysis of Ground Floor Premises’ Evolution in Barcelona between 2016 and 2019

by
Alejandro Morcuende
1,* and
David Lloberas
2,*
1
Department of Anthropology, Philosophy and Social Work, Universitat Rovira i Virgili, Av. Catalunya, 35, 43002 Tarragona, Spain
2
Institute of Geography and Spatial Planning, Universidade de Lisboa, R. Branca Edmée de Marques, 1600-276 Lisboa, Portugal
*
Authors to whom correspondence should be addressed.
Sustainability 2022, 14(20), 13652; https://doi.org/10.3390/su142013652
Submission received: 16 August 2022 / Revised: 10 October 2022 / Accepted: 13 October 2022 / Published: 21 October 2022
(This article belongs to the Section Sustainable Urban and Rural Development)

Abstract

:
The current health and economic crisis resulting from the COVID-19 pandemic has accentuated some of the trends that began with the counter-reform of capitalism in 1970. This paper deals with one of those trends—the retail apocalypse. The starting hypothesis is that this phenomenon takes part in an implosion (the massive and permanent closing of retail premises in agglomeration) and an explosion (a change of land uses in an urban agglomeration and beyond). In order to determine the reach of those trends, the last two commercial censuses of the City Council (2016 and 2019) are analysed using a one-to-one relation matrix and map representation. This phenomenon, which is not just economic but also urban, is expressed differentially according to the dynamics between the upper and lower circuits of the urban economy. An implosion is detected as a general form for the whole city; in contrast, an explosion is expressed in more dynamic areas.

1. Introduction

The current economic crisis resulting from the COVID-19 pandemic and breaks in supply chains has accentuated some of the trends that began with the counter-reform of capitalism in 1970. This article analyses the evolution of one of those trends: the widespread closure of commercial premises, a process known as a retail apocalypse [1,2,3]. This process is not only a commercial or economic dynamic but an entire urban dynamic in which social, political, economic and cultural processes are involved.
The recent urban transformations have been analysed through the hypothesis of planetary urbanisation, formulated by Henri Lefebvre in 1970. The debate on the realisation or not of this hypothesis, after more than 50 years, currently drives urban studies research. Given the new forms and natures with which the urban phenomenon is presented today and the logic of innovation–obsolescence that guides them, it can be concluded that the complete urbanisation of society, announced by the French philosopher in the seventies, is in the advanced stage [4].
This text is based on the hypothesis that a retail apocalypse is part of the same process of implosion (by which there is a massive and permanent closure of commercial premises in the agglomeration) and explosion (a substitution of uses of both the premises from the agglomeration as well as from other areas, such as the hinterland, supposedly remote and/or wild). To explore this hypothesis, the city of Barcelona is taken as a case study. Based on the analysis of the Census of Economic Activities on the Ground Floor of the City of Barcelona for the years 2016 [5] and 2019 [6], the state and evolution of the commercial structure of the city are determined. The objective is to find out if the process of a retail apocalypse is taking place in the city, what its characteristics are, what sectors drive or slow down this process, and how it is distributed throughout the different neighbourhoods and commercial axes.
For this, different one-to-one analyses are carried out, which allow us to uncover the evolution of each of the commercial premises between 2016 and 2019, in the pre-pandemic period. Once the quantitative and spatial analyses have been carried out using cartography, the article will conclude that, indeed, a retail apocalypse is an implosion that influences the agglomeration as a whole. However, it has differential behaviours according to the organisation and relationship between the upper circuit and the lower circuit of the economy. That is why it is necessary to add different theoretical and analytical paradigms when addressing a retail apocalypse, such as the hypothesis of planetary urbanisation and its concretion in the processes of implosion–explosion [7,8] and the constitution of the circuits of the urban economy [9].

2. Theoretical Framework

2.1. Planetary Urbanisation Hypothesis

To advance theoretically and empirically on the concept of differential urbanisation, it is necessary to start from the original hypothesis, elaborated by Henri Lefebvre in The Urban Revolution [7]. In this text, the French author formulated that the complete urbanisation of society, being in 1970 still virtual, would eventually become real. Now, as urbanisation spreads throughout the earth’s surface, advancing the Lefebvre hypothesis, urban research must focus its theoretical and empirical efforts on the analysis of its concreteness.
We consider that the hypothesis is largely realised because urban transformations have been happening for decades, both in cities and metropolitan areas as well as in their territories of influence and remote and wild areas, namely, the hinterlands [10]. However, the hypothesis of planetary urbanisation today animates the debate within urban studies research and has very solvent critics [11].
What has been observed is, first of all, new geographies of uneven spatial development, where rapid and innovative urbanisation processes are involved—largely covered by the discourse of green and sustainable urbanism and of creative cities [12,13]—and processes of detachment and marginalisation, which largely take place in rural and urban peripheries around the world. Secondly, we see the emergence of new kinds of urban phenomena that generate new economic conditions and metabolic changes at a planetary level, such as the proliferation of mega infrastructures linked to the obtaining and distribution of energy [14]. Thirdly, we observe the establishment of new regulatory geographies of urbanisation, such as the creation of local government networks at different scales or large metropolitan and transnational alliances [15].
One of the most useful ways to approach contemporary urbanisation is from its constituent moments. The first moment of concentration indicates the processes of accumulation of people, capital and infrastructure, among others, in the agglomeration. The second moment of extension refers to the operationalisation of territories and landscapes beyond the agglomeration, although they remain under its command. The third moment is the differential moment that points towards the creative destruction of the geographies of concentration and extension and creates new urban potentials for accumulation [15].
Attention is focused here on this third moment, which, containing the other two, synthesises the dynamism with which the capitalist forms of urbanisation act today, following a constant logic of innovation and obsolescence. It also incorporates the context in which it originates and develops: capitalism in crisis since its counter-reform in 1970, which has suffered the moments of greatest contradiction after the crises of 2008 and 2020 [16,17]. These contradictions, also territorialised, mark the rhythm and character of differential urban processes that are rapidly changing and, thus, compromise the social and spatial orders inherited from post-war capitalism (1945–1970).

2.2. Differential Urbanisation

Still under-theorised, differential urbanisation opens different theoretical and empirical horizons in urban research [18]. If the moments of concentration and extension have occurred at different rates according to the socio-spatial contexts, the differential moment has been pacing them since 1970. It points out, therefore, the urban transformations to a specific social formation, capitalism in crisis or neoliberalism, thus giving the urbanisation a historical character. This concept does not aim to identify ruptures in urban development but rather to identify trends that have strengthened or stagnated since the counter-reform of capitalism [19].
The adjective differential aims to point out this step from one world organisation to another (restructuring of States, austerity, deregulation of labour markets, etc.) and from one type of urbanisation to another, which takes shape in the following transformations: the near disappearance of social housing and land price controls, creating new opportunities for speculative investment; the elimination of public spaces and their replacement by closed spaces, both residential and consumer; and the replacement of territorial and urban planning typical of post-war capitalism by a rhetoric of the renewal and rejuvenation of cities [20].
Heterogeneous, polymorphic and contradictory urbanisation, typical of the differential moment, can well be synthesised in the metaphor of implosions–explosions, which also appears for the first time in Lefebvre’s Urban Revolution, which he defines as follows: “the tremendous concentration (of people, activities, wealth, goods, objects, instruments, means and thought) of urban reality and the immense explosion, the projection of numerous, disjunct fragments (peripheries, suburbs, vacation homes, satellite towns) into space” ([7], p. 26).
Implosions–explosions are the driving forces of creative destruction of concentration and extension geographies. This is possible because of the theoretical hypothesis of planetary urbanisation. This hypothesis, which was just potential in 1970, still allows urban transformations to be analysed as long-term trends that can be captured at different times. Trends that accelerate or stagnate, which may end up expressing themselves in one way or another and end up materialising or not, having their origin in past years, may have accelerated with the pandemic of 2020 [19]. In this way, a retail apocalypse is addressed in this text as a symptom of differential urbanisation, being part of an implosion (the massive and permanent closure of commercial premises) and an explosion (the replacement of functions in several commercial premises inside and outside the agglomeration).

2.3. Urban Economy Circuits and Uneven Development

In the analysis of a retail apocalypse as part of an implosion–explosion, it will be useful at an explanatory level to focus on the uneven degree of the modernisation of the territory [21,22]. Milton Santos in L’espace partagé, les deux circuits de l’economie urbaine differentiates the different kinds of activities that take place in a city according to their degree of insertion in modernity, starting from a lower circuit to a superior circuit [9]. In this sense, Santos considers the concepts of modernity and traditionality applied to the circuits of the urban economy as imprecise and ambiguous since both are the result of modernisation processes that affect the economy of cities through technological and organisational innovations.
Thus, Santos states that it is not “a coexistence between models belonging to different eras” but rather “different forms of combination between a new model of production, distribution and consumption and a pre-existing one [...], that is to say, it is an acceptance of the elements of modernisation in different degrees” ([9], p. 54). These different degrees of integration with modern techniques take shape on the territory, where they are spatially segregated, as a result of the uneven development process as explained by Arroyo: “The process of capitalist modernisation, in turn, does not reach the whole city equally, but is present in each part of the urban space with different intensities and speeds, creating different conditions for economic activities” ([23], p. 8).
This selective modernisation of the city is a dynamic process that occurs from the interaction between the agents and the urban space, which causes changes in the urban structure, such as the emergence of new centralities, that will later reflect the urban structure: “[…] agents occupy certain portions of the built environment. However, locations are not permanent, and their duration depends on the equation between the cost of the place in the urban fabric and the capacity to add value to products and services. Hence the migration of less capitalised firms and the incessant reorganisation of urban centralities in this extensive built environment” ([24], pp. 79–80).
To classify the different economic activities, Santos proposes a series of variables to be analysed together, which are mainly based on the differences in technology and organisation ([9], pp. 43–46). The fundamental factor is the ratio between capital and labour necessary to develop the activity, which has an impact on the technology and organisation available. Silveira argues that “[…] the technical and organisational base becomes more sophisticated and emerges as a watershed between actors” ([24], pp. 82–83) and gives some examples of those technical–informational innovations, such as bar codes for stock, sales and price control; the existence of periodic discounts; and the creation of loyalty cards. A high degree of organisation in logistics is essential for just-in-time distribution methods, and, at the same time, a speed that only modern techniques allow is necessary.

2.4. Retail Shapes of Circuits of Urban Economy

Some of the commercial shapes of the upper circuit are, firstly, franchises; this form of organisation is through the symbolic and financial capital represented by the brand. This allows the upper circuit to avoid multiple and atomised investments in fixed capital and labour, externalising the risk of the investment to its marginal portion; at the same time, it helps to spread the brand spatially in strategic places such as urban centres and shopping centres. Secondly, linked to the textile sector, we find that outlets, as Silveira explains, help big brands “renew their collections and impose novelty without paying the costs of overproduction, which allows […] to raise prices in shops in the most expensive areas of the city” ([24], p. 86). Thirdly, in terms of the food sector, there are the supermarket chains, which often take the form of hypermarkets but which have recently tended to diversify their dimensions in order to enter into direct competition with equivalent establishments in the lower circuit, such as groceries, self-services run by Pakistanis, Chinese fruit shops, etc.
Electronic commerce, through which the upper circuit deepens the depredation of consumers from the lower circuit, deserves a separate mention since second-hand goods that previously had to be unavoidably bought at fairs or second-hand markets can now be purchased through the internet. It is the organisation and intensive use of information that makes the use of these platforms attractive for the consumer, materialising in large, computerised inventories and a very agile infrastructure in the “door to door” distribution of goods at affordable prices. The new forms of commerce linked to the upper circuit seek to reduce to a minimum the spatial obstacles to the territorial expansion of the company, thus guaranteeing fluid contact with the consumer ([23], p. 238).
On the other hand, those activities belonging to the lower circuit, according to Silveira, usually take the form of small-scale activities, such as retail trade, street trade or repair services. This circuit has a great dependence on the superior circuit, with which it competes for a portion of consumers; however, it is through adapting to the circumstances that it manages to survive. There are cases in which the lower circuit can even end up indirectly taking advantage of some of the variables that, in the first instance, can become contrary to them, such as the advertising prepared by the upper circuit that ends up creating opportunities in the market for products of imitation ([24], p. 87).
Bazaars are one of the most common forms in the lower circuit and are shops often run by Chinese people selling Chinese products. There is a wide variety of products available in fairly large quantities, and the price is at a similar level to the quality of the product: low or very low. Recently, in European cities such as Barcelona, due to the influence of tourism, a new kind of “souvenir bazaar” has emerged, with a much smaller retail space and lower stock, run by Pakistanis focusing on low-cost souvenirs. As Santos says, the lower circuit ends up being the refuge of those who have just arrived in the city, e.g., immigrants who lack capital and/or qualifications ([9], p. 202) and need a job, usually provided by their compatriots, in order to get integrated into their new reality [25].

3. Material and Methods

Working with commercial censuses always entails some difficulties derived from the great dynamism of the phenomenon itself; however, both our own experience and that of others lead us to affirm that it constitutes a key element for studying commerce in the city [26]. The way to proceed in relation to a census is very different if it is your own or is carried out by some institution since, in the first case, there is total customisation of the research elements [27], while, in the second, a census universe is impossible to reach strictly by one’s own means.
Faced with the censuses carried out by Barcelona City Council in 2014, 2016 and 2019, in order to apply the desired first exploratory level, it is necessary to: (a) appreciate the possibilities of comparing them with each other and (b) simplify the categorisation in order to adapt it to our object of study. Once these tasks have been carried out, the first analysis of the data can be developed, which consists of: (1) comparing the aggregated results of the new categories, (2) disaggregating the results, considering the individualised evolution of each record, to decide where to put the focus for the next step, (3) the spatialisation of the results or, in other words, mapping the evolution.

3.1. Data Sources

The information used in this analysis is taken from the Census of Economic Activities on the Ground Floor of the City of Barcelona, prepared periodically by the Department of Commerce of Barcelona City Council. Open Data BCN, the City Council’s open data service, makes the 2014, 2016 and 2019 editions in CSV format freely available.
The census consists of a matrix with a record (line) per commercial premise, active or not, and a series of fields (columns) with appropriate information that can be extracted for each record. In 2016, there was a total of 78,033 geolocated premises, while in 2019, there were 2000 more: 80,550. However, just 70,526 records are comparable between those two moments; hence, only those were used for this comparative study (Figure 1).
The fields of greatest interest to our research are: the individual identifier (ID16 and ID19), the location (XY UTM ETRS89 coordinates and census section code) and the classification with different hierarchy levels (active/inactive, activity name, activity sector and activity group). Other fields with a secondary interest are: name of the place, cadastral reference, address, open/closed 24 h, internal/external to markets, internal/external to shopping centres and internal/external to retail axes.
Regarding the first question raised at the beginning of this section—the possibility of comparing one census with another, that is, the equivalence of the censuses—we understand that this property only occurs between those of 2016 and 2019 and not between these and that of 2014. The 2014 census contains a smaller sample (67,433 records), and the lack of fields with common identifiers with other years (ID16 and ID19) would seriously hinder the second phase of analysis: to know the changes that have occurred premise by premise. The difficulties related to categorisation will be discussed in the next section.

3.2. A General Categorisation Created Ad Hoc

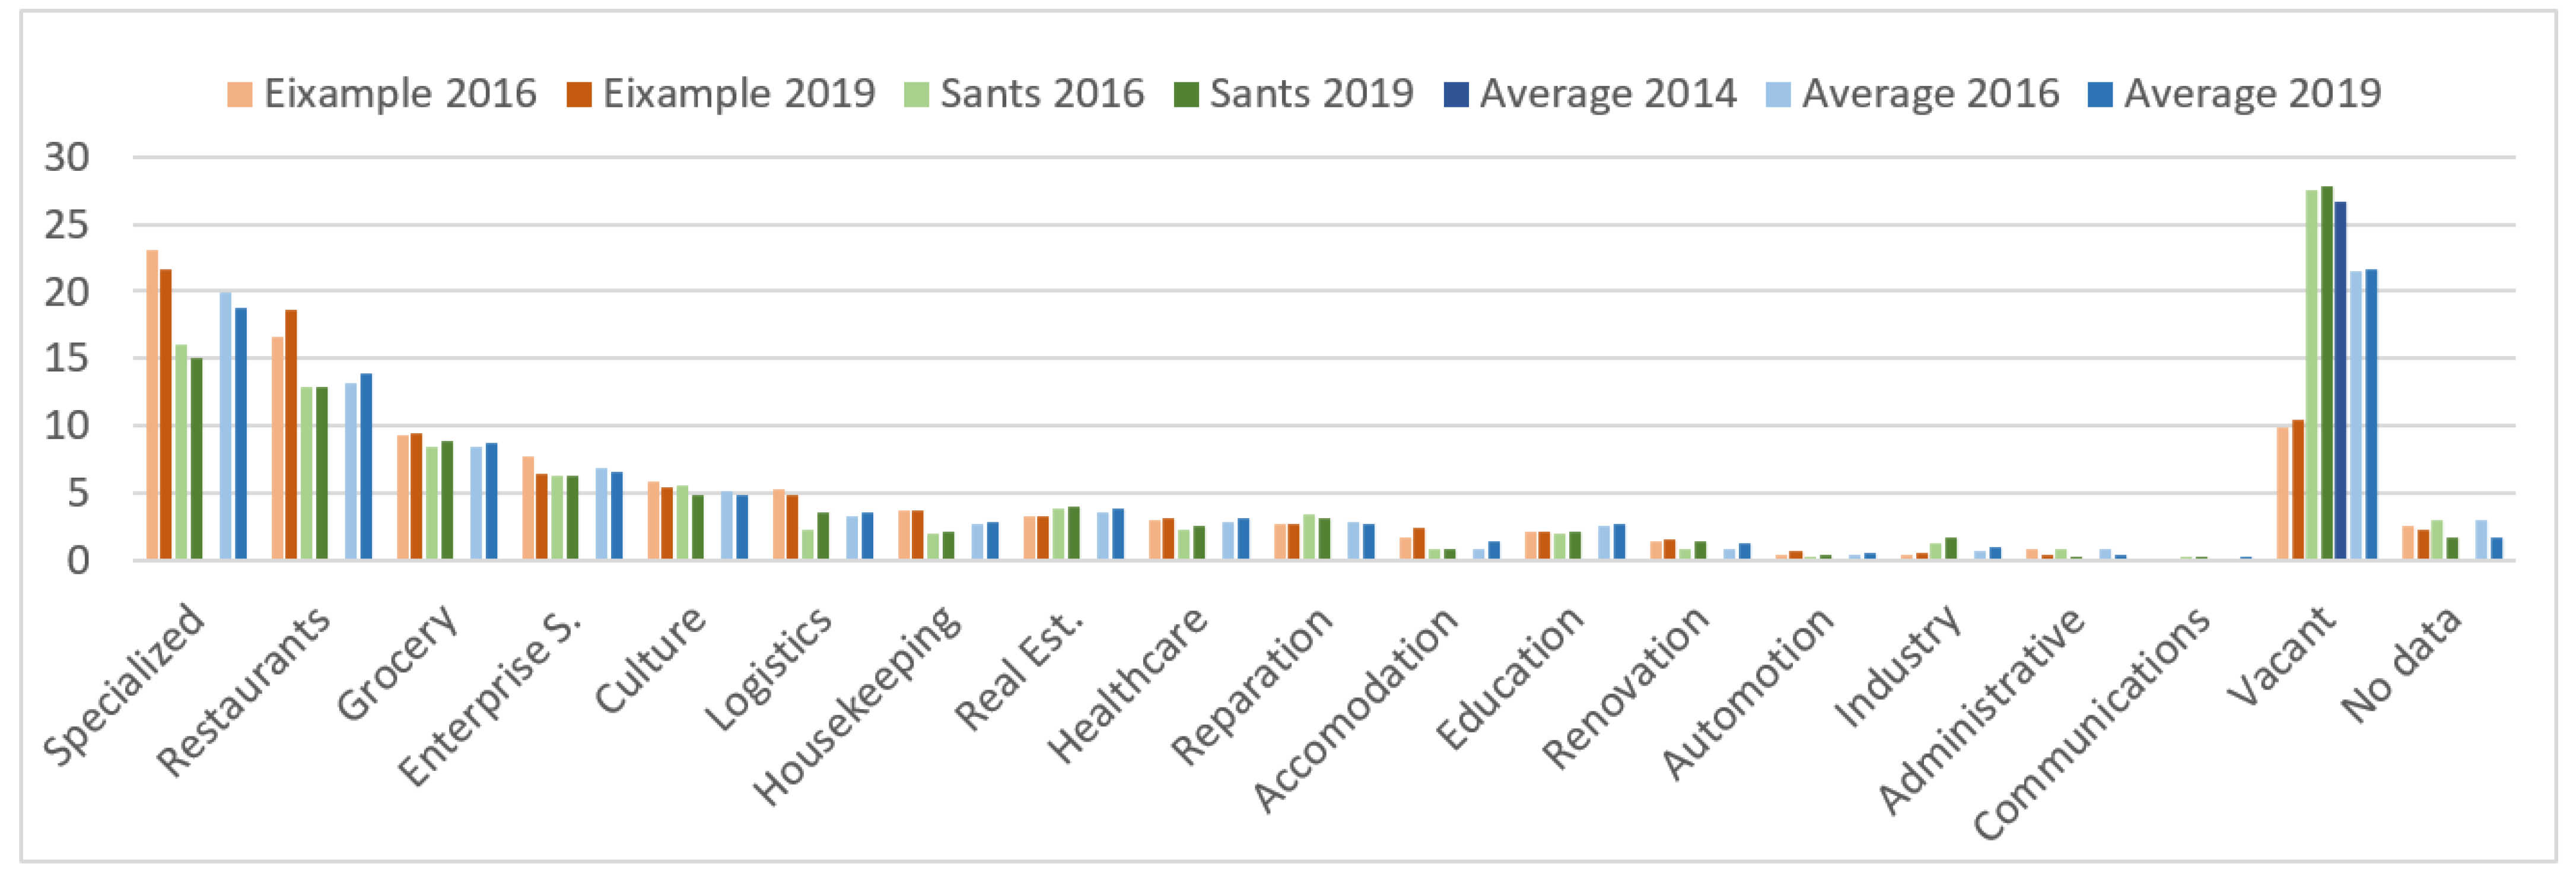
The categorisation created ad hoc—19 categories—for this research is done by bringing together categories of the most specific level of classification—namely, of activity (86 categories)—following a criterion of similarity, in a functional sense, of the type of activity developed (Appendix A & Figure 2). Thus, the new categories seek to replace the more general classification levels that existed by default (activity sector, 10 categories; activity group, 16 categories).
In relation to the 2014 census, there is the added difficulty of using different categories (only 44 categories) to those created in 2016 (69 categories) and consolidated and supplemented in 2019 (86 categories); the most concrete classification level was used for this purpose. For this concrete reason, and those set out in the previous section, we decided to exclude the 2014 census from the analysis made for this article.

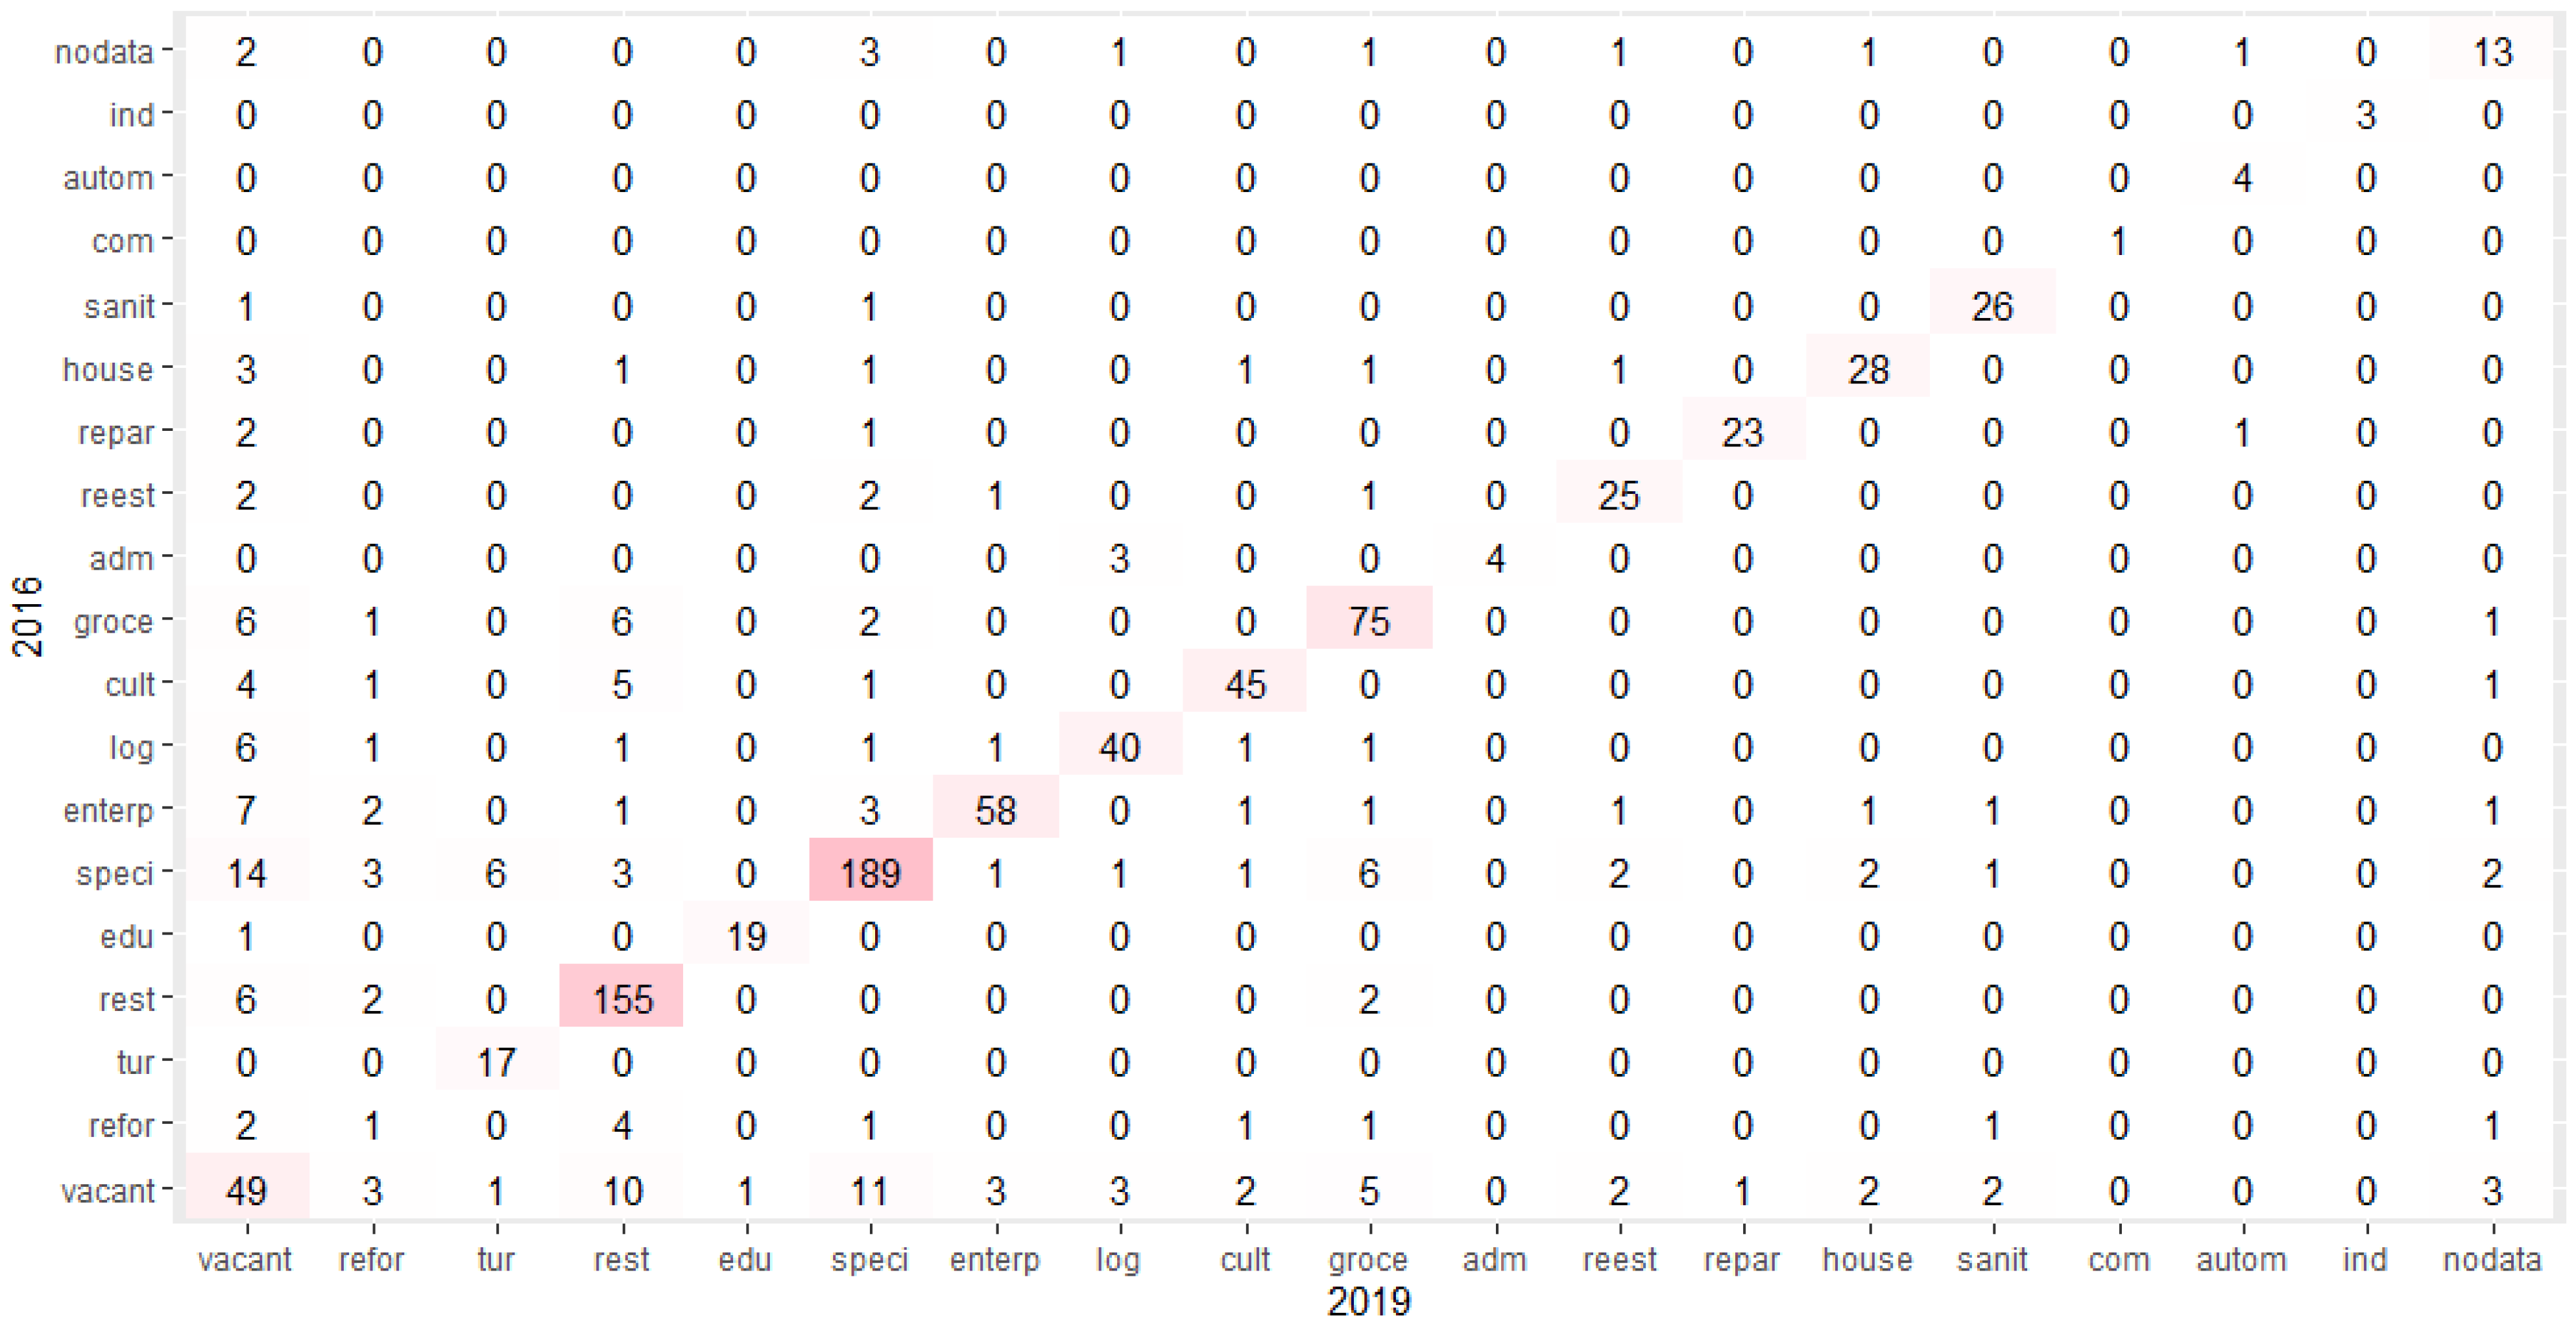
3.3. Data Treatment on One-to-One Relation Matrix

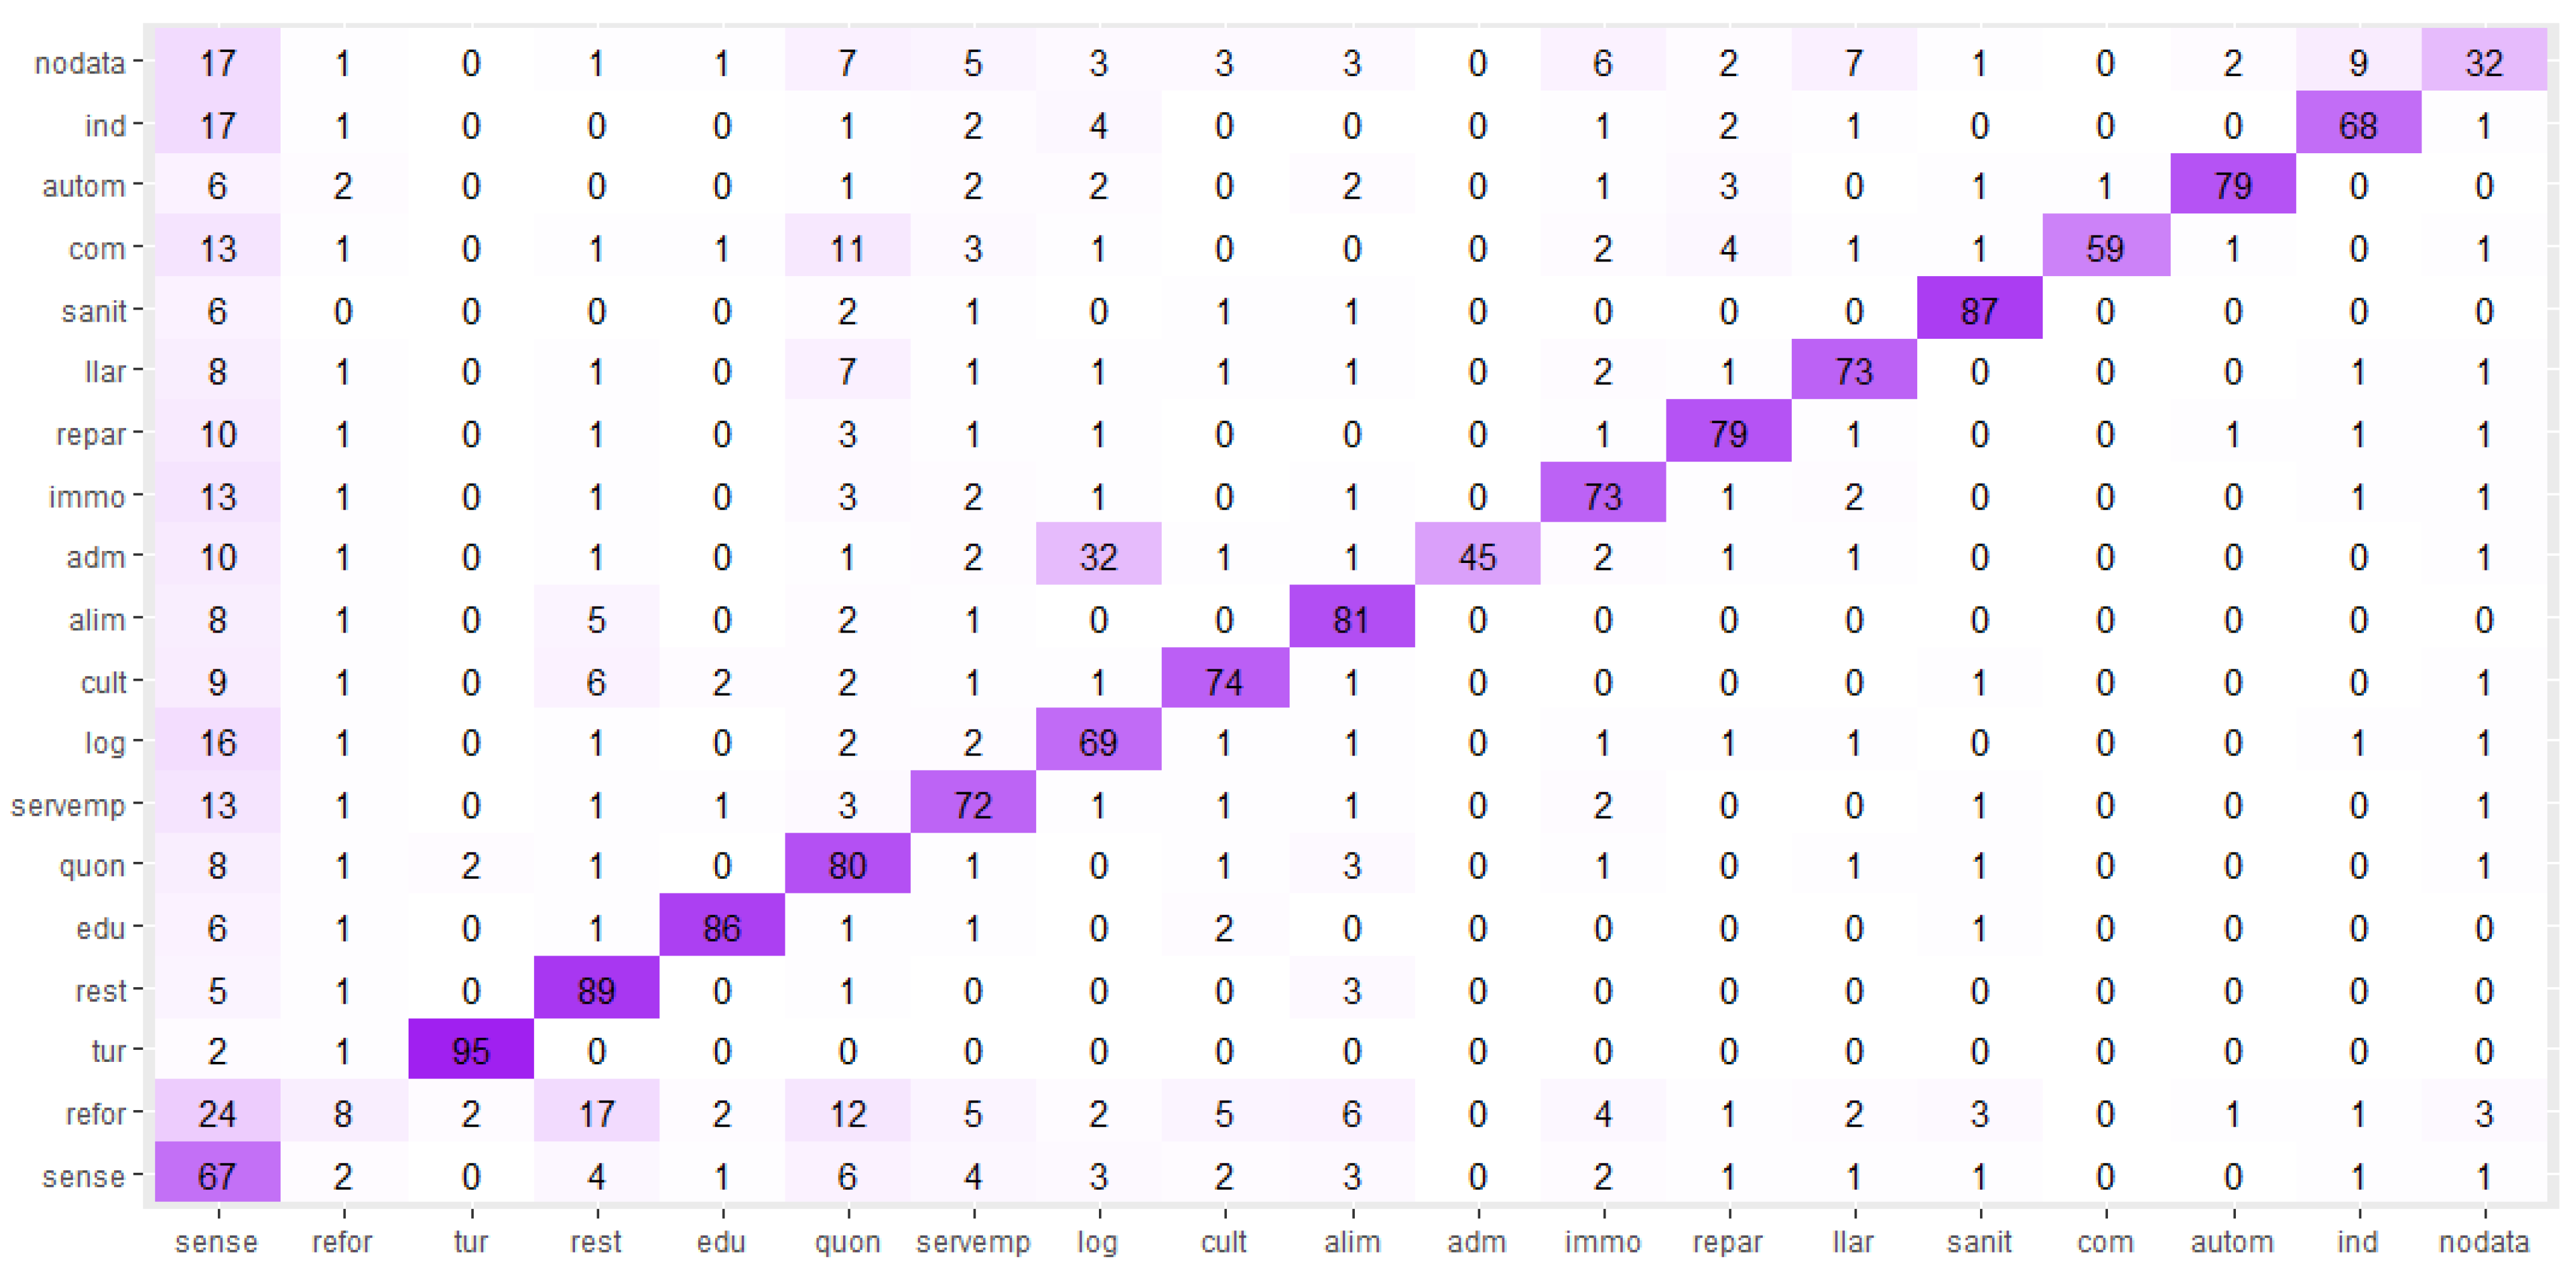
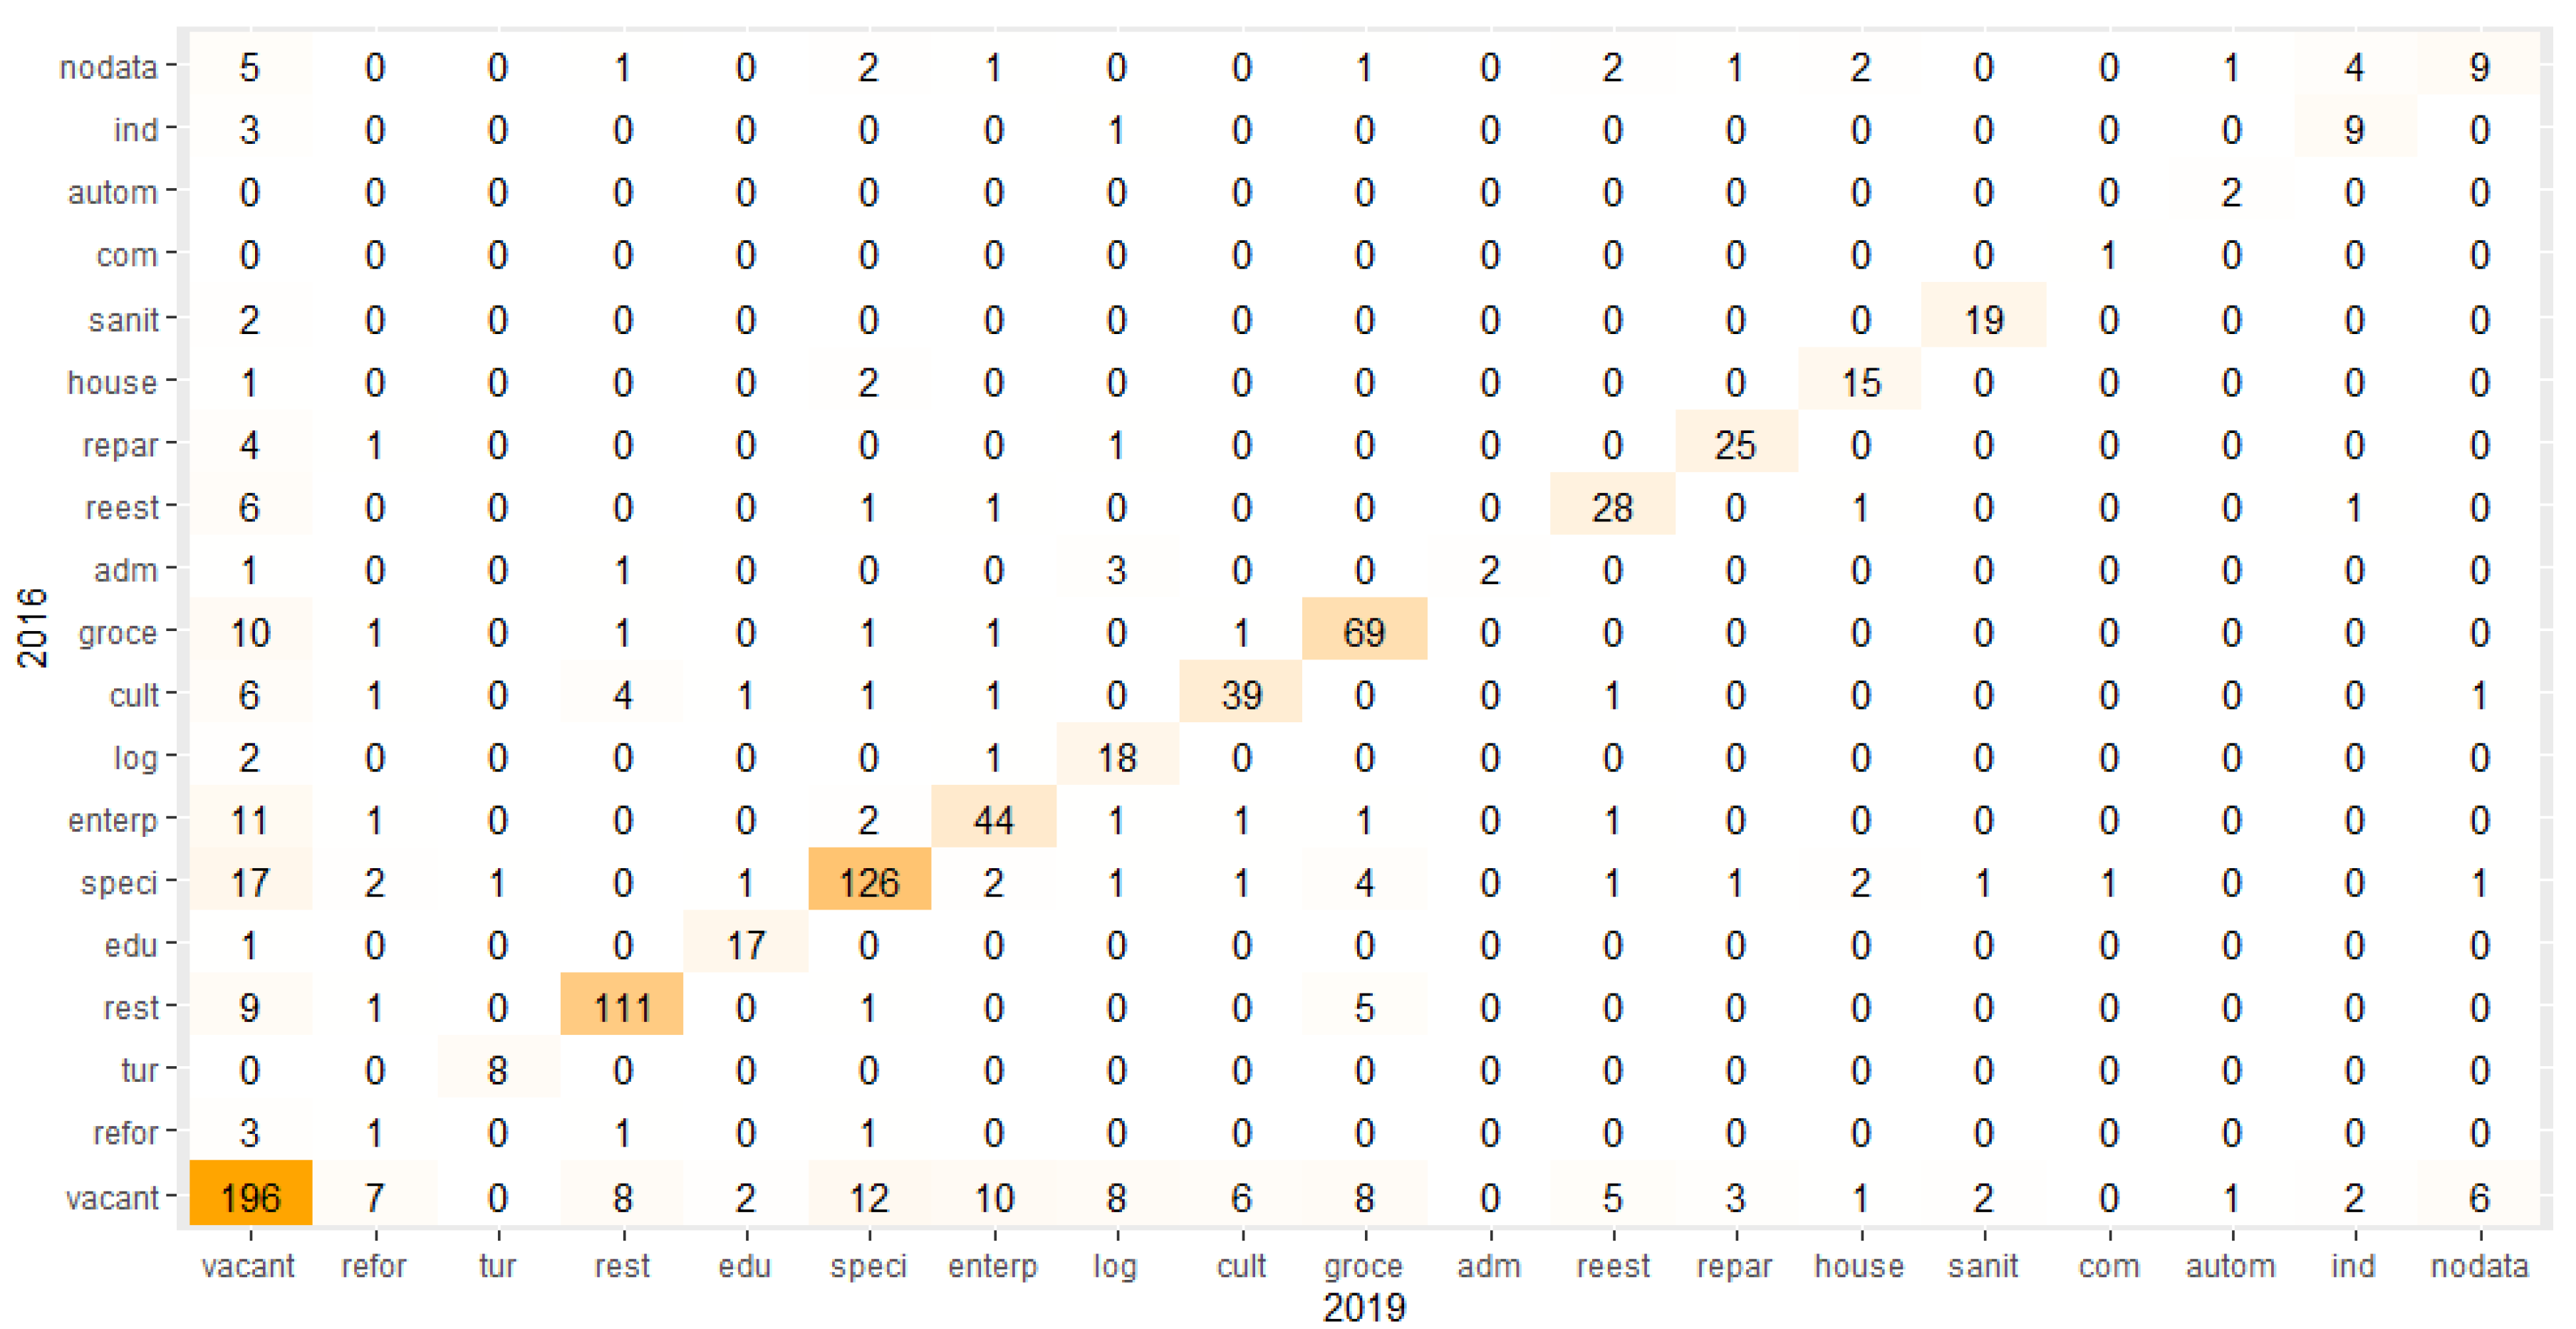
The one-to-one relations analysis consists of following the evolution of each individual premise in the study period; thus, the flows between categories are made visible. The direct result of this is to obtain a relation matrix, in which both axes are compounded by the categories equally ordered, which contain the amount of each possible relation between categories in the two moments. The most common relations appear diagonally; the remaining relations are from a category in 2016 to the same category in 2019.
The main variables of this one-to-one analysis are, on one hand, the vacant-to-vacant rate and the category-to-vacant rate to analyse the implosion process, and, on the other hand, the vacant-to-category rate and the category A-to-category A remaining rate as the main variables describing the explosion process.
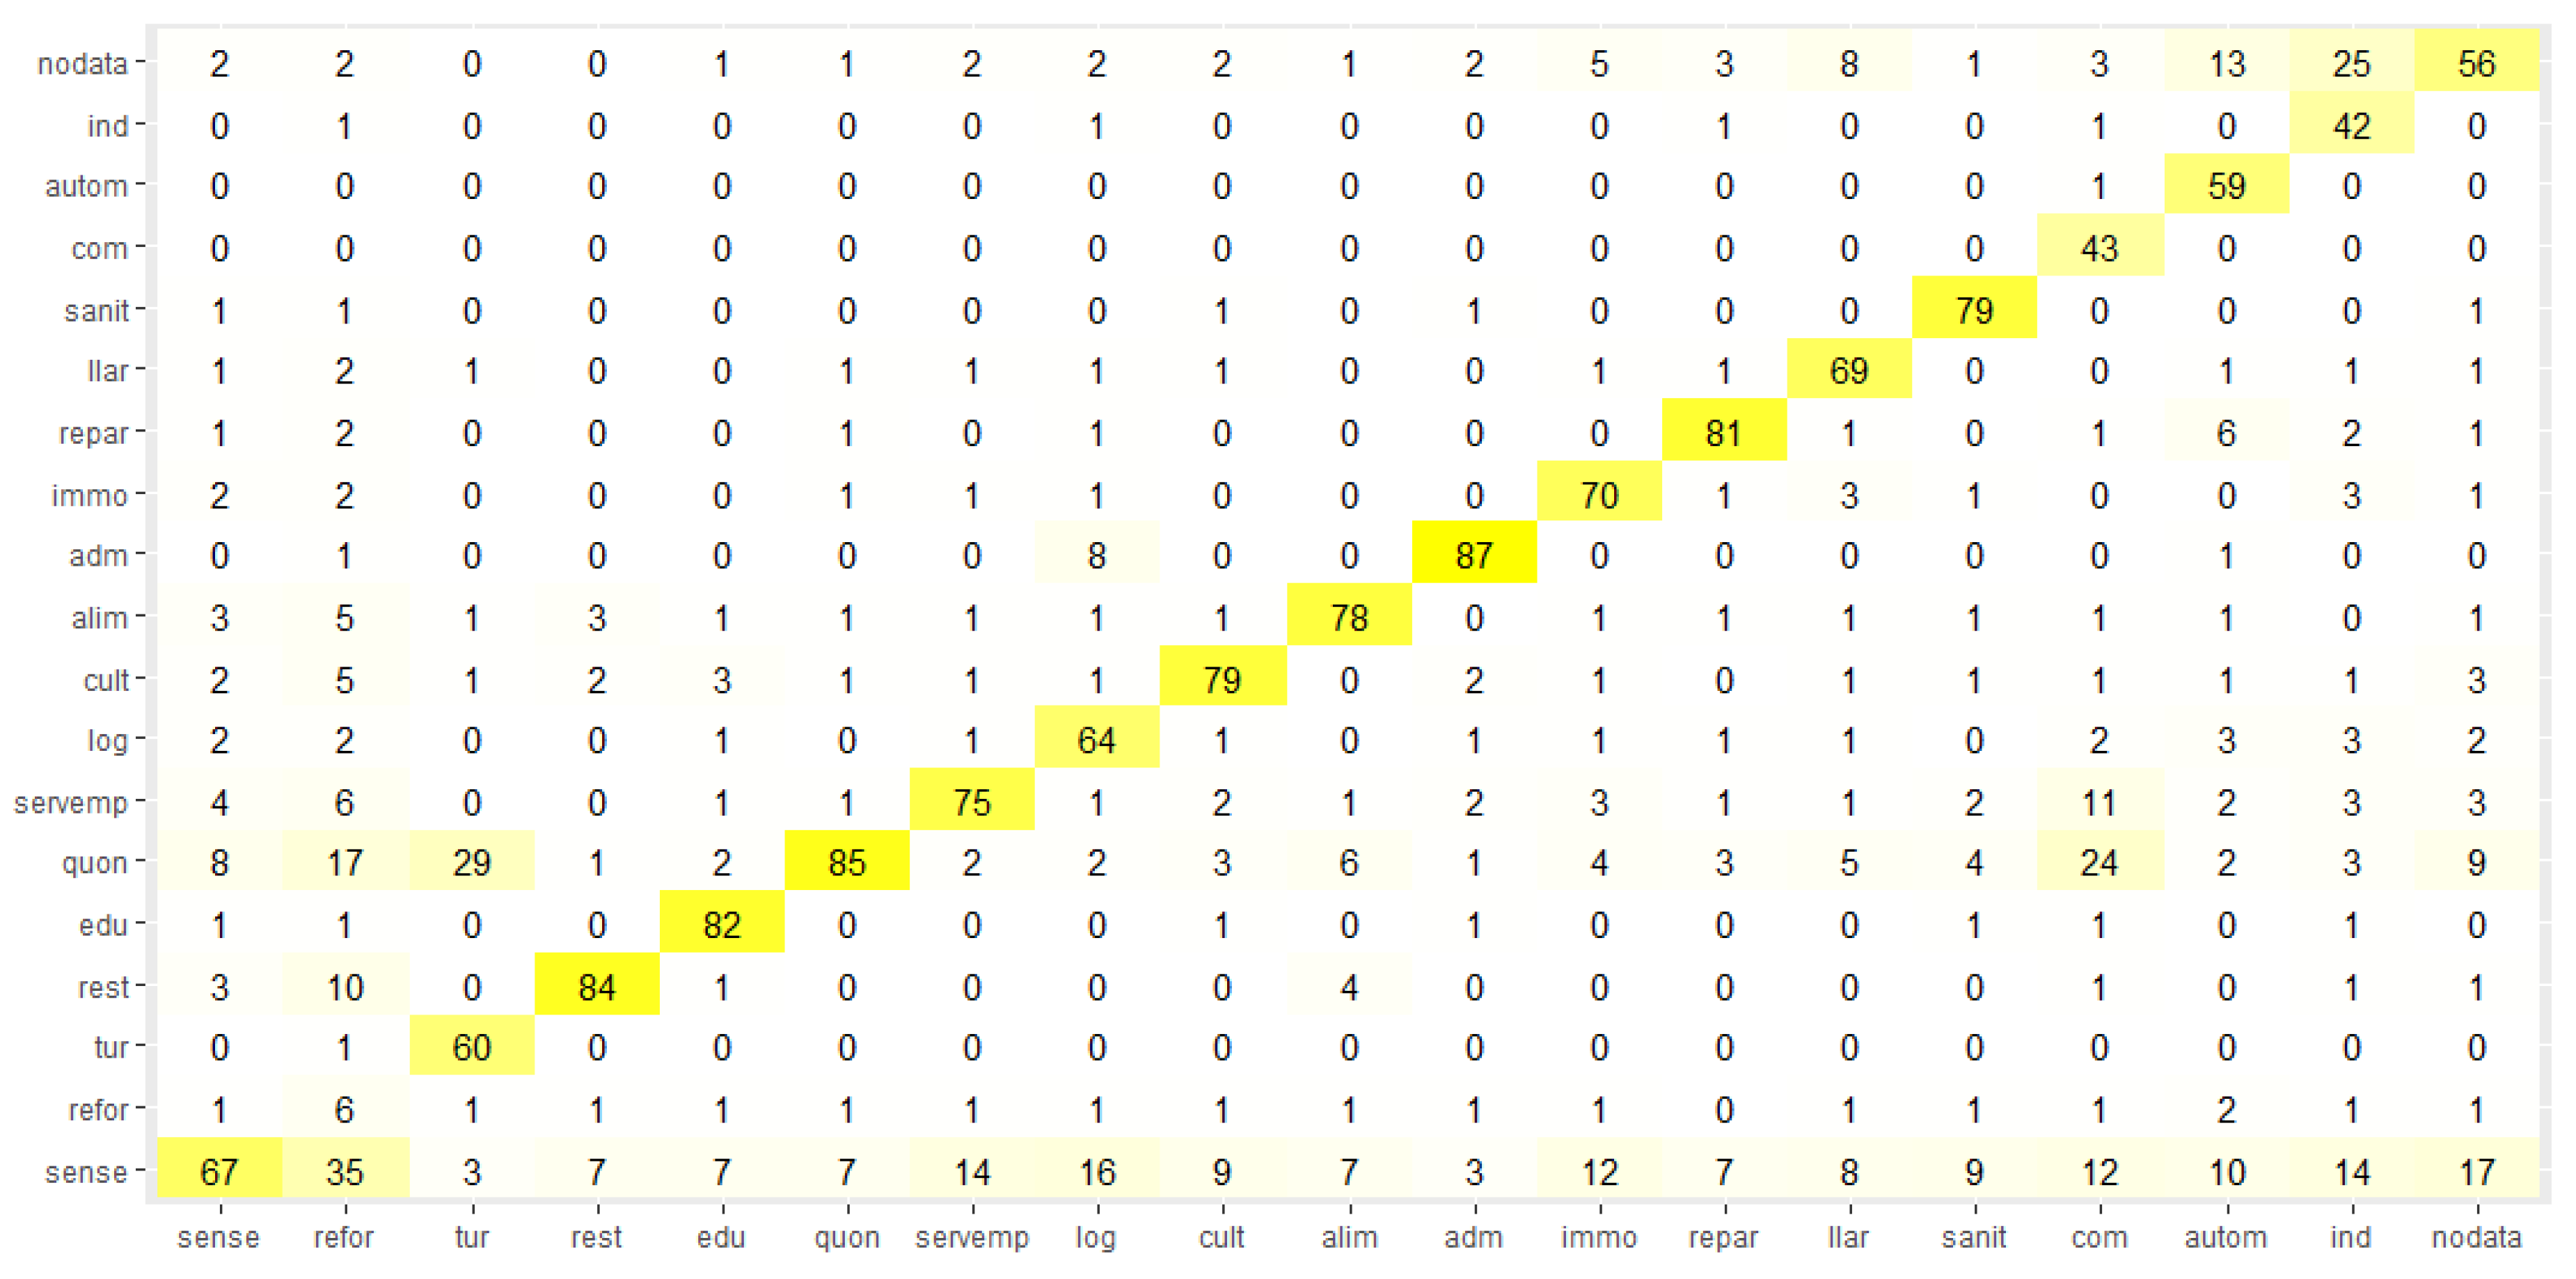
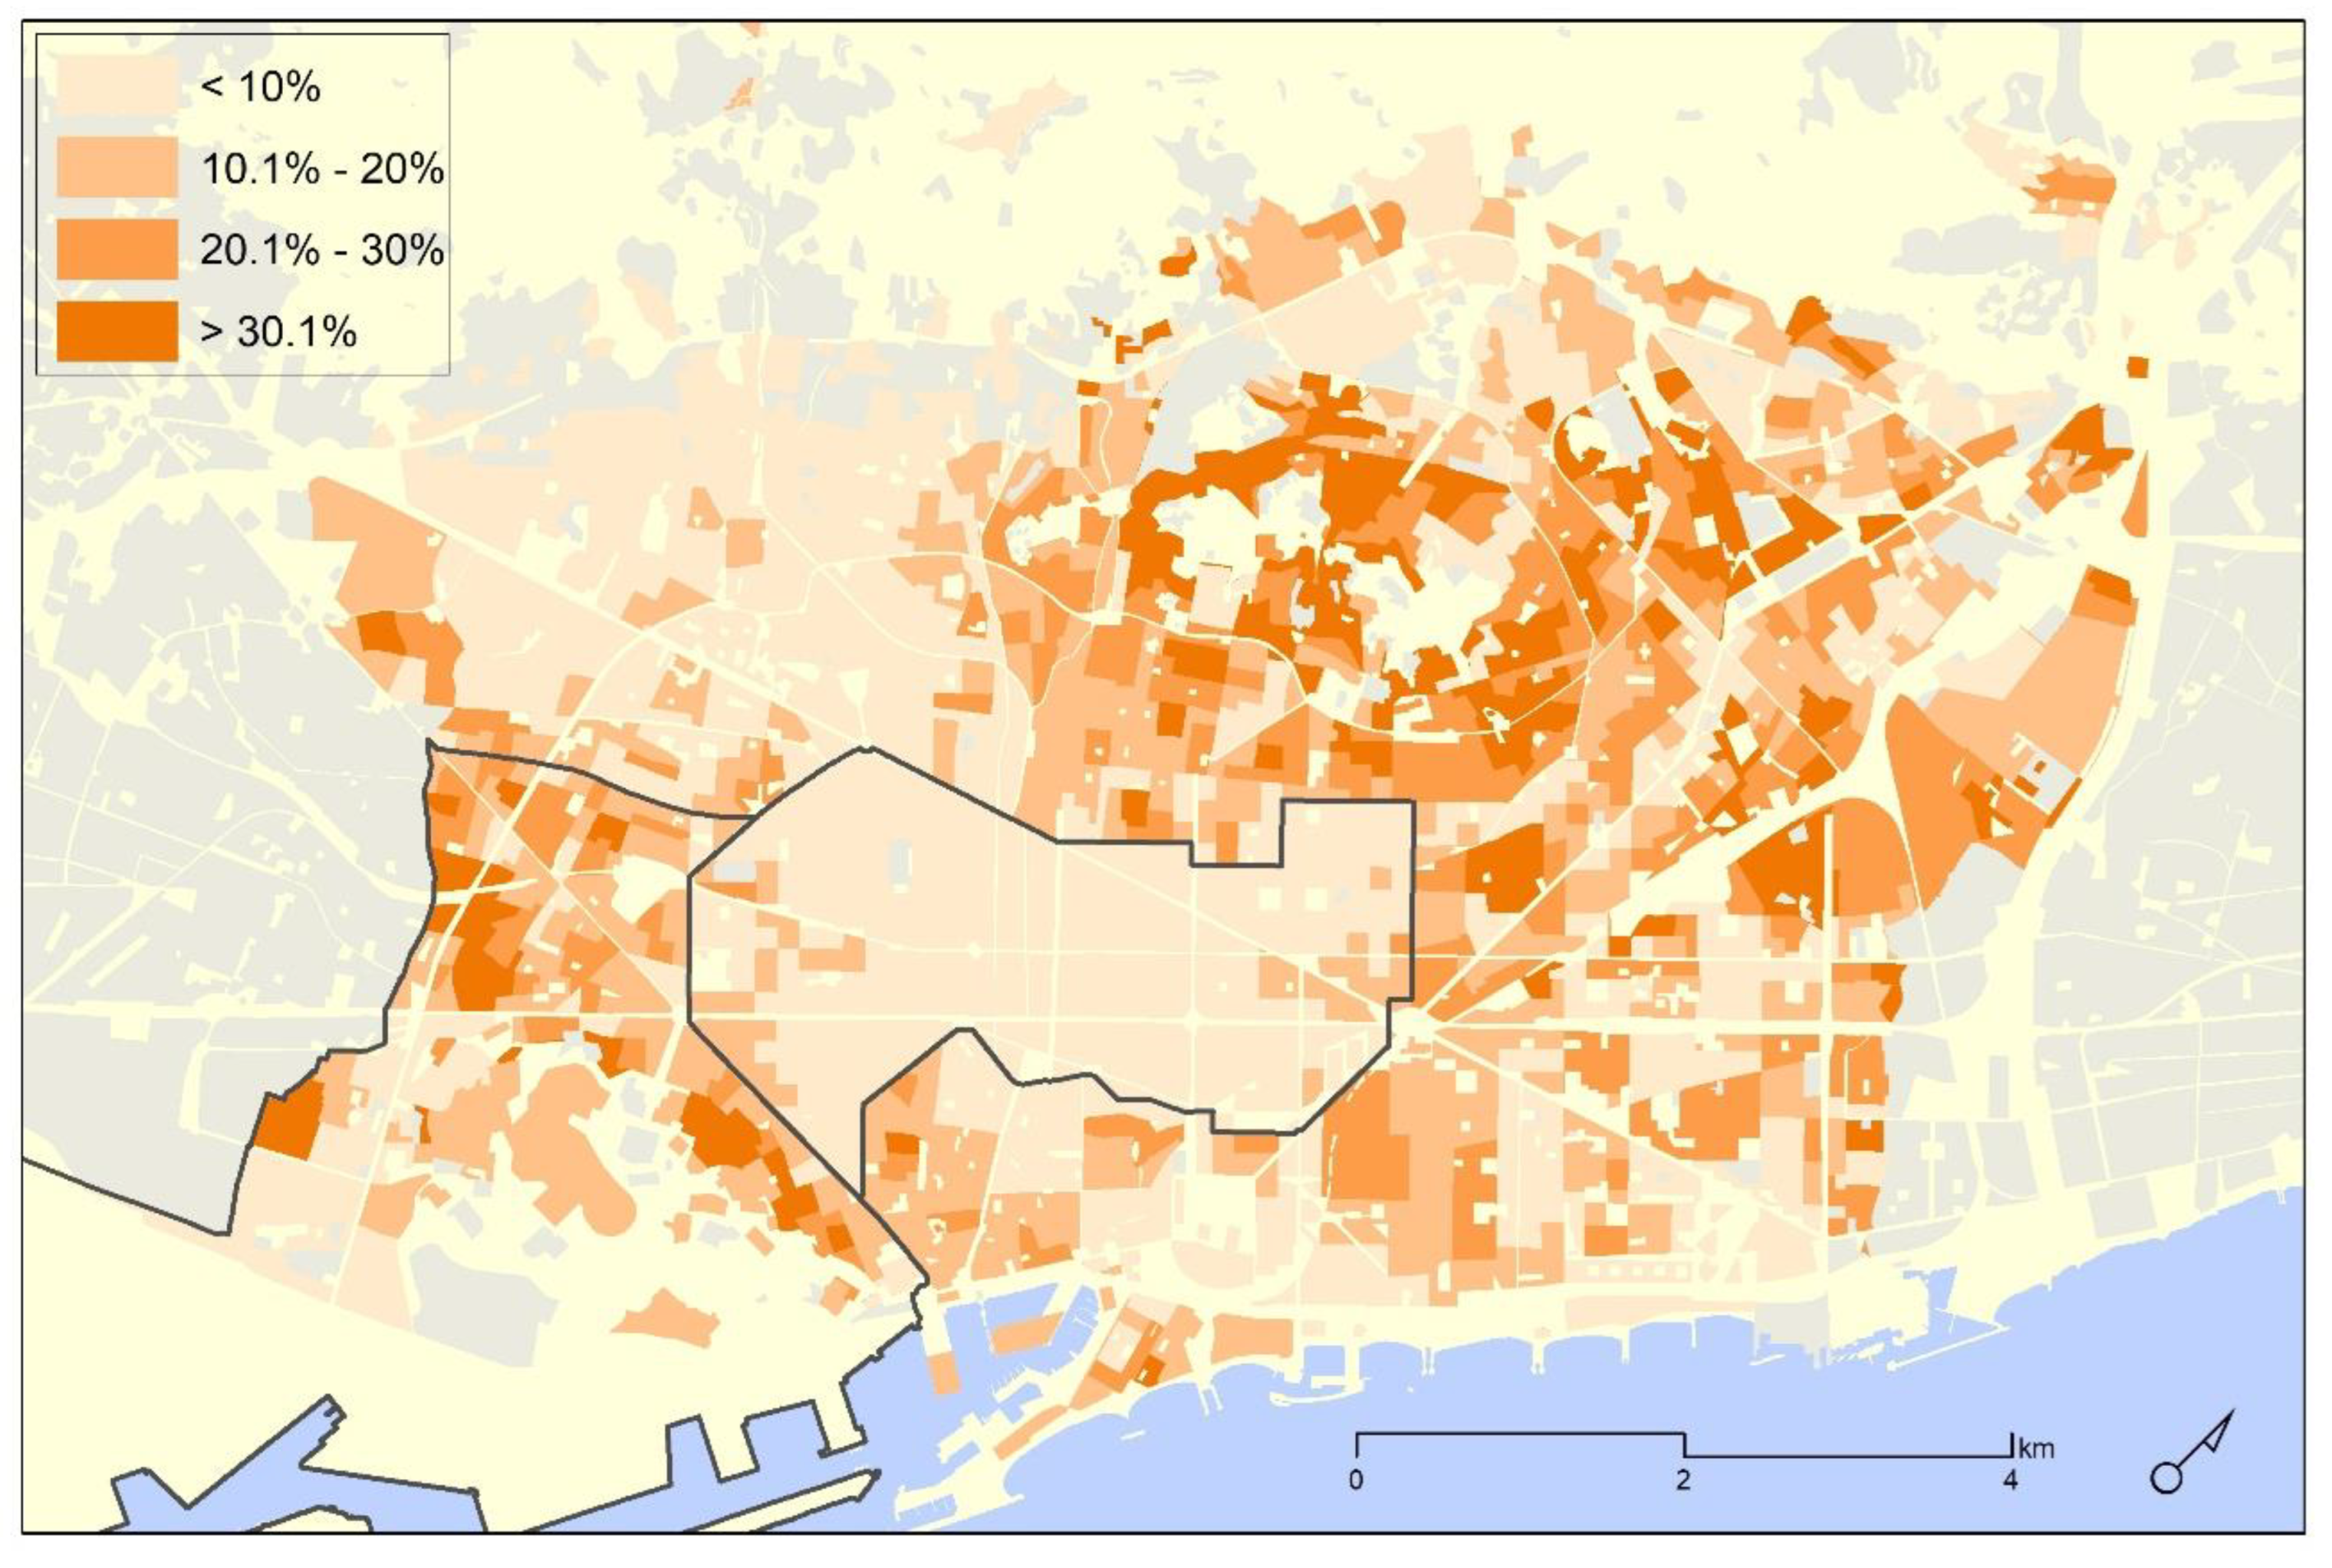
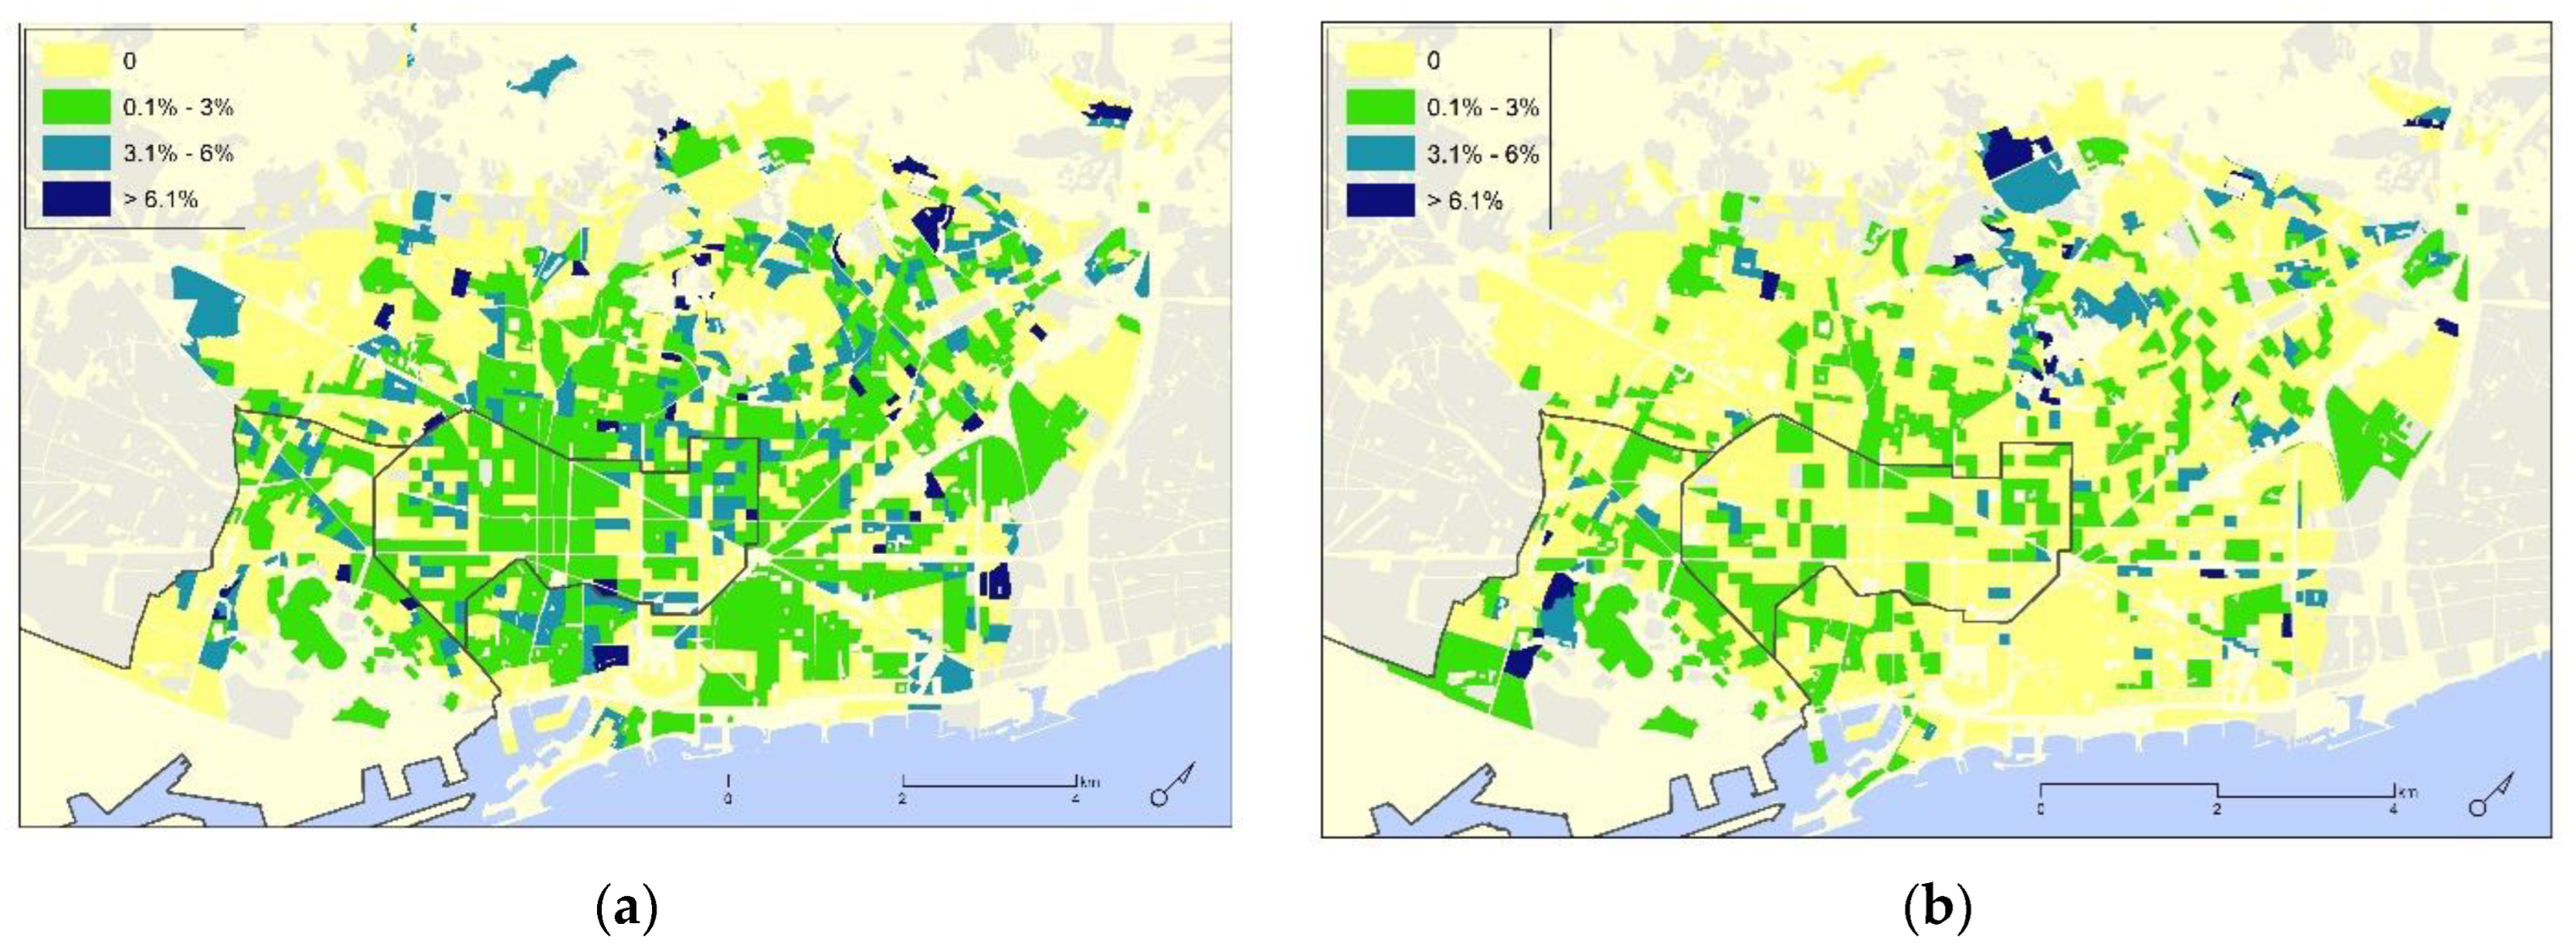
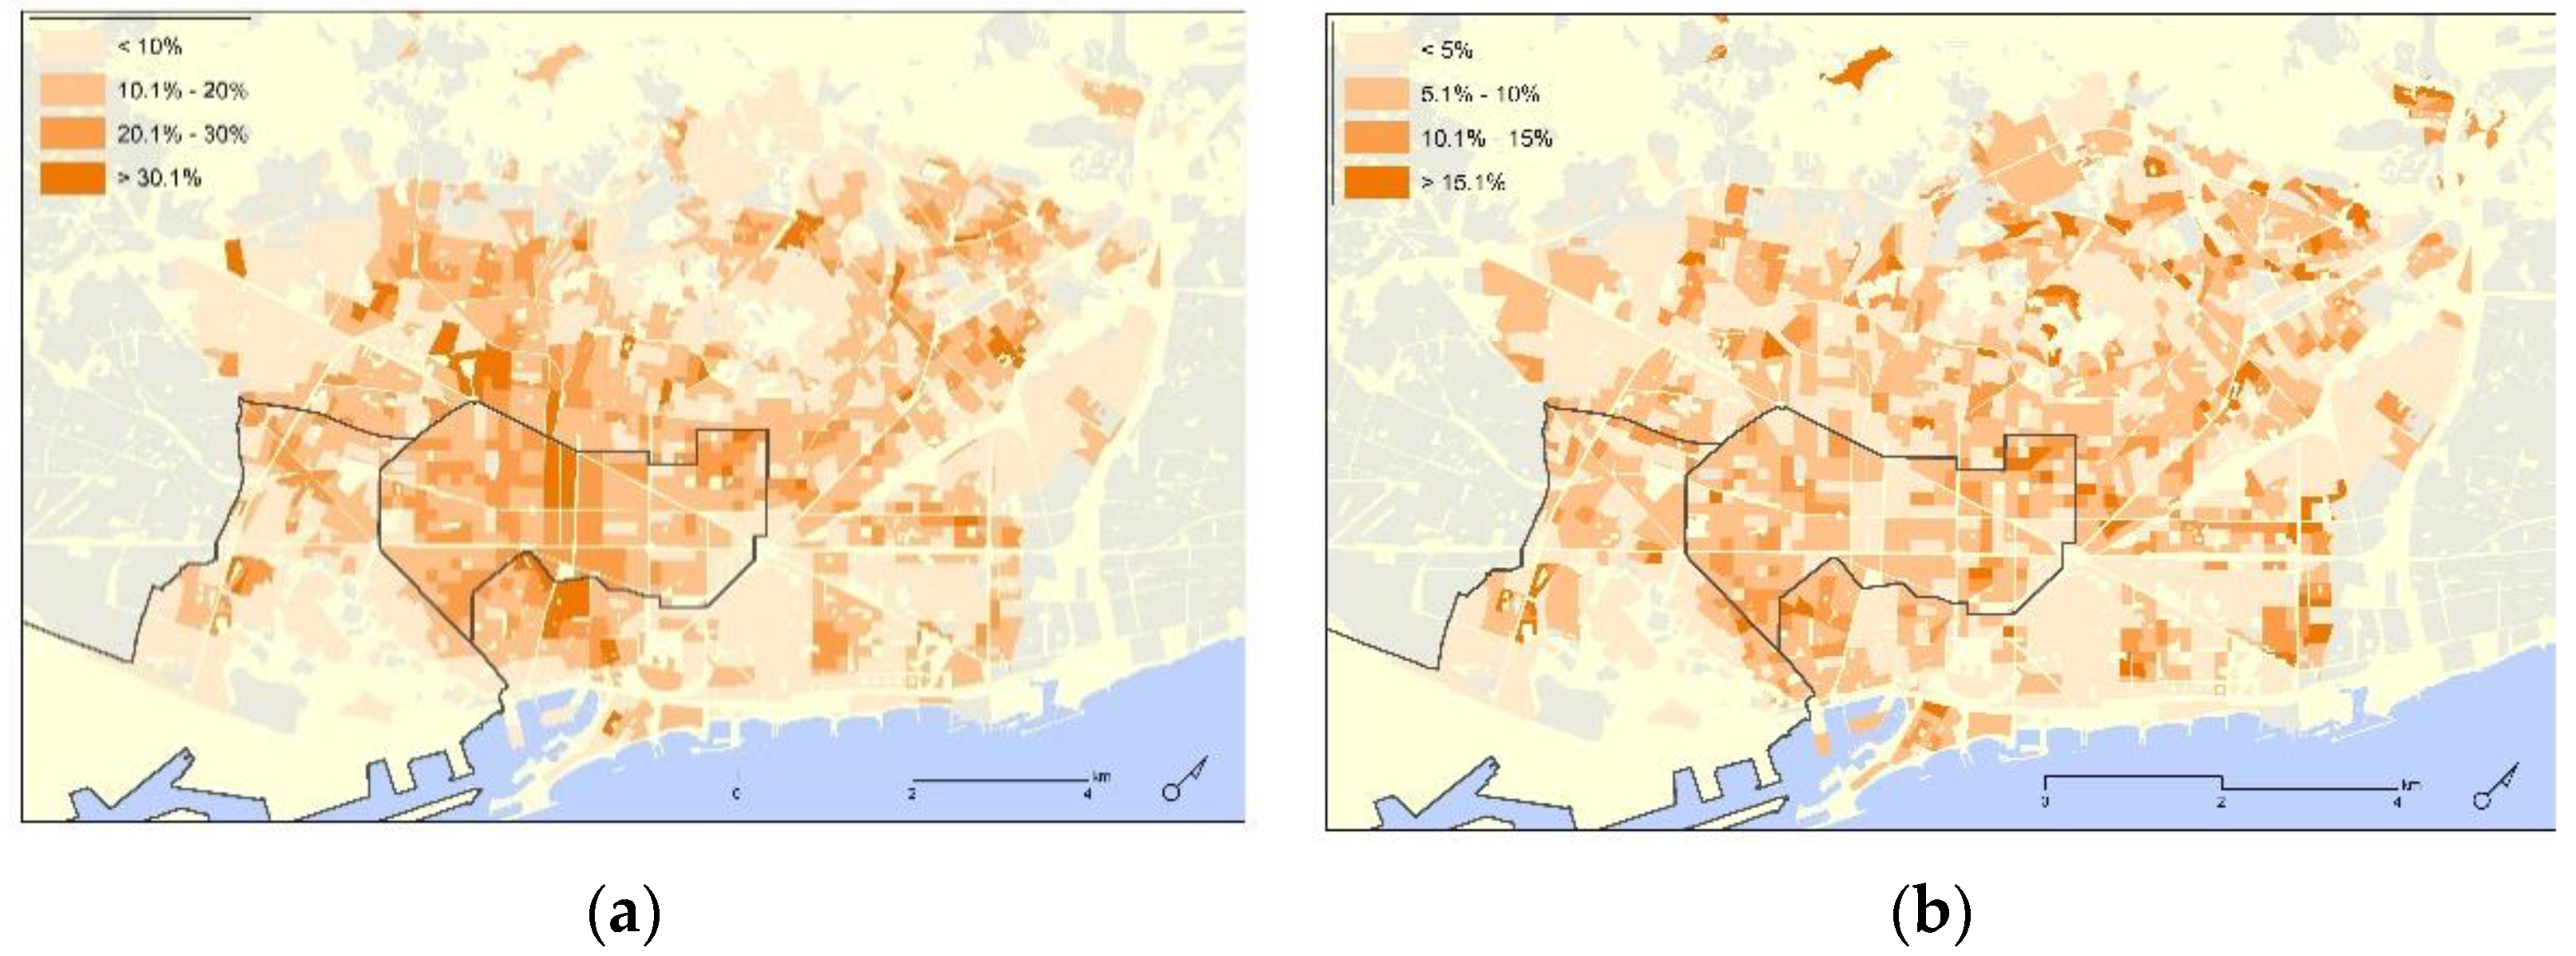
To make easier the matrix interpretation, we converted the numbers contained in it from absolute to relative. For a general overview of the city, we used a technique with two points of view: (i) the 2016 output rate (Figure 3), which represents (in %) the count of each relation per 2016 origin category (in rows); and (ii) the 2019 input rate (Figure 4), which represents (in %) the count of each relation per 2019 destination category (in columns).
However, another simpler technique was used for relation cartography (Figures 5–7) and the study cases of the relation matrix (Figures 8 and 9). This second technique just calculates the count of each relation per sum of all relations (comparable premises—70,526), thus representing a weighted amount of each relation on a 1000 basis (‰). While the first technique focuses on the changes of specific categories between the two moments, big or small, the second one is more focused on the weight of each 2016–2019 relation above all of them.

3.4. Sources Limitations

First of all, it should be noted that despite the fact that the most specific classification level of the census—the one with the least aggregation of categories—is often not detailed enough, there is a risk of combining two economic activities with different characteristics within the same category. This risk has been mitigated as much as possible by not using the other more general classification levels, thus prioritising the use of the most specific level. In the creation of the new ad hoc categories, it is not possible to minimise any categories because even the most specific level is still general. It would be good to have more detailed information on the economic activity developed for each premise.
Secondly, it is necessary to highlight the limitation of the unit of measurement used in the censuses: the number of premises. It is a limitation for the research not to have more suitable units of measurement, such as: the commercial surface area of these premises, the volume of business of these shops or the number of customers who frequent them. This limitation can lead to dimension problems when, for example, in the food sector, characterised by concentration or aggregation tendencies, at an accounting level, a family-owned grocery, a franchised supermarket and a hypermarket chain would be considered the same.
Finally, the limitation of having data from only one part—mostly central—of the metropolitan area, only from the municipality of Barcelona, cannot be ignored. Limiting the areas of study not by functional criteria but by administrative criteria is still a very common difficulty faced by geography professionals. Having a partial picture of reality limits the understanding we can make of it. It would be relevant to carry out this type of census by administration type, which, without excluding the municipal census, would allow for broader-scale metropolitan or national censuses.

4. Results and Discussion

4.1. Aggregated Results Evolution by Category (2016–2019)

At first glance, the aggregated results for the entire municipality of Barcelona do not show great differences between the two moments studied. However, they do show some relevant facts that are worth highlighting. There is a persistent problem in relation to the large number of vacant premises—almost 25%; it is the most numerous category, just ahead of the three sectors that occupy most of Barcelona’s ground floor premises: specialised trade, restaurants/bars and grocery shops (Figure 2/average 2014, 2016, and 2019).
Having a general notion of the magnitude of the categories is important to proceed to the next level of analysis, the one-to-one relationships between categories in the 2016–2019 period. As can be seen in Figure 2, the four main categories are: Vacant, Specialised, Restaurants and Grocery, two of which (the second and third ones) have suffered a slight decrease and increase, respectively. In some small categories, some changes can be observed as well: a decrease in administrative uses or enterprise services.
Although it is not the aim of the work to find blind spots in the census, we understand that there are enough indications to affirm that there has been a bigger increase in the number of tourist accommodations. The expansion of new forms of mass tourism is closely linked to the proliferation of legal or illegal tourist apartments, which are most likely excluded from the census because they are not located on the ground floor [28].

4.2. Input/Output One-to-One Relations for the Whole Municipality

Then individualised evolution of premises between 2016 and 2019—conceptualised as a one-to-one relation—shows some obvious changes in two ways: the 2016 output rate and the 2019 input rate. Generally, the most usual relation remains, for example, from Education to Education. The second most common is the transit from Vacant to any active category and vice versa, for example, from Vacant to Industry or vice versa. Another obvious issue is the high remain rate that exists in some categories with an important public sector presence, such as Education (86%) or Healthcare (87%), and also the high remain rates in the three main active categories: Specialised (80%), Restaurants (89%) and Grocery (81%), which show some stability in Barcelona’s commercial system (Figure 3).
However, some unexpected results were found. Firstly, about the 2016 output rate (Figure 3), it is shown that: (i) accommodation is by far the category with the highest remain rate—95% of accommodation premises in 2016 kept developing their activity in 2019; (ii) there is a considerable number of administrative premises in 2016 (32%) that have become logistics premises in 2019, which impact its remaining rate of less than a half of those in 2016. We consider this second relation unusual, as it would be more characteristic of a post-pandemic scenario with a remote working expansion [29]. Due to administrative premises being a statistically minor category, it would be reasonable to consider a possible census gap.
Secondly, about the 2019 input rate (Figure 4), it is shown that: (i) almost 10% of vacant premises in 2019 were specialised in 2016; (ii) almost one-third of accommodations in 2019 were specialised in 2016. The data point out that a retail apocalypse would not be a generalised dynamic for the whole city.

4.3. Barcelona’s Municipality Cartography

The distribution patterns of some relations were analysed, namely, those considered by ourselves to be more symptomatic in the hypothesis of a retail-less city process: Vacant-to-Vacant (Figure 5); the desertion of the Specialised (Figure 6a) and Grocery (Figure 7a) categories, namely, Specialised-to-Vacant and Grocery-to-Vacant; and the remaining rates for the Specialised and Grocery categories, namely, Specialised-to-Specialised (Figure 6b) and Grocery-to-Grocery (Figure 7b).
Firstly, Figure 5 shows, at the moment, the most explicative result of the differential dynamics of a retail apocalypse. This map shows the Vacant-to-Vacant remaining weighted numbers. In that sense, the remaining number of vacant premises is spatially unevenly distributed; the average of one-quarter of vacant premises, shown in Section 4.1, has a very heterogeneous distribution. Two main tendencies are observed using centre–peripheral logic. On one hand, the central district of Eixample has the highest resilience of its commercial system; in other words, there are fewer long-term vacant premises. The areas further from the city centre, on the other hand, show the embeddedness of high vacancy rates; thus, a retail apocalypse would be more explicit in those non-central areas.
Secondly, Figure 6 shows us a generalised and slight decline of specialised retail in the whole city, while grocery retail still exists in most areas of the city. However, Figure 7 shows a considerable remaining rate for specialised establishments, particularly on the main superior circuit retail axis, the shopping line of Portal de l’Àngel to Passeig de Gràcia and Plaça Francesc Macià. Other areas of Barcelona also have acceptable remaining rates for the Specialised category, also combined with similar behaviour for grocery premises, mainly in the traditional neighbourhoods of the city, namely, Poblenou, Sants, Sant Andreu and Sarrià, and some of Eixample’s district neighbourhoods external to that retail axis, such as Sant Antoni and Sagrada Família.

4.4. Weighted One-to-One Relations in Sants-Montjuic and Eixample Districts

Based on the differential dynamics of vacant premises, remaining (Figure 5) or new ones (Figure 6), two extreme areas of the city have been selected. The aim is to determine, on one hand, which sectors are driving/leading the retail apocalypse in the case of the Sants-Montjuïc district and, on the other hand, which sectors are holding it back in the case of the Eixample district.
In the Sants-Montjuïc district, there are around 30% vacant premises in both censuses, remembering that Barcelona’s average is almost 25% (Figure 2). One-to-one analysis shows that the vacancy numbers are led by the Specialised category, with a slight tendency to close (17‰) and a lack of opening capacity (12‰), although the main relation for the Vacant category is the remaining rate (126‰) (Figure 8). Hence, we consider that the retail apocalypse’s boosting symptom is the embeddedness of a very high vacancy remaining rate, 196‰ of all relations, the main one of the districts.
In the Eixample district, a more dynamic system exists, with a very low number of vacant premises, around 10%, far below Barcelona’s average (Figure 2). Hence, we consider that, in this case, the holding back symptoms of a retail apocalypse is, firstly, to have a low vacancy remaining rate—representing almost 50‰ of relations. Secondly, it is to have strong remaining rates in the principal categories: 189‰ and 155‰ of all relations are Specialised-to-Specialised and Restaurant-to-Restaurant, respectively, or even Grocery-to-Grocery, with a 75‰ rate. The Restaurant category is the most expansive one in the Eixample district, where it presents a great replacement capacity for former Vacant, Grocery and Culture premises (Figure 9). Those trends can be explained by tourism impacts on this part of the city, mainly in the Restaurant category.

5. Final Considerations

The analysis carried out for this article deepens at an empirical level the changes that are taking place in retail in order to develop a rigorous explanation at the theoretical level around the so-called implosions and the development of current urbanisation processes. Therefore, this analysis allows us to extract some conclusions in relation to the initial hypothesis of the research.
It is also important to highlight the historical dimension of this territorial analysis since the last census was from the year immediately preceding the global COVID-19 pandemic. This fact is relevant because it reveals the existence of certain trends in relation to phenomena often directly associated with the change in habits suffered by the population during successive lockdowns. In this sense, it is very likely that the current configuration of economic activities on the ground floor is the result of a much more abrupt transformation than the one that existed at the time of the last census in 2019.
The initial question of this paper was if a retail apocalypse, or other types of massive business establishment closure, could be considered as a differential urbanisation symptom. The empirical approach to this theoretical hypothesis has been a comparative analysis of the 2016 and 2019 editions of the Census of economic activities on the ground floor premises of the Barcelona municipality. In the first step, with aggregated data, a retail apocalypse did not appear as a general trend in Barcelona. This fact led us to deepen the analysis through further steps: disaggregation, spatialisation and the comparison between two extreme case areas.
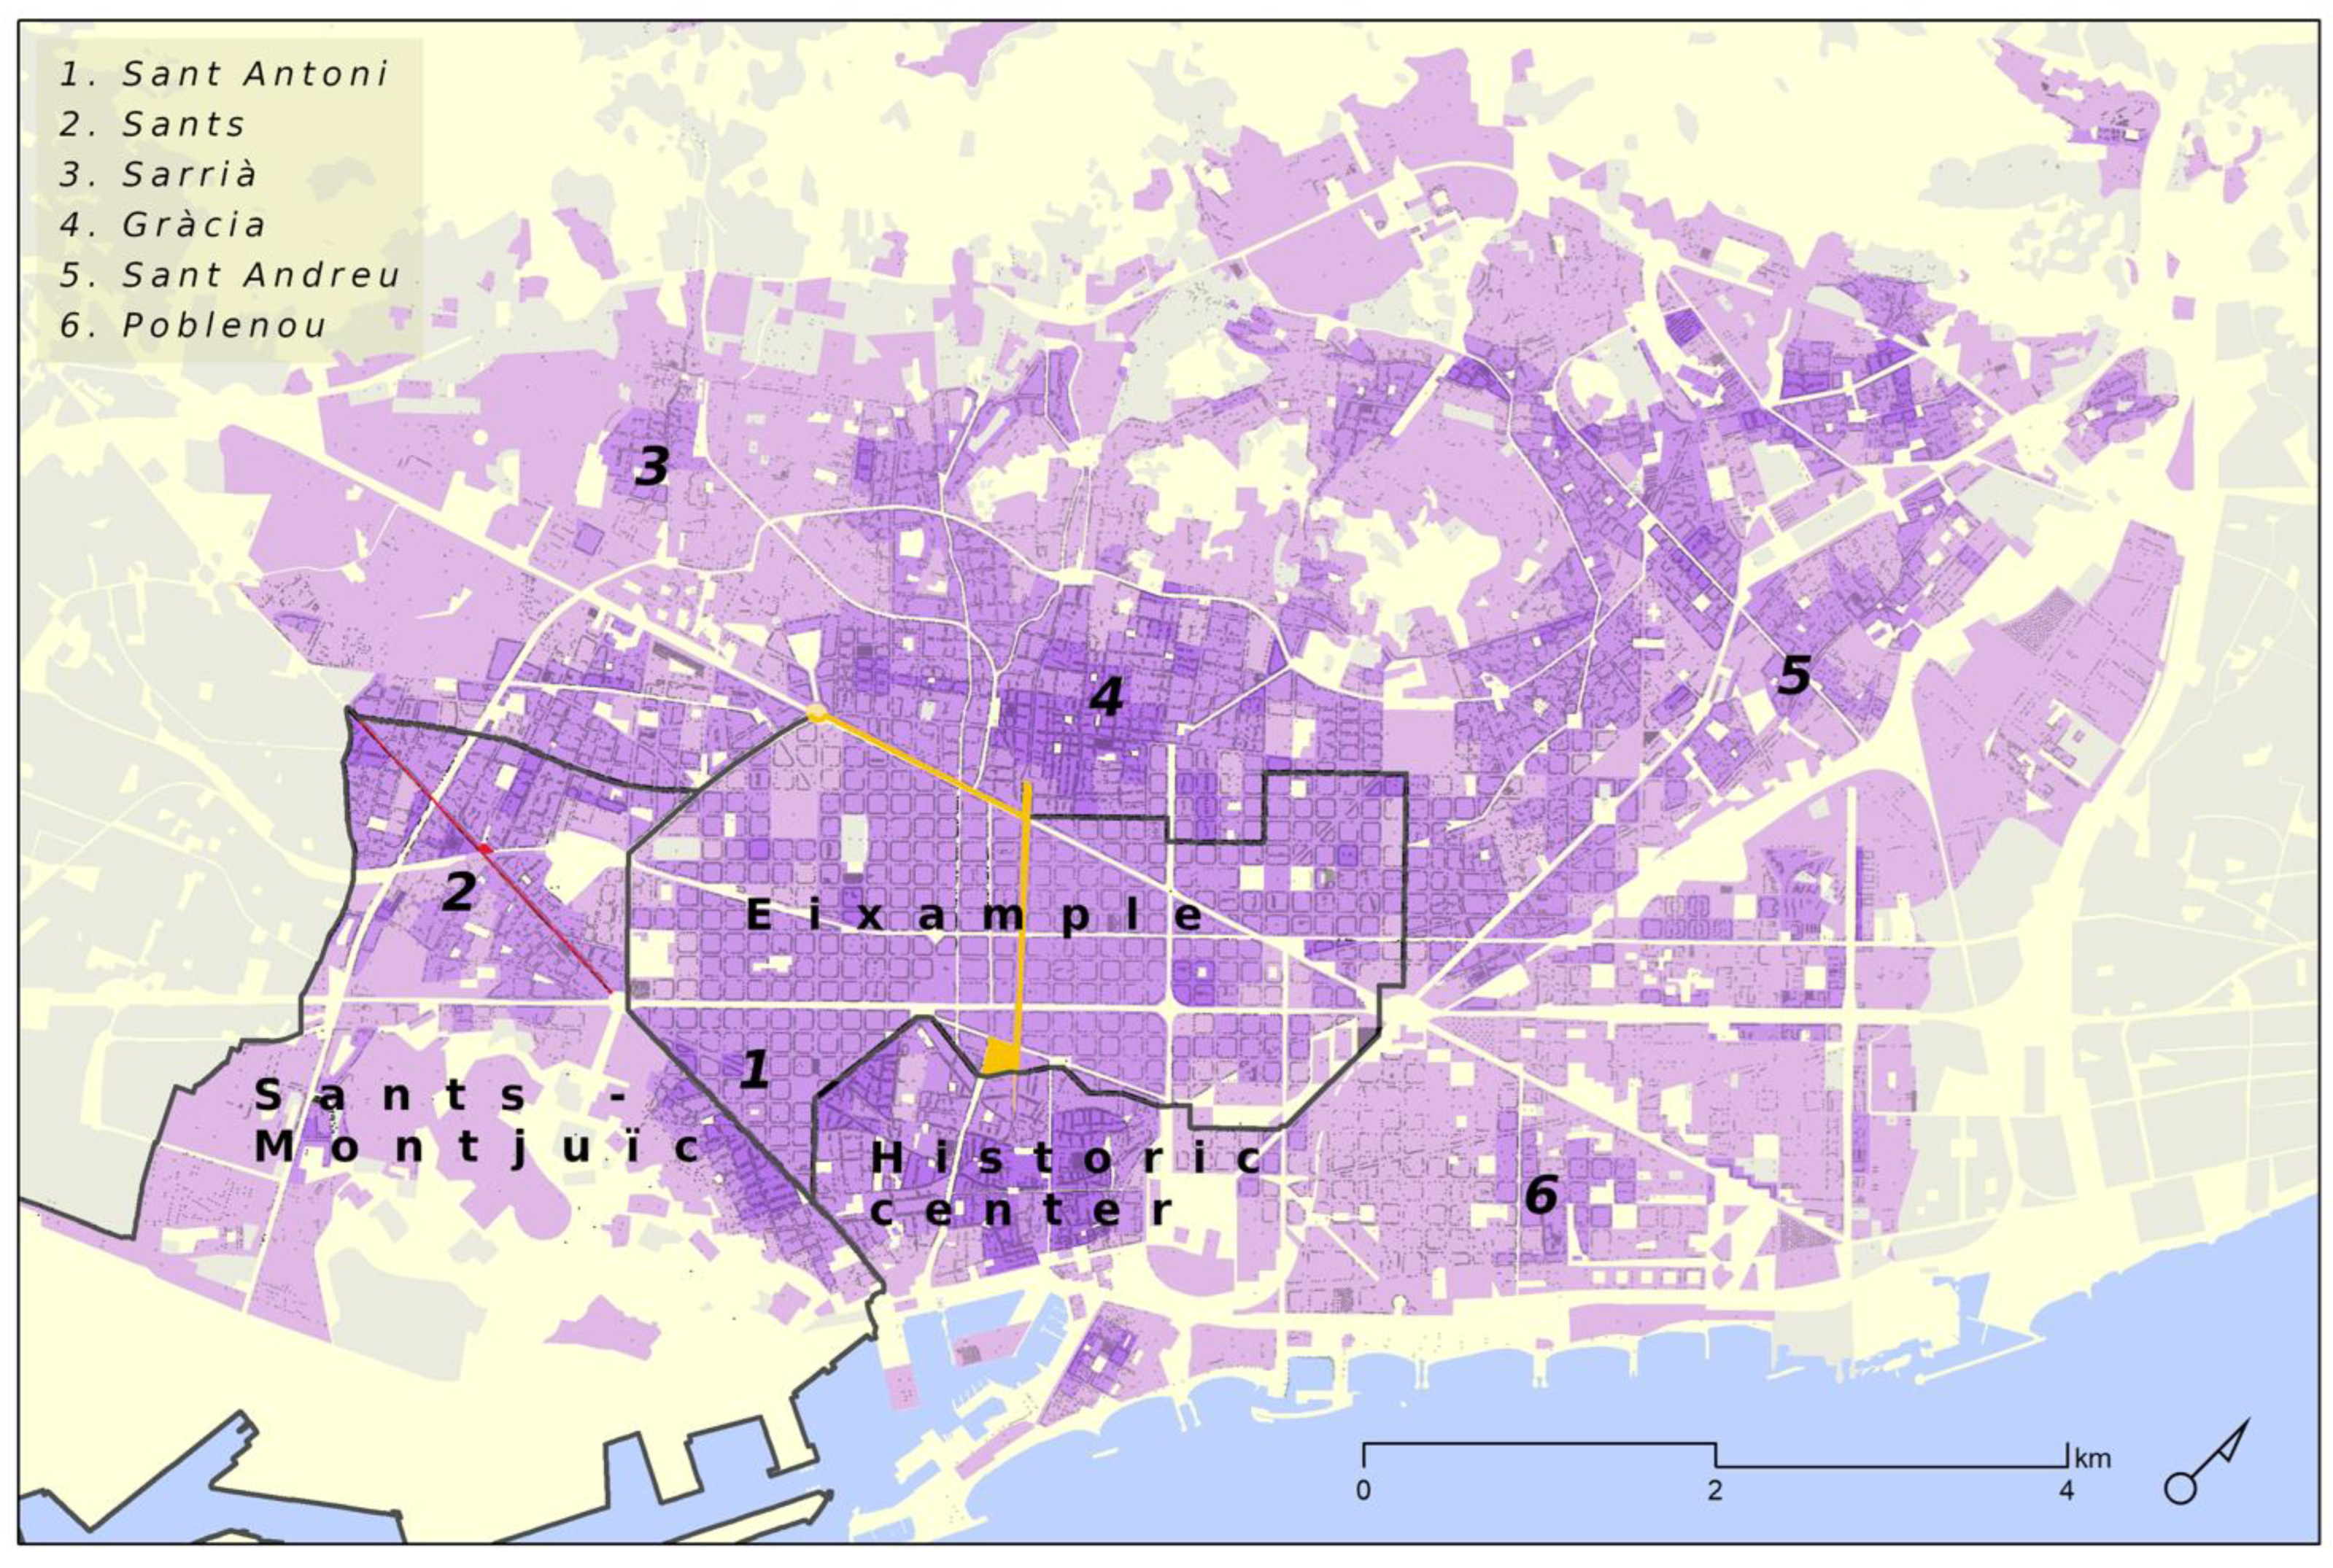
The differences that emerged in the last analysis level, cartography and one-to-one relation matrices for case areas, showed two main trends (Figure 5): a concrete retail substitution dynamic in the Eixample district and a general retail apocalypse for the rest of the city. On the one hand, in the Eixample district, there is evidence of implosions–explosions driven by obsolescence–innovation logic, concreted in considerable establishment failure (implosions) but with a fast re-activation of vacant premises (explosions), namely, the Vacant remaining rate (50%) being below the municipality’s average (68%) and substitution by the Specialised and Restaurant categories.
On the other hand, in the Sants-Montjuïc district, representing the second trend, there is evidence of an implosion without any visible explosion, as shown by the Vacant remaining rate (70%) compared to the city’s average (68%) and a generalised closure, leading into an expansion in vacant premises. Although the explosions are not visible in our data and scale treatment, which is restricted to Barcelona’s municipality, it can be assumed that explosions exist within the functional agglomeration and beyond the administrative boundaries, i.e., shopping centres in other metropolitan towns such as L’Hospitalet, Cornellà de Llobregat or Gavà.
However, several questions around the main topic appear within this implosions–explosions framework. How do those spatially differentiated trends take place in space? Through which mechanism does a retail apocalypse as an implosion work? Does this concept represent an isolated phenomenon or is it a part of a broader dynamic in the political economy of the city? All those questions can only be explained through the urban economy circuits theory, broadly developed in third-world metropolises but only slightly considered in north Mediterranean urban agglomerations.
Retail activities developed in both study cases mainly belonged to different circuits; in Eixample, the lower circuit copes with the upper, and in Sants-Montjuïc, the lower circuit is predominant. In consequence, different considerations can be extracted from those situations.
Firstly, the depredatory constituent characteristic of the upper circuit to the lower is reflected as a substitution in areas with an implosion and explosion at the same time, for example, in Eixample. It can only be assumed in vacant premises embeddedness areas, where there is only an implosion, such as Sants-Montjuïc. Thus, some usually presented phenomena, such as retail aggregation or concentration, are just the upper circuit taking the lower circuit’s place and, consequently, concentrating commercial activity into several highly organised points.
Secondly, different forms of a retail apocalypse were found in both case study areas as a consequence of modernisation processes. While the Eixample district is an area of verticalities and fast times, very prone to processes of obsolescence–innovation, Sants-Montjuïc is an area of horizontalities and slow times, where these processes also have an impact, but they come up against different types of resistance from urban agents, such as the traditional cooperative sector of Sants-Montjuïc, which explains the chronification of the closures and the lack of substitution. Nevertheless, the fact that we find the implosion in both districts shows that the two circuits—lower and upper—are modern circuits.
In conclusion, the analysis of the censuses of economic activities on the ground floor for 2016 and 2019 shows a generalised process of closure of commercial premises in the city of Barcelona. However, the impact of this implosion differs according to the area of the city where it occurs. This fact, shown in two districts of the city, leads us to think that the framework of the circuits of the urban economy may have greater explanatory power for the changes in the commercial structure of the cities. The data analysed show that the upper circuit is capturing the lower one, resulting in higher economic concentration. Thus, both the metaphor of implosions–explosions and the theory of urban economic circuits are shown to be pertinent theoretical and analytical tools for the analysis of differential urban processes, among which we find commercial transformations in cities. Drawing from these conclusions, future research should focus on: (a) To which extent the pandemic crisis has consolidated already existing trends or if it has only limited itself to reproducing them; (b) what the specific consequences of differential urbanisation within the urban fabric are, as materialised in implosions; and (c) how and where the consequences of the explosions occur territorially.

Author Contributions

A.M.G. and D.L.L. contributed equally to all parts of the paper. All authors have read and agreed to the published version of the manuscript.

Funding

Ministerio de Universidades del Gobierno de España (Plan de recuperación, transformación y resiliencia—Fondos Next Generation de la Unión Europea); FCT—Fundação para a Ciência e a Tecnologia (Portugal).

Institutional Review Board Statement

Not applicable.

Informed Consent Statement

Not applicable.

Data Availability Statement

Not applicable.

Conflicts of Interest

The authors declare no conflict of interest.

Appendix A

Abbreviation list of created categories for Figure 3, Figure 4, Figure 8 and Figure 9: “vacant” (Vacant), “refor” (Renovation), “tur” (Accommodation), “rest” (Restaurants and Bars), “edu” (Education), “speci” (Specialised Trade), “enterp” (Enterprise Services), “log” (Logistics), “cult” (Cultural), “groce” (Grocery), “adm” (Administrative), “reest” (Real estate), “repar” (Reparation), “house” (Housekeeping), “sanit” (Health), “com” (Communications), “autom” (Automobile), “ind” (Industrial).

References

  1. Townsend, M.; Surane, J.; Orr, E.; Cannon, C. America’s “Retail Apocalypse” Is Really Just Beginning. Bloomberg 2017, 8, 1–11. [Google Scholar]
  2. Carreras, C.; Frago, L. Could a Retail-Less City Be Sustainable? The Digitalization of the Urban Economy against the City. Sustainability 2022, 14, 4641. [Google Scholar] [CrossRef]
  3. Barata-Salgueiro, T.; Cachinho, H. Urban Retail Systems: Vulnerability, Resilience and Sustainability. Introduction to the Special Issue. Sustainability 2021, 13, 3639. [Google Scholar] [CrossRef]
  4. Morcuende, A. Diferenciación y Fragmentación Socioespacial: La Contradicción Campo-Ciudad Como Teoría y Como Método. GEOusp 2021, 25. [Google Scholar] [CrossRef]
  5. Ajuntament de Barcelona. Cens d’Activitats Econòmiques en Planta Baixa de la Ciutat de Barcelona; Ajuntament de Barcelona: Barcelona, Spain, 2016. [Google Scholar]
  6. Ajuntament de Barcelona. Cens d’Activitats Econòmiques en Planta Baixa de la Ciutat de Barcelona; Ajuntament de Barcelona: Barcelona, Spain, 2019. [Google Scholar]
  7. Lefebvre, H. La Revolución Urbana; Alianza Editorial: Madrid, Spain, 1976. [Google Scholar]
  8. Brenner, N. Implosions-Explosions: Towards a Study of Planetary Urbanization; Jovis: Berlin, Germany, 2014. [Google Scholar]
  9. Santos, M. O Espaço Dividido: Os Dois Circuitos da Economia Urbana dos Países Subdesenvolvidos; EdUSP: São Paulo, Brazil, 2004. [Google Scholar]
  10. Brenner, N.; Katsikis, N. Operational Landscapes: Hinterland on the Capitalocene. Archit. Des. 2020, 90, 22–31. [Google Scholar] [CrossRef]
  11. Khatam, A.; Haas, O. Interrupting Planetary Urbanization: A View from Middle Eastern Cities. Environ. Plan. D Soc. Space 2018, 36, 439–455. [Google Scholar] [CrossRef]
  12. Nicholson-Lord, D. The Greenings of the Cities; Routledge: London, UK, 1987. [Google Scholar]
  13. Florida, R. Cities and the Creative Class; Routledge: London, UK, 2005. [Google Scholar]
  14. Arboleda, M. In the Nature of the Non-City: Expanded Infrastructural Networks and the Political Ecology of Planetary Urbanization. Antipode 2015, 48, 233–251. [Google Scholar] [CrossRef]
  15. Brenner, N.; Schmid, C. Towards a New Epistemology of the Urban? City 2015, 19, 151–182. [Google Scholar] [CrossRef]
  16. Blyth, M. Austerity: The History of a Dangerous Idea; Oxford University Press: Oxford, UK, 2013. [Google Scholar]
  17. Tooze, A. Shutdown: How Covid Shook the World’s Economy; Allen Lane: New York, NY, USA, 2021. [Google Scholar]
  18. Morcuende, A. Interpreting Sociospatial Fragmentation, Differential Urbanization and Everyday Life: A Critique for the Latin American Debate. GEOgraphia 2020, 22. [Google Scholar] [CrossRef]
  19. Morcuende, A. Behind the Origins of Socio-Spatial Fragmentation. Mercator-Rev. Geogr. UFC 2021, 20, 1–10. [Google Scholar]
  20. Theodore, N.; Peck, J.; Brenner, N. Urbanismo Neoliberal: La Ciudad y el Imperio de los Mercados. Temas Soc. 2009, 66, 1–11. [Google Scholar]
  21. Santos, M. Por Uma Economia Política da Cidade; EdUSP: São Paulo, Brazil, 1994. [Google Scholar]
  22. Lloberas, D. Entre la producción y el consumo: Geopolítica y nuevas tecnologías en las futuras redes de distribución. In Ciudad, Comercio y Consumo: Temas y Problemas desde la Geografía; Silveira, M.L., Bertoncello, R., Di Nucci, J., Eds.; Editorial Café de las Ciudades: Buenos Aires, Argentina, 2020; pp. 291–307. ISBN 978-987-3627-35-4. [Google Scholar]
  23. Silveira, M. Circuitos de la Economía Urbana. Ensayos sobre Buenos Aires y São Paulo; Editorial Café de las Ciudades: Buenos Aires, Argentina, 2016. [Google Scholar]
  24. Silveira, M. Circuitos de la Economía Urbana y Nuevas Manifestaciones del Comercio Metropolitano. Cidades 2014, 11, 79–80. [Google Scholar] [CrossRef]
  25. Malheiros, J. Comunidades Indias en Lisboa ¿Creatividad Aplicada a las Estrategias Empresariales y Sociales? Rev. CIDOB D’afers Int. 2010, 92, 119–137. [Google Scholar]
  26. Lloberas, D. Els Circuits de l’Economia Urbana i els seus Efectes Sobre l’Espai Urbà: Veritcalitats i Horitzontalitats a Lisboa. Bachelor′s Thesis, Universitat de Barcelona, Barcelona, Spain, 2020. handle: 2445/171489. [Google Scholar]
  27. Carreras, C.; Martínez-Rigol, S.; Frago, L.; Morcuende, A.; Montesinos, E. New Spaces and Times of Consumption in Barcelona: The Case of the El Raval. Geotema AGEI 2016, 20, 32–41. [Google Scholar]
  28. Observatori del Turisme a Barcelona. Informe de l’Activitat Turística a Barcelona; Ajuntament de Barcelona: Barcelona, Spain, 2018. [Google Scholar]
  29. Delventhal, M.J.; Kwon, E.; Parkhomenko, A. How do Cities Change when We Work from Home? J. Urban Econ. 2021, 127, 103331. [Google Scholar] [CrossRef]
Figure 1. Distribution of common premises of the 2016 and 2019 censuses (black dots), with a choropleth basis representing their density per census section. Situation map: red = Carrer de Sants; yellow = Passeig de Gràcia shopping line. Source: own preparation.
Sustainability 14 13652 g001
Figure 2. Percentage (%) of premises of each category, considering 2016 and 2019 censuses for Eixample and Sants-Montjuïc districts and for the whole city on average. For vacant category on average, the 2014 census was also considered.
Sustainability 14 13652 g002
Figure 3. Output rate of 2016 activities compared to 2019 activities. Destination category (%) of each 2016 activity (rows).
Sustainability 14 13652 g003
Figure 4. Input rate of 2019 activities from 2016 activities. Origin category (%) of each 2019 activity (columns).
Sustainability 14 13652 g004
Figure 5. Vacant category remaining rate 2016–2019.
Sustainability 14 13652 g005
Figure 6. (a) Specialised-to-Vacant premises change rate 2016–2019 and (b) Grocery-to-Vacant premises change rate 2016–2019. Source: own preparation.
Sustainability 14 13652 g006
Figure 7. (a) Specialised category remaining rate 2016–2019 and (b) Grocery category remaining rate 2016–2019. Source: own preparation.
Sustainability 14 13652 g007
Figure 8. Weighted (base 1000) change rates in 2016–2019 by category for the Sants-Montjuïc district.
Sustainability 14 13652 g008
Figure 9. Weighted (base 1000) change rate 2016–2019 by category for the Eixample district.
Sustainability 14 13652 g009
Publisher’s Note: MDPI stays neutral with regard to jurisdictional claims in published maps and institutional affiliations.

