Article

Do Financial Support Policies Catalyse the Development of New Consumption Field?—Evidence from China’s New Consumer Enterprises

1
School of Finance, Southwestern University of Finance and Economics, Chengdu 611130, China
2
School of Economics and Business Administration, Chongqing University, Chongqing 400044, China
*
Author to whom correspondence should be addressed.
Sustainability 2022, 14(20), 13394; https://doi.org/10.3390/su142013394
Submission received: 9 September 2022 / Revised: 11 October 2022 / Accepted: 14 October 2022 / Published: 17 October 2022
(This article belongs to the Section Economic and Business Aspects of Sustainability)

Abstract

:
The development of the new consumption field is crucial to China’s sustained economic growth at this stage, and it is also of significance to catch-up economies in a shift period of economic growth in order to achieve a breakthrough in development. From a micro perspective, relying on propensity score matching and the difference-in-differences method, this paper is the first study to examine the impact of financial support policies on the growth of new consumer enterprises by using the data of A-share-listed enterprises from 2012 to 2021 and to systematically explore this impact mechanism on the basis of the heterogeneity of property rights and regions. The results show the following: First, the implementation of financial support policies is beneficial to catalyse both current growth and the growth potential of new consumer enterprises. Second, financial support policies play a role in the allocation of credit resources for new consumer enterprises and promote their growth by improving credit supply. Third, financial support policies have a more obvious effect on the growth of non-state-owned new consumer enterprises than those that are state-owned, and they play a greater role in promoting the growth of new consumer enterprises in the northern region than that in the southern region. Our conclusions provide a theoretical reference and path reference for achieving targeted assistance for new consumer enterprises and accelerating the sustainable development of the new consumption field.

1. Introduction

In the past decade, as the world’s most populous country and the second largest economy, China’s average contribution to world economic growth exceeded 30%. However, the sustainability of this contribution is facing challenges. Restricted by many factors such as the supply–demand structural imbalance of the labor market, deterioration of the ecological environment, excess capacity, and weak external demands, China’s previous investment-driven and extensive production-factor-input mode of development has been difficult to sustain. Therefore, it is urgent for China to find a new driving force to maintain sustained economic growth [1,2]. At present, with the narrowing development space of global trade and the rise of trade protectionism, China’s foreign trade has entered a historical turning point, and foreign trade friction has become increasingly prominent. The low-end-processing manufacturing industries have excess capacity, the growth rate of investment in real estate and infrastructure development has declined, and the investment structure needs to be optimized; export and investment in the “troika” that drives economic growth have faced development bottlenecks [3]. At the same time, China’s economy is also facing the phenomenon of industrial structure differentiation that is commonly faced by catch-up economies in the shift period of economic growth. The main contradiction in economic society has changed from the quantitative contradiction between the total demand and total supply to the structural contradiction between them. The supply of mid-range and low-end products is excessive, and the supply of high-quality products is insufficient; the traditional service industry that serves basic needs is surplus, and the modern service industry that serves transformation and development is insufficient. In addition, at this stage, China has changed from a survival-oriented society to a development-oriented society, approaching the threshold of high-income countries and entering a critical period of crossing the “middle-income trap”. In order to maintain high-quality sustainable development, China’s economy must rely more on the expansion of its very large domestic market, with a population of 1.4 billion people. The rapid growth of emerging industrial clusters, represented by new consumption, which is particularly important for China’s sustainable economic growth, reflects the long-term evolutionary trend in China’s industrial structure during the shift period of economic growth [4]. In this regard, China’s State Council issued a “Guideline on Accelerating the Cultivation of New Supply and Driving Force Actively Led by New Consumption” [5] in 2015 and proposed a vigorous development of new consumption in official documents for the first time. Since then, new consumption has been frequently named in the work reports of the Chinese government at all levels. As a transformation of and upgrade to traditional consumption, new consumption is generally considered as a new consumption behavior driven by new technologies such as digital technology, new business models such as online and offline integration, and new relations based on social networks and new media [6]. The data show that since 2011, China’s GDP growth bid farewell to the high speed of approximately 10% over the past 30 years. Its economic development has entered a transformation stage, and the contribution of consumption to economic growth has significantly increased. As shown in Figure 1, China’s final consumption rate has been increasing year by year since 2011, from 49.3% at the end of 2010 to 54.5% in 2021. In 2021, the contribution rate of consumption to China’s GDP growth was as high as 65.4%, driving GDP growth by 5.3 percentage points. It has become the first driving force for China’s economic growth for eight consecutive years, far higher than the contribution rate of the other two factors of investment (13.7%) and net export (20.9%) to GDP in the “troika” in that year. However, compared with the 70–80% final consumption rate of developed economies, China’s final consumption rate still has significant room for development. As a transformation of and upgrade to traditional consumption, new consumption has developed rapidly in this process, promoting the continuous transformation and upgrading of the industrial structure at the supply side [7]. In 2021, the added value of China’s “three new” economies (new industries, new formats, and new businesses) was 19.73 trillion yuan, an increase of 16.6% over 2020 and accounting for 17.25% of the GDP. Accompanied by this, new consumer enterprises took the initiative to adapt to the overall changing trend in the new consumption field; began to shift from a labor-intensive and resource-intensive economic model to a knowledge-intensive economic model; continued to increase research and development investment; introduced new products and services; actively integrated into the transformation and upgrade of modern service industries such as elderly care, domestic healthcare, and culture and tourism; and realized the transformation from consumption upgrading to industrial upgrading and then to enterprise upgrading [8]. It can be seen that China’s economic growth is changing from investment-driven to consumption-led growth, both in terms of policy guidance and the rise of consumption, and there is huge space for development. Therefore, expanding domestic consumption demand and promoting the transformation and upgrade of consumer industries and enterprises are the only ways to help China optimize its economic development structure, overcome the “middle-income trap”, and achieve sustainable development, on the basis of China’s actual national conditions.
As we all know, economic development cannot be separated from financial support. To give full play to the role of new consumption as the main engine behind China’s sustained economic growth, financial support is essential. Unlike developed markets, policies are key driving forces for market activities in China, which has a powerful government [9]. On this basis, we took the “Guidelines on Increasing Financial Support in New Consumption Fields” (hereafter referred to as Guidelines) [10] jointly issued by the People’s Bank of China (PBC) and the former China Banking Regulatory Commission (CBRC) in March 2016 as a case study to systematically study the impact mechanism of financial support policies on the growth of new consumption enterprises, and provide theoretical and empirical support to determine whether financial support can help the sustainable development of the new consumption field from the micro perspective of enterprises. Guidelines require financial institutions to increase credit support, optimize the allocation of financial resources, and better meet the financial needs of enterprises in the new consumption field (the Guidelines put forward six key areas, namely, elderly care and domestic healthcare, IT and network, environment sustainability, tourism and leisure, education, culture and sport, and rural consumption). Through our literature review, to date, no academic research has focused on the actual effect of financial support policies for the new consumption field, and there is a lack of theoretical exploration of financial support policies and enterprise growth. The way in which to effectively combine financial support policies and enterprise growth is still in the exploratory stage.
From the perspective of financial support policies, they belong to one type of financial policy. After sorting through them, we summarized the existing studies on financial policies into two categories: One is the research on macro-financial policies, which mainly investigates the overall impact of financial policies on the macro-economy at the macro level and demonstrates the role of financial policies in solving the imbalance of the financial market, coping with the repair of the financial system in a period of financial crisis and post-financial crisis, stabilizing macroeconomic activities, and promoting macroeconomic growth, as well as the important role in macroeconomic regulation and control such as improving physical capital accumulation and economic efficiency [11,12,13,14,15]. The other is the research on micro-financial policies, which analyzes the directional impact of financial policies on specific industries and enterprises such as loan restriction policies for house purchases, green credit policies, inclusive financial services, and the efficiency of credit resource allocation [16,17,18]. Financial support policies for new consumer enterprises are micro-financial policies that improve the credit access of new consumer enterprises by guiding financial institutions to optimize the credit resource allocation of enterprises in key areas of the new consumption field. From the perspective of enterprise growth, existing studies have proven that, due to the existence of information asymmetry, agency costs, and transaction costs, enterprises face strong financing constraints in the financing market. Increasing credit support and increasing the amount of loans issued to enterprises can effectively reduce such constraints, conducive to the introduction of new technologies, equipment, and talents required for boosting innovation. In return, this will promote R&D investment, production efficiency, and market competitiveness, thus realizing sustainable enterprise growth [19,20]. Meanwhile, the easing of financing constraints can send positive signals to banks in terms of enterprises’ operational conditions and creditworthiness. The research by Tsuruta [21] proved that banks are more likely to allocate loan resources to the enterprises that send positive signals. Such positive feedback can ease the financing constraints for enterprises and help them break growth bottlenecks caused by inefficient access to loan resources. Existing studies have also found that, for enterprises with different property rights and those located in different regions, there are obvious differences in financing constraints [19,22]. Therefore, combining the two dimensions, existing studies have paid attention to the positive role of financial support policies in alleviating the financing constraints of enterprises, also proving that financing constraints are the key factors restricting the growth of enterprises. However, there is still a gap in the theoretical research on the direct relationship between financial support policies and enterprise growth, as well as the heterogeneity of influence.
In view of this, on the basis of the optimal allocation of credit resources and the modern corporate finance theories, we took the Guidelines jointly issued by China’s financial regulators as a case study. Under the difference-in-differences (DiD) method, we tested the impact of financial support policies on the growth of new consumer enterprises and further discussed the heterogeneity of property rights and regions. This provides empirical evidence from China’s A-share-listed enterprises for financial support to the sustainable development of a new consumption field. The main contributions were as follows: First, the existing studies have paid little attention to the development of the new consumption field belonging to strategic emerging industries. As far as we know, no research has focused on the impact of financial support policies on the growth of new consumer enterprises. On the basis of China’s national conditions and the development reality of new consumption, we used propensity score matching (PSM) and the DiD method to test and analyze the impact mechanism of financial support policies on the basis of enterprises’ micro data, which makes up for the lack of theoretical research on financial support for the development of the new consumption field. Second, although existing studies have paid attention to the impact of financial policies from different levels and confirmed, to a certain extent, that financial policies have played a positive role in economic growth, industrial upgrading, and enterprise development, the theoretical research on combining financial policies with enterprise growth is still in the exploratory stage. We made a new attempt to comprehensively depict the growth of new consumer enterprises from the two dimensions of current growth and growth potential and confirmed that financial support policies can promote the current growth and growth potential of new consumer enterprises. This expands the existing research framework on financial support policies and enterprise growth. Third, this is the first study to discuss the analysis of financial support policies and the heterogeneity of new consumer enterprises. We found that the impact of financial support policies on new consumer enterprises with different property rights and located in different regions is obviously different. For example, compared with state-owned new consumer enterprises, financial support policies have a more obvious effect on the growth of those that are not state owned. Furthermore, compared with the south, financial support policies have a more positive and significant impact on the growth of new consumer enterprises in the north. At this stage, China is at a crossroads in terms of crossing the “middle-income trap”. The development of new consumption is crucial to the sustained growth of China’s economy, and it is also of significance to catch-up economies in the shift period of economic growth in order to achieve a breakthrough in development. Our conclusions provide a theoretical reference and path reference for achieving targeted assistance to new consumer enterprises, accelerating the sustainable development of the new consumption field and helping China’s sustainable economic development.

2. Literature Review and Research Hypotheses

As the core of the modern economy and the hub of social resource allocation, finance has the core function of guiding and optimizing resource allocation, which is particularly important for industrial development [23]. Financial policies provide important support. Unlike macro-financial policies, financial support policies focus on the directional impact on specific industries and enterprises. Scholars have investigated financial support policies and obtained rich research results, which are mainly reflected in the two levels of industry and enterprise. From an industrial perspective, the implementation of financial support policies is conducive to resolving macroeconomic structural contradictions and achieving targeted support for specific fields, such as strategic emerging industries and green development. Some scholars focused on financial support policies themselves and conducted in-depth research on their impact. For example, Wu and Li [24] discussed the impact of the real estate purchase restriction policies on the housing market, and the empirical results showed that the housing purchase restriction policies reduced the housing price and transaction volume but did not affect the housing investment or construction market. Liu et al. [25] conducted an empirical analysis on energy-intensive industries and found that the green credit policies were very effective in restraining investment in energy-intensive industries and in helping to reduce the total financing of energy-intensive industries. Some scholars have demonstrated that financial support policies can increase the targeted release of credit funds, rationally allocate credit resources, and improve the efficiency of credit fund allocation, so as to promote the win–win situation of economic growth and healthy industrial development [26]. From the perspective of enterprises, existing studies have widely proven that financial support policies help vulnerable individuals such as strategic emerging enterprises and small and micro enterprises to obtain credit resources. For example, Churm et al. [17] demonstrated that the loan financing plan, launched by the Bank of England and the UK Treasury, encouraged banks to provide more credit to enterprises by providing them with more low-cost funds, thus promoting enterprise investment. Doh and Kim [27] discussed the impact of financial support policies on the innovation of small- and medium-sized enterprises in South Korea’s regional strategic industries, concluding that technology development assistance alleviates the financial constraints of small- and medium-sized enterprises, as well as the fact that there is a significant positive correlation with the patent acquisition and new design registration of regional small- and medium-sized enterprises. Bach [28] inspected France’s public financial assistance program and credit-related policies, confirming that the implementation of the policy increased the supply of credit to small enterprises. Lin et al. [29] examined whether China’s implementation of targeted easing, an unconventional monetary policy aimed at reducing the deposit reserve ratio of specific financial institutions, can significantly reduce the financing constraints of small enterprises. In summary, it can be seen that both at the industrial level and the enterprise level, the existing studies have affirmed the function of financial support policies in optimizing the allocation of financial resources.
Financial support policies for new consumer enterprises require financial institutions to increase credit support, optimize the allocation of financial resources, and better meet the financial needs of enterprises in key areas of the new consumption field. In essence, financial support policies have the function of allocating financial resources that can promote the credit supply of financial institutions and alleviate the financing constraints of enterprises [29,30]. According to the resource-based enterprise growth theory, an enterprise is regarded as a resource set, wherein a variety of resources cannot flow and are difficult to copy, but can be transformed into unique capabilities, helping the enterprise maintain long-term competitive advantages. Among those capabilities, access to financial resources is an important factor affecting business growth [31,32]. At present, indirect funding is dominant in China’s financing system. By the end of 2021, the country’s aggregate financing to the real economy (stock), in RMB, accounted for more than 60% of the total. Bank loans are the major external financing source for enterprises, which are crucial to meet their financing needs and fuel their growth. However, current expensive and inaccessible financing has become a common problem faced by Chinese businesses in operation [33]. In particular, as a strategic emerging industry, the new consumer enterprises that are springing up are mostly developing at a high speed. On the one hand, in decision-making processes, banks will investigate the endowment of enterprises to identify and assess loan risks [34,35,36]. Alongside the rapid development, new consumer enterprises are more likely to face the problem of information asymmetry, resulting in their own value being underestimated by banks, thus encountering financing difficulties. On the other hand, the high-speed growth means relatively high requirements for R&D investment, product innovation, and sharper competitiveness in the market. Existing studies have shown that reducing financing constraints is conducive to the introduction of the technologies, equipment, and talents necessary for improving innovation abilities and market competitiveness, ultimately realizing business growth [19,20,37]. Therefore, compared with traditional enterprises, the high-speed growth of new consumer enterprises is fueled more by sufficient funding.
At the same time, under the modern corporate finance theories, corporate values can be divided into two parts: one is the profit from present assets (i.e., current growth of enterprises); another is the present value of growth opportunities (i.e., the growth value or potential growth of enterprises) [38,39]. Kester [40] also suggested that the growth potential value of an enterprise accounts for more than 50% of its market value, on average. Therefore, the current growth and growth potential of an enterprise organically forms as a whole, which is a benchmark to comprehensively interpret the big picture of its growth. To accurately learn about the overall value of an enterprise, we should not only pay attention to the current growth, but also to the growth potential, which will help the enterprise maintain a stronger momentum in growth [41]. Only focusing on the current growth may work against the comprehensive understanding of the overall value of enterprises and may lead to short-sighted results when competent government authorities formulate financial support policies in pursuit of short-term benefits. Therefore, in a word, the relationship between financial support policies and the growth of new consumer enterprises may be theoretically described as the fact that financing constraints limit enterprise growth, while financial support policies can ease such constraints by guiding financial institutions to increase credit support for industries in key areas of new consumption and related enterprises, thus promoting business growth. We propose the following hypotheses:
Hypothesis 1a.
Financial support policies can promote the current growth of new consumer enterprises.
Hypothesis 1b.
Financial support policies can promote the growth potential of new consumer enterprises.
Hypothesis 2.
Financial support policies can promote the growth of new consumer enterprises by improving credit supply.
As a main subject in the financial market, financial institutions often have a bias in their credit supply when implementing financial policies, creating the scenario of non-neutral competition. For example, compared with the financing difficulties of private enterprises, the state-owned enterprises have a superior position in the credit market [42]. Therefore, we should pay attention to the impact of financial support policies on the heterogeneity of the property rights of new consumer enterprises. From a perspective of ownership, influenced by economic volatility and the differences in the signals transmitted to financial institutions on asset quality, various explicit and implicit guarantees, and resource endowment, there are differences in credit resource allocation among enterprises of different ownerships. As important functional performers of national strategies, state-owned enterprises have been redefined in the new era and endowed with more social responsibilities and non-market duties. They are generally considered to have advantages in terms of their ownership and scale and benefit more from local governments to maintain their survival and development [43]. Such heavy reliance on state-owned enterprises that are consequently protected by local governments led to their easy access to various resources, and the loans to them are often considered by financial institutions as the rigidly repaid assets backed by the government that provides implicit guarantee, making them an attraction for financial institutions [44,45]. Liang and Yu [46] implied that state-owned enterprises are much more likely to be funded than non-state-owned enterprises after the 2008 global financial crisis in China. Moreover, the presence of soft budget constraints stokes the fire, resulting in state-owned enterprises having access to various explicit and implicit financial support from local governments [43]. Therefore, it is almost impossible for state-owned enterprises to suffer from credit restrictions that will limit their growth.
On the contrary, due to the longstanding problems of information asymmetry between banks and enterprises, it is easy for moral hazard and adverse selection to arise, and the allocation of financial resources in enterprises with different property rights is not balanced. Influenced by factors such as the scale effect and the nature of ownership, non-state-owned enterprises are more likely to be limited in terms of financing channels, market access, growth support, and many other aspects, as well as facing stronger and tighter external financing constraints than state-owned enterprises [22,29]. Ferri and Liu [45] proved that, considering all financing channels, the financing cost of non-state-owned enterprises is significantly higher than that of state-owned enterprises. Hu et al. [47] also proved that compared with state-owned enterprises, the non-state-owned enterprises, especially those that are privately owned, have less access to loans from the financial system and depend more on the buffering effect of liquidity. As a result of this polarized allocation, a large amount of credit resources move towards state-owned enterprises, while non-state-owned enterprises, inferior in the credit market, are often faced with inaccessible and expensive financing. Therefore, the third hypothesis is provided in this paper as, compared with state-owned new consumer enterprises that are superior in the financial market, the growth of non-state-owned enterprises is dependent on financial support policies in a more urgent manner.
Hypothesis 3.
Financial support policies have a greater role in promoting the growth of non-state-owned new consumer enterprises than those that are state owned.
Whether or not the implementation of financial support policies is effective is closely related to the regional economic and financial environment [48]. Regional disparity is considered to be an underlying contradiction confronting China’s socioeconomic development, which restricts the coordination and balance of its economic growth [49]. At this stage, China is in the critical period of crossing the middle-income trap. According to the Williamson hypothesis [50], the development gap among regions with middle-income economies is the most obvious, and correspondingly, regional development imbalance is also the most serious. Despite the benefits of regional development strategies such as the western development, the rise of the central region, and the revitalization of the northeast, the imbalance in the development of the eastern, central, and western regions, which has plagued China’s economic development for many years, has been alleviated. However, with the continuous southward shift of the national economic center, the new trend in regional economic development differentiation has become prominent, and the widening gap between northern and southern economic development has become an important issue for the high-quality and coordinated growth of China’s regional economy, attracting extensive attention from political and academic circles [51]. It was found that, in recent years, despite an increasing trend in total factor productivity in both regions, there has been a significant difference in the growth rate among north–south regions, with more competitive productivity in the south, and with it being weaker in the north [52]. Influenced by the development difference between the north and the south, the policy effect of financial support policies for new consumer enterprises is affected by the regional economic structure, financial resource endowment, and financial support.
Specifically, the economy of southern China is relatively developed, having regional advantages over the industrial development of northern China. Increasing entities and financial institutions cluster in the region with superior economic attractions. This, in return, reinforces the location advantage of the region, thus forming a cumulative causation mode featuring mutual promotion, ultimately resulting in the cluster of real industry and the financial sector [53]. Therefore, the financial agglomeration effect in the south is more obvious than that in the north. The cross-regional flow of financial resources in China, hindered by various institution- and system-induced barriers [19], increases the market friction and transaction costs of financial transactions, leading to unbalanced space allocation efficiency of financial resources and the markedly imbalanced growth of the cross-regional financial market. The financial market in the south is more developed, the financial resource endowment is more abundant, and the financial support for the growth of new consumer enterprises is relatively large. Therefore, restricted by the overall restriction of regional financial resource endowment, we think that consumer enterprises in the north are more likely to face a funding gap, and their growth requires more targeted support from financial support policies. That is to say, the fourth hypothesis is provided in this paper due to the fact that financial support policies have a greater role in promoting the growth of new consumer enterprises in the north, but a weaker role in the south.
Hypothesis 4.
Compared with new consumer enterprises in the south, financial support policies have a greater role in promoting the growth of those in the north.

3. Empirical Strategies and Data

3.1. Data Sources and Sampling

The financial data of listed enterprises used in this paper came from the WIND database, and the macro data came from the official website of the National Bureau of Statistics and the WIND database. In order to test the implementation effect, we focused on six key new consumption areas clearly stated in the Guidelines, namely, elderly care and domestic healthcare, IT and network, environment sustainability, tourism and leisure, education, culture and sport, and rural consumption, and matched participants from the A-share-listed enterprises. The sample data were the annual data from 2012 to 2021.
To reduce the influence of selection bias, we used the PSM method. Taking the end of 2015 as the time period, we selected five covariates (characteristics of the samples, see “Description of major variables” for the definition), namely, Size, Leverage, Return, Lage, and Tax, for sample matching. As a result, a total of 76 new consumer enterprises supported by the Guidelines and 76 non-oriented support enterprises closest to the former were screened.

3.2. Setting of the Econometric Model

In economic research, the DiD method has become a popular approach to estimate the effect of policy implementation. Compared with traditional policy effect estimators, where a regression is performed by setting dummy variables (whether a policy is applied or not), the DiD methodology, which employs panel data to estimate a fixed effect, can effectively reduce omitted variable bias to a certain extent. In addition, since policies that are generally exogenous variables to microeconomic subjects do not lead to reverse causality, the DiD method can largely avoid the potential endogeneity bias. Some studies, for example, that were carried out by Xie and Mo [54] on the effect of stock index futures on stock market volatility, and by Dantas et al. [55] on the impact of urban land-use restriction on real estate market prices, all adopted similar methods and facilitated the analyses with satisfactory results.
In view of that, we estimated the impact of financial support policies on the growth of new consumer enterprises by using the DiD method. In this paper, the enterprises in the industries targeted by the Guidelines were taken as a treatment group, and those in the non-targeted industries were taken as a control group. On this basis, a dummy (binary) variable test was created, where Test =1 represents the treatment group and Test = 0 represents the control group. Moreover, we also created another dummy variable policy, where Policy = 1 represents the post-policy period (after March 2016) and Policy = 0 represents the pre-policy period (before March 2016). The empirical models were set as follows:
Growthi,t = α0 + α1 × Testi × Policyt + ∑βi × Controlsi,t + δt + µi + εi.t
Valuei,t = α0 + α1 × Testi × Policyt + ∑βi × Controlsi,t + δt + µi + εi.t
Model (1) and Model (2) were to examine the impact of financial support policies on the current growth of new consumer enterprises. If α1 is significantly positive, it indicates that financial support policies can promote the current growth of new consumer enterprises. Moreover, Growthi,t and Valuei,t are the proxy variables of the current growth of enterprises, Controlsi,t represents the controlled variables, and εi.t is the residual of the model. Before the regression was performed, the fixed effects of year (δt) and individual (µi) were under control.
Similarly, we developed the following model to analyze the impact of financial support policies on the growth potential of new consumer enterprises:
PVGOi,t = α0 + α1 × Testi × Policyt + ∑βi × Controlsi,t + δt + µi + εi.t
In Model (3), PVGOi,t is the proxy variables of the growth potential of enterprises. Similarly, if α1 is significantly positive, it indicates that financial support policies can promote the growth potential of new consumer enterprises.
It is worth noting that whether the DiD method was effective and the estimation results were robust depended on whether the variation in the outcome variables of the treatment group and the control group before and after the policies occurred, regardless of the grouping categories, i.e., even without any impact from the policies, the outcome variables of the treatment group and the control group had no statistically significant differences before and after the policies were implemented. To reduce the influence of potential endogeneity bias such as selection bias (with reference to the studies by Heckman et al. [56] and by Stine et al. [57]), the PSM method, which is a popular approach adopted in empirical studies using the DiD estimator, can be employed to match the samples. Specifically, a regression model was developed, wherein the dependent variables were dummy (binary) variables (taken as 1 for the treatment group, and 0 for the control group); the independent variables with several characteristics of the samples to determine the similarity of the two groups were used to estimate the propensity scores of the treatment group successively:
Pi(X) = Pr (Testi = 1∣Testi) = F[h(Xi)]
Here, Testi was consistent with the previous paragraph, representing the dummy variable of the treatment group; Xi stands for the characteristic variables of the ith enterprise; h(Xi) is a linear function; and F[h(Xi)] is a logistic function. According to the obtained propensity scores of the treatment group, the control enterprises in the control group closest to the propensity scores of the treatment group were successively matched, and there was no significant difference in the matched variables between the two groups.

3.3. Description of Major Variables

  • Current Growth of Enterprises:
    Most studies estimated enterprise growth through financial characteristics such as sales revenue, profit margin, and cash flow, as well as non-financial characteristics such as marketing ability, R&D capacity, and market share [58,59,60]. Given that the supply and demand reinforce each other and demonstrate a constant increase in the context of China’s supply-side structural reform, this paper, with reference to the research of Delmar et al. [61], Onguka et al. [62], and Temel and Forsman [63], estimated the current growth of new consumer enterprises from two dimensions, i.e., revenue growth (Growth) and market value of listed enterprises (Value).
  • Growth Potential of Enterprises:
    We examined the growth potential of enterprises through the present value of growth opportunities (PVGO), which is conceptually the difference between a market value minus a book value divided by the market value [64]. If the capital market is functional, then the available information will be precisely conveyed according to PVGO, which is the best way to estimate the present value of a company’s expected earnings (risks) [39].
  • Controlled Variables:
    The growth of an enterprise may be influenced by its size, financial leverage, profitability, and duration [61], and the key new consumption areas may enjoy tax incentives from the government. Therefore, we controlled the influences of the abovementioned variables in the econometric regression, where size (Size) is measured using the natural logarithm of the total assets; financial leverage (Leverage) is the debt to asset ratio; profitability (Return) is determined by the return on equity; duration (Lage) is the logarithmic difference between the sample year minus the establishment year; and tax policy (Tax) is expressed by the actual income tax-to-total pre-tax profit ratio. At the same time, since business growth may also be affected by the macroeconomy in a region, we controlled the GDP growth rate (GDP) and local public financial revenue (Lrevenue) of the provinces in which enterprises were located.
Table 1 shows the descriptive statistical results of the major variables in this paper. It can be seen that the average values of growth, value, and PVGO were 0.1351, 4.1324, and 0.1662, respectively, and the standard deviations were 0.3514, 0.8898, and 0.6743, respectively, indicating that there are great differences in the current growth and growth potential of the sample enterprises.
Table 2 shows the growth indicators of sample enterprises before and after the Guidelines were announced. Before and after the announcement of the Guidelines, the mean differences in growth, value, and PVGO in the treatment group were 0.1041, 0.4288, and −0.2694, respectively, which were greater than the mean differences of −0.1786, 0.2172, and −0.3310 of the same indicators in the control group. It can be seen that after the Guidelines were issued, the growth performance of the treatment group was better than that of the control group. Next, we carried out a further test.

4. Analysis of the Main Empirical Results

4.1. Financial Support Policies and the Growth of New Consumer Enterprises

Table 3 reports the regression results of financial support policies on the growth of new consumer enterprises. Columns (1) and (2) are the regression results of Model (1) and Model (2), respectively, reporting the regression results of financial support policies on the revenue growth and the market value of enterprises and testing the policy effect of financial support policies on the current growth of new consumer enterprises. Column (3) is the regression result of Model (3), which reports the regression result of the financial support policy on the present value of the growth opportunity of enterprises and tests the policy effect of the financial support policy on the growth potential of new consumption enterprises. All regressions involve the fixed effects of individual enterprise and time (year). In addition, it is worth noting that the regression coefficients interpreting the controlled variables that measure an enterprise’s operational state, such as size (Size), financial leverage (Leverage), profitability (Return), and duration (Lage), are relatively significant, suggesting the importance of the analysis of new consumer enterprises themselves.
The results in columns (1) and (2) show that the regression coefficients of financial support policies (Test × Policy) were 0.2736 and 0.1444, respectively, and both were significant at the 1% confidence level. This indicates that the implementation of financial support policies had a significant positive impact on the current growth of new consumer enterprises, whether from the perspective of the revenue growth or the market value of enterprises. That is, financial support policies can promote the current growth of new consumer enterprises. Hypothesis 1a was therefore verified. The existing literature has provided evidence and support for the empirical results in this paper. Some studies pointed out that, in the process of expansion, enterprises generally confront growth bottlenecks that are difficult to break due to their limited access to credit resources [65]; however, increasing credit support and loan amounts to enterprises can effectively alleviate credit constraints and facilitate continuous introduction of new technologies, equipment, and talents required for innovations with rising R&D investment in enterprises [19]. Thus, in return, this helps enterprises to enhance their innovation capacity, output efficiency, and market competitiveness, ultimately achieving sustainable growth [20]. Echoing this point of view, the empirical analysis in this paper is an in-depth, extensive, and complementary study concerning new consumption based on existing theories.
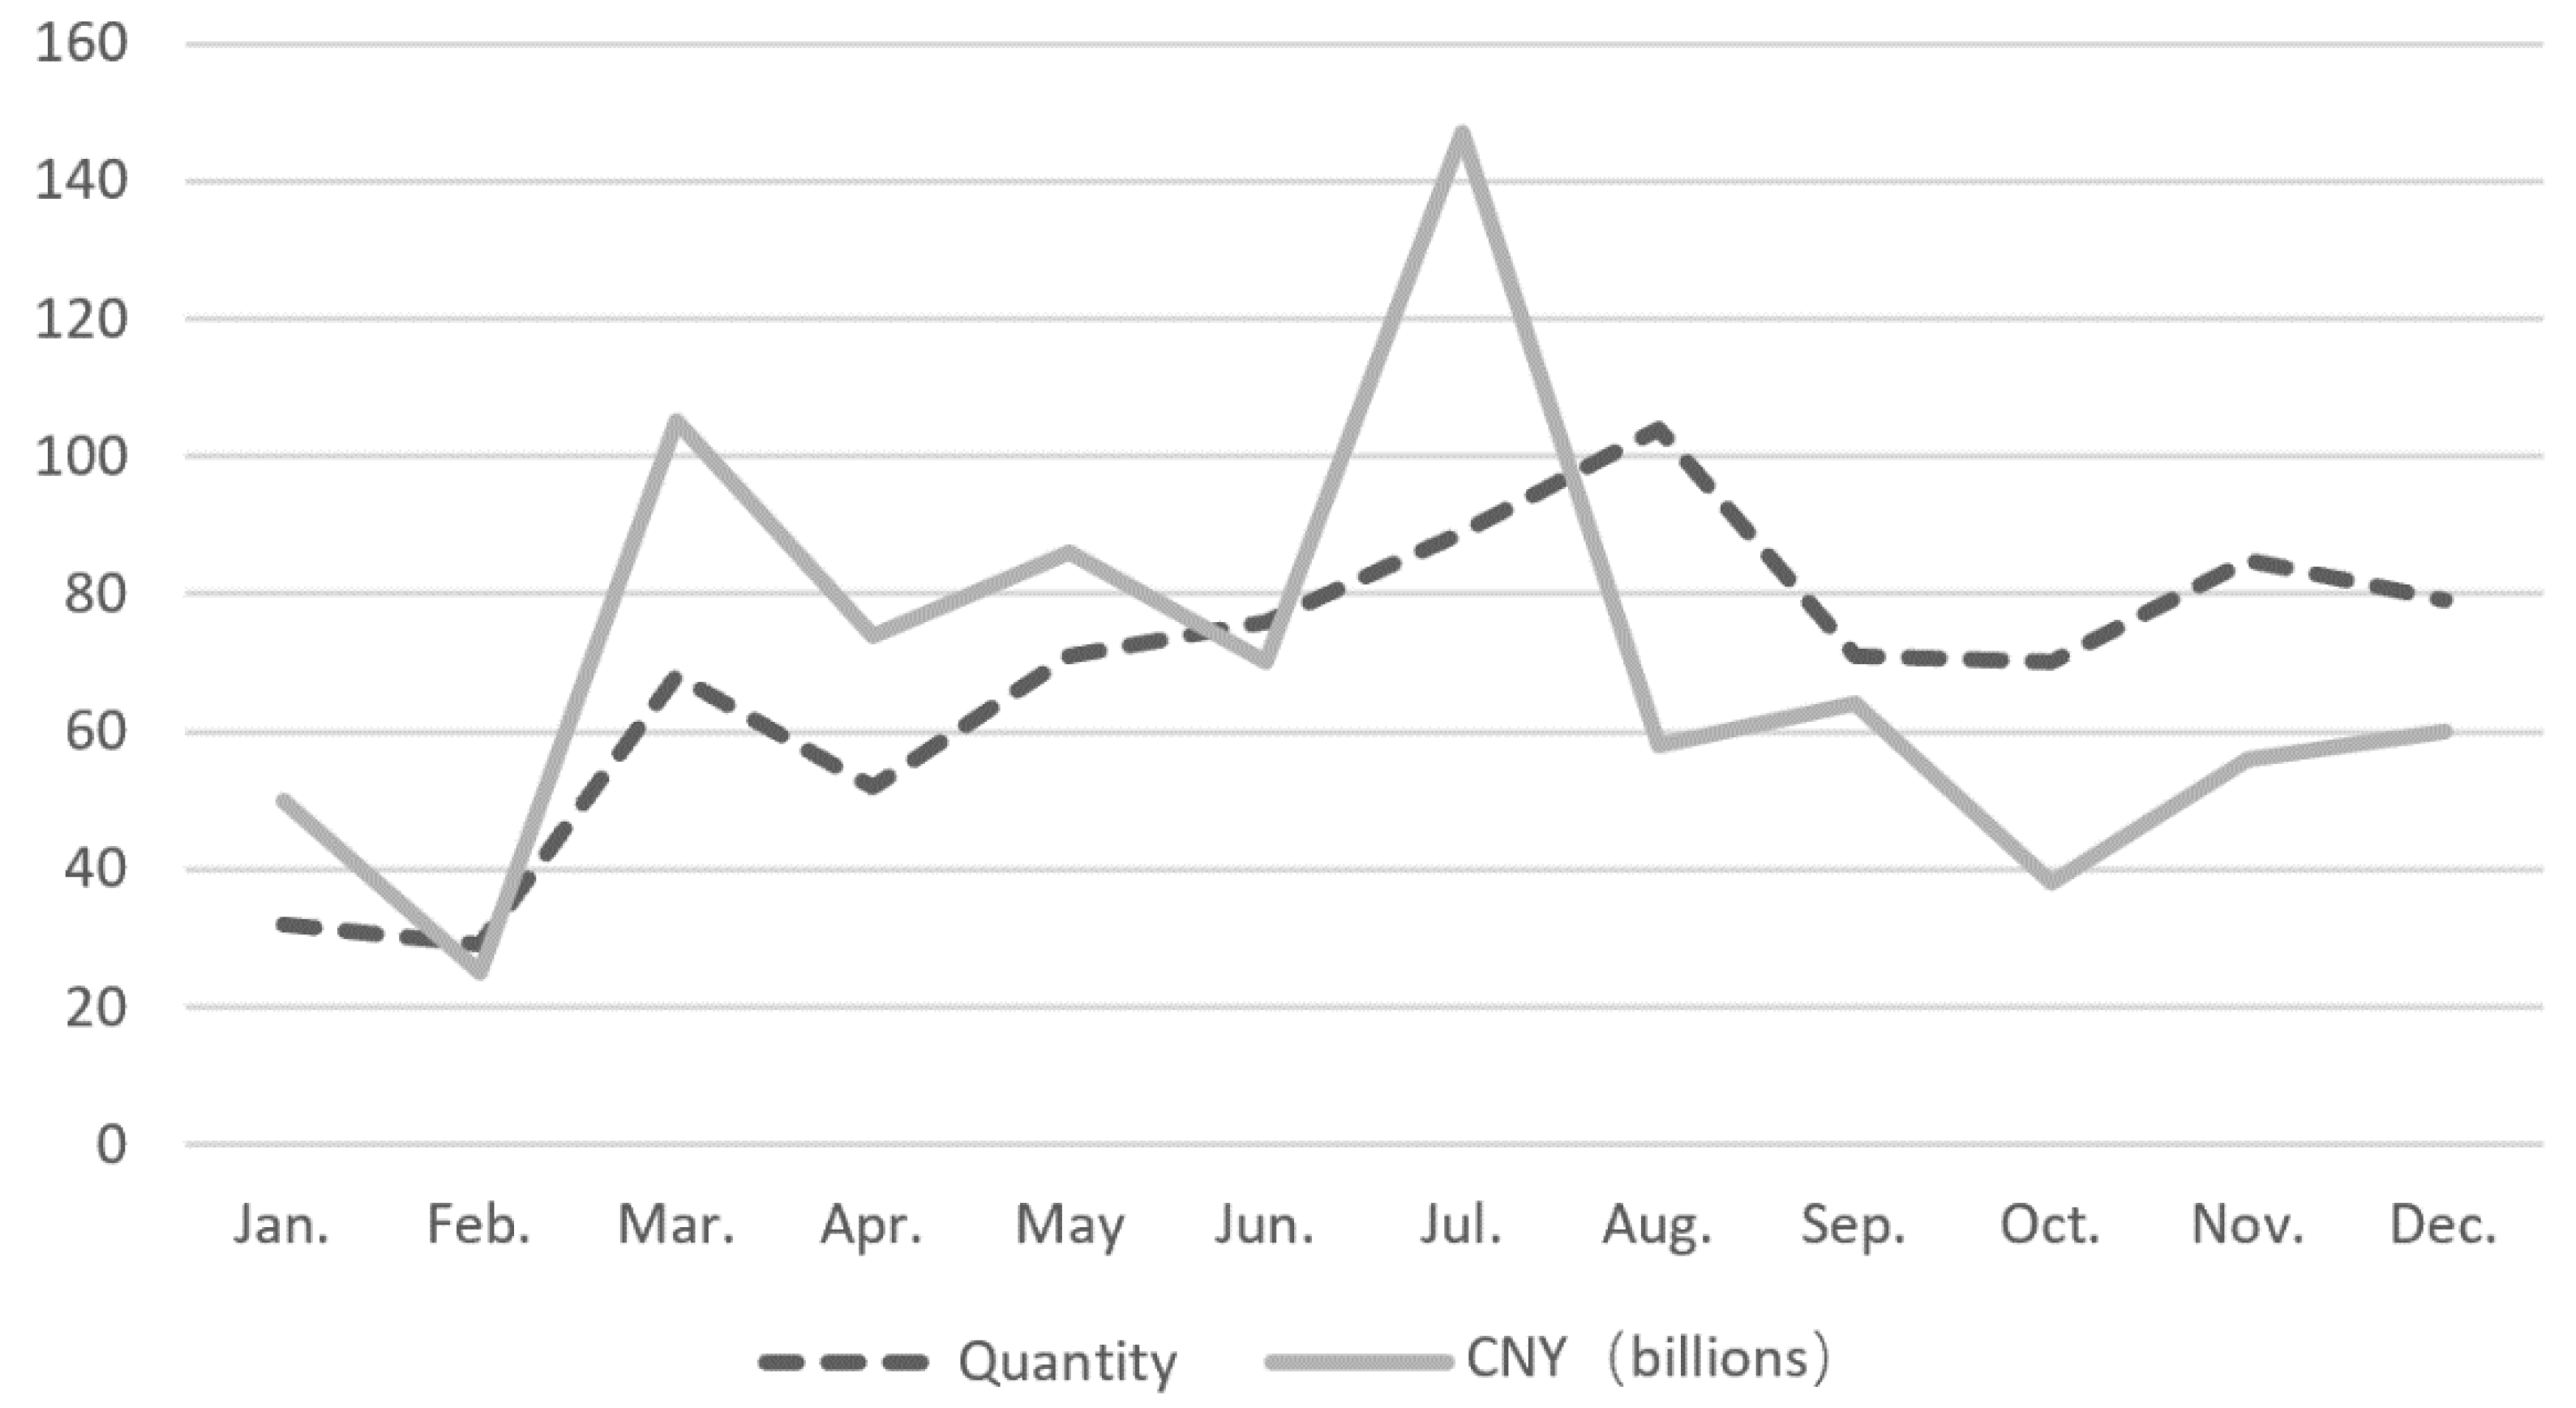
In column (3), the regression coefficient of financial support policies (Test × Policy) was 0.0878, which was significant at the 5% confidence level, indicating that financial support policies can promote the growth potential of new consumer enterprises. Hypothesis 1b was therefore supported. The increasing investment and financing in China’s new consumption field also proves that external financing is crucial to the potential growth of new consumer enterprises, which is essentially consistent with the empirical conclusion in our research. As shown in Figure 2, according to the incomplete statistics of the 2021 Investment and Financing in New Consumption Field released by CANPLUS, the number of financing cases (excluding IPO and private placement) in the country’s new consumption field in 2021 was up to 826, accounting for more than 10% of the total across the industry, and the disclosed financing amount of projects reached 83.1 billion yuan in aggregate, surpassing both 286 projects and a financing amount of 45 billion yuan in the same field in 2020. With funding from all sectors, the appraisal value of consumption projects in the first half of 2021 increased approximately three times, on average, and even more than five times for some projects, compared to that of the projects in 2017 and 2018.

4.2. Further Analysis on the Mechanism of Action

On the basis of the above empirical analysis, in order to further test the function of financial support policies in optimizing the allocation of credit resources, that is, whether financial support policies promote the growth of new consumer enterprises by improving credit supply, we added the interaction term between financial support policies and enterprise credit resources. The empirical models were set as follows:
Growthi,t = α0 + α1 × Testi × Policyt + α2 × Debti,t + α3 × Testi × Policyt × Debti,t + ∑βi × Controlsi,t + δt + µi + εi.t
Valuei,t = α0 + α1 × Testi × Policyt + α2 × Debti,t + α3 × Testi × Policyt × Debti,t + ∑βi × Controlsi,t + δt + µi + εi.t
PVGOi,t = α0 + α1 × Testi × Policyt + α2 × Debti,t + α3 × Testi × Policyt × Debti,t + ∑βi × Controlsi,t + δt + µii.t
Since the precise amount of loans to a listed enterprise (debt) is not publicly disclosed, we measured an enterprise’s obtained credit resources by using its balance of interest-bearing liabilities instead, given that indirect financing is the mainstay of China’s financial system, where the banking sector has a dominant role, and bank loans are heavily relied upon as the main source of financing [19]. The regression results are shown in Table 4.
In columns (1) and (2), the regression coefficients of the interaction term (Test × Policy × Debt) were 0.1008 and 0.0035, respectively, which were significant at the confidence levels of 10% and 1%, respectively. This indicates that financial support policies are helpful for the promotion of the current growth of new consumer enterprises through the guidance of credit supply. In column (3), the regression coefficient of the interaction term (Test × Policy × Debt) was 0.0053, which was significant at the confidence level of 1%, indicating that financial support policies have a positive impact on the growth potential of new consumer enterprises by promoting credit supply. In conclusion, Hypothesis 2 was supported. At the same time, we further analyzed the actual performance of enterprises in a new consumption field before and after the introduction of financial support policies to demonstrate the credit guidance effect of financial support policies on a new consumption field.
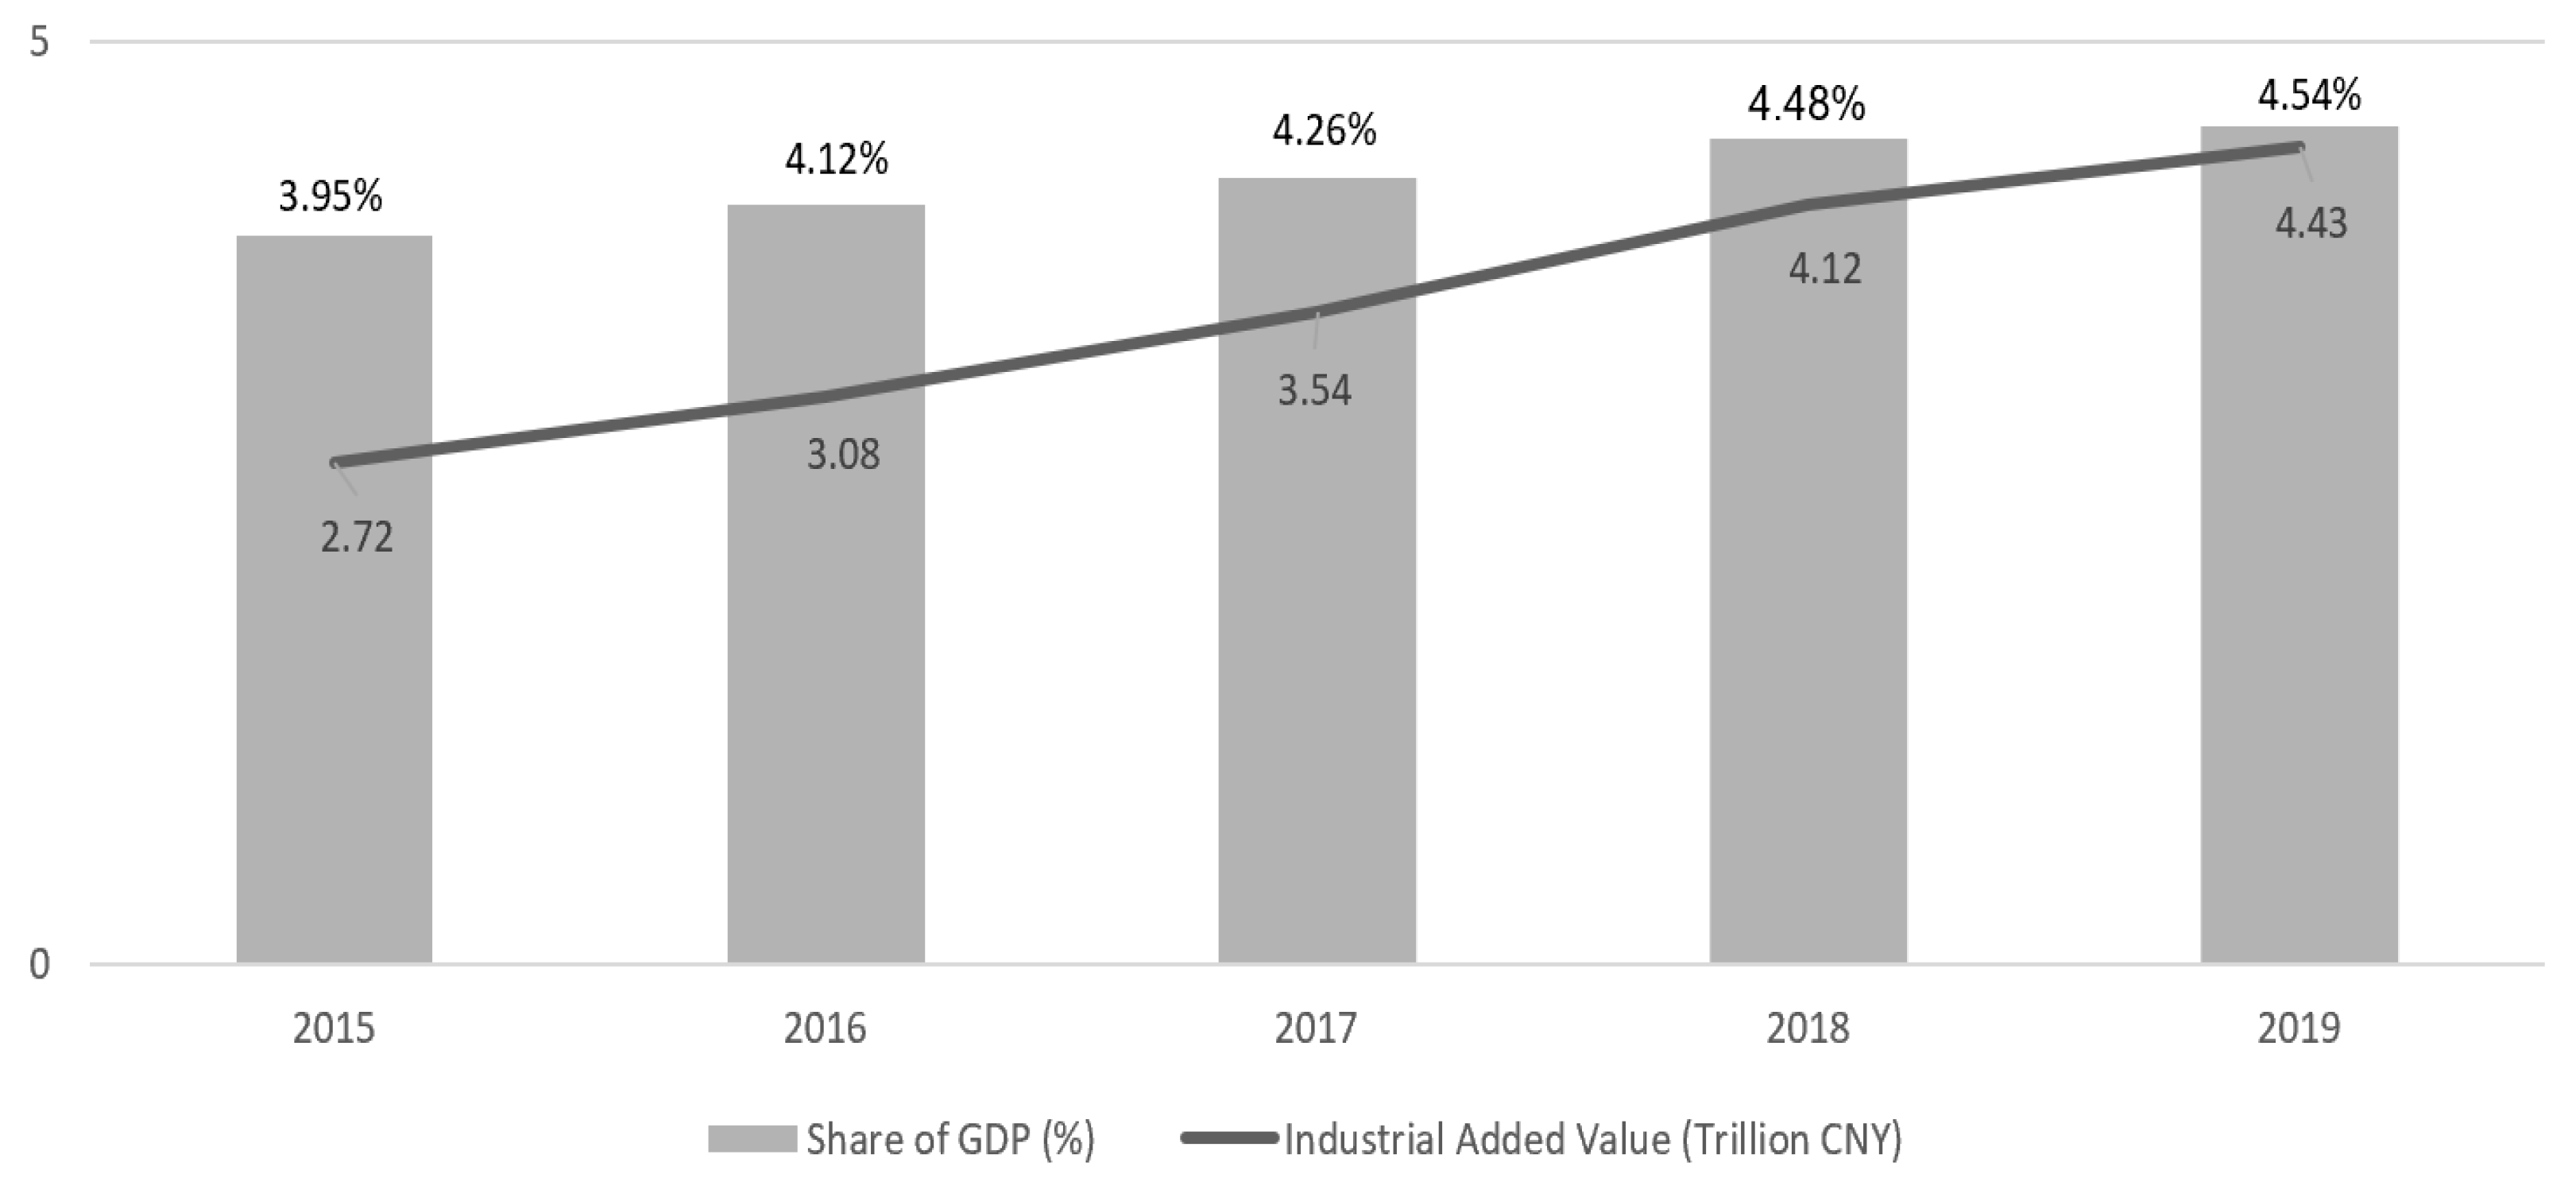
It was concluded that, after the announcement of the Guidelines in China, the financial support in the new consumption field has been greatly enhanced, and new consumer enterprises generally have greater access to credit resources, giving rise to their rapid expansion. In particular, with the extensive application of artificial intelligence, 5G, cloud computing, and other information technologies, new technologies, forms, and models have stimulated the resilience and vitality of a new consumption area where, in return, new technologies are tested, new forms are cultivated, and new models are practiced on an increasing basis. As shown in Figure 3, exemplified by the new cultural creativity niches, mobile internet, artificial intelligence, big data, and other technologies have seen rapid growth, and emerging cultural forms such as live streaming, digital content, audio-visual carriers, mobile publishing, and animation games have become new growth engines and driving forces for China’s cultural industry. According to the National Bureau of Statistics, the loan balance of 21 major banks (the 21 major banks include 3 non-commercial banks: CDB, EIBC, and ADBC; 6 large state-owned banks: ICBC, ABC, BOC, CCB, BCM, and PSBC; and 12 corporate banks: CMB, SPDB, CITICIB, CEB, HXB, CMBC, CGB, CIB, PAB, CZB, HFBANK, and CBHB) in China’s cultural industry in 2020 was approximately 1.5 trillion yuan, up 150% from 620.23 billion yuan in 2015, and far higher than the average growth rate of bank loans in the same period. Correspondingly, from 2015 to 2019, the overall market size of new cultural creativity and the related industries continued to expand, with the industrial added value rising from 2.72 trillion yuan in 2015 to 4.43 trillion yuan in 2019, up to a yearly increase of 15.72%, on average. Moreover, new cultural creativity enterprises, such as TikTok, Kwai, and MINISO, to name a few, have also sprung up.
By analyzing these niches, we can conclude that implementing financial support policies and increasing financial support can promote the sustainable development of the new consumption field and the growth of new consumer enterprises. This is basically consistent with the empirical analysis results.

4.3. Robustness Check

4.3.1. Parallel Trend Test

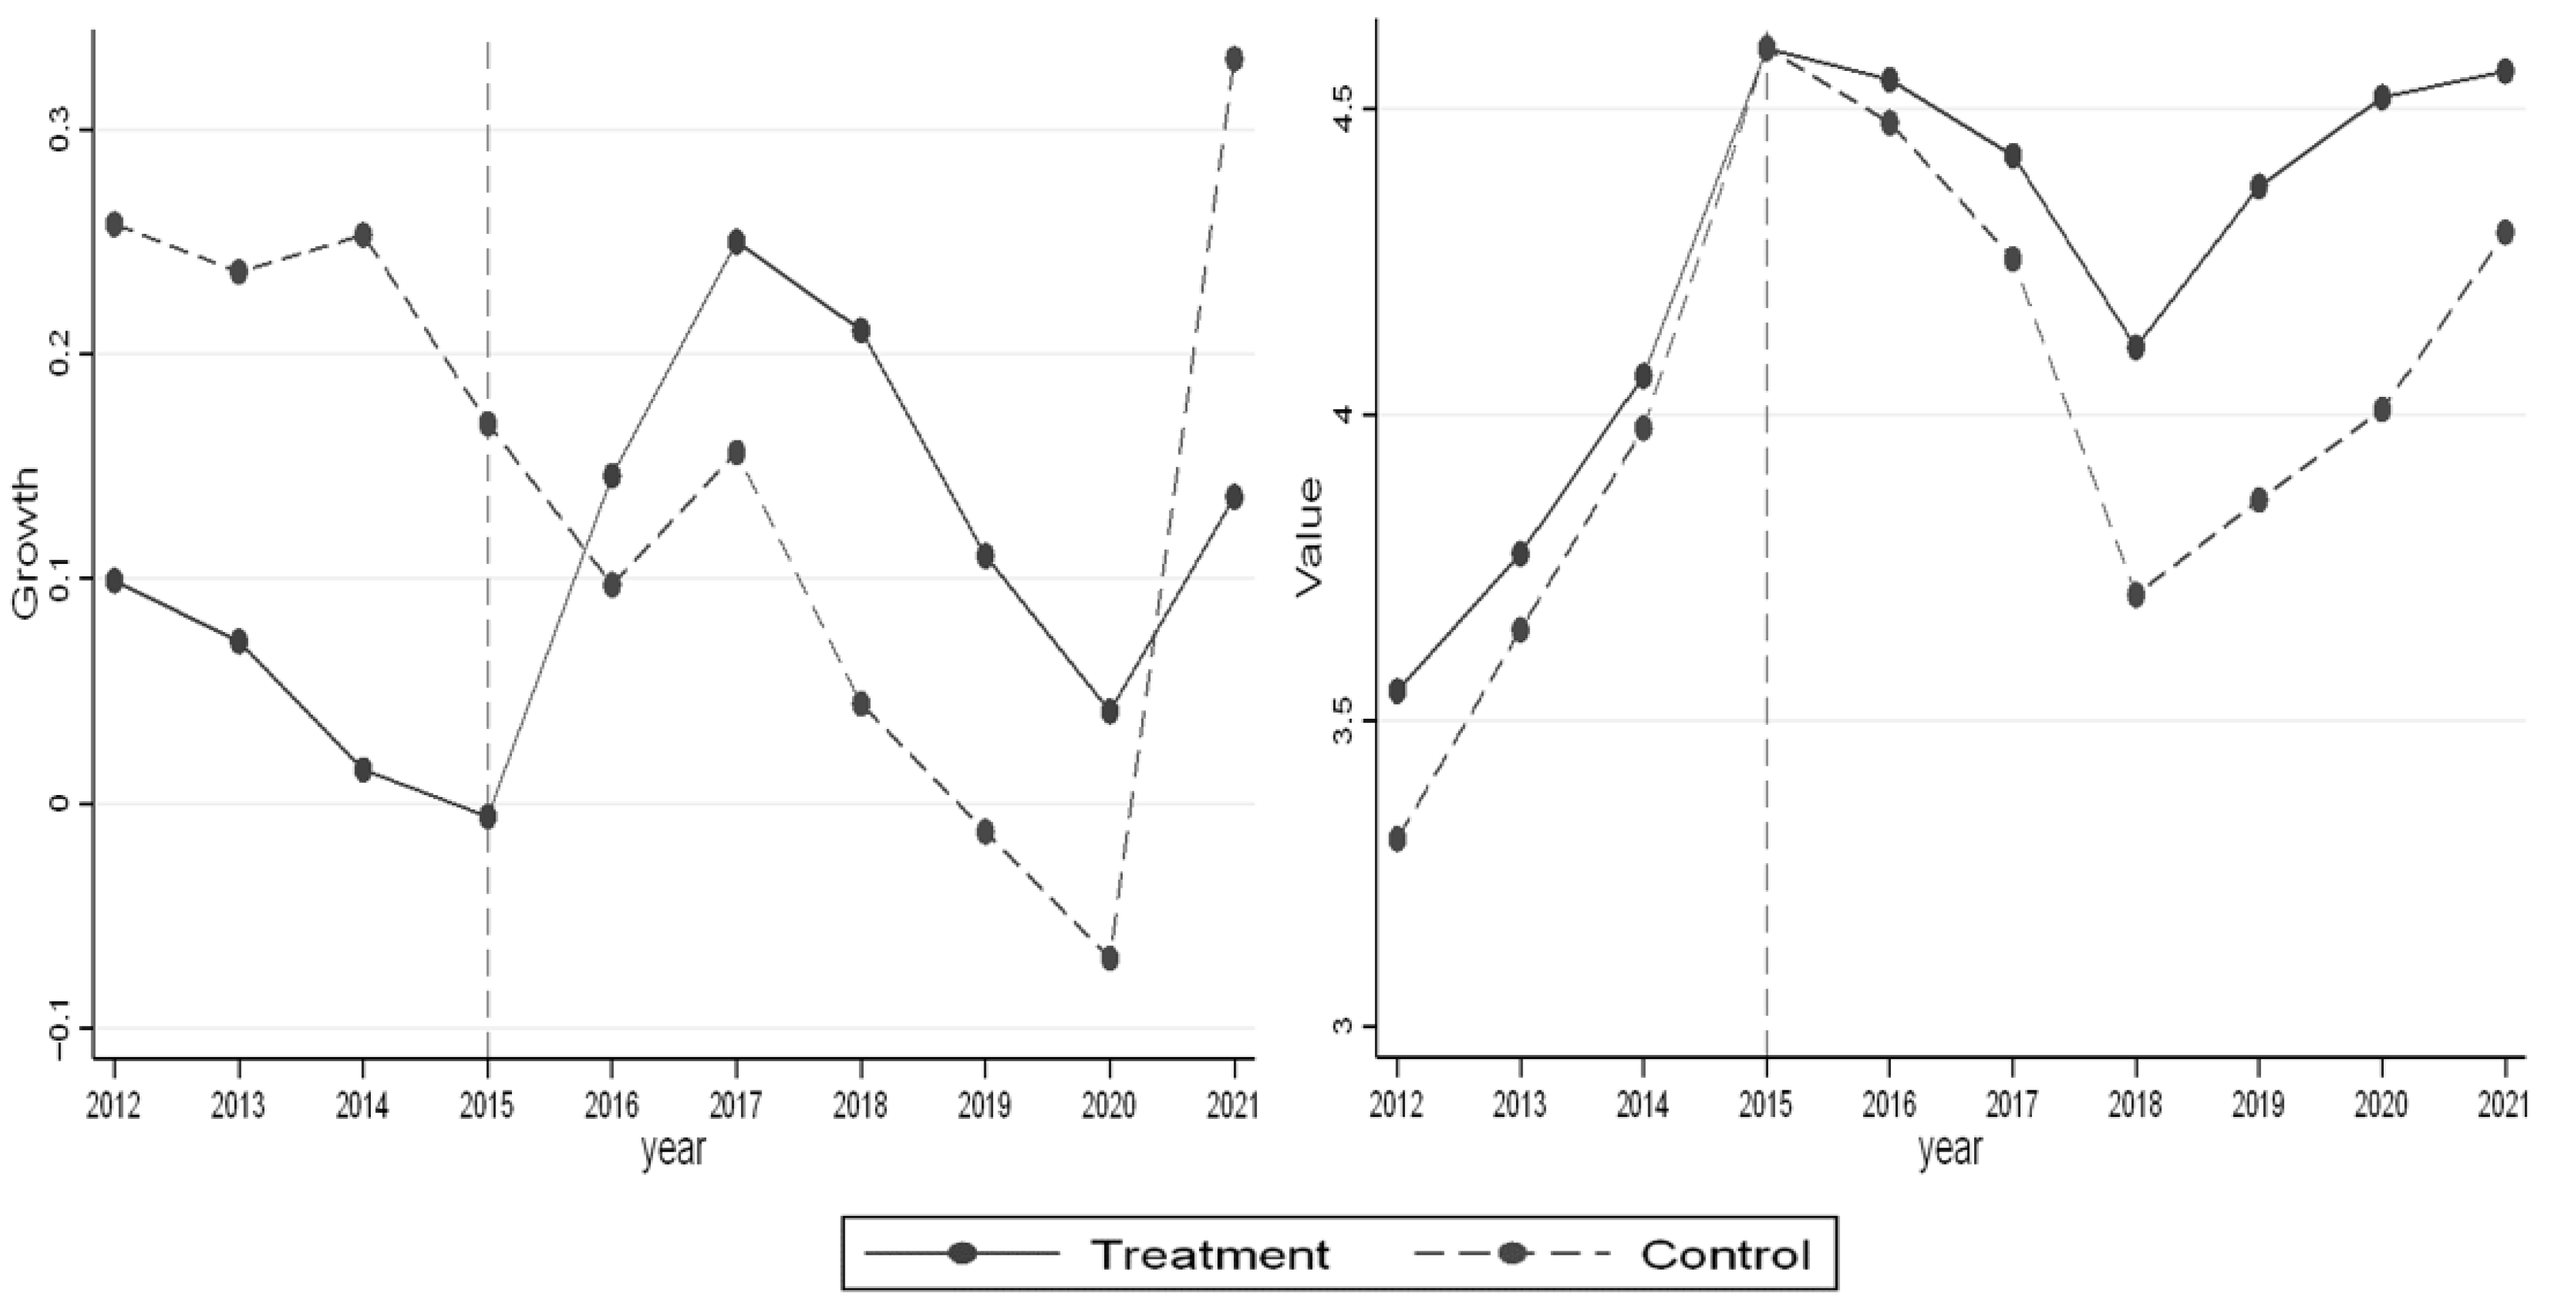
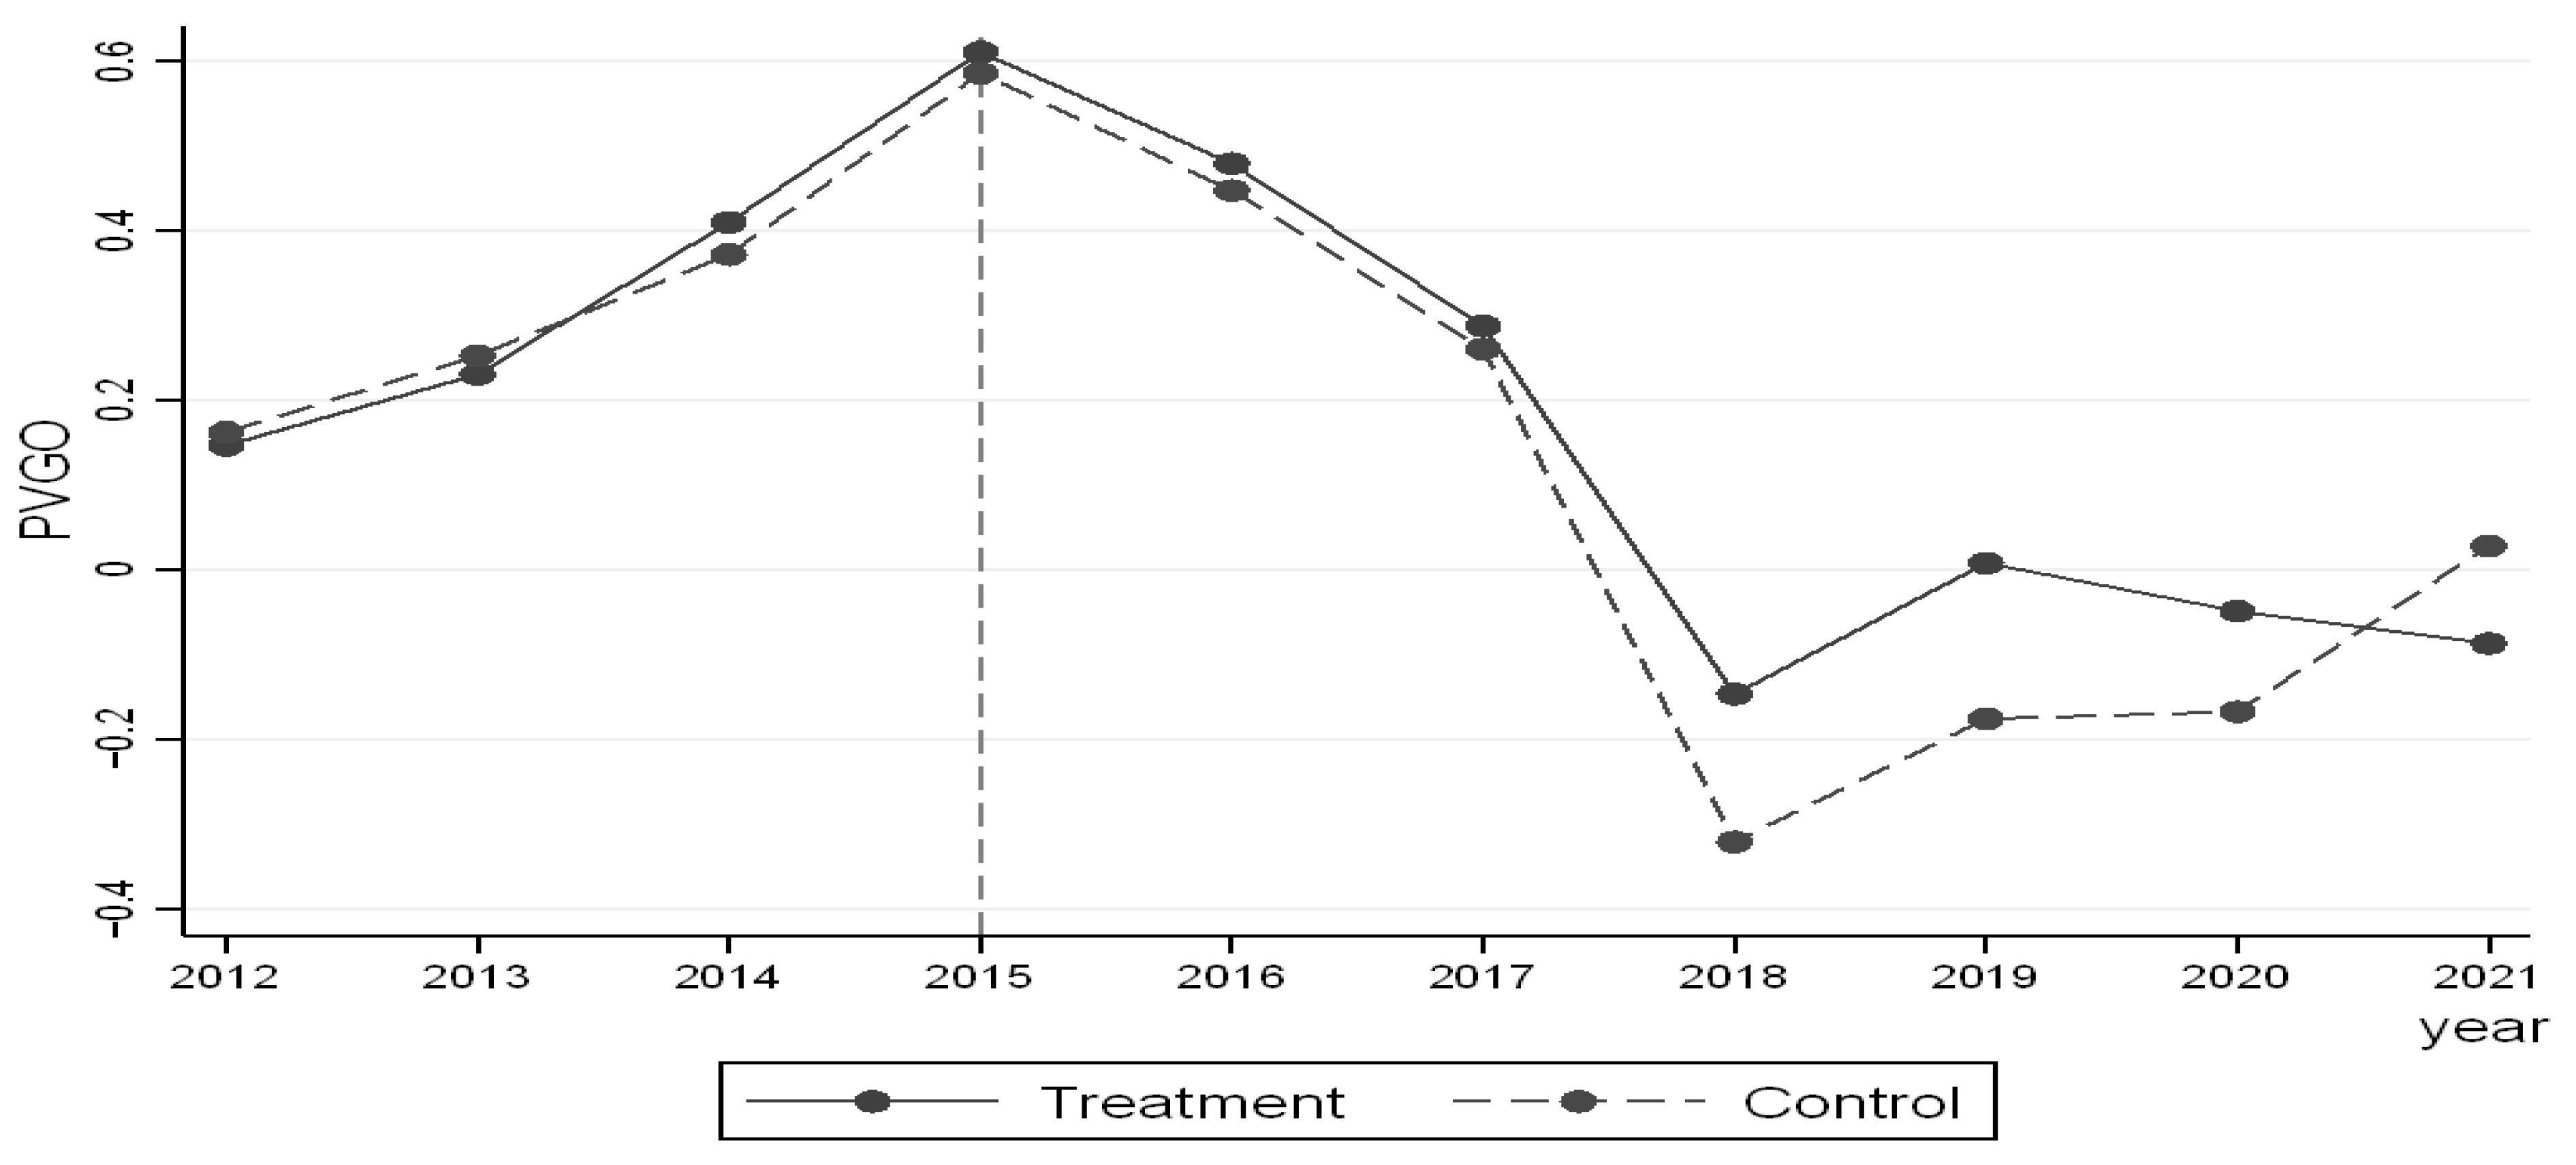
Figure 4 shows the parallel trend in the current growth of the sample enterprises from 2012 to 2021. The horizontal axis represents the year, and the vertical axis represents the current growth of the sample enterprises. The solid line is the average of the current growth of the enterprises in the treatment group, and the dotted line is the average of the current growth of the enterprises in the control group. Figure 5 shows the parallel trend in the growth potential of the sample enterprises in the same year. The horizontal axis represents the year, and the vertical axis represents the growth potential of the sample enterprises. The solid line represents the average value of the growth potential of the enterprises in the treatment group, and the dotted line represents the average value of the growth potential of the enterprises in the control group. Taking the end of 2015 as the dividing line, the sample period is divided into the pre-policy period (2012–2015) and the post-policy period (2016–2021). It can be seen that the current growth and growth potential of enterprises in the treatment group and the control group were basically the same in the period before the announcement of the Guidelines but changed significantly after the announcement of the Guidelines. Therefore, the parallel trend assumption was essentially satisfied.

4.3.2. Replacing the Control Group

Another 76 non-oriented support enterprises were randomly matched from the China A-share-listed enterprises as the control group for the robustness testing. The test results were essentially consistent with the above conclusion, and the regression coefficients of the financial support policies were statistically significant, indicating that the empirical analysis results in this paper were robust.

5. Heterogeneity Analysis

5.1. Analysis of Property Right Heterogeneity Based on Ownership

This section concerns the group-wise linear regression for groups divided into state-owned and non-state-owned enterprises in light of the nature of property rights of the sample enterprises, studying the different impacts of financial support policies on the growth of new consumer enterprises of different ownerships. The empirical results are shown in Table 5.
Except for column (1), the regression coefficients of financial support policies (Test × Policy) in columns (2) and (3) were not significant, which indicates that financial support policies had no obvious impact on the market value and growth option value of state-owned new consumer enterprises, that is, financial support policies had little impact on the current growth and growth potential of state-owned new consumer enterprises. This is essentially consistent with the conclusions of previous studies. State-owned enterprises usually do not have their development restricted due to a lack of credit resource allocation. The regression coefficients of financial support policies (Test × Policy) in columns (4) to (6) were all significantly positive, indicating that the implementation of financial support policies promoted the current growth and growth potential of non-state-owned new consumer enterprises. From the comprehensive analysis, it can be seen that financial support policies had a promoting effect on the growth of non-state-owned new consumer enterprises but had little impact on the growth of state-owned enterprises. Hypothesis 3 was verified.
This empirical analysis is also echoed by the existing literature, which suggest that financial support plays different roles in enterprises of different ownerships. State-owned enterprises are endowed with both economic and non-economic responsibilities, and state-owned capital with strategically important functions following its national mission, making them important backbones to fulfilling such missions [66]. For example, when businesses from all sectors were plagued by the COVID-19 pandemic and encountered great difficulties in operation, state-owned enterprises, responding to national calls, actively implemented national policies, continued to push forward various businesses, and expanded recruitment, playing a role in the stable growth and employment as an “anchor” and a “stabilizer”. The nature of state ownership also provides state-owned enterprises easier access to loans, and they barely suffer from financing constraints and or are affected by policy uncertainties [43]. In contrast, non-state-owned enterprises are treated unequally in the credit market, and they are inferior in their access to finance due to the nature of their ownership, social responsibilities undertaken, and lack of “invisible” support from local governments; thus, they more heavily rely on targeted financial support policies.
Therefore, to better exert the policy effect for new consumer enterprises, more attention should be paid to the potential of non-state-owned enterprises and how to lay out financial support policies in a more targeted manner. For example, as an important part of non-state-owned businesses, the private sector is the most creative, dynamic, and potentially important force in the market economy. The Chinese private economy contributed to more than 50% of tax, more than 60% of GDP, more than 70% of technological innovation, more than 80% of urban employment, and more than 90% of enterprises [67]. High-quality growth of the private sector is an important contributor to the country’s high-quality economic growth. Therefore, in the formulation of financial support, we should strengthen communication with enterprises, especially with the private sector and other non-state-owned businesses, to respond to their perceived difficulties, thus helping exert the positive impact of financial support and build accessible channels for the recipients to benefit from them.

5.2. Analysis of North–South Geographic Heterogeneity

This section studies the north–south regional heterogeneity. On the basis of the difference among regions where new consumption enterprises were located, we performed a group-wise linear regression for groups divided into southern and northern enterprises to analyze different impacts of financial support policies on new consumption enterprises in different regions, providing a reference for future optimization of regional development imbalance in middle-income economies. Table 6 shows the empirical results of the impact on the growth of new consumer enterprises in different regions.
It can be seen that the impact of financial support policies on the current growth and growth potential of new consumer enterprises was significantly positive in both the south and the north, reflecting the fact that financial support policies have achieved obvious policy effects in both regions. However, there are differences in the regression coefficients of financial support policies in the south and the north. In columns (1) to (3), the regression coefficients of financial support policies (Test × Policy) in southern China were 0.2689, 0.1282, and 0.0804, respectively; in columns (4) to (6), the same coefficients in the north were 0.3169, 0.2475, and 0.1707, respectively. This shows that, compared with the southern region, financial support policies play a greater role in promoting the growth of new consumer enterprises in the northern region. We also conducted a difference test on the regression coefficients of financial support policies (Test × Policy) in the south and the north. As shown in Table 7, the statistics of the chi-squared test were significant, at 2.42, 2.44, and 4.76 for Growth, Value, and PVGO, respectively. The original assumption that the coefficients of financial support policies in the south and the north were the same was rejected.
In order to further test the impact of regional variables on the effect of financial support policies, we introduced the dummy variable (north) representing the northern region and the cross term (Test × Policy × North) between this dummy variable and financial support policies in the full sample model. The results in Table 8 show that the regression coefficients of the cross terms (Test × Policy × North) were significantly positive, that is, compared with the southern region, financial support policies had a greater role in promoting the growth of new consumer enterprises in the northern region. Hypothesis 4 was therefore verified.
In reviewing the past progress of China against the backdrop of prevailing regional division, the localism-based competition led to the increasing cluster of industries developing in coordination with each other. Real and financial industries will, for example, gather together in a certain region that is more attractive for entities and financial institutions, in pursuit of growth opportunities. China is now experiencing an imbalanced growth in that the south is developing faster than the north, since the north has seen a considerable rollback in growth rate due to its slow capital accumulation, sluggish reform in the economic system, imbalanced economic structure, and decrease in labor, while the south has good momentum in the economic transformation and upgrade overall. As a result, the north–south economic gap is widening [68]. Accordingly, as the real and financial industries cluster and mutually benefit from each other, the south has accumulated more qualified funding resources than the north. Therefore, the new consumer enterprises in the north require more support in the form of financial support policies. Therefore, to better exert the role of new consumption as the main engine of China’s sustainable economic growth, we should pay more attention to imbalanced economic and financial growth in different regions by providing financial support in favor of the northern region that has limited access to financial resources and is characterized by a traditional and backward industrial structure. This will effectively energize this region with a new consumption industry, driving the transformation and upgrade of traditional industries, thus facilitating balanced and sustainable growth of the regional economy.

6. Conclusions

At present, China is at a crossroads at the middle-income stage. The development of new consumption, the main engine of economic growth, is crucial to resolving the problem of economic structural imbalance and achieving sustainable economic growth for China. As an important medium of resource allocation, the way in which finance can effectively serve the growth of new consumer enterprises is an important topic in the process of promoting the transformation and upgrade of the new consumption field. Taking the announcement of the Guidelines jointly issued by China’s financial regulators as a case study, we discussed in depth whether financial support policies can promote the growth of new consumer enterprises and the impact mechanism for this. We found the following to be the case: First, the implementation of financial support policies can catalysze the growth of new consumer enterprises, including the promotion of both current growth and growth potential. Second, financial support policies have the function of resource allocation, which can guide financial institutions to increase the credit supply to new consumer enterprises, optimize the allocation of credit resources, and promote the growth of new consumer enterprises. Third, the analysis of the heterogeneity of property rights and regional heterogeneity of new consumer enterprises shows that financial support policies have a more obvious effect on the growth of non-state-owned enterprises compared with those that are state-owned, and they play a greater role in promoting the growth of new consumer enterprises in the northern region than in the southern region. Our study has filled the gap in the theoretical research of the new consumption field, extending the existing research framework on financial support policies and enterprise growth and providing theoretical and empirical references for achieving targeted assistance for new consumption enterprises to accelerate the sustainable development of the new consumption field.
On the basis of the above research conclusions, our study has the following policy implications:
First, financial support policies have achieved expected positive results, and we should provide further attention to the function of financial support policies in optimizing the allocation of financial resources in the new consumption field. The transformation of new and old drivers of China’s economic growth during the shift period has led to the rapid growth of emerging industrial clusters represented by modern service industries. China’s economic growth has changed from being investment driven to consumption led. It is imperative to develop new consumption, which is the key to dealing with the structural contradiction between total demand and total supply in China’s middle-income stage. Finance is the core of the modern economy. The efficiency of financial resource allocation determines the quality of a country’s economic development to a great extent. Therefore, the Chinese government should further play a role in the development of financial support policies, in guiding and allocating credit resources; in increasing key assistance to new consumption enterprises; and in promoting the sustainable development of the new consumption field, which is key to China’s economic growth.
Second, due to the heterogeneity in property rights and regions affecting the impact of financial support policies, we should make scientific decisions in collaboration with the impact mechanism when implementing financial support policies to promote the development of the new consumption field. In terms of the practical application, we should formulate assistance measures in combination with the actual situation of new consumer enterprises with different property rights and in different regions, for example, by focusing on the financing difficulties faced by non-state-owned enterprises due to the scale effect and the nature of ownership, as well as increasing targeted assistance to non-state-owned enterprises, especially private enterprises. According to the actual economic and social development in the north and the south of China, we should adopt measures according to local conditions and introduce policies and measures that match the current situation of regional economic and financial development, so as to improve the unbalanced situation of regional economic and financial development in China and help regional coordinated development.
Third, at this stage, the implementation of financial support policies in China is an effective path to promoting sustainable development in the new consumption field, and it also has significance for other economies in the middle-income stage. As the international practical experience shows, after reaching the middle-income level, most developing countries’ economic growth slows down, industrial upgrading is weak, and foreign dependence increases, making it difficult to achieve economic convergence to becoming a developed country, thus falling into the “middle-income trap”. Moreover, the final consumption rate of middle-income economies is generally far lower than that of developed economies. Therefore, for middle-income economies, promoting transformation and upgrading of the consumption industry, as well as giving full attention to the important role of new consumption for sustained economic growth, can be regarded as a powerful breakthrough. Our study provides theoretical and empirical references for middle-income economies to promote the sustainable development of the new consumption field.
However, this study still has some limitations. Firstly, we discussed the policy effect of financial support policies from the perspective of enterprise microdata. The selected sample comprised A-share-listed enterprises, resulting in limited data volume. In the future, with the improvement of the information disclosure system, research in related fields will be more in depth and comprehensive. Secondly, on the path of the relationship between the development of the new consumption field and financial support policies, more variables are expected to be included so as to obtain a deeper understanding of the relationship and influence mechanisms. Future studies can further explore the impact of different factors on the effects of financial support policies in the new consumption field and provide implications and references for sustainable development of new consumption fields in China and other countries. In addition, the research on the new consumption field is still in its infancy, and therefore we need to continue to pay attention to the transformation practice of the new consumption field in the future, as well as constantly enrich the existing research findings.

Author Contributions

Conceptualization, Q.L. and Z.Z.; methodology, Q.L.; writing—original draft preparation, Q.L. and Z.Z.; writing—review and editing, Q.L. and Z.Z.; supervision, Q.L. and Z.Z.; funding acquisition, Z.Z. All authors have read and agreed to the published version of the manuscript.

Funding

This research was funded by the Chongqing Talent Plan Project of China, grant number CQYC20200102210.

Institutional Review Board Statement

Not applicable.

Informed Consent Statement

Not applicable.

Data Availability Statement

The data that support the findings of this study were derived from the following resources available in the public domain: National Bureau of Statistics, http://www.stats.gov.cn/ (accessed on 7 May 2022); the World Bank, https://www.worldbank.org/en/home (accessed on 11 May 2022); ITjuzi, https:// baijiahao.baidu. com/s?id=1724976220337706273&wfr=spider&for=pc (accessed on 17 February 2022); and the Wind database.

Conflicts of Interest

The authors declare no conflict of interest.

References

  1. Kee, H.L.; Tang, H. Domestic Value Added in Exports: Theory and Firm Evidence from China. Am. Econ. Rev. 2016, 106, 1402–1436. [Google Scholar] [CrossRef] [Green Version]
  2. Sznajderska, A.; Kapuściński, M. Macroeconomic Spillover Effects of the Chinese Economy. Rev. Int. Econ. 2020, 28, 992–1019. [Google Scholar] [CrossRef] [PubMed]
  3. Ouyang, Y.; Lingxiao, T. Theory of the Development Pattern of Great Powers: Formation, Framework and Modern Value. Econ. Res. J. 2022, 57, 12–21. [Google Scholar]
  4. Mao, Z.; Xie, C.; Ye, X. China’s New Consumption in the New Era: Theoretical Connotation, Development Characteristics and Policy Orientation. Economist 2020, 64–74. [Google Scholar] [CrossRef]
  5. Guideline on Accelerating the Cultivation of New Supply and Driving Force Actively Led by New Consumption. The State Council of China. 2015. Available online: http://www.gov.cn/gongbao/content/2015/content_2975882.htm (accessed on 19 November 2015).
  6. Tao, S. The Rise of “New Consumption” Drives China’s Domestic Demand and Consumption Upgrading. Jilin Provincial Government Development Research Center. 2019. Available online: http://fzzx.jl.gov.cn/gzdt/yjdt/201912/t20191219_6329882.html (accessed on 19 December 2021).
  7. Liao, H.; Zhang, L. New Consumption Promotes the Transformation and Upgrading of the Industrial Structure. People’s Trib. 2019, 27, 86–87. [Google Scholar]
  8. Xianchun, X.; Zhang, Z.; Guan, H. China’s New Economy: Roles, Characteristics and Challenges. Financ. Trade Econ. 2020, 41, 5–20. [Google Scholar] [CrossRef]
  9. Zhang, X.; Zhao, X.; Qu, L. Do Green Policies Catalyze Green Investment? Evidence from ESG Investing Developments in China. Econ. Lett. 2021, 207, 110028. [Google Scholar] [CrossRef]
  10. Guidelines on Increasing Financial Supports in New Consumption Aeras. The People’s Bank of China; China Banking Regulatory Commission. 2016. Available online: http://www.pbc.gov.cn/goutongjiaoliu/113456/113469/3041026/index.html (accessed on 30 March 2016).
  11. King, R.G.; Levine, R. Finance and Growth: Schumpeter Might Be Right. Q. J. Econ. 1993, 108, 717–737. [Google Scholar] [CrossRef]
  12. Walsh, C.E. Using Monetary Policy to Stabilize Economic Activity. Financ. Stab. Macroecon. Policy 2009, 245, 296. [Google Scholar]
  13. Kremer, M. Macroeconomic Effects of Financial Stress and the Role of Monetary Policy: A VAR Analysis for the Euro Area. Int. Econ. Econ. Policy 2016, 13, 105–138. [Google Scholar] [CrossRef]
  14. Singh, G.; Wilson, A.; Halari, A. The Efficacy of Macroeconomic Policies in Resolving Financial Market Disequilibria: A Cross-country Analysis. Int. J. Financ. Econ. 2019, 24, 647–667. [Google Scholar] [CrossRef] [Green Version]
  15. Benigno, P.; Eggertsson, G.B.; Romei, F. Dynamic Debt Deleveraging and Optimal Monetary Policy. Am. Econ. J. Macroecon. 2020, 12, 310–350. [Google Scholar] [CrossRef] [Green Version]
  16. Cilliers, E.J.; Diemont, E.; Stobbelaar, D.J.; Timmermans, W. Sustainable Green Urban Planning: The Workbench Spatial Quality Method. J. Place Manag. Dev. 2011, 4, 214–224. [Google Scholar] [CrossRef]
  17. Churm, R.; Radia, A.; Leake, J.; Srinivasan, S.; Whisker, R. The Funding for Lending Scheme. Bank Engl. Q. Bull. 2012, 18, Q4. [Google Scholar]
  18. Zhang, K.; Wang, Y.; Huang, Z. Do the Green Credit Guidelines Affect Renewable Energy Investment? Empirical Research from China. Sustainability 2021, 13, 9331. [Google Scholar] [CrossRef]
  19. Cai, Q.; Chen, Y.; Lin, K. Does Access to Credit Availability Encourage Corporate Innovation?—Evidence From the Geographic Network of Banks in China. Econ. Res. J. 2020, 55, 124–140. [Google Scholar]
  20. Benfratello, L.; Schiantarelli, F.; Sembenelli, A. Banks and Innovation: Microeconometric Evidence on Italian Firms. J. Financ. Econ. 2008, 90, 197–217. [Google Scholar] [CrossRef] [Green Version]
  21. Tsuruta, D. Bank Loan Availability and Trade Credit for Small Businesses During the Financial Crisis. Q. Rev. Econ. Financ. 2015, 55, 40–52. [Google Scholar] [CrossRef]
  22. Love, I.; Martínez Pería, M.S. How Bank Competition Affects Firms’ Access to Finance. World Bank Econ. Rev. 2014, 29, 413–448. [Google Scholar] [CrossRef] [Green Version]
  23. Song, J.; Zhou, H.; Gao, Y.; Guan, Y. Digital Inclusive Finance, Human Capital and Inclusive Green Development—Evidence from China. Sustainability 2022, 14, 9922. [Google Scholar] [CrossRef]
  24. Wu, Y.; Li, Y. Impact of Government Intervention in the Housing Market: Evidence from the Housing Purchase Restriction Policy in China. Appl. Econ. 2018, 50, 691–705. [Google Scholar] [CrossRef]
  25. Liu, J.Y.; Xia, Y.; Fan, Y.; Lin, S.M.; Wu, J. Assessment of a Green Credit Policy Aimed at Energy-intensive Industries in China Based on a Financial CGE Model. J. Clean. Prod. 2017, 163, 293–302. [Google Scholar] [CrossRef]
  26. Wang, Y.; Lei, X.; Long, R.; Zhao, J. Green Credit, Financial Constraint, and Capital Investment: Evidence from China’s Energy-intensive Enterprises. Environ. Manag. 2020, 66, 1059–1071. [Google Scholar] [CrossRef] [PubMed]
  27. Doh, S.; Kim, B. Government Support for SME Innovations in the Regional Industries: The Case of Government Financial Support Program in South Korea. Res. Policy 2014, 43, 1557–1569. [Google Scholar] [CrossRef]
  28. Bach, L. Are Small Businesses Worthy of Financial Aid? Evidence from a French Targeted Credit Program. Rev. Financ. 2013, 18, 877–919. [Google Scholar] [CrossRef]
  29. Lin, C.; He, L.; Yang, G. Targeted Monetary Policy and Financing Constraints of Chinese Small Businesses. Small Bus. Econ. 2021, 57, 2107–2124. [Google Scholar] [CrossRef]
  30. Arif, A.; Minh Vu, H.; Cong, M.; Hon Wei, L.; Islam, M.M.; Niedbała, G. Natural Resources Commodity Prices Volatility and Economic Performance: Evaluating the Role of Green Finance. Resour. Policy 2022, 76, 102557. [Google Scholar] [CrossRef]
  31. Eisenhardt, K.M. Speed and Strategic Choice: How Managers Accelerate Decision Making. Calif. Manag. Rev. 1990, 32, 39–54. [Google Scholar] [CrossRef]
  32. Fang, F.; Cai, W. Banking Competition and Enterprise Growth: Empirical Evidence from Industrial Enterprises. Manag. World 2016, 31, 63–75. [Google Scholar]
  33. Huang, L.; Ying, Q.; Yang, S.; Hassan, H. Trade Credit Financing and Sustainable Growth of Firms: Empirical Evidence from China. Sustainability 2019, 11, 1032. [Google Scholar] [CrossRef] [Green Version]
  34. Kerr, W.R.; Nanda, R. Democratizing Entry: Banking Deregulations, Financing Constraints, and Entrepreneurship. J. Financ. Econ. 2009, 94, 124–149. [Google Scholar] [CrossRef] [Green Version]
  35. Chakrabarti, D.; Sethi, P.; Bhattacharjee, S. Directed Credit, Financial Development and Financial Structure: Theory and Evidence. Appl. Econ. 2019, 51, 1711–1729. [Google Scholar] [CrossRef]
  36. Nikolov, B.; Schmid, L.; Steri, R. The Sources of Financing Constraints. J. Financ. Econ. 2021, 139, 478–501. [Google Scholar] [CrossRef]
  37. Naeem, K.; Li, M.C. Corporate Investment Efficiency: The Role of Financial Development in Firms With Financing Constraints and Agency Issues in OECD Non-financial Firms. Int. Rev. Financ. Anal. 2019, 62, 53–68. [Google Scholar] [CrossRef]
  38. Kulatilaka, N.; Marcus, A.J. Project Valuation Under Uncertainty: When does DCF Fail? J. Appl. Corp. Financ. 1992, 5, 92–100. [Google Scholar] [CrossRef]
  39. Gong, P.; Zhang, B. Learning Actions, Control Actions and Firm’s Growth Option Value—An Evidence from China. Nankai Bus. Rev. 2007, 9, 17–22. [Google Scholar]
  40. Kester, W.C. Today’s Options for Tomorrow’s growth. Harv. Bus. Rev. 1984, 62, 153–160. [Google Scholar]
  41. Huang, W.-B.; Liu, J.; Bai, H.; Zhang, P. Value Assessment of Companies by Using an Enterprise Value Assessment System Based on Their Public Transfer Specification. Inf. Process. Manag. 2020, 57, 102254. [Google Scholar] [CrossRef]
  42. Li, K.; Guo, Z.; Chen, Q. The Effect of Economic Policy Uncertainty on Enterprise Total Factor Productivity Based on Financial Mismatch: Evidence from China. Pac. -Basin Financ. J. 2021, 68, 101613. [Google Scholar] [CrossRef]
  43. Guriev, S. Soft Budget Constraints and State Capitalism. Acta Oeconomica 2018, 68, 115–124. [Google Scholar] [CrossRef] [Green Version]
  44. Majumdar, S.K. Slack in the State-owned Enterprise: An Evaluation of the Impact of Soft-budget Constraints. Int. J. Ind. Organ. 1998, 16, 377–394. [Google Scholar] [CrossRef]
  45. Ferri, G.; Liu, L.-G. Honor Thy Creditors Beforan Thy Shareholders: Are the Profits of Chinese State-Owned Enterprises Real? Asian Econ. Pap. 2010, 9, 50–71. [Google Scholar] [CrossRef]
  46. Liang, Q.; Yu, F. Financial Crisis, State Ownership and Capital Investment. Econ. Res. J. 2014, 49, 47–61. [Google Scholar]
  47. Hu, Z.; Xia, X.; Yu, M. Financial Development, Liquidity and Trade Credit: Evidences from China during the Global Financial Crisis. Nankai Bus. Rev. 2013, 16, 5–68. [Google Scholar]
  48. Guo, Y.; Xu, F.; Shu, Z. The Inclusive Effects of Targeted RRR Cuts against the Background of Bank Competition: An Empirical Analysis Based on Corporate Data from Mainland China. J. Financ. Res. 2019, 61, 1–18. [Google Scholar]
  49. Li, L.; Liu, B. Source Identification and Dynamic Evolution of Regional Economic Growth Performance in China: Based on Input-level Decomposition. Econ. Res. J. 2015, 8, 58–72. [Google Scholar]
  50. Williamson, J.G. Regional Inequality and the Process of National Development: A Description of the Patterns. Econ. Dev. Cult. Chang. 1965, 13, 1–84. [Google Scholar] [CrossRef]
  51. Wei, H.; Nian, M.; Li, L. China’s Regional Development Strategy and Policy during the 14th Five-Year Plan Period. China Ind. Econ. 2020, 5, 5–22. [Google Scholar] [CrossRef]
  52. Deng, Z.; Gao, T.; Zhu, F. China’s Regional Gap and Supply-side Structural Reform: Endogenous Growth in a Transition Period. Econ. Res. J. 2020, 55, 22–37. [Google Scholar]
  53. Ellison, G.; Glaeser, E.L.; Kerr, W.R. What Causes Industry Agglomeration? Evidence from Coagglomeration Patterns. Am. Econ. Rev. 2010, 100, 1195–1213. [Google Scholar] [CrossRef] [Green Version]
  54. Xie, S.; Mo, T. Index Futures Trading and Stock Market Volatility in China: A Difference-in-Difference Approach. J. Futures Mark. 2014, 34, 282–297. [Google Scholar] [CrossRef]
  55. Dantas, R.N.D.; Duarte, G.; Silveira Neto, R.D.M.; Sampaio, B. Height Restrictions and Housing Prices: A Difference-in-discontinuity Approach. Econ. Lett. 2018, 164, 58–61. [Google Scholar] [CrossRef]
  56. Heckman, J.J.; Ichimura, H.; Smith, J.A.; Todd, P.E. Characterizing Selection Bias Using Experimental Data. NBER Work. 1998, 66, 1017–1098. [Google Scholar] [CrossRef]
  57. Waibel, S.; Petzold, K.; Rüger, H. Occupational Status Benefits of Studying Abroad and the Role of Occupational Specificity—A Propensity Score Matching Approach. Soc. Sci. Res. 2018, 74, 45–61. [Google Scholar] [CrossRef] [PubMed]
  58. Murphy, G.B.; Trailer, J.W.; Hill, R.C. Measuring Performance in Entrepreneurship Research. J. Bus. Res. 1996, 36, 15–23. [Google Scholar] [CrossRef]
  59. Rastogi, P.N. The Nature and Role of IC. J. Intellect. Cap. 2003, 4, 227–248. [Google Scholar] [CrossRef]
  60. Moen, O.; Heggeseth, A.G.; Lome, O. The Positive Effect of Motivation and International Orientation on SME Growth. J. Small Bus. Manag. 2016, 54, 659–678. [Google Scholar] [CrossRef]
  61. Delmar, F.; Davidsson, P.; Gartner, W.B. Arriving at the High-growth Firm. J. Bus. Ventur. 2003, 18, 189–216. [Google Scholar] [CrossRef] [Green Version]
  62. David, O.; Cyrus, M.I.; Winnie, L.N. Corporate Governance, Capital Structure, Ownership Structure, And Corporate Value Of Companies Listed At The Nairobi Securities Exchange. Eur. Sci. J. ESJ 2021, 17, 300–334. [Google Scholar] [CrossRef]
  63. Temel, S.; Forsman, H. Growth and Innovation during Economic Shocks: A Case Study for Characterising Growing Small Firms. Scand. J. Manag. 2022, 38, 101220. [Google Scholar] [CrossRef]
  64. Brealey, R.A.; Myers, S.C. Principles of Corporate Finance; McGraw-Hill Companies: New York, NY, USA, 2009; Volume 8. [Google Scholar]
  65. Berger, A.N.; Miller, N.H.; Petersen, M.A.; Rajan, R.G.; Stein, J.C. Does Function Follow Organizational Form? Evidence from the Lending Practices of Large and Small Banks. J. Financ. Econ. 2005, 76, 237–269. [Google Scholar] [CrossRef] [Green Version]
  66. Qi, Y.; Du, B.; Wen, X. Mission Embeddedness and Pattern Selection of Digital Strategic Transformation of SOEs: A Case Study Based on the Typical Practice of Digitalization in Three Central Enterprises. Manag. World 2021, 37, 137–158. [Google Scholar] [CrossRef]
  67. Xi, J. Speech at Private Enterprise Forum. Official Website of the Chinese Government. 2018. Available online: http://www.gov.cn/xinwen/2018-11/01/content_5336616.htm (accessed on 1 November 2018).
  68. Sheng, L.; ZHeng, X.; Zhou, P.; Li, T. Analysis on the Reasons for the Widening Gap between North and South in China’s Economic Development. Manag. World 2018, 34, 16–24. [Google Scholar] [CrossRef]
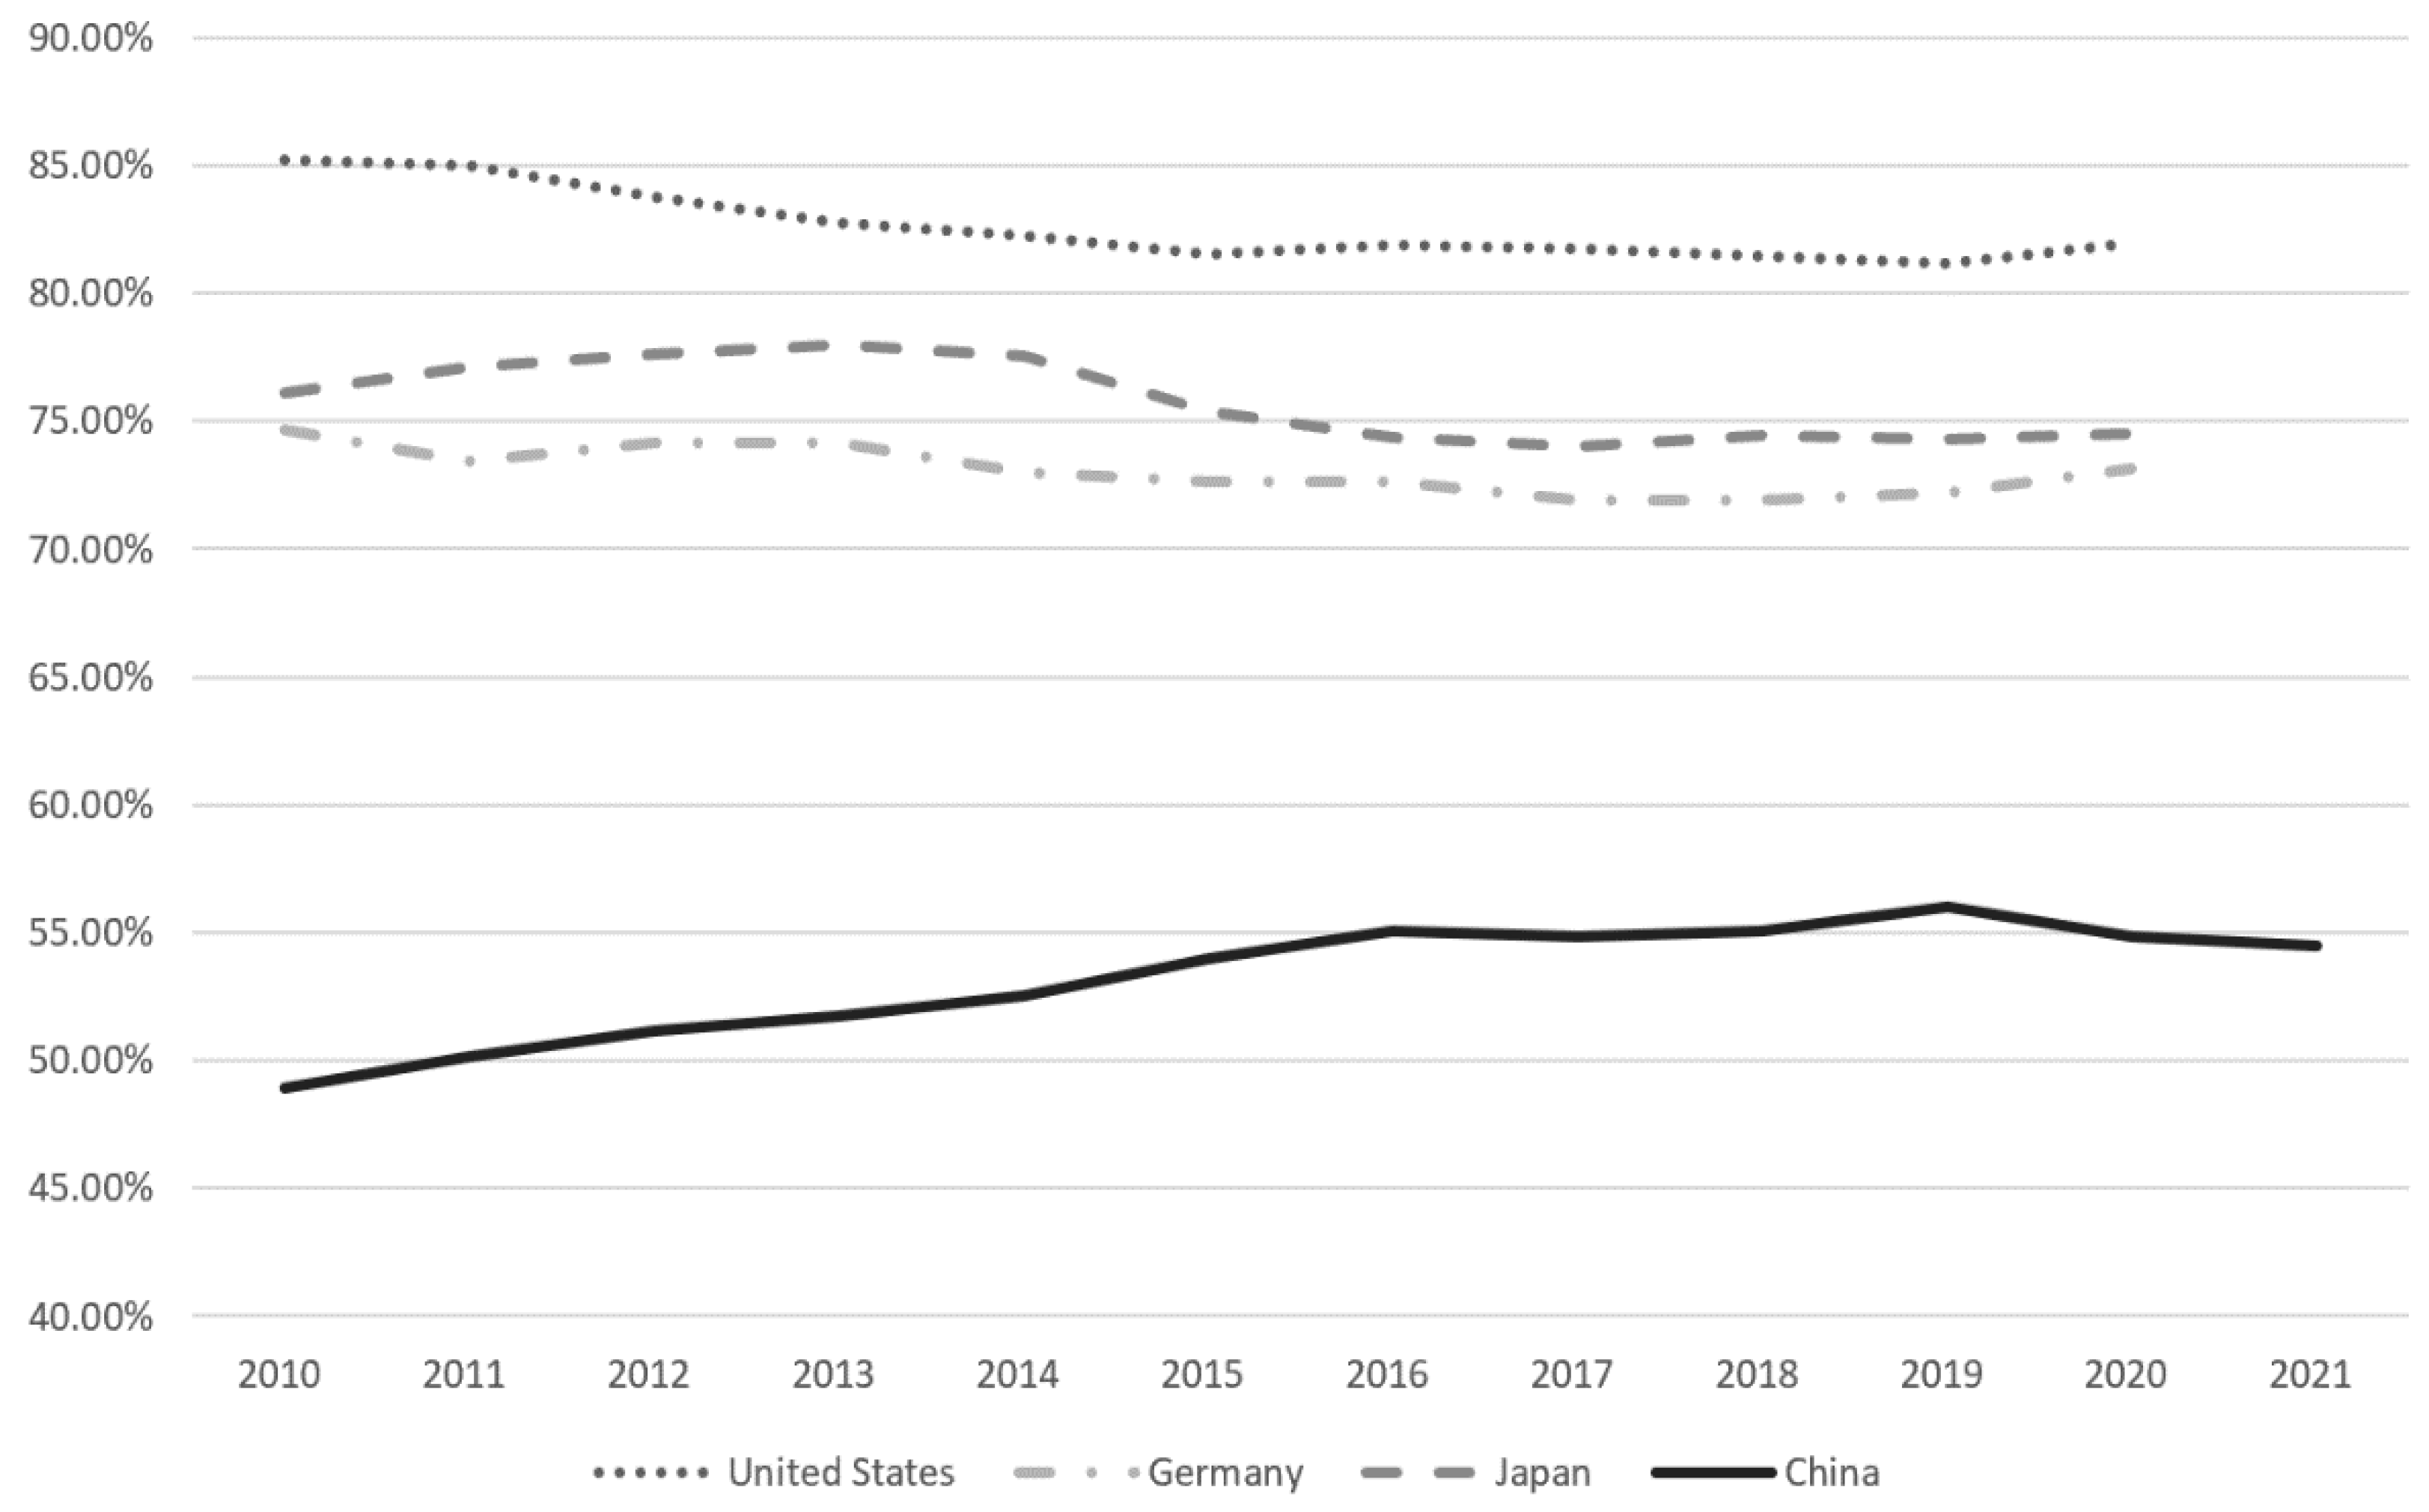
Figure 1. Comparison of international final consumption rates (2010–2021). (Data source: World Bank, Wind database).
Sustainability 14 13394 g001
Figure 2. Financing overview of China’s new consumption field (2021). (Data source: ITjuzi, public reports).
Sustainability 14 13394 g002
Figure 3. Proportion of the value added of China’s cultural creativity and the related industries in GDP (2015–2019). (Data source: National Bureau of Statistics).
Sustainability 14 13394 g003
Figure 4. Parallel trend test on the current growth of enterprises.
Sustainability 14 13394 g004
Figure 5. Parallel trend test on the growth potential of enterprises.
Sustainability 14 13394 g005
Table 1. Descriptive statistical results of major variables.
VariablesObs.MeanMedianSDMinimumMaximum
Growth15190.13510.09290.3514−0.94173.2350
Value15194.13244.04780.88982.25798.6152
PVGO15190.16620.35620.6743−4.14950.9526
Size15193.67563.60340.96551.48897.1814
Leverage15190.41510.40510.19140.00801.2019
Return15190.05920.06380.1703−1.73112.1559
Lage15192.96992.99570.29431.38633.7377
Tax15190.17720.16190.2392−2.71146.0774
GDP15190.08790.08920.0453−0.27960.2798
Lrevenue15198.43908.57580.64635.37359.5542
Table 2. Sample enterprises’ growth indicators before and after the Guidelines were announced.
Variables Before 2016After 2016MeanDiff
Obs.MeanSDObs.MeanSD
TreatmentGrowth3040.04510.18334560.14920.28540.1041 ***
Value3043.99510.84964564.42391.03680.4288 ***
PVGO3040.34950.47134560.08010.7994−0.2694 ***
ControlGrowth3040.26990.50394560.09130.3458−0.1786 ***
Value3043.88260.77504564.09980.74030.2172 ***
PVGO3040.34310.47934560.01210.7097−0.3310 ***
Note: MeanDiff is the mean difference; *** means significant at 1%.
Table 3. Financial support policies and the growth of new consumer enterprise.
Variables(1)(2)(3)
GrowthValuePVGO
Test × Policy0.2736 ***
(0.0348)
0.1444 ***
(0.0358)
0.0878 **
(0.0375)
Size0.0111
(0.0273)
0.5794 ***
(0.0281)
−0.3869 ***
(0.0294)
Leverage0.1761 *
(0.0904)
−0.7286 ***
(0.0931)
−0.7053 ***
(0.0974)
Return0.3276 ***
(0.0597)
0.3042 ***
(0.0616)
0.2558 ***
(0.0644)
Lage0.0708
(0.2155)
1.3582 ***
(0.2220)
1.3757 ***
(0.2323)
Tax−0.0316
(0.0397)
−0.0349
(0.0409)
−0.0978 *
(0.0428)
GDP−0.1889
(0.2571)
0.2770
(0.2649)
0.1706
(0.2772)
Lrevenue−0.1312
(0.0742)
−0.1203
(0.0764)
0.0092
(0.0800)
Constant0.8389
(0.8999)
−0.7929
(0.9272)
−2.3209 **
(0.9702)
Obs.151915191519
R-squared0.21840.87060.7532
Note: the fixed effects of individual enterprise and year were in control in all regressions; the standard deviations of regression coefficients are in parentheses; *, **, and *** refer to significance at 10%, 5%, and 1%, respectively. Similarly, hereinafter.
Table 4. Financial support policies and the growth of new consumer enterprise assessed on the basis of credit guidance effect.
Variables(1)(2)(3)
GrowthValuePVGO
Test × Policy × Debt0.1008 *
(0.0100)
0.0035 ***
(0.0011)
0.0053 ***
(0.0011)
Debt−0.0012
(0.0011)
−0.0031 ***
(0.0012)
−0.0085 ***
(0.0012)
Test × Policy0.2612 ***
(0.0391)
0.0830 **
(0.0402)
0.0101
(0.0412)
Size0.0276
(0.0309)
0.5962 ***
(0.0317)
−0.2654 ***
(0.0326)
Leverage0.2027 **
(0.0935)
−0.6689 ***
(0.0960)
−0.5189 ***
(0.0986)
Return0.3227 ***
(0.0599)
0.3061 ***
(0.0616)
0.2179 ***
(0.0632)
Lage0.0360
(0.2177)
1.3093 ***
(0.2234)
1.1232 ***
(0.2294)
Tax−0.0303
(0.0397)
−0.0343
(0.0407)
−0.0887 **
(0.0418)
GDP−0.1916
(0.2572)
0.2617
(0.2640)
0.1544
(0.2711)
Lrevenue−0.1317 *
(0.0743)
−0.1301 *
(0.0762)
0.0082
(0.0783)
Constant0.8917
(0.9020)
−0.6082
(0.9259)
−1.9681 **
(0.9508)
Obs.151915191519
R-squared0.21920.87170.7643
Note: *, **, and *** refer to significance at 10%, 5%, and 1%, respectively.
Table 5. Financial support policies and the growth of new consumer enterprise of different ownerships.
VariablesState-OwnedNon-State-Owned
(1)(2)(3)(4)(5)(6)
GrowthValuePVGOGrowthValuePVGO
Test × Policy0.2636 ***
(0.0490)
0.0798
(0.0598)
−0.0037
(0.0645)
0.2719 ***
(0.0508)
0.1987 ***
(0.0455)
0.1849 ***
(0.0467)
Size−0.0093
(0.0359)
0.5393 ***
(0.0438)
−0.3720 ***
(0.0472)
0.0170
(0.0408)
0.6134 ***
(0.0368)
−0.4085 ***
(0.0378)
Leverage0.0812
(0.1293)
−0.7956 ***
(0.1577)
−0.7787 ***
(0.1701)
0.2714 **
(0.1304)
−0.7902 ***
(0.1177)
−0.7167 ***
(0.1207)
Return0.4508 ***
(0.1157)
0.7073 ***
(0.1411)
0.4905 ***
(0.1522)
0.3130 ***
(0.0737)
0.1784 ***
(0.0665)
0.1920 ***
(0.0682)
Lage0.0014
(0.3103)
1.2169 ***
(0.3783)
0.9070 **
(0.4080)
0.1396
(0.3030)
1.4786 ***
(0.2734)
1.7933 ***
(0.2805)
Tax−0.0547
(0.0466)
0.0056
(0.0569)
−0.0743
(0.0613)
−0.0035
(0.0661)
−0.0724
(0.0597)
−0.1298 **
(0.0612)
GDP−0.3386
(0.3414)
0.0841
(0.4163)
−0.0539
(0.4489)
−0.0409
(0.3762)
0.3270
(0.3395)
0.3073
(0.3483)
Lrevenue−0.0714
(0.0817)
−0.2307 **
(0.0996)
−0.1347
(0.1074)
−0.2146
(0.1406)
0.1048
(0.1269)
0.2692
(0.1302)
Constant0.6246
(1.1547)
0.7340
(1.4080)
0.2703
(1.5184)
1.3147
(1.5101)
−3.1747 **
(1.3626)
−5.7151 ***
(1.3979)
Obs.640640640879879879
R-squared0.22740.86610.77260.22320.87690.7404
Note: ** and *** refer to significance at 5% and 1%, respectively.
Table 6. Financial support policies and the growth of new consumer enterprises in different regions.
VariablesSouthern RegionNorthern Region
(1)(2)(3)(4)(5)(6)
GrowthValuePVGOGrowthValuePVGO
Test × Policy0.2689 ***
(0.0609)
0.1282 ***
(0.0410)
0.0804 *
(0.0446)
0.3169 ***
(0.0681)
0.2475 ***
(0.0777)
0.1707 **
(0.0704)
Size0.0025
(0.0322)
0.5772 ***
(0.0322)
−0.4263 ***
(0.0351)
0.0554
(0.0530)
0.5958 ***
(0.0605)
−0.2719 ***
(0.0548)
Leverage0.1810 *
(0.1068)
−0.7940 ***
(0.1069)
−0.7606 ***
(0.1165)
0.1992
(0.1781)
−0.5446 ***
(0.2032)
−0.6874 ***
(0.1841)
Return0.3197 ***
(0.0673)
0.2915 ***
(0.0673)
0.2864 ***
(0.0733)
0.3291 **
(0.1323)
0.4047 ***
(0.1509)
0.2318 *
(0.1368)
Lage0.1879
(0.2774)
1.8176 ***
(0.2778)
1.8742 ***
(0.3025)
−0.2451
(0.3374)
0.4703
(0.3849)
0.3969
(0.3489)
Tax−0.0433
(0.0422)
−0.0299
(0.0422)
−0.0716
(0.0460)
0.1351
(0.1286)
−0.1183
(0.1466)
−0.3595 ***
(0.1329)
GDP−0.1379
(0.4818)
0.2952
(0.4824)
0.2813
(0.5253)
0.0658
(0.3415)
0.3324
(0.3896)
0.0909
(0.3531)
Lrevenue−0.0554
(0.0989)
−0.0147
(0.0990)
0.0682
(0.1078)
−0.3995 ***
(0.1235)
−0.2824 **
(0.1409)
−0.0241
(0.1277)
Constant−0.1045
(1.1641)
−3.0130 ***
(1.1656)
−4.1579 ***
(1.2692)
3.6853 **
(1.4717)
3.0089 **
(1.6788)
0.4790
(1.5216)
Obs.113911391139380380380
R-squared0.22960.86640.75860.24440.88510.7569
Note: *, **, and *** refer to significance at 10%, 5%, and 1%, respectively.
Table 7. The difference test of regression coefficients.
RegionsGrowthValuePVGO
Southern region0.26890.12820.0804
Northern region0.31690.24750.1707
Chi-squared test statistics2.42 *2.44 *4.76 **
Note: * and ** refer to significance at 10% and 5% respectively.
Table 8. Empirical results of introducing regional dummy variable and cross term.
Variables(1)(2)(3)
GrowthValuePVGO
Test × Policy × North0.0361 *
(0.0984)
0.0439 *
(0.0829)
0.0777 *
(0.0674)
North−0.0134
(0.0256)
−0.0098
(0.0408)
0.0107
(0.0333)
Test × Policy0.0360 *
(0.0236)
0.0831 **
(0.0402)
0.0272 *
(0.0391)
ControlsYesYesYes
Note: * and ** refer to significance at 10% and 5% respectively.
Publisher’s Note: MDPI stays neutral with regard to jurisdictional claims in published maps and institutional affiliations.