Article

The Influence of Shield Tunneling Characteristics on the Safety of Buildings Above-Case Study for Shanghai Zone

1
School of Civil Engineering, Central South University, Changsha 410075, China
2
Guangxi Xinfazhan Communications Group Co., Ltd., Nanning 530029, China
3
School of Civil Engineering and Architecture, Guangxi University, Nanning 530004, China
*
Author to whom correspondence should be addressed.
Sustainability 2022, 14(20), 13391; https://doi.org/10.3390/su142013391
Submission received: 5 September 2022 / Revised: 30 September 2022 / Accepted: 7 October 2022 / Published: 17 October 2022
(This article belongs to the Special Issue The Development of Underground Projects in Urban Areas)

Abstract

:
The disturbance effect of the shield tunneling process in the soft soil layer on the buildings above the subway tunnel is evident. Studying the spatial position effect of shield tunneling on the buildings above it is crucial for the safety of buildings and for the formulation of reasonable protection measures. Based on the typical soft soil layer in Shanghai, China, this study used Plaxis 3D for the precise simulation of the process of a shield tunnel passing through different spatial positions underneath the buildings above it. Considering the influence of the tunnel position (L), the buried depth (H), and the horizontal distance (D), the law of variation of surface settlement and the internal force and deformation law of overlying buildings during shield tunneling were discussed. The change of the building’s axial force was mainly reflected in the building slab structure, and the change of the shear force and the bending moment was mainly reflected in the building column structure. The box foundation of the buildings played an important role in resisting the influence of shield tunneling. Based on the composite criterion and the strength reduction method, the influence range of the shield tunneling on buildings in the soft soil layer was studied. The variation law of the safety factor of surrounding concrete lining, with or without the building load, was obtained. The influence of the building load on the tunnel construction was reflected by the relative ratio ξ of the safety factor in this case. The inflection point of the ξ curve and ξ = 95% was taken as the boundary of the affected areas that were divided into strong affected areas, weak affected areas, and areas which were not affected.

1. Introduction

Some of the characteristics of soft soil are remarkable structure, low strength, large water content, high compressibility, and large void ratio, and because of these characteristics, soft soil can be easily disturbed and damaged during shield tunneling, which can lead to irregular settlement, inclination, and cracking of the buildings located above the tunneling location. Therefore, the spatial position of the tunneling shield in the soft soil layer needs to be considered in order to reduce the disturbance effect it has on the surrounding environment. In addition, different spatial relationships between the tunneling shield and the buildings located above it lead to different degrees of the disturbance effect [1]. The influence zoning method is adopted in order to determine the influence degree of shield construction disturbance on the surrounding environment. On the one hand, this method can predict the impact tunnel construction has on buildings, and on the other hand, the people utilizing this method can take corresponding protective measures to reduce the damage to buildings caused by the tunnel construction. Soft soil is widely distributed in coastal areas of China, and the spatial effect of shield tunneling in the soft soil layer can very easily lead to endangerment of the safety of the buildings situated above. Therefore, it is necessary to study the impact shield tunneling spatial effect has on the surface and buildings in typical soft soil strata, so as to predict the safety of buildings and formulate reasonable protection measures.
Many scholars and technicians have carried out research regarding the disturbance effect shield tunneling has on the surface and buildings in soft soil layer areas, which range from theoretical analysis and indoor model tests, to numerical simulations. In terms of theoretical analysis, the Peck formula [2], mirror image method [3,4], Mindlin solution [5,6], Verruijt and Booker solution [7], beam theory on elastic foundation [8], and displacement superposition method [9] have been applied to the prediction of the settlement deformation. However, most theoretical analytical methods are based on many basic mechanical assumptions, and as most assumptions are ideal, these methods cannot reflect the realistic dynamic response process of shield tunneling. The indoor test model method can better reflect the variation law of the disturbance, but the scale test is not centrifuged, so it is difficult to select an appropriate soil model to make all soil parameters meet the similarity law, along with the indoor model test cycle being long and the cost of the test being expensive [10,11]. The numerical method can simulate various complex working conditions, it has a strong nonlinear analysis ability, and it can obtain more reliable calculation results in a short time and dynamically reflect the construction process. Therefore, the numerical simulation method is widely used to simulate the shield construction process in various complex environments, such as short-distance parallel shield tunneling undercrossing existing tunnels [12], shield tunneling undercrossing with oblique angle [13], shield tunnel construction in karst areas [14], shield tunnel construction in saturated soft soil [15], and the effect shield construction has on surrounding buildings [16]. In addition, at present, research on the disturbance effect of shield tunneling on overlying buildings in the soft soil layer mainly focuses on analysis of the displacement law of the surrounding soil and the settlement law of buildings [17,18]. The internal force of the building, the inclination of the building, and the influence range of tunnel excavation on the buildings in the soft soil layer are rarely considered. In order to ensure the safety of buildings, and better describe the interaction between the tunnel, soft soil, and surrounding buildings, it is of utmost importance to study these problems.
The zoning of the disturbances caused by shield construction is one of the best ways to conduct construction safety. At present, there are many theories about the zoning of the disturbances caused by shield construction, such as the plastic zoning theory, displacement criterion, strength criterion, composite criterion, etc. [19]. However, the utility of these methods is completely limited. The plastic zoning theory assumes that the disturbance range of the tunnel is twice the size of the tunnel radius and that the boundary of the influence zoning range is set outside the disturbance region of the tunnel. This assumption is unrealistic. The displacement criterion is applicable to the zoning of the influence of the tunnel excavation on the deformation of a single pile of buildings with a pile foundation. The strength criterion is applicable to the impact zoning of a double tunnel or adjacent tunnel construction. The composite criterion divides the affected area of the project according to the value of the principal stress of the surrounding clay, the change rate of the displacement of the surrounding clay, and the stress characteristics corresponding to the various mechanical models of proximity construction. It can be concluded that the stability of the surrounding clay is closely related to the changing trend of the displacement rate. Therefore, the composite criterion was used for the analysis of influence zoning in this paper.
This paper studied the spatial disturbance effect of a shield tunnel passing underneath buildings at different spatial positions and its safety impact on the buildings above, as exemplified in the typical soft soil stratum in Shanghai. As a way of dealing with some of the shortcomings mentioned above, a numerical model of the construction process of a shield tunnel passing underneath buildings was constructed. The variation laws of the surface settlement, building deformation, and internal force induced by shield tunneling underneath overlying buildings at different spatial positions were studied. Moreover, the composite zoning standard was adopted to study the safety impact zoning of typical soft soil areas, and the relative ratio of safety factors ξ with and without building loads was adopted to reflect the impact of tunnel construction on buildings. Subsequently, the safety impact areas of buildings on different floors were quantified and compared.

2. Numerical Simulation

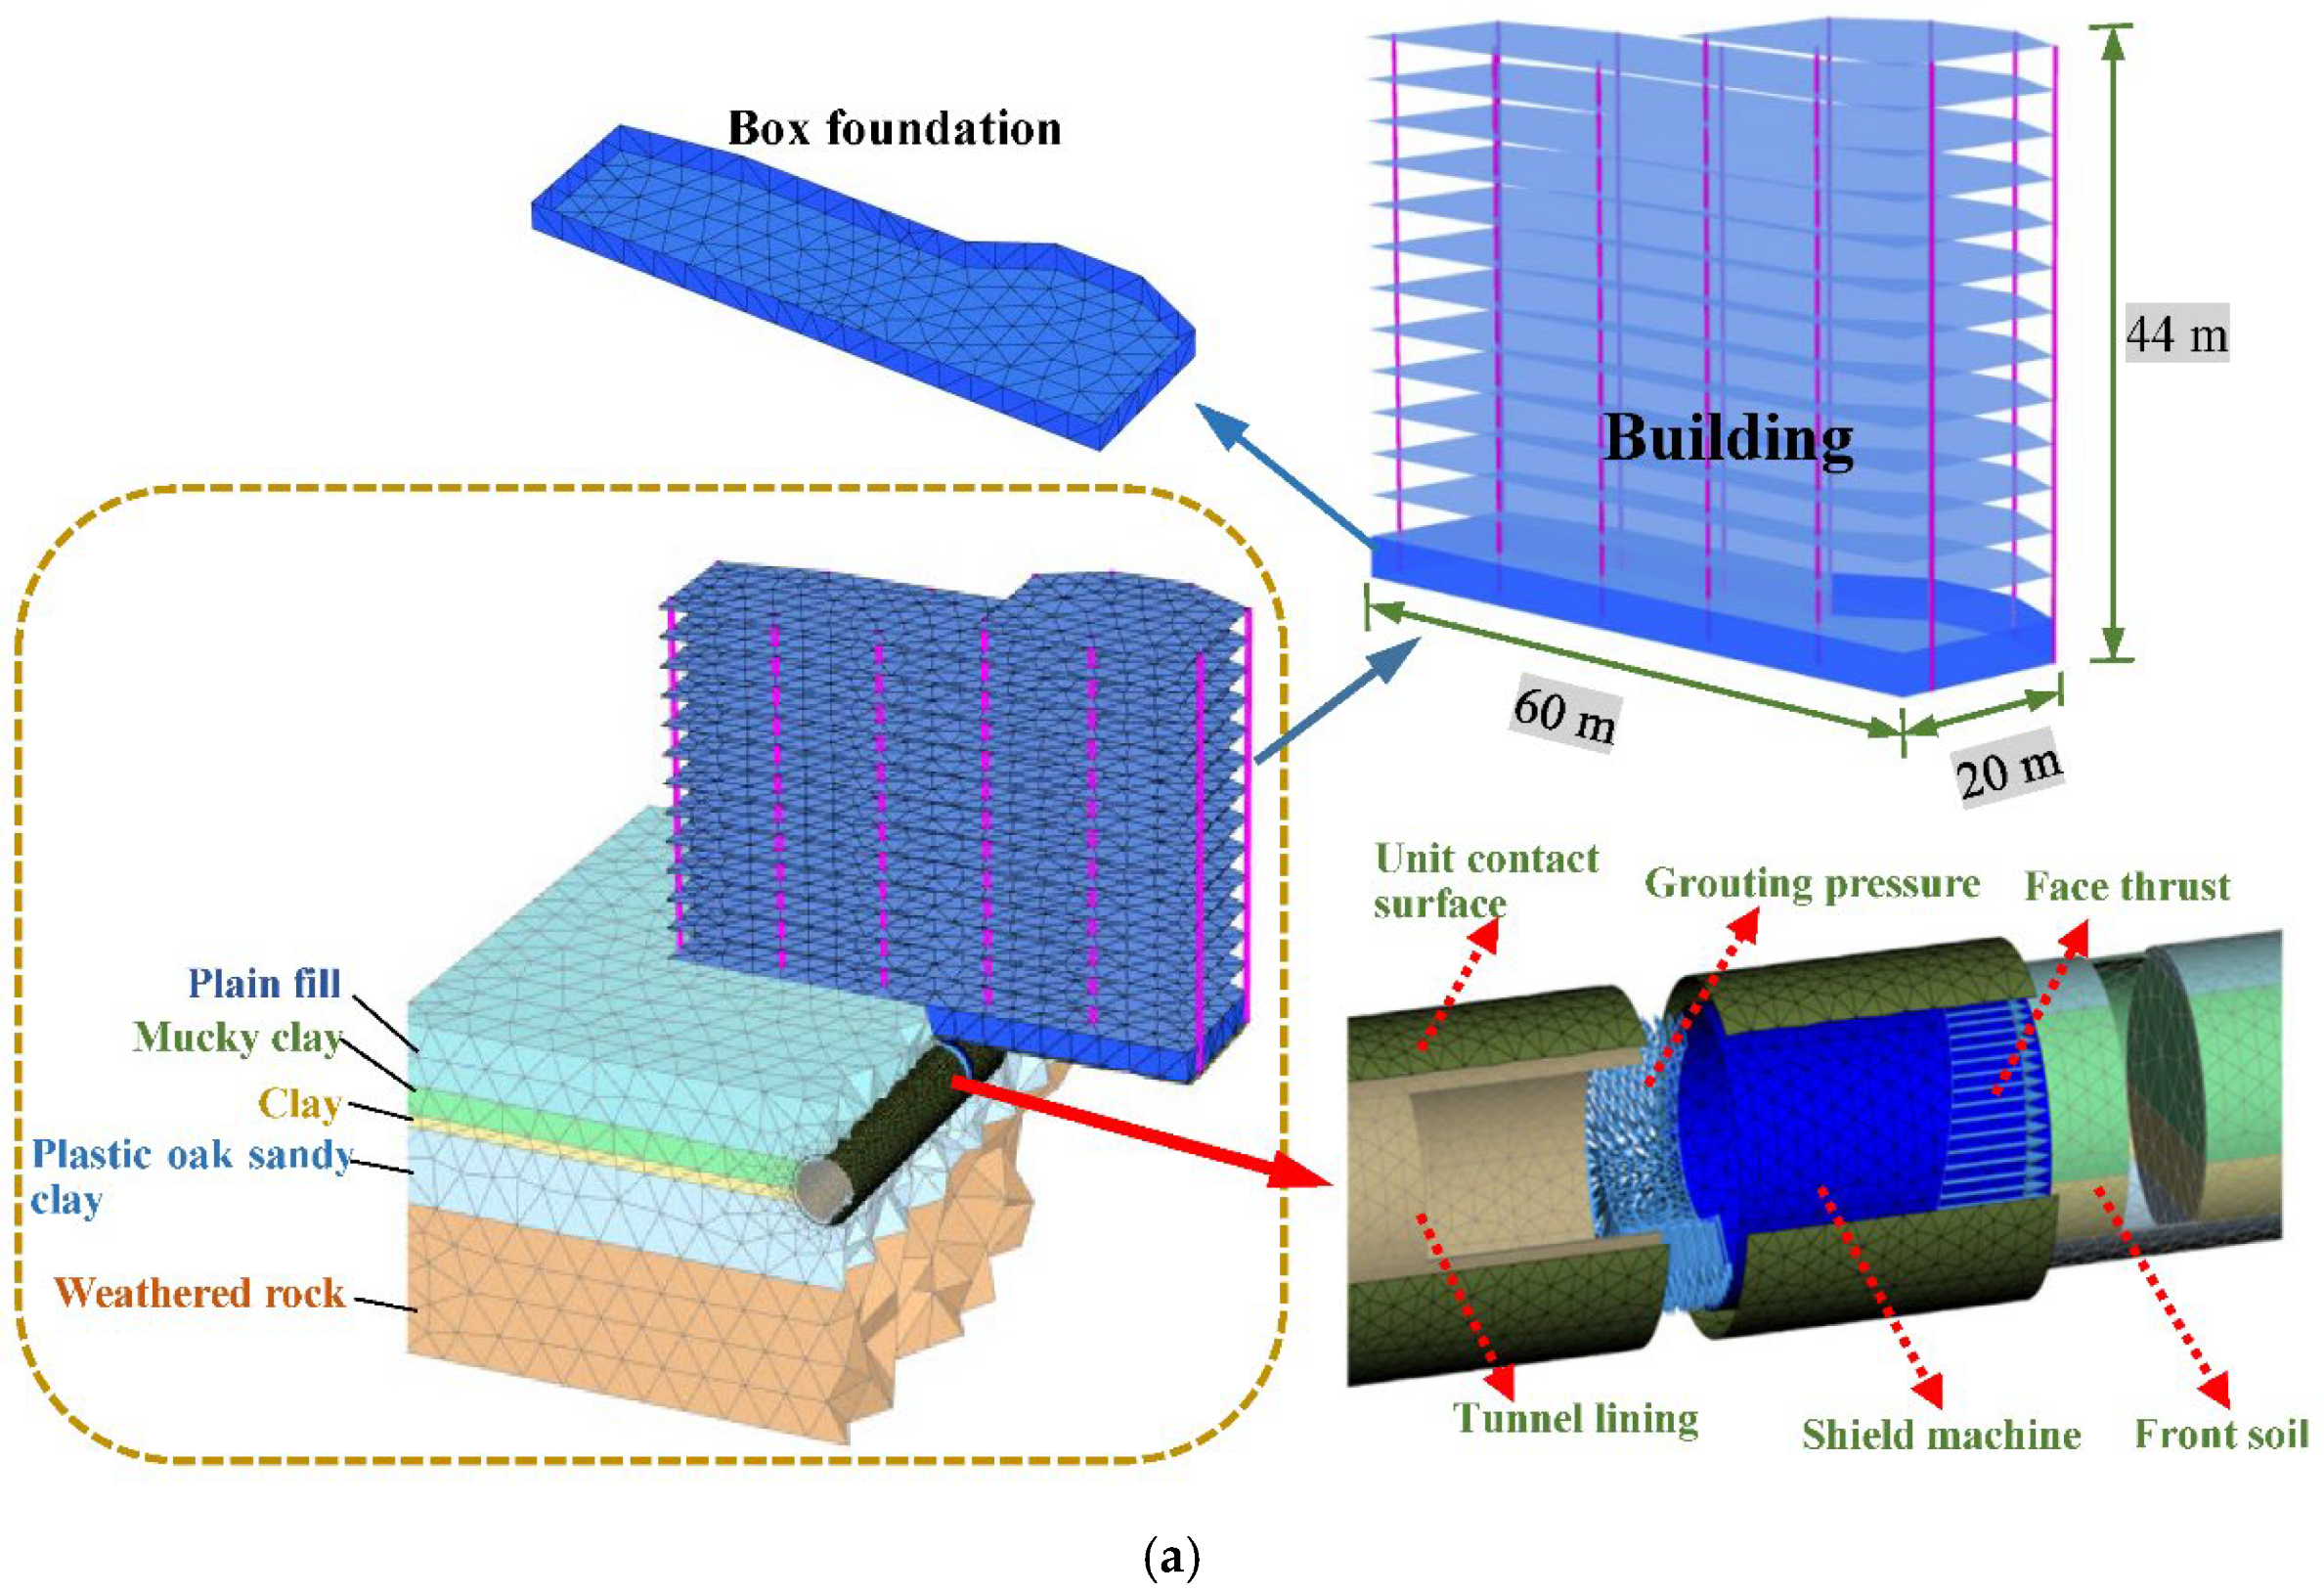
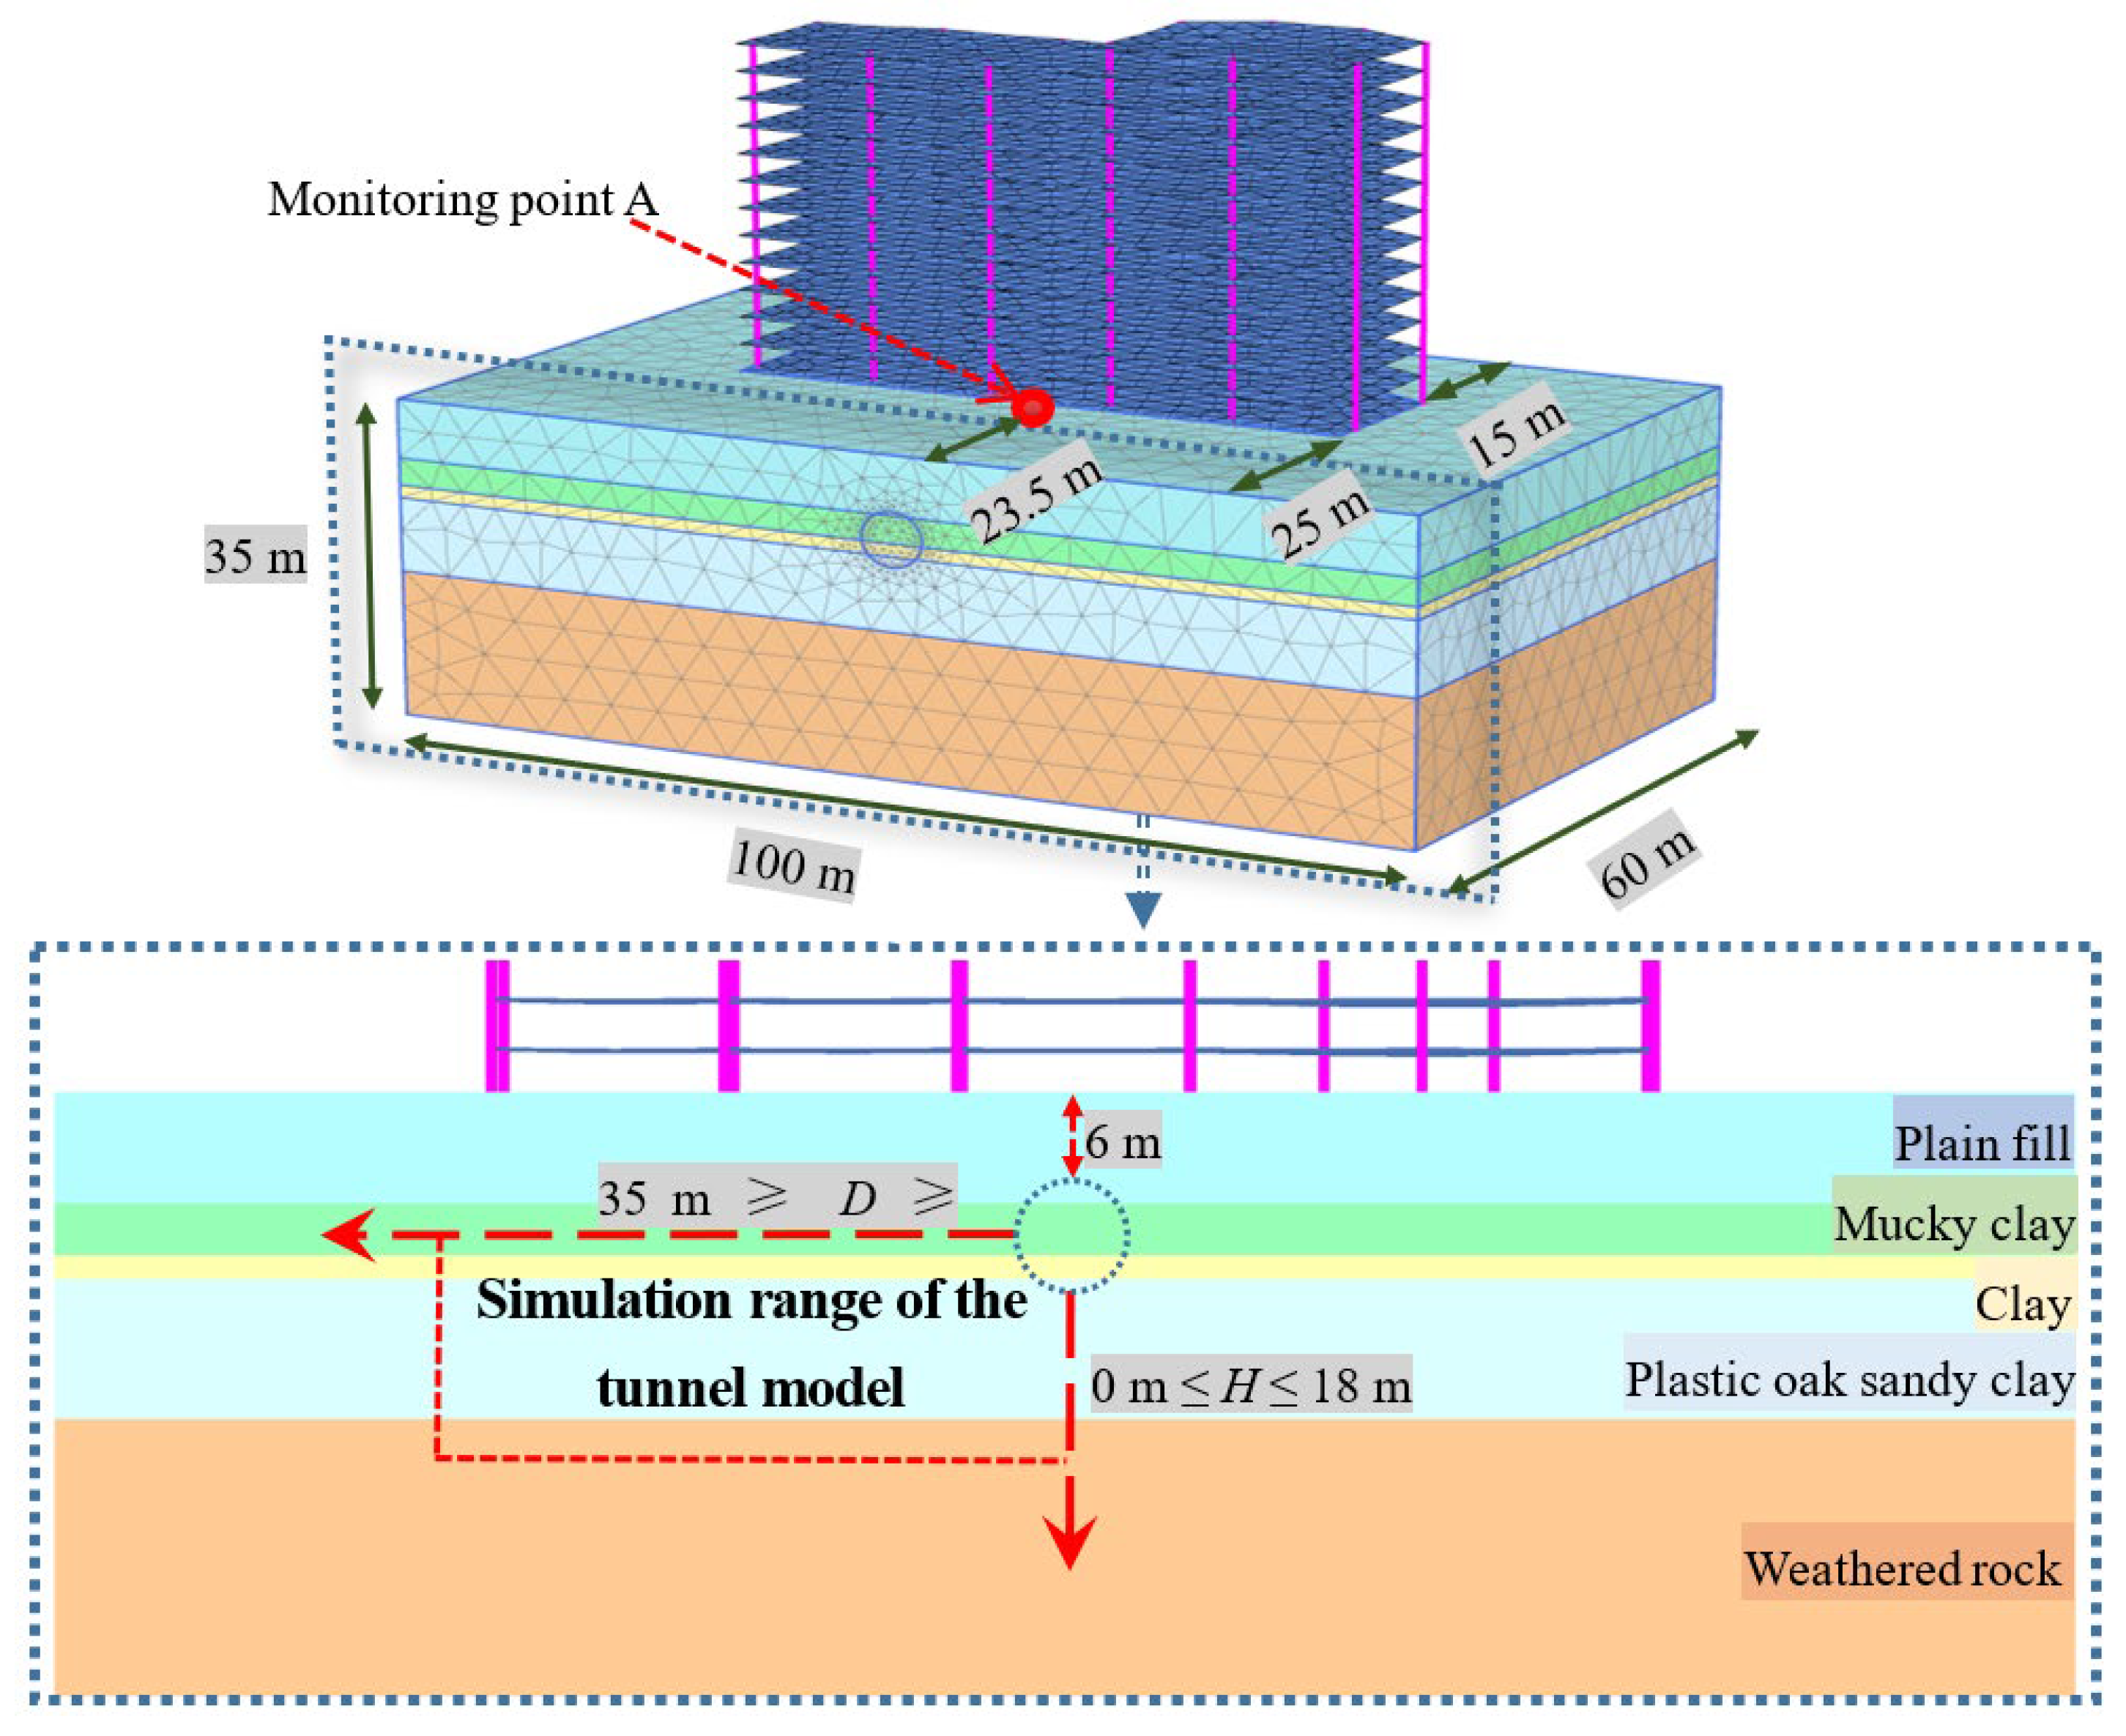
2.1. Numerical Model

Finite element software Plaxis was used for modeling and analysis (Figure 1a). The upper building is a 13-story slab column structure system, measuring 44 m in height, 60 m in length, and 20 m in width. The foundation type of the building is box foundation, and the foundation bottom elevation is 3 m underground. The diameter of the tunnel is 6 m (d = 6 m). Normal constraints were set at the side boundary of the model, and fixed constraints were set at the bottom boundary. Soils were simulated by a 10-node high-order tetrahedral solid element, and the lining and the shield shell were simulated by a plate element. The building frame structure was simulated by a plate element and a beam element. A contact interface was set between the lining, shield plate, building foundation, and adjacent soil. The ground loss rate caused by the shield was taken as 0.8% [20]. The steps of the simulation of the shield tunneling process are shown in Figure 1b.

2.2. Material Parameters

The formation parameters, alongside the typical soft soil layer in Shanghai [21,22,23], are shown in Table 1, and the material parameters are shown in Table 2.

2.3. Simulation Scheme

The geometric model of the tunnel is divided into several construction sections along the tunnel axis in order to reflect the construction process of the shield. The length of each section is 2 m and the shield machine drives from the front to the end of the layer model. The surface settlement monitoring point A is set at the horizontal distance of 23.5 m in front of the building model. The buried depths of the shield tunnel are 6, 9, 12, 15, and 18 m, respectively; the horizontal distance D between the center of the tunnel and the center of the building is 0, 5, 10, 15, 20, 25, 30, and 35 m, respectively. The numerical simulation scheme is shown in Figure 2.

2.4. Constitutive Model

The key step of the numerical simulation illustrated in this study is the selection of the constitutive models. In this model, the linear elastic constitutive model is used for the weathered rock, and the mechanical behavior of the surrounding clay in the other layers is described by the hardening constitutive model of soil (HS) [24]. The nature of soft soil largely depends on the region and the origin, which leads to differences between soft soil. This also means that a general constitutive theory or model cannot be found, and some models and theories must conduct unconventional experiments to obtain the parametric significance of the model. It is precisely because of this disadvantage that the model built in the theory will encounter many problems in practice. At present, it is considered that the parameters of the HS model can be easily obtained through indoor geotechnical tests. The stress-strain curve of the HS model is hyperbolic quadratic linear function. It distinguishes the stiffness difference between first loading, unloading, and reloading. On the other hand, the soil stiffness and the stress level are inseparable, and the HS model can fully consider this dependence. The unloading modulus is also similar to the stress and strain state of the soil in the actual soft soil excavation. In summary, the HS model is more accurate for numerical simulation of shield tunneling in soft soil with sensitive soil loading and unloading characteristics. It has good adaptability for shield tunneling and excavation of covered buildings in simulated soft soil areas. It is also the most widely used constitutive model in the analysis of the soft clay layer. The complete expression of the shear yield surface of the HS model (where compression is taken as positive) [25] is shown in Equation (1):
F SI = 1 E 50 σ 1 σ 3 1 σ 1 σ 3 / q a 2 E ur σ 1 σ 3 γ s p F SII = 1 E 50 σ 1 σ 2 1 σ 1 σ 2 / q a 2 E ur σ 1 σ 2 γ s p F SIII = 1 E 50 σ 2 σ 3 1 σ 2 σ 3 / q a 2 E ur σ 2 σ 3 γ s p
where γ s p is the plastic shear strain produced by the shear yield surface, i.e., the hardening parameters of shear yield surface of the HS model; qa is the ultimate deviatoric stress; and E50 and Eur correspond to the loading secant modulus and the unloading–reloading modulus, respectively, when the confining pressure state is σ3.
E 50 = E 50 ref σ 3 sin ϕ + c cot ϕ σ ref sin ϕ + c cot ϕ m E ur = E ur ref σ 3 sin ϕ + c cot ϕ σ ref sin ϕ + c cot ϕ m
where E 50 r e f and E ur r e f are the reference values of the loading modulus and unloading/reloading modulus under the given confining pressure σref; c is the soil cohesion; φ is the friction angle; and m is the exponential parameter fitted by the triaxial test results.
q a = q f R f = 1 R f c cot ϕ + σ 3 2 sin ϕ 1 sin ϕ
where qf is the ultimate deviatoric stress calculated by the Mohr–Coulomb criterion; and Rf is the failure ratio, reflecting the stress history of the soil.

2.5. Tunnel Face Support Force and Grouting Pressure

2.5.1. Support Force of Tunnel Face

Lv et al. [26] used the three-term coefficient method, which is commonly used in the analysis of the bearing capacity of foundations, in order to examine the ultimate support pressure. Based on the limit equilibrium method, the ultimate support pressure is expressed as the sum of the cohesion multiplied by the influence coefficient, overlying load multiplied by the influence coefficient and soil weight multiplied by the influence coefficient. Under three-dimensional conditions, the ultimate support pressure is expressed as:
σ t = c N c + γ D N γ + q N q
where Nc, Nγ, and Nq are the influence coefficient of soil cohesion c, soil weight γ, and overlying load q on the ultimate support pressure, respectively. The influence coefficient and the internal friction angle φ are related to the buried depth ratio of the tunnel. In order to simplify the calculation, the average values of the cohesion c and the internal friction angle φ of each soil layer are taken as 15 kN·m−2 and 25°, respectively. The load of the overlying buildings is simplified as a uniformly distributed load q = 0.5 MPa. When the buried depth of the tunnel is H = 6 m, H/d = 1, the influence coefficients are Nc = −2, = 0.6, and Nq = 0.2, respectively. When the buried depth of the tunnel is H = 18 m, H/d = 3, the influence coefficients are Nc = −2.5, = 1.5, and Nq = 0.1, respectively [27].
Using the above limit equilibrium method, when the buried depth of the tunnel is H = 6 m, the minimum support reaction force of the tunnel face is 142 kN/m2, and when the buried depth of the tunnel is H = 18 m, the minimum support reaction force of one tunnel face is 192.5 kN/m2. For a more convenient calculation, when the buried depth of the tunnel is H = 6 m, the support force is measured from the top to the bottom of the tunnel face as the load increases at a constant rate from 150 kN/m2 to 240 kN/m2. With the increase in H, the grouting pressure continues to increase, when the buried depth of the tunnel is H = 18 m, the support force of tunnel face is taken as the uniform and rapid increasing load from 260 kN/m2 to 350 kN/m2.

2.5.2. Grouting Pressure

The critical range of the grouting pressure is determined by four aspects: slurry expansion, bolt shear failure, shield tail brush permeability resistance, and soil stability [26]. In this paper, the equivalent load pointing to the outside is used to replace the supporting force provided by the grouting pressure on the surrounding clay, and for this reason, only the critical range of the grouting pressure required for the formation of soil stability is considered. In order to maintain the stability of the layer, the grouting pressure should be greater than the active earth pressure at the grouting hole, and less than the passive earth pressure at the grouting hole. The upper and lower critical values of the grouting pressure to maintain the stratum stability can be expressed as:
P up = γ h tan π 4 + ϕ 2 + 2 c tan π 4 + ϕ 2
P ma = γ h tan π 4 ϕ 2 2 c tan π 4 ϕ 2
where γ is the unit weight of soil mass; h* is the buried depth of grouting hole; and Pup and Pma are the upper and lower critical values of grouting pressure. By taking the average value of the unit weight, cohesion, and internal friction angle of each overlying soil layer into Equations (5) and (6), when the buried depth of the tunnel is H = 6, 9, 12, 15, and 18 m, respectively, the grouting pressure range is 71.43~200.18 kN/m2, 110.39~292.57 kN/m2, 149.36~384.96 kN/m2, 188.32~477.35 kN/m2, and 227.29~569.75 kN/m2, respectively. For the convenience of calculation, when the buried depth of the tunnel is H = 6, 9, 12, 15, and 18 m, respectively, the grouting pressure of tunnel vault is 120 kN/m2, 160 kN/m2, 200 kN/m2, 250 kN/m2, and 300 kN/m2, respectively. With the increase in the buried depth of the grouting point, the load which points vertically to the outside of the tunnel increases at a uniform rate of 15 kN/m2/m.

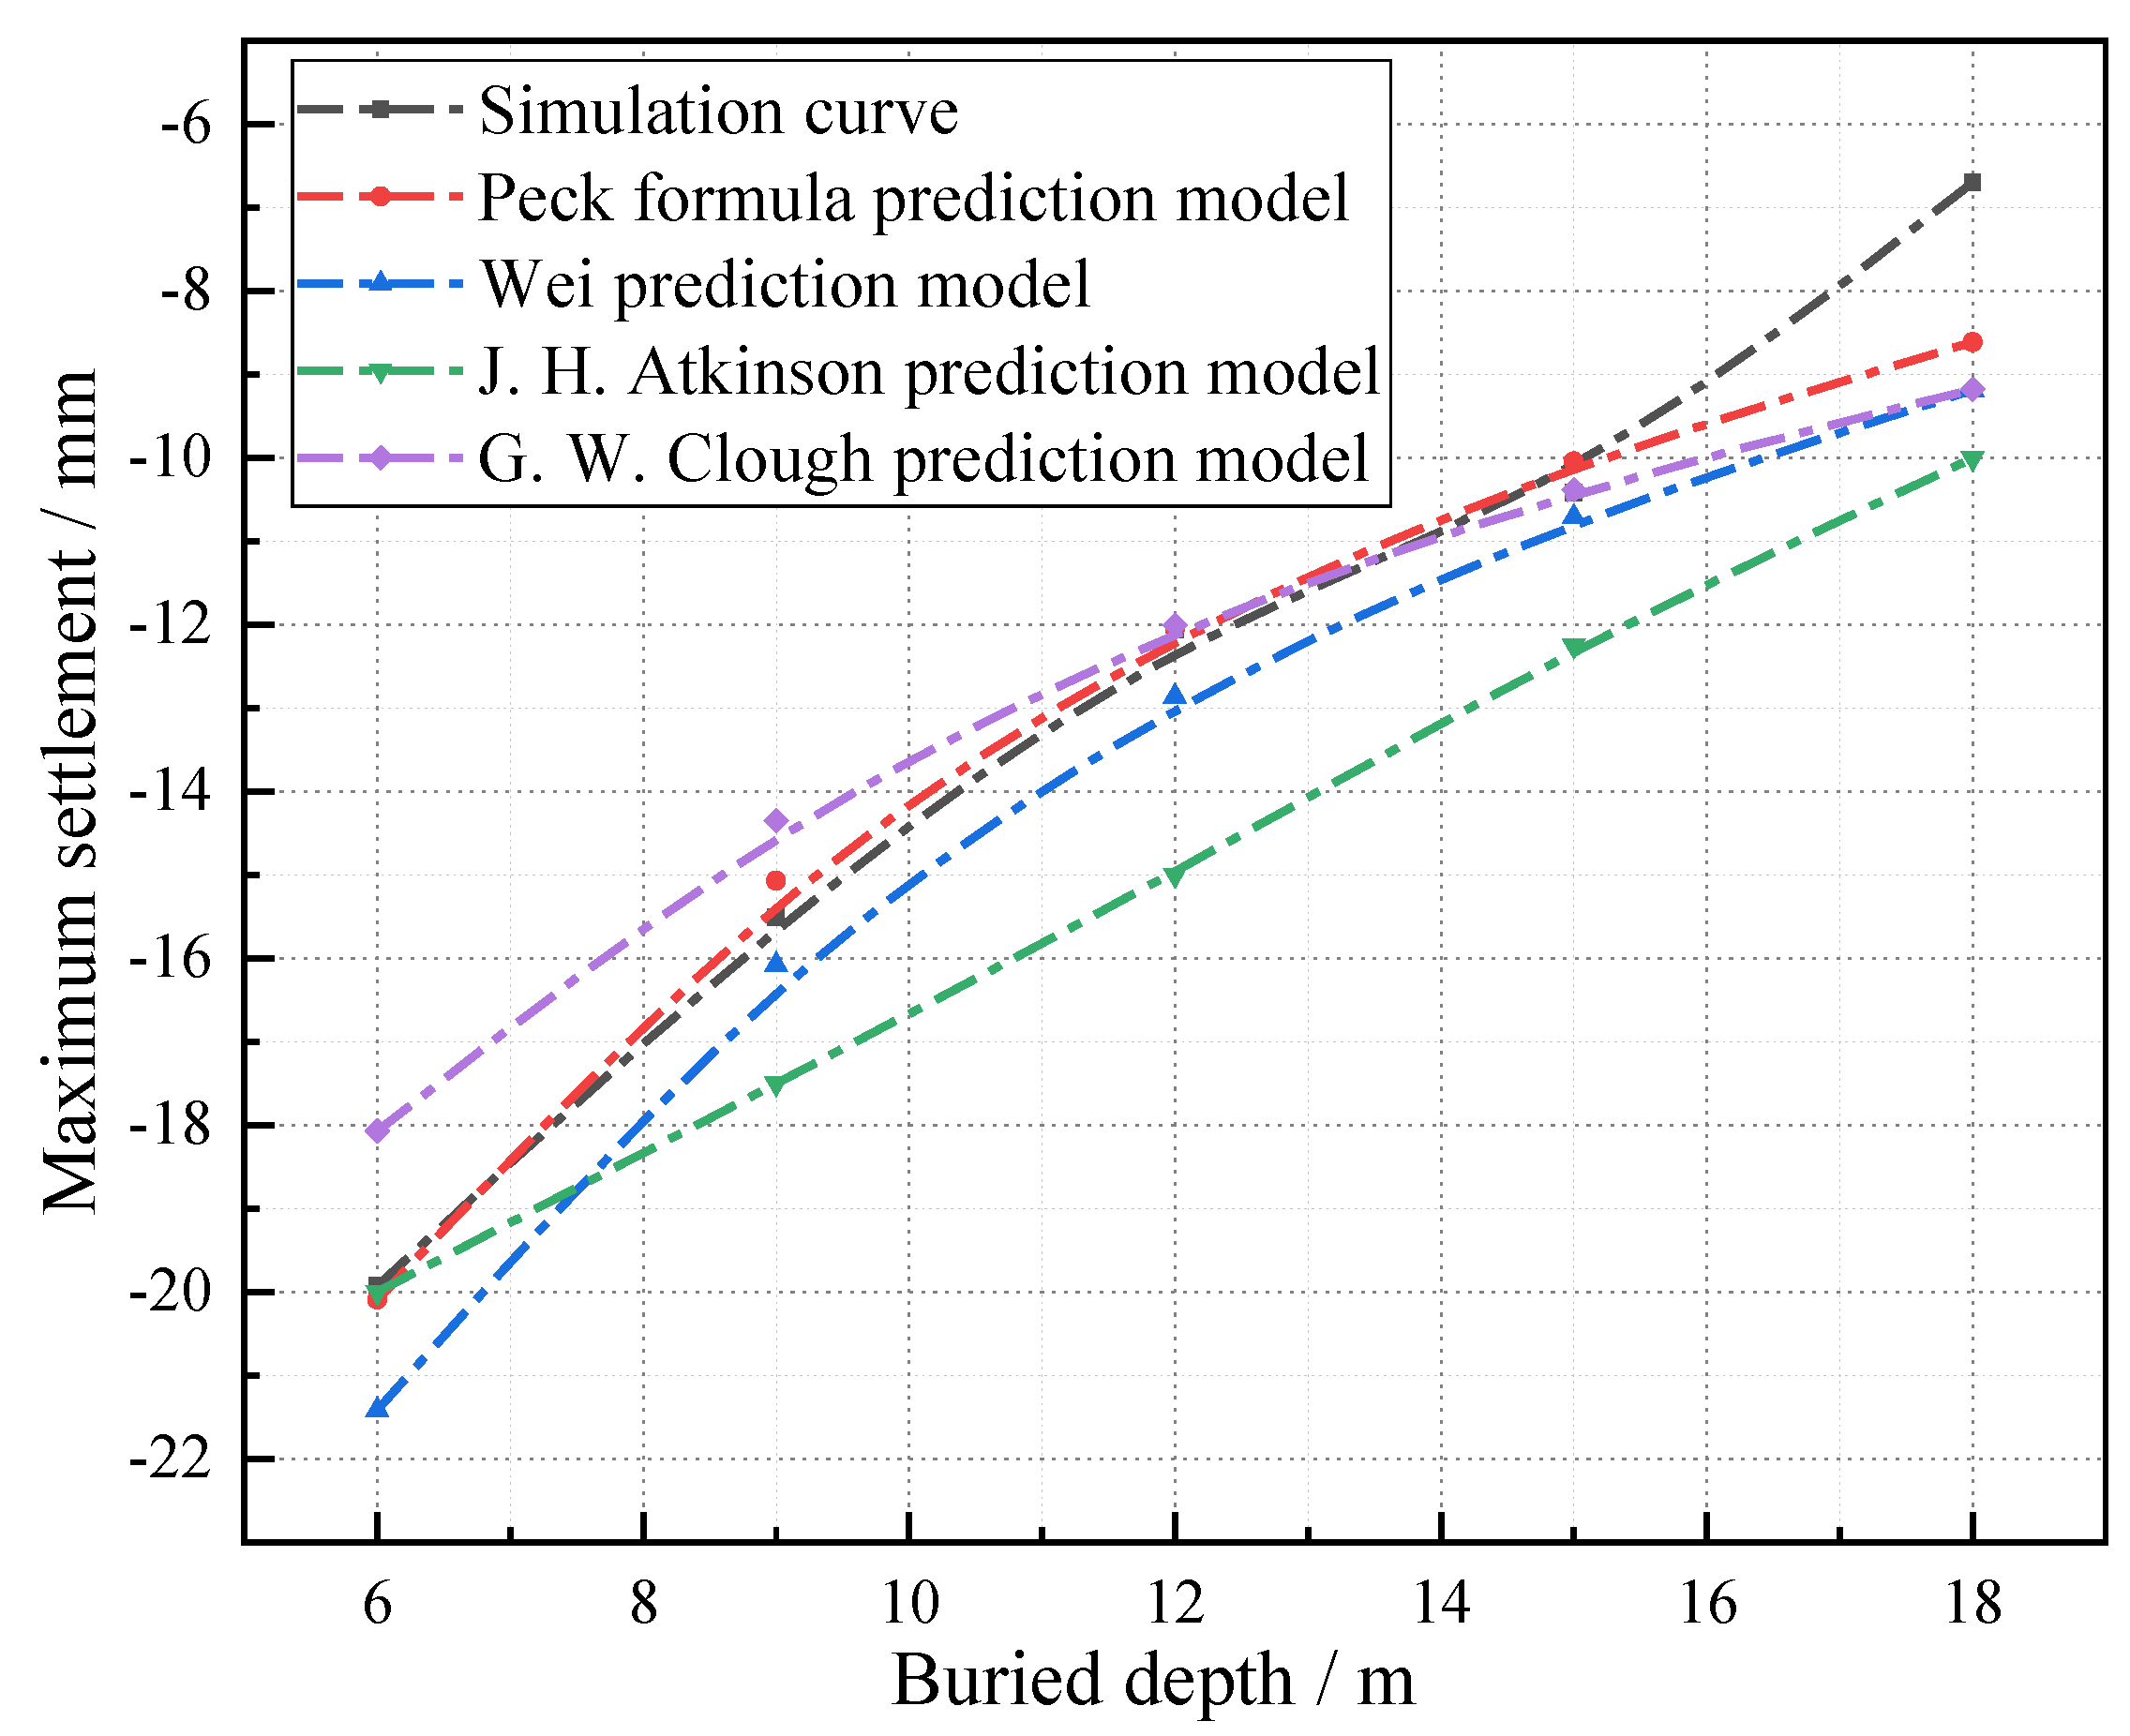
2.6. Model Validation

In order to verify the reliability of the model, the theoretical solution for calculating the settlement was compared with the numerical solution in this paper. Peck [2] thought that the settlement curve approximates to a normal distribution, and deduced the Peck formula which most extensively describes the settlement:
S x = S max exp x 2 / 2 i 2
S max = V s i 2 π = π R 2 V 1 i 2 π
In Equations (7) and (8), S(x) is the value of the settlement of any point on the surface; Smax is the maximum surface settlement, which is located directly above the tunnel axis; x is the horizontal distance between any point on the surface and tunnel axis; i is the width coefficient of the settlement, which is the distance between the tunnel axis and the inflection point of the settlement; Vs is the loss of soil per unit length; V1 is the loss rate of soil, taken as 0.8%; and R is the tunnel radius.
The value of settlement width coefficient i is determined by Equation (9) [27]:
i = R h / 2 R n
where H is the depth measured from the tunnel axis to the ground, n is the coefficient for distinguishing different soil properties, with its value range being 0.8~1.0. The softer the soil, the greater the value of n. The soft soil studied in this paper has the coefficient n of 1.0.
The total gap parameter g in the three-dimensional elastic-plastic soil assumption is used to reflect the loss of soil caused by tunnel excavation and construction [28]. The total gap parameter g is defined as:
g = G p + U3D + w
where Gp is the physical gap (m); U3D is the equivalent three-dimensional radial displacement; and w is the parameter related to the quality of the construction.
Zhu and Li [29] believed that the total clearance parameter can be expressed as:
g = 2 R 1 + V 1 1
According to Equation (11), g = 0.025 m can be obtained. The maximum surface settlement can be deduced through the obtained total clearance parameters and combined with various semi-empirical and semi-numerical methods.
Wei et al. [30] adopted the Boussinesq solution, which entails a placement of a conical load on the surface of the elastic half-space and comprehensively considers the stratum characteristics and shield construction technology in order to obtain the simplified calculation equation of the maximum surface settlement:
S max = 1.4 R S r γ Ing 1 v 2 2 ϕ 2 1 E d H
where R is the outer radius of the tunneling shield and v is the Poisson’s ratio of the soil; Sr is the soil sensitivity, and in this paper, the value of Sr is 4.0; γ and E are the weighted average values of the density and elastic modulus of the overlying soil, respectively, which are γ = 18 kN/m3 and E = 4.5 MPa; and φ is the grouting filling rate, which generally ranges from 100% to 200%. The greater the φ , the greater the grouting amount and the smaller the settlement, which is taken as 1.7 in this paper.
Atkinson and Potts [31] obtained the empirical relationship between the maximum surface settlement and the vertical displacement uc of the arch crown through a large number of numerical analyses:
S max = 1 α H d 0.5 u c
where uc is equal to the gap parameter g. For dense sand, α = 0.4; for the soft soil in this paper, the value of α equals 0.2.
In addition, Clough and Schmidt [32] also obtained empirical equations for maximum surface settlement and vault settlement of a similar cohesive soil layer:
S = max H d β u c
where β is the formula coefficient, which in this paper equals 0.8.
Using the above method, the values of the maximum settlement calculated by the numerical method, semi-empirical and semi-numerical method, or Peck formula at different H are obtained, and the results are shown in Figure 3. It can be seen from Figure 3 that the calculation results are in concurrence with the calculation results of the prediction model with the exception of the buried depth of the tunnel being H = 18 m. The main reason for H = 18 m being the exception is that in that case the stratum reaches the weathered rock layer, and the weathered rock in this model adopts the linear elastic constitutive model. Therefore, the values of the various coefficients in the theoretical calculation will be different from those of the soft soil.

3. Results

3.1. Parametric Study of the Surface Settlement

In order to discuss the influence of the spatial position of the shield tunnel (different horizontal distance D and buried depth H) on the surface settlement S, the settlement of the monitoring point A, and the settlement of the horizontal section passing through the point A were selected for the sensitivity analysis.

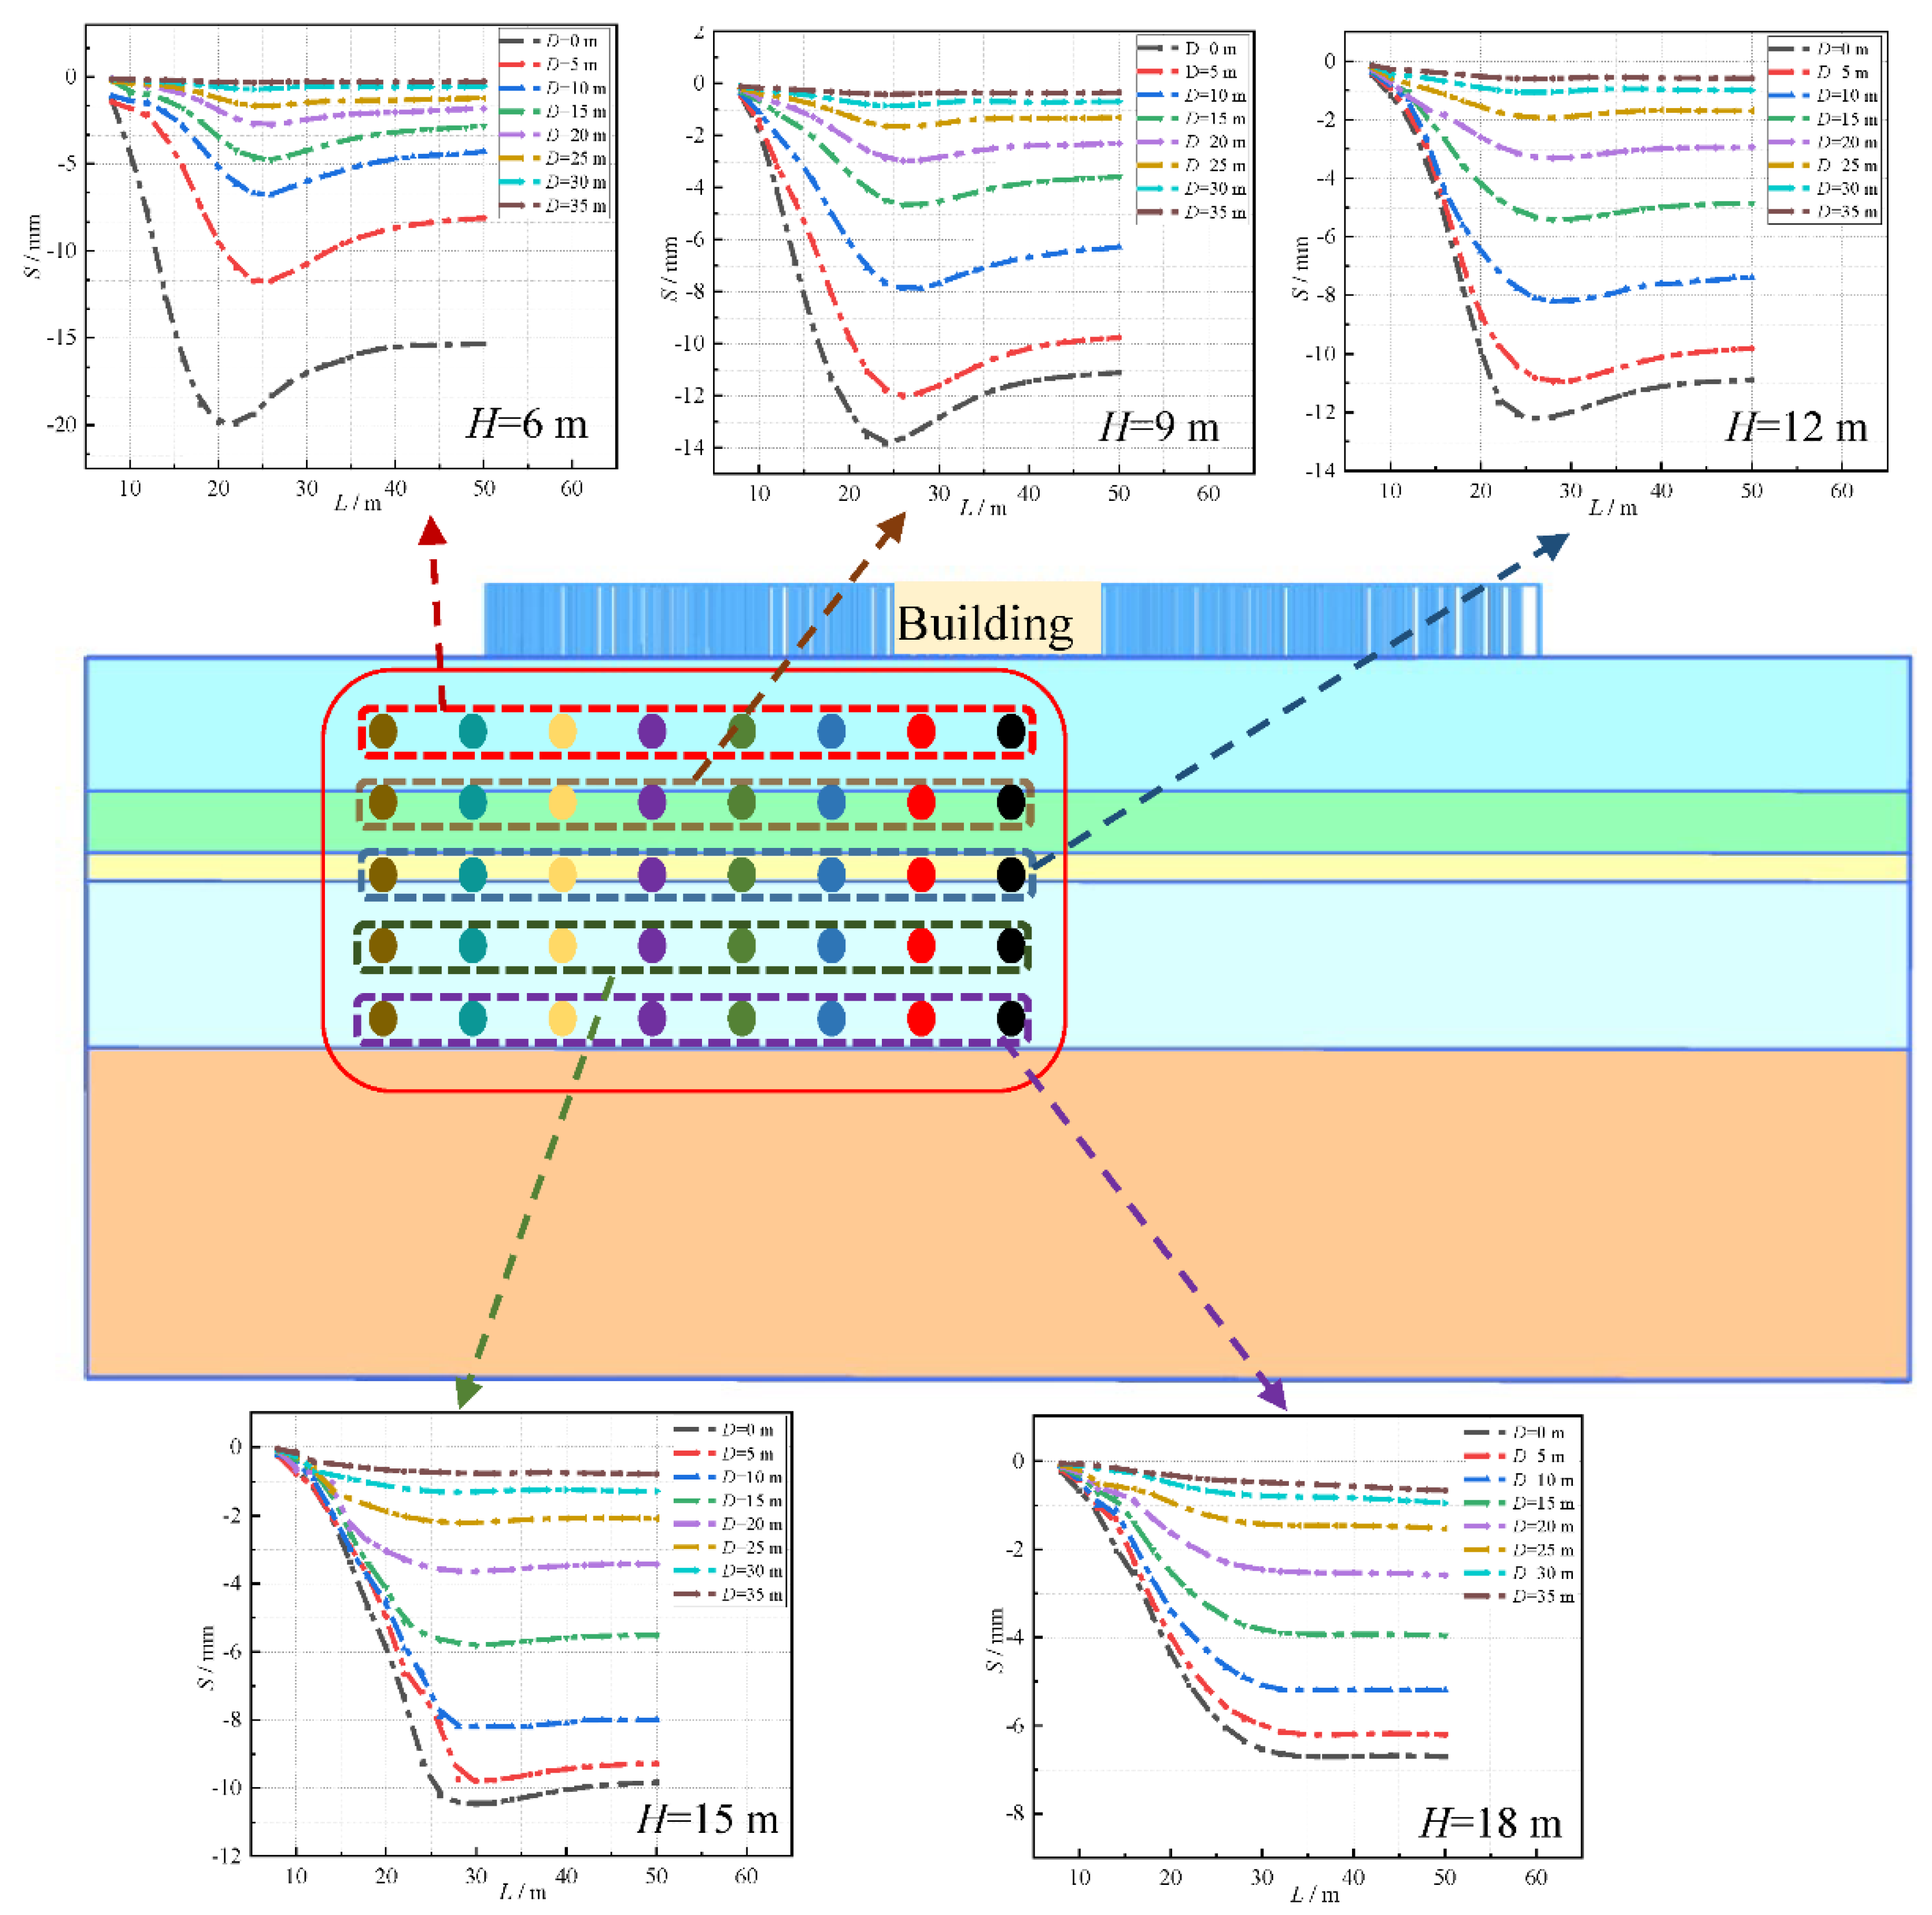
3.1.1. Buried Depth (H)

Figure 4 shows the relationship curve between the surface settlement S and shield tunneling distance L, under different burial depths H. It can be seen from Figure 4 that settlement decreases with the increase in the burial depth during shield tunneling, and as is typical with soft soil, the soil will rebound after the shield machine passes through. The rebound amount will gradually decrease with the increase in burial depths. When H = 6 m, the value of the settlement S is significantly greater than that at other buried depths, which indicates that when H < 9 m, the impact of the shield excavation on the surface settlement begins to increase.
Figure 5 shows the horizontal section of the settlement at the monitoring point A. It can be seen from Figure 5 that S decreases with the increase in H. When H = 6 m, the settlement which is directly below monitoring point A equals S = 19.931 mm, and when H = 18 m, the settlement equals S = 6.709 mm. In addition, when the material and the size structure of the tunnel are consistent, the larger H is, the greater the width of the settlement is.
In order to reflect the variation law of the surface settlement during shield tunneling, the surface settlement increment at each step of the shield tunneling process is extracted, and the variation curve of the surface settlement increment ΔS of monitoring point A with L under different H is drawn, as shown in Figure 6. It can be seen from Figure 6 that with the advance of the shield tunnel, ΔS increases after decreasing, and finally tends to zero. The minimum value of ΔS appears at the position of 10 m < L < 20 m. ΔS reflects the impact of shield tunneling on the surface soil. The greater the value of ΔS, the more obvious the impact on the surface soil disturbance at the monitoring point.

3.1.2. Horizontal Distance (D)

By changing the horizontal distance D between the tunnel center and the center of the building (D = 5, 10, 15, 20, 25, 30, and 35 m), the settlement at different horizontal distance D is simulated, and the sensitivity of the surface settlement to different horizontal distance D during shield construction is obtained, as the results show in Figure 7. It can be seen from Figure 7 that D has little to no effect on the shape of the surface settlement curve, but there is a great difference in the surface settlement values under different D, and S decreases with the increase in D.
In order to explore the influence of different D on the change of the maximum settlement value, the surface settlement change rate between adjacent points D in the settlement curve (Figure 5) is extracted. The results are shown in Table 3. It can be seen from Table 3 that with the increase in H, the change rate of the surface settlement decreases, i.e., the smaller the H, the greater the disturbance of the shield construction to the surface soil. With the increase in D, the change rate of the surface settlement tends to be stable.

3.2. Deformation Characteristics and Stress Analysis of Buildings

3.2.1. Building Deformation and Internal Force

In order to explore the deformation law of the foundation of the building during the process of shield tunneling, the variation curve of the maximum values of sinking and floating of the foundation slab directly below the building is drawn, as shown in Figure 8. It can be seen from Figure 8 that there are two peak points in the maximum value curve of the floor subsidence, and with the decrease in the value of H, the peak value increases. When H = 6 m, the float of the bottom plate is obvious, reaching 8.311 mm, which is very small under other H.
The variation curve of the maximum bending moment, the axial force, and the shear increment of the building slab and column structure with H is drawn in order to explore the relationship between H and the internal force of the building, as shown in Figure 9. It can be seen from Figure 9 that the internal force of the building will increase when the tunnel passes through, compared with cases when there is no tunnel. With the increase in H, the influence of the tunnel on the internal force of the buildings will gradually decrease. The change of axial force is mainly reflected in the plate structure. When H = 6 m, the increase in the axial force between plates reaches 49.7%. The changes of the shear force and the bending moment are mainly reflected in the column structure, and the maximum increases are 13.6% and 23.9%, respectively. In Figure 9, the maximum point of axial force appears at the junction of the foundation slab and the side plate, and the maximum point of shear force and the bending moment appear at the junction of the foundation slab and the column. This shows that the influence of shield tunneling on the foundation of buildings is much higher than the influence of shield tunneling on the superstructure.

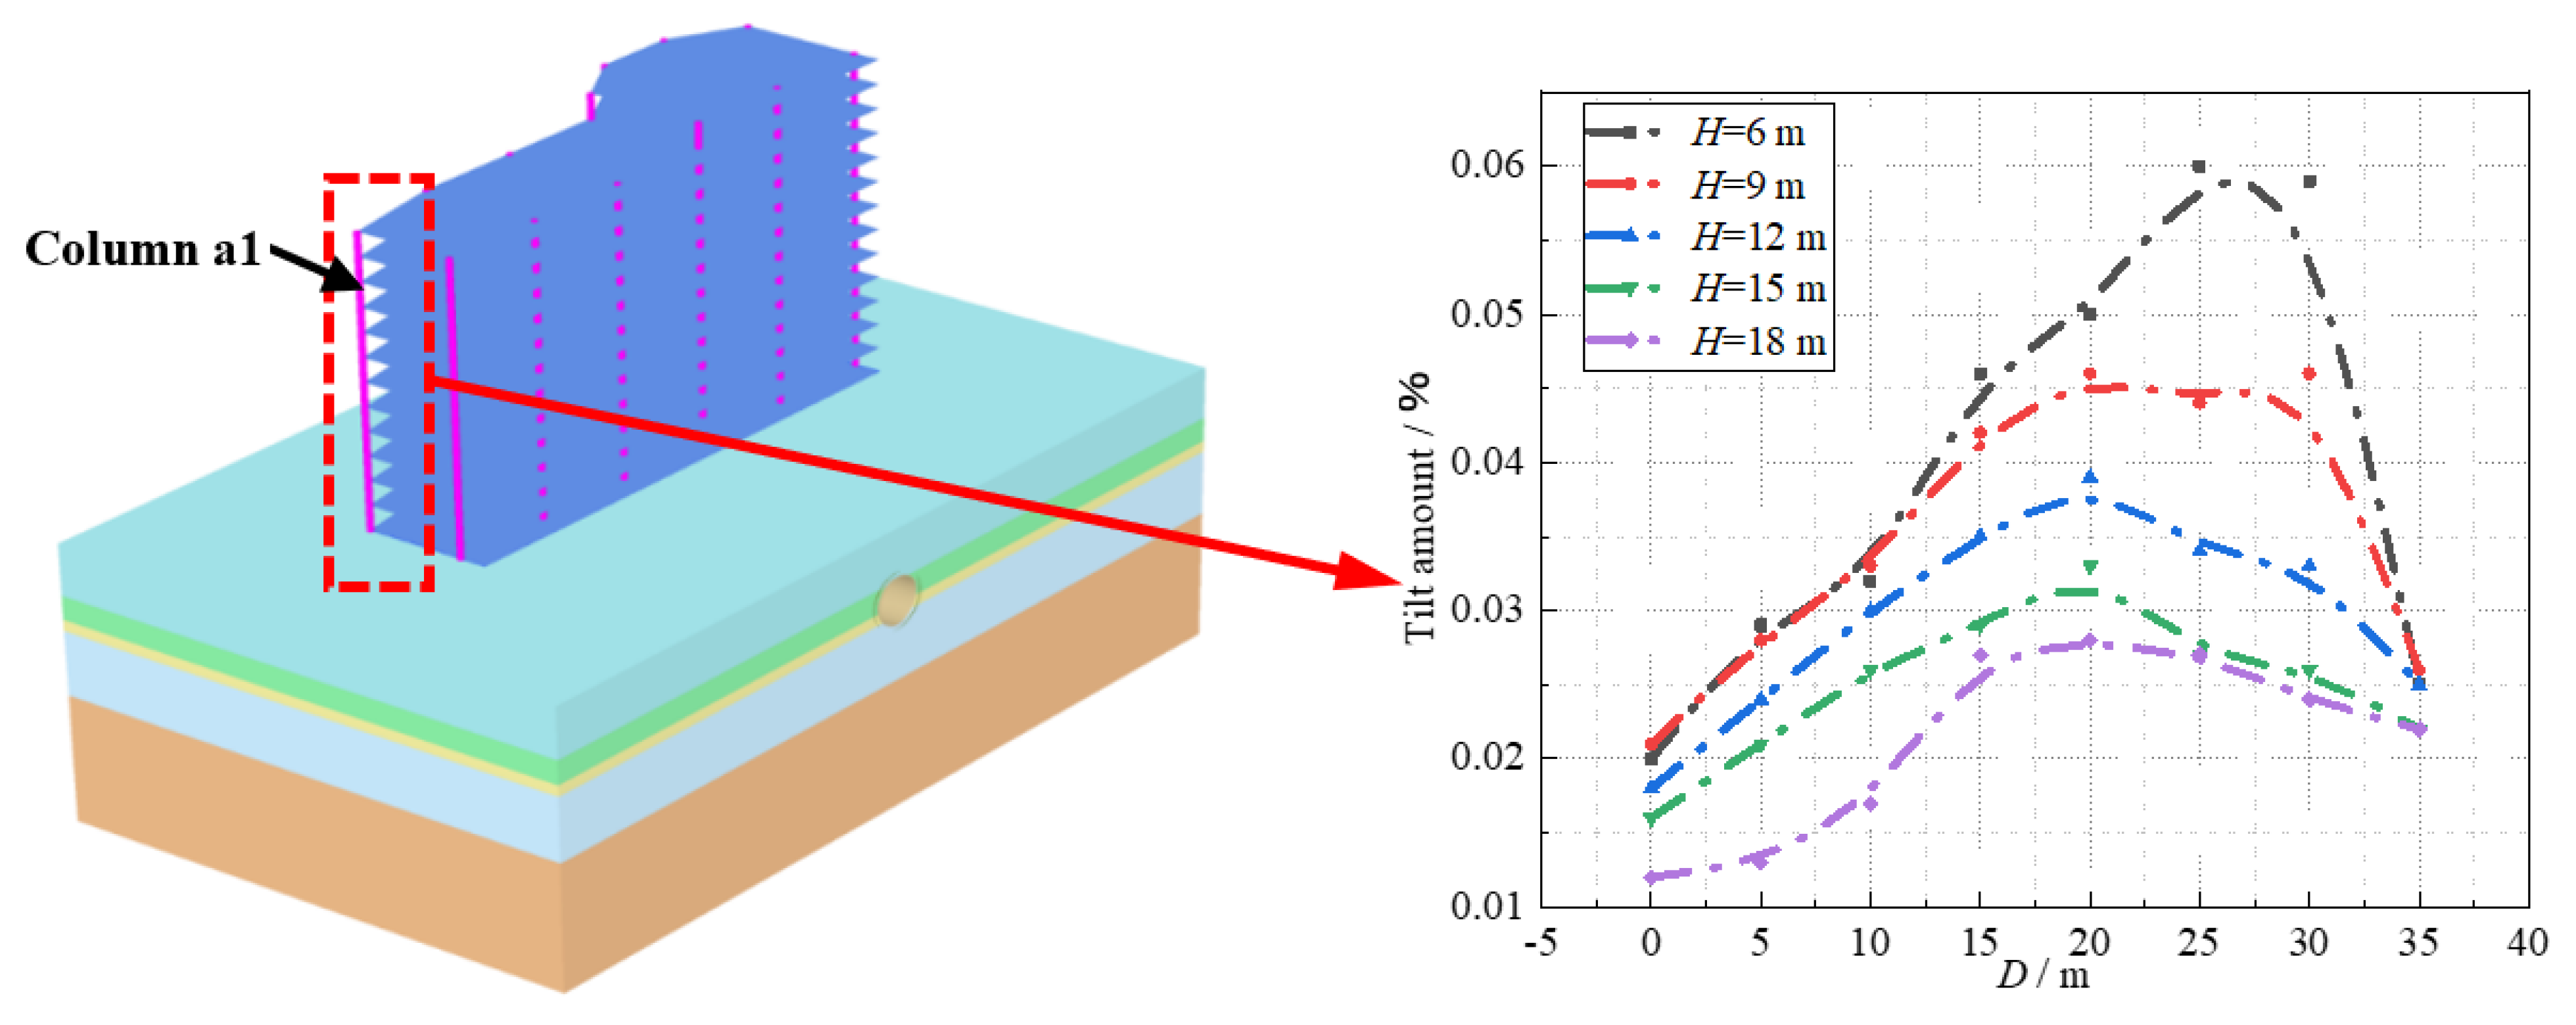
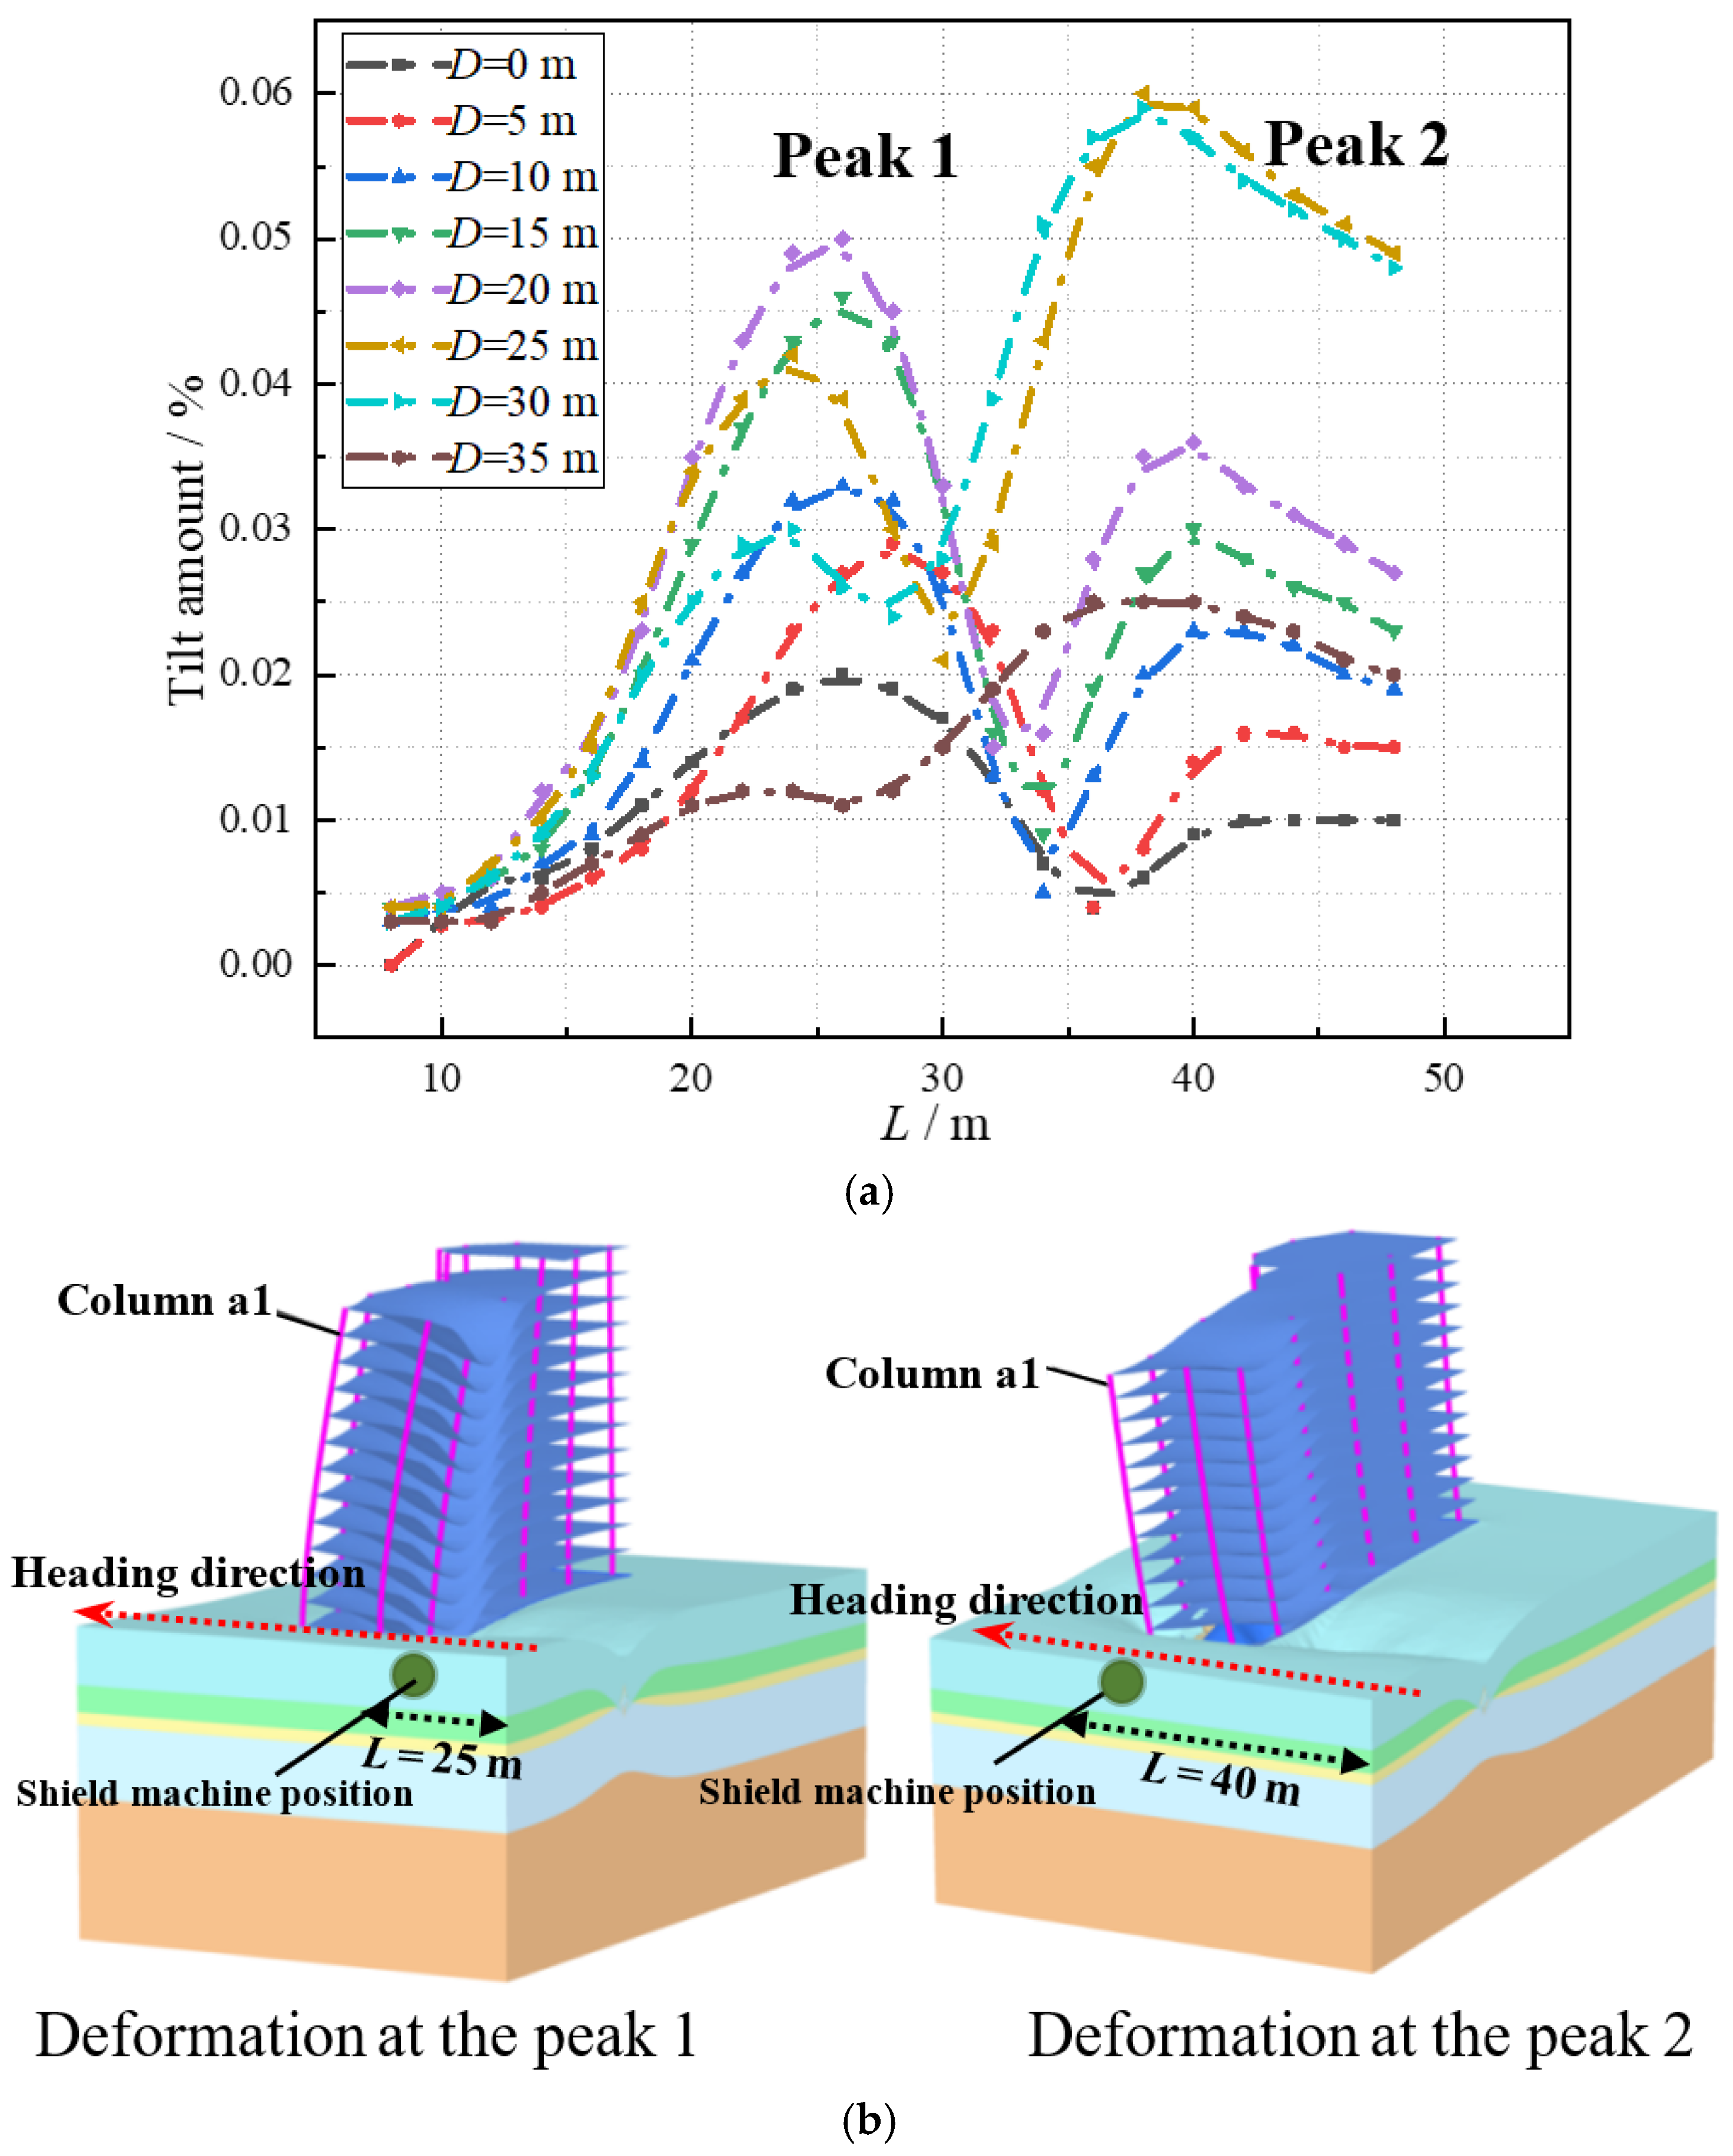
3.2.2. Building Inclination

Building inclination is usually divided into two segments: horizontal inclination and vertical inclination, as shown in Figure 10. Horizontal inclination refers to the horizontal displacement components Δx and Δy perpendicular to each other at the top and bottom point of a building, due to deflection. The Pythagorean theorem is used to calculate the total displacement difference Δu in the horizontal direction. The ratio of this displacement difference to the height of the building (Δu/H*) is called the horizontal tilt. The vertical displacement refers to the ratio of the settlement difference caused by the uneven settlement of the building at different points and the distance between two points (∆H/D*).
To explore the law of horizontal inclination of buildings, the inclination curve of the corner a1 column of the building is selected, as shown in Figure 11. As can be seen from Figure 11, the horizontal inclination of the building decreases with the increase in H, and the inclination value of column a1 in the beginning increases, and then decreases with the increase in D. The maximum horizontal inclination does not appear directly below the a1 column, and the distance between the position where the maximum inclination appears and the a1 column gradually increases with the increase in H. This information indicates that the inclination of the building is related to the tunnel position and the eccentricity of the building. In combination with the relevant provisions of Code for the measurement of building deformation [33], the horizontal inclination of buildings should not be greater than 0.3%. Therefore, it can be concluded that the influence of the tunnel location on the horizontal inclination of box foundation buildings meets the requirements of the code.
The variation curve of the inclination value of the a1 column with L is shown in Figure 12a in order to explore the relationship between L and the horizontal inclination of the a1 column, when H = 6 m. It can be seen from Figure 12a that with the advance of the shielding tunnel, the inclination value of the a1 column reaches its first peak when L = 20 m to 30 m. At this time, the shield machine is located in the front of the foundation slab of the building, and the deformation is mainly caused by the loss of soil. The second peak value is reached when driving to the range of L = 35 m to 45 m, which is mainly due to the incline of the building to the side and rear caused by the shield machine driving to the rear of the building foundation slab. Figure 12b shows the tilt direction of the building at the two peaks of the tilt change curve by enlarging the building deformation effect diagram 400 times. It can be concluded that the horizontal inclination direction of the building points to the face of the shield construction during the construction of the underpass shield tunnel.
The Code for Design of Building Foundation of China (GB50007-2011) indicates that the settlement difference between the masonry wall filling in industrial and civil buildings shall not be greater than 0.001 times the central distance of the adjacent column base. The allowable value in this model is 12 mm. To determine whether each working condition meets this requirement, the maximum settlement difference of adjacent column foundations with different H and D is counted, as shown in Table 4. As shown in Table 4, the settlement difference of adjacent column bases tends to decrease overall with increasing H. When D = 0, 25, and 35 m, the maximum settlement difference of the column base is significantly smaller than in other positions. The sedimentation difference exceeds the specification limits when H = 6 m, D = 5, 10, 15, 20, and 30 m, and H = 9 m, and D = 20 m. When H ≥ 12 m, the settlement difference between adjacent columns is less than 12 mm. Therefore, it can be judged that when H ≥ 12 m, the vertical inclination of the building will not exceed the standard limit.

4. Impact Zoning of Shield Tunnel

The zoning of the disturbances caused by shield construction is one of the best ways to conduct construction safety. It represents the division of space in accordance with specific criteria that reflects the impact of the tunnel construction on adjacent projects. The zones are usually divided into strong impact areas, weak impact areas, and no impact areas [34]. In this paper, the strength reduction method is used to obtain the safety factor under the action of the building load. The influence degree of the building load on the tunnel excavation construction is determined according to the ratio of the safety factor, and the influence area is further divided according to the criterion of the compound. The strength reduction is concerned only with the tunnel lining and the surrounding clay. In order to simplify the model and reduce the calculation time, the building is constructed as a vertically downward uniform load to simulate the dead weight and the live load of the building. The technical code for tall building raft foundations and box foundations of China [35] states that the burial depth of rafts and box foundations on natural foundations should not be less than 1/15 of the building height. In this model, the buried depth of the box foundation is 3 m, and usually the floors of residential buildings are not less than 6 floors. Therefore, three building heights of 7 floors, 10 floors, and 13 floors are considered in the model. According to the normal level of building load and base pressure, the building load was simplified to a uniformly distributed load of 0.27 MPa, 0.38 Mpa, and 0.5 Mpa, respectively. In order to better describe the impact that spatial location has on tunnel construction of adjacent buildings, the simulation range of D is increased to 0 m ≤ D ≤ 60 m.

4.1. Project Impact Zoning Method

At first, the strength reduction safety factor of the surrounding clay of the underground arch cavern increases rapidly to its maximum value within a certain range of H and under the surface load of a homogeneous stratum, with the increase in the vertical distance from the arch crown to the surface. Then, it gradually tends to stabilize and decreases slightly [36]. Under the condition of free surface, the strength reduction coefficient first decreases rapidly, then tends to stabilize, and decreases slightly. This shows that the interaction between the tunnel construction and overlying buildings decreases with the increase in H.
In this paper, the strength reduction safety factors of the tunnel lining and the surrounding clay, with or without the building load, are set as β1 and β0, the ratio of its safety factor is ξ = β1/β0, ξ is between (0, 100%], and the value can comprehensively reflect the influence degree of the tunnel under the building load. In theory, the closer ξ is to 100%, the smaller the impact of the surface building load on the tunnel lining and the surrounding clay. Therefore, the position range corresponding to the sudden change point of the curve of the safety factor ratio ξ varying with H can be used as the boundary between the strong influence area and the weak influence area of the construction of the overlying buildings of the tunnel. When the value of ξ exceeds 95%, that is, when the safety factor with the overlying building load is basically the same as that without the building load, and tends to a stable value, the value of ξ is taken as the boundary of the weak influence area and no influence area.

4.2. Strength Reduction Method

In this paper, the strength reduction of the lining and the surrounding clay is realized by using the safety calculation in the finite element software Plaxis 3D. The ultimate load and safety factors are calculated by the reduction of the geotechnical strength. The safety reserve is obtained by the continuous reduction of the geotechnical strength in order to reach the failure state. The safety factor of the project is the reduction multiple:
F = S max / S balance
where F is the safety factor, and S is the shear strength.
By the calculation of the Plaxis 3D, the strength parameters tanφ and c of the soil gradually decrease until the soil is damaged. By introducing the standard Coulomb condition, the safety factor can be expressed as follows:
F = c σ n tan φ / c r σ n tan φ r
where c, φ is the input soil strength parameter; σn is the actual normal stress component. cr and φr are the shear strength parameters, and the original soil strength parameter continues to decrease until the balance of the soil can be maintained. Using this method, the cohesion and internal friction angle will be reduced to the same proportion, that is:
c / c r = tan φ / tan φ r = M s f
The reduction of the strength parameters is controlled by the total multiplier ∑Msf. This multiplier will gradually increase until the soil is damaged. The Plaxis program determines whether any unstable failure has occurred in the soil, whether the distribution of the comprehensive plastic zone is connected, and whether there are large and infinitely developing plastic deformations and displacements. With all things considered, this is a more reasonable judgment method. This multiplier can be defined as the safety factor if a constant value of ∑Msf can be roughly given in the calculation of several consecutive steps after failure.

4.3. Analysis of the Impact Zoning Results

Figure 13 shows the curve of the safety factor with H, whether a building is present or not. It can be seen from Figure 13 that in the range of 6 m ≤ H ≤ 18 m of a typical soft soil layer, the safety factor of the surrounding clay and tunnel lining first decreases rapidly and then tends to be flat with the increase in H when there is no building load. When there is a building load, the safety factor changes slowly. Lastly, the two safety factor curves tend to a fixed value with the continuous increase in H. To a certain extent, this indicates that the interaction between the building and the tunnel decreases with the increase in the distance between the overlying building and the tunnel. When H is large enough, it can be approximated that the overlying building has no impact on the tunnel construction.
In addition, Figure 13 also describes the relationship between the safety factor ratio ξ and H during the tunnel excavation directly below the building, which comprehensively reflects the impact of the load of the overlying building on the tunnel. The smaller the ξ value, the greater the impact. When the building has 7 floors (0.27 MPa), 10 floors (0.38 MPa), or 13 floors (0.5 MPa), curves of change in the value of ξ have inflection points at 0.86, 0.82, and 0.77, respectively. Therefore, the inflection point value can be used as a boundary point for dividing areas of strong influence and areas of weak influence.
The distribution diagram of the safety factor under different building loads (Figure 14), and the variation curve of ξ with D under different H (Figure 15) are drawn in order to explore the spatial distribution characteristics of strong, weak, and no impact areas. According to Figure 14 and Figure 15, when D is within the vertical range of the building load, the safety factor exhibits no change. As D exceeds the range of the building load, the safety factor first increases rapidly and then tends to stabilize, and the change rate of the safety factor with D decreases with the increase in H. When D exceeds 40 m, all working conditions are situated in the no impact area, which in turn shows that when D ≥ 40 m, the impact of the overlying buildings on the tunnel can be almost ignored. When H ≥ 18 m, the safety factor is basically independent of D and the building load and is only dependent of H. The reason for this is the fact that when H reaches a certain value, it becomes a problem of instability of the tunnel itself. While the initial stress field increases, the safety factor of the tunnel itself will decrease. When shield tunneling passes through the overlying buildings in the layer of soft soil, the higher the load value of the overlying buildings, the lower the value of the safety factor. When the building load is 0.27, 0.38, and 0.5 MPa, the strong influence area within the depth level of 120 m of the building central axis and 18 m is basically not changed, which is 20%. The weak influence area increased from 22.5% to 35%. The no influence area was reduced from 57% to 45%. Table 5 shows the area distribution ratio of strong, weak, and no influence areas within the range of 120 m horizontal and 18 m depth of the central axis of the building.
To sum up, the boundary between the strong influence area and the weak influence area directly under the building load simulated in this paper is approximately H = 10 m, and the boundary between the weak influence area and the noninfluence area is approximately H = 16 m. The line dividing the horizontal distance of the strong, the weak, and the no impact area is located in the range of 30 m ≤ D ≤ 40 m, and with the increase in the building load, the affected area becomes larger. Therefore, in the actual engineering construction, the position of the tunnel should not be too close to the original buildings, and the construction operation should be carried out as far away as possible from the strong and weak influence areas, so as to leave sufficient safety reserve factor for the buildings, the surrounding clay of the tunnel, and the structure.

5. Conclusions

1.
In this work, the influence of shield tunneling on the surface and overlying shallow foundation buildings in typical soft soil areas of Shanghai is studied, and the following conclusions are drawn from the aspects of surface settlement, deformation, and stress characteristics of buildings and the zoning of safety effects.
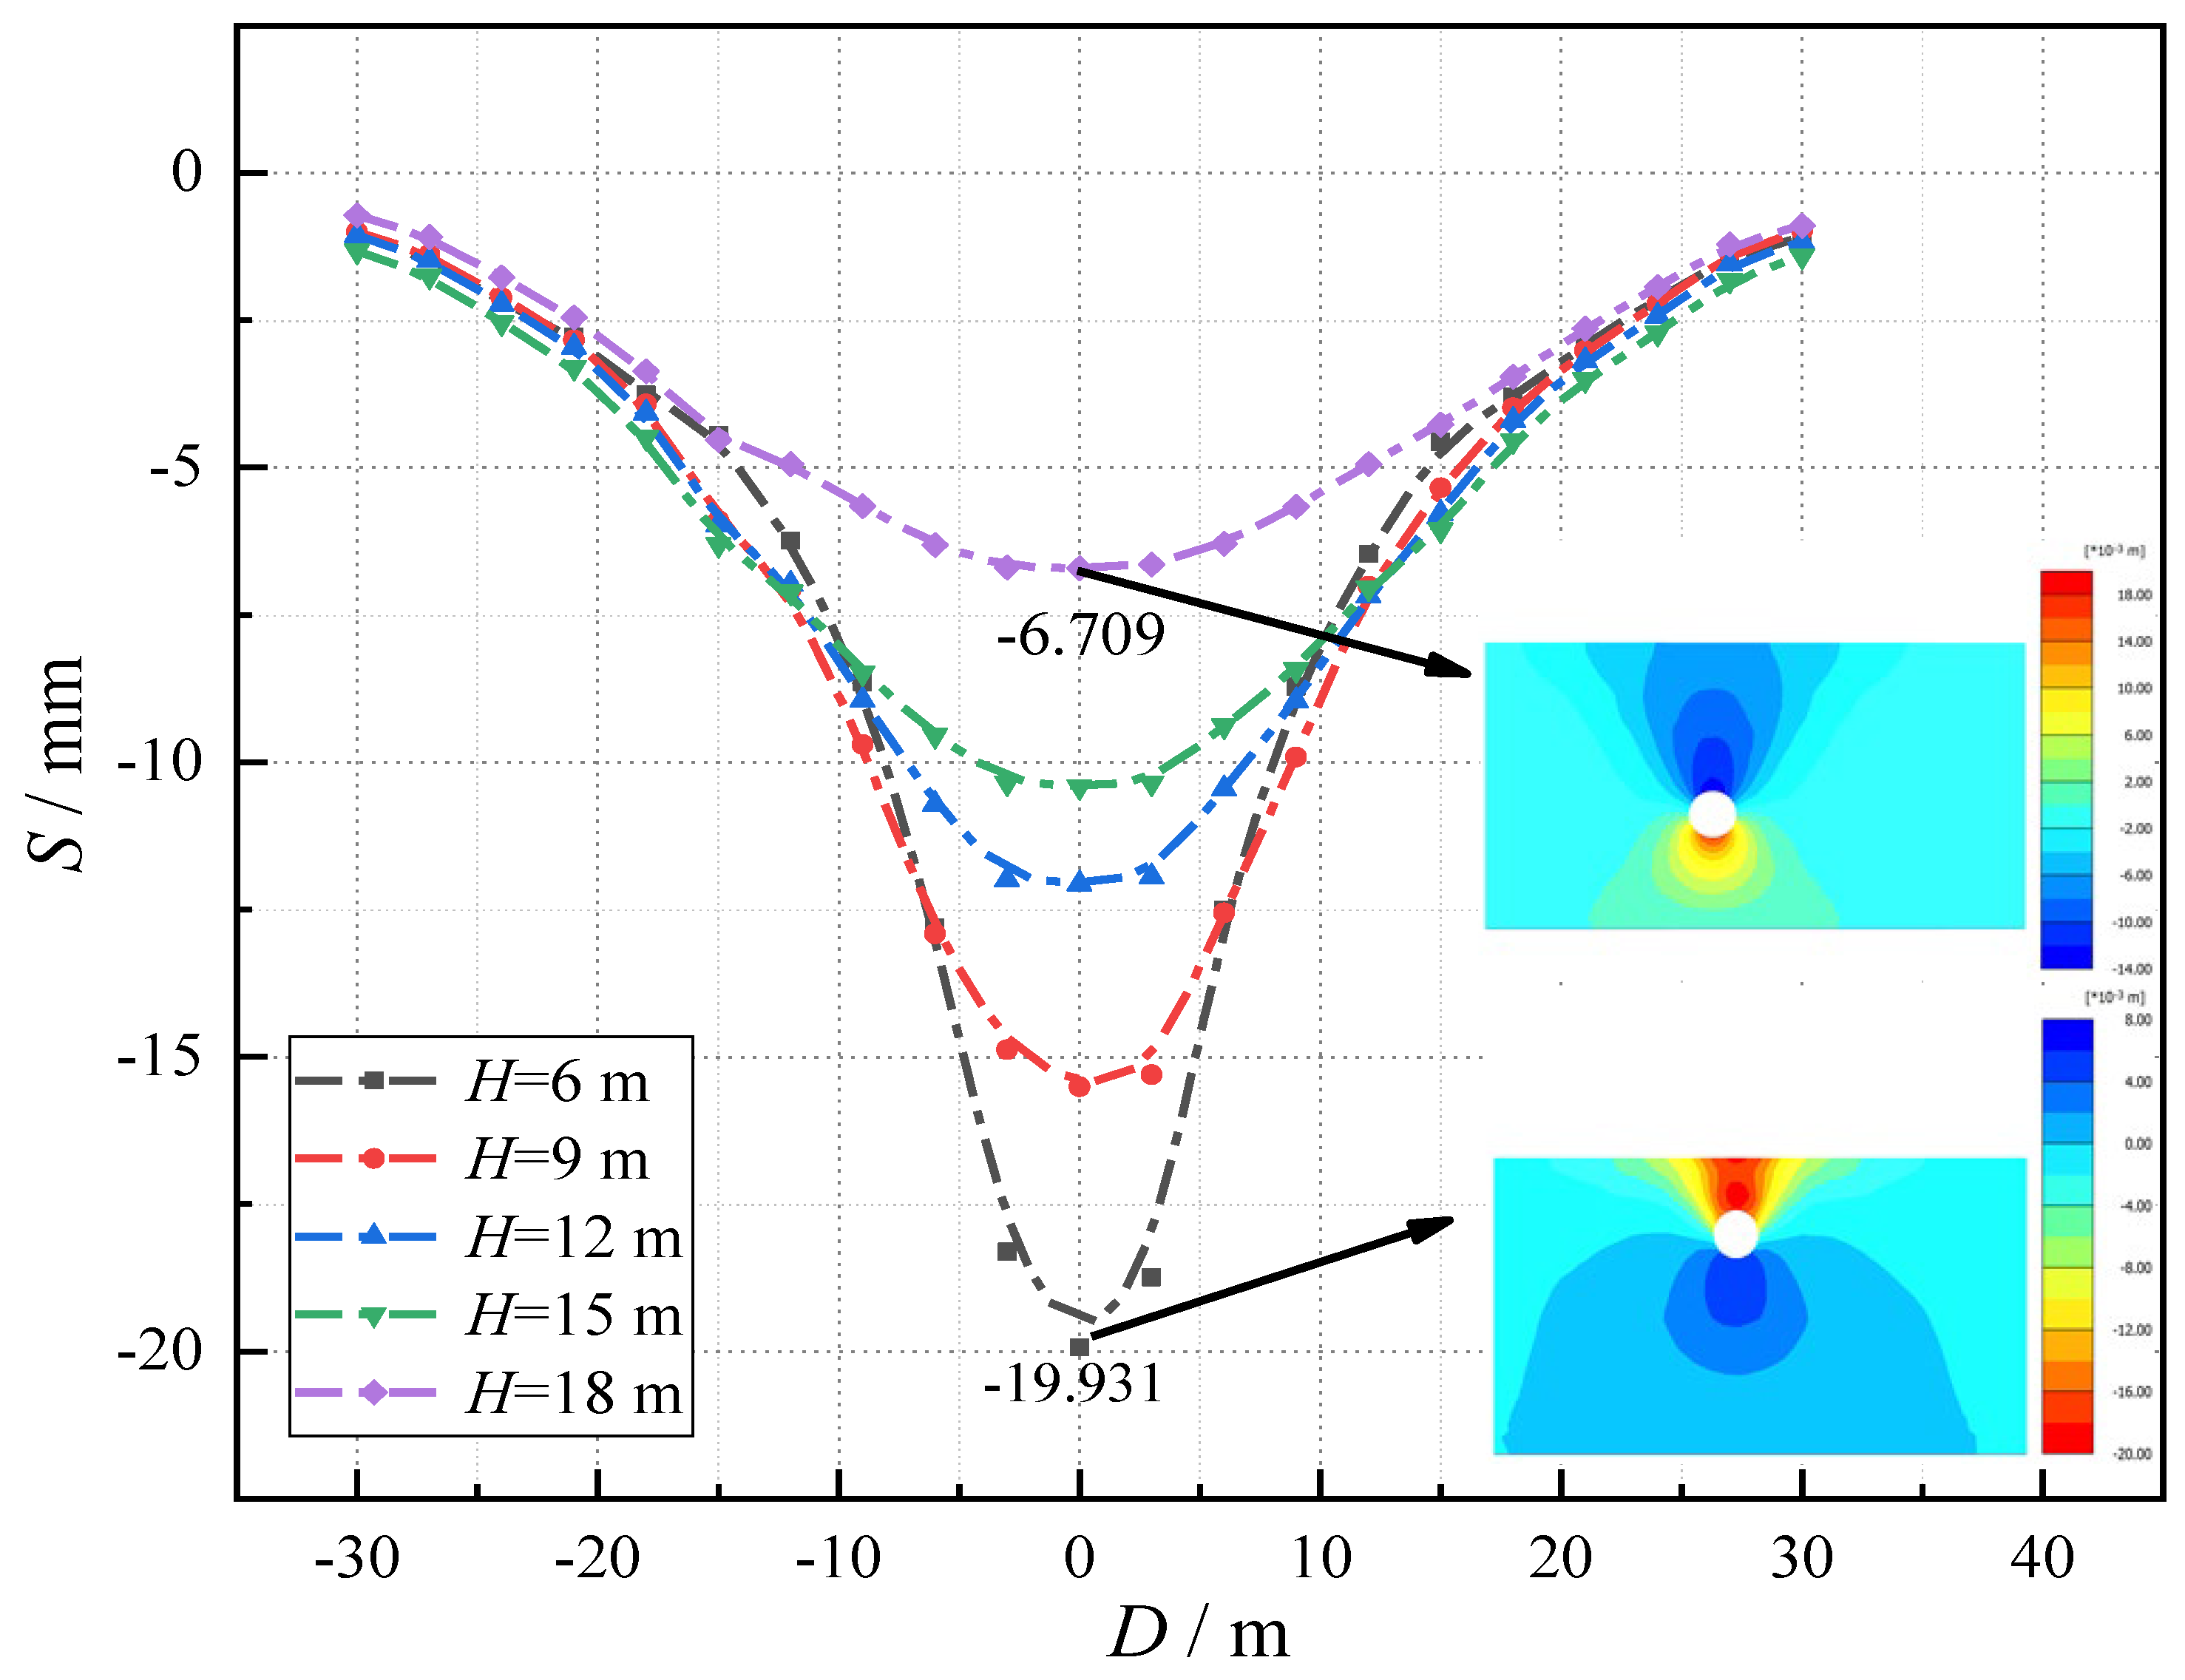
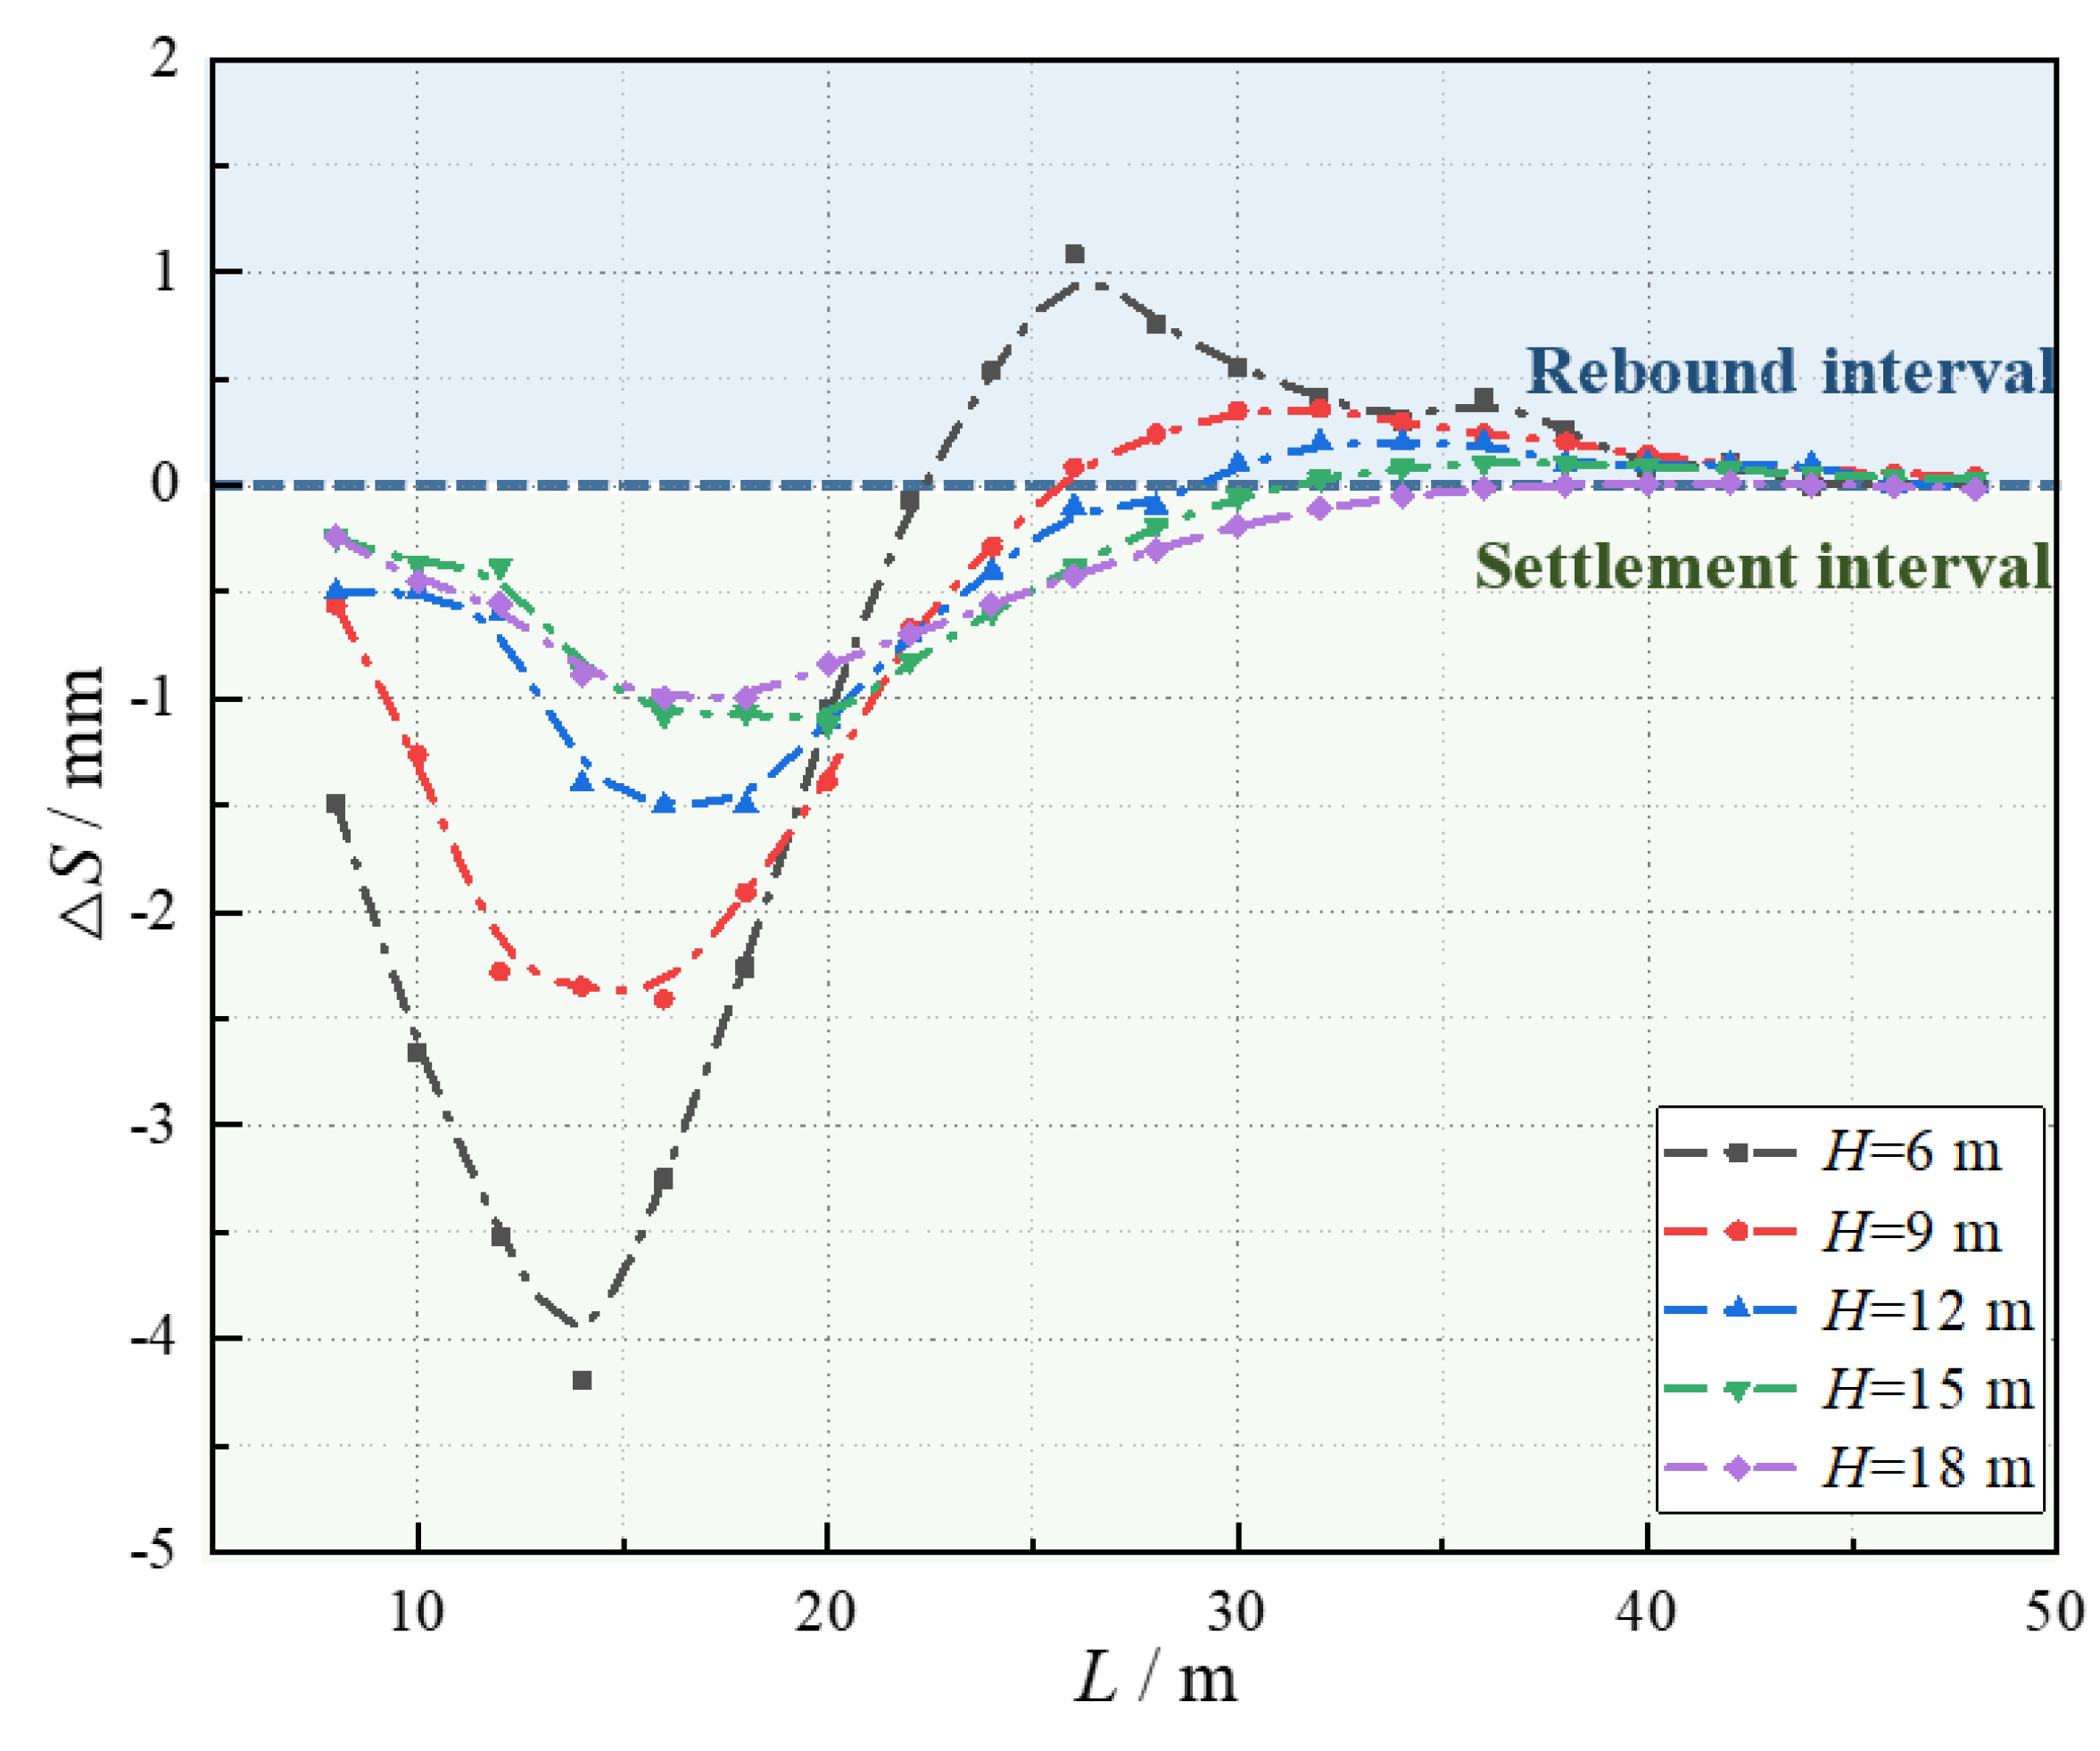
2.
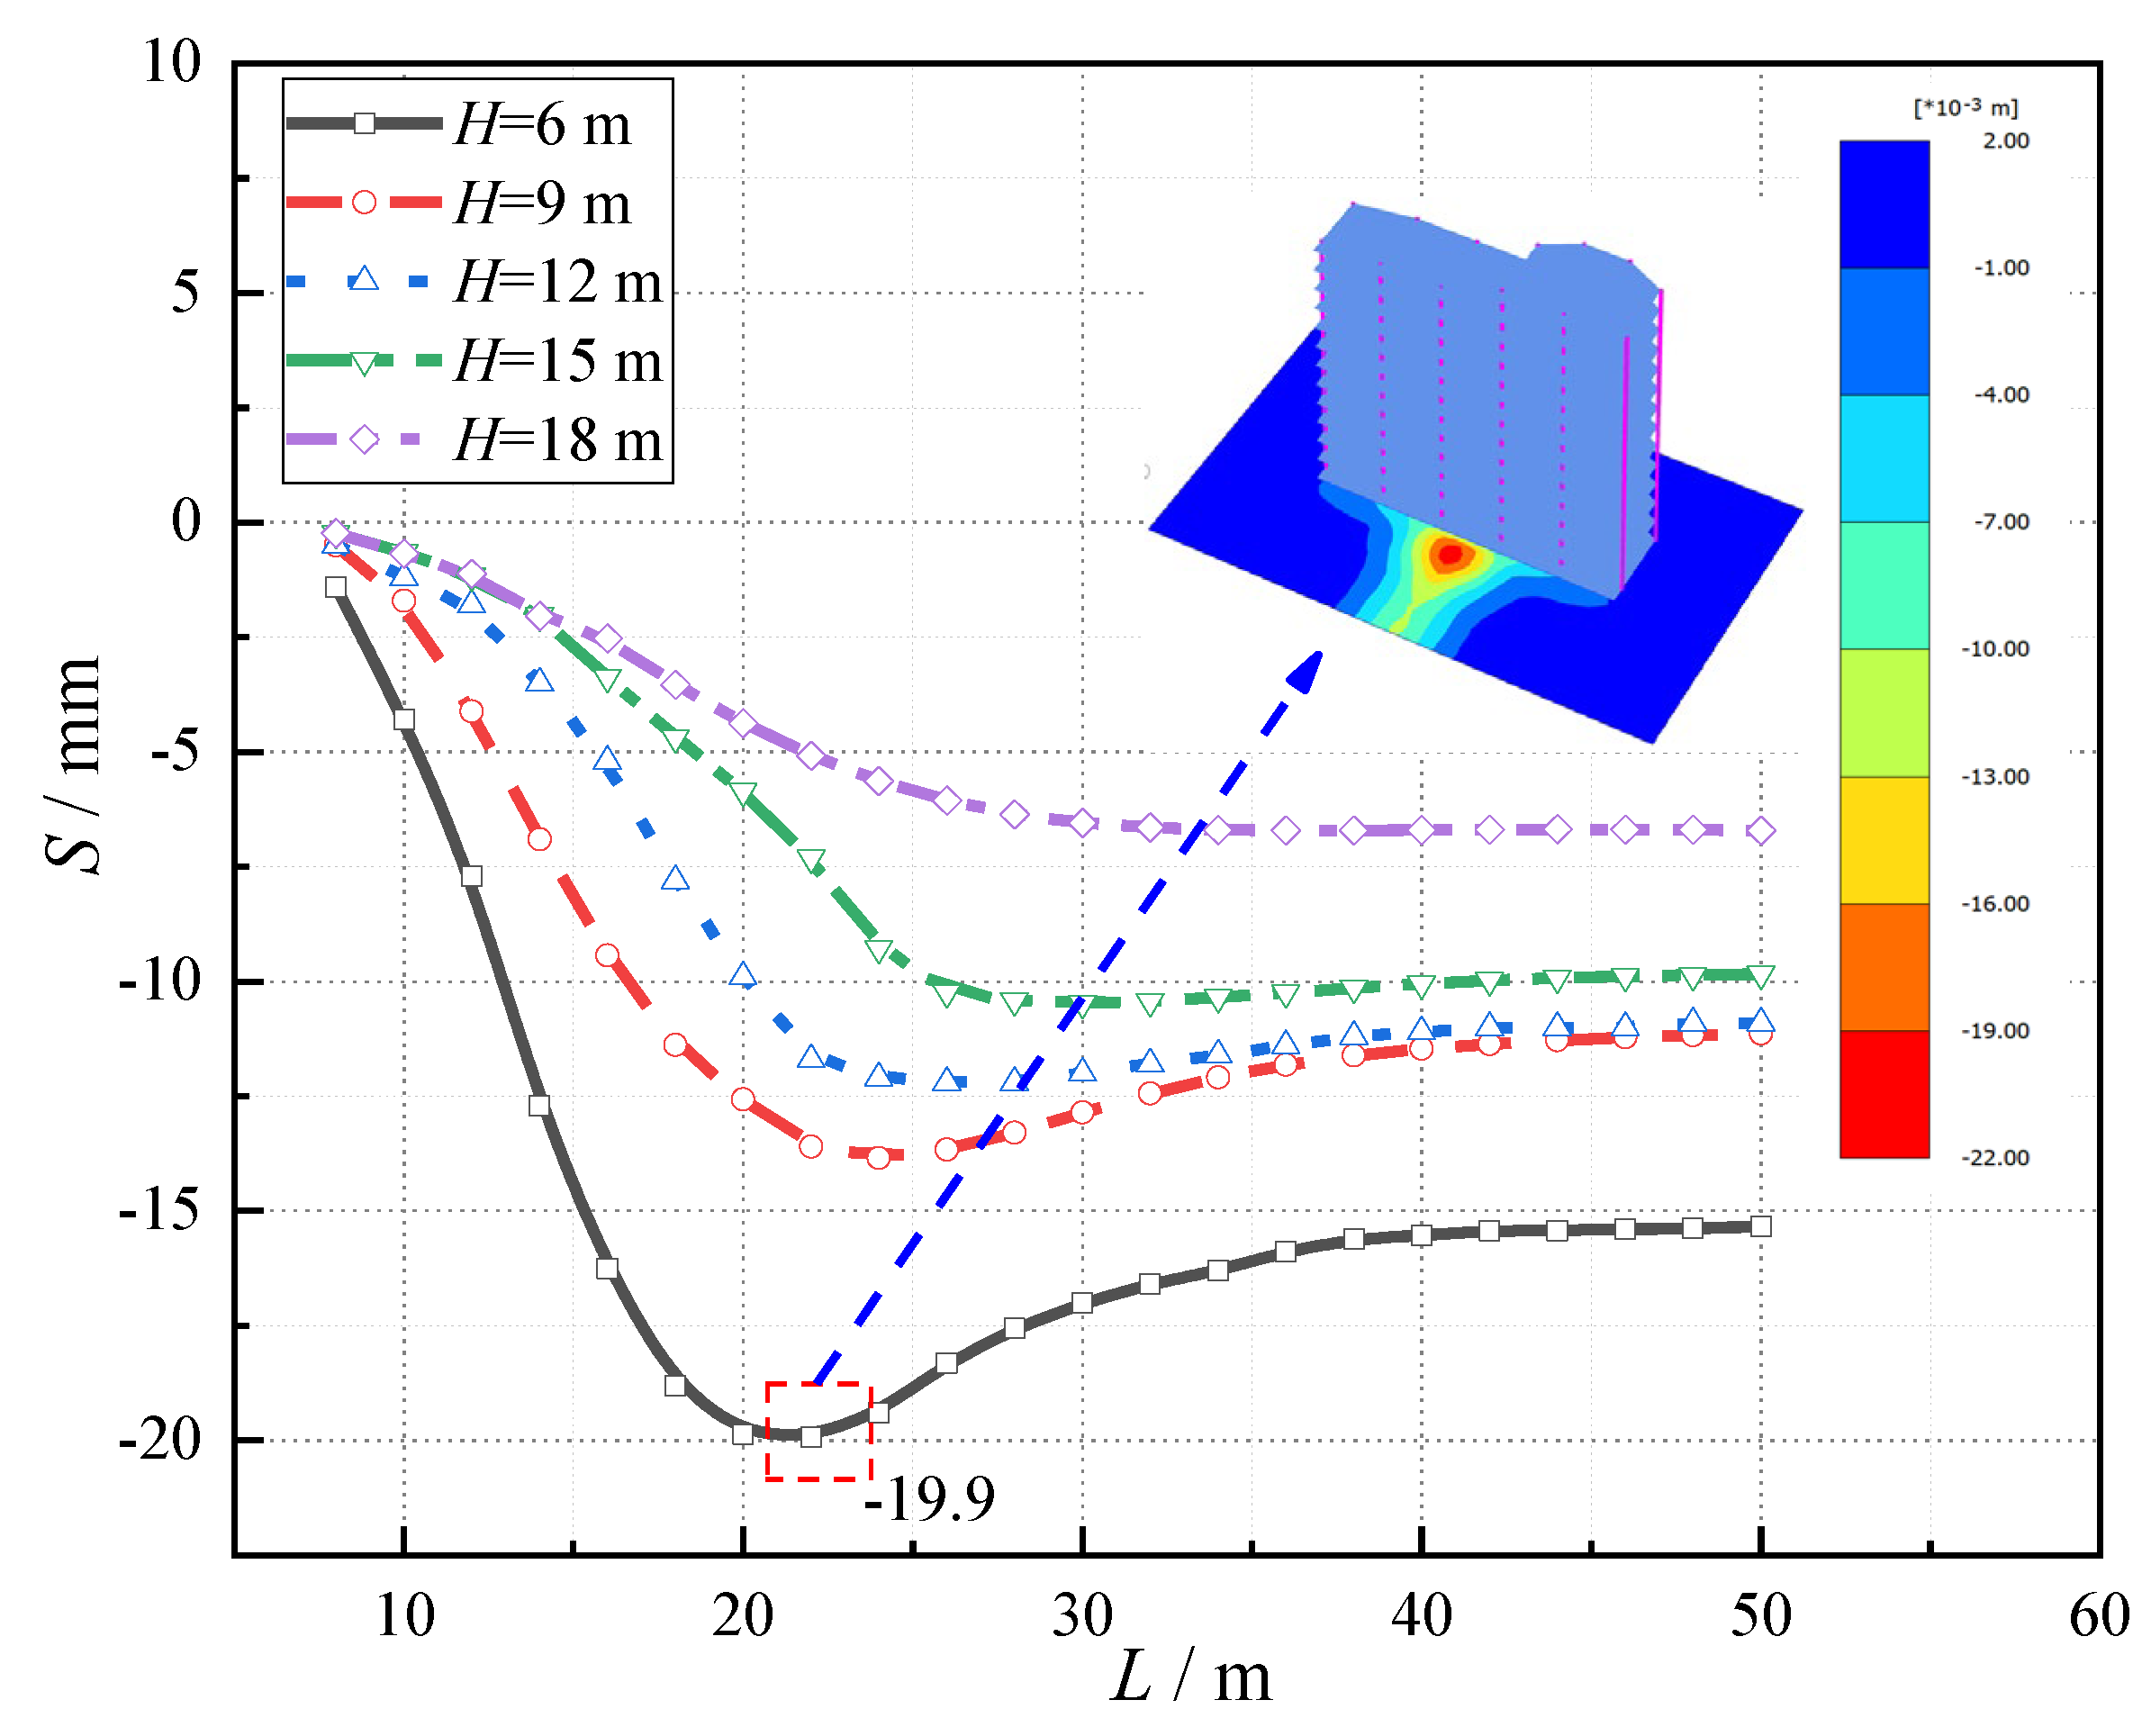
The shield tunneling will cause the soft soil to rebound, and the amount of rebound will gradually decrease with the increase in H. The maximum settlement value of the land surface is 19.931 mm at H = 6 m and 6.709 mm at H = 18 m. Subsequently, the degree of the influence of different shield tunneling positions on the soil is described by the surface subsidence increment ΔS. The research shows that ΔS is the largest when 10 m < L < 20 m, which indicates that shield tunneling has the strongest influence on the surface of the monitoring point.
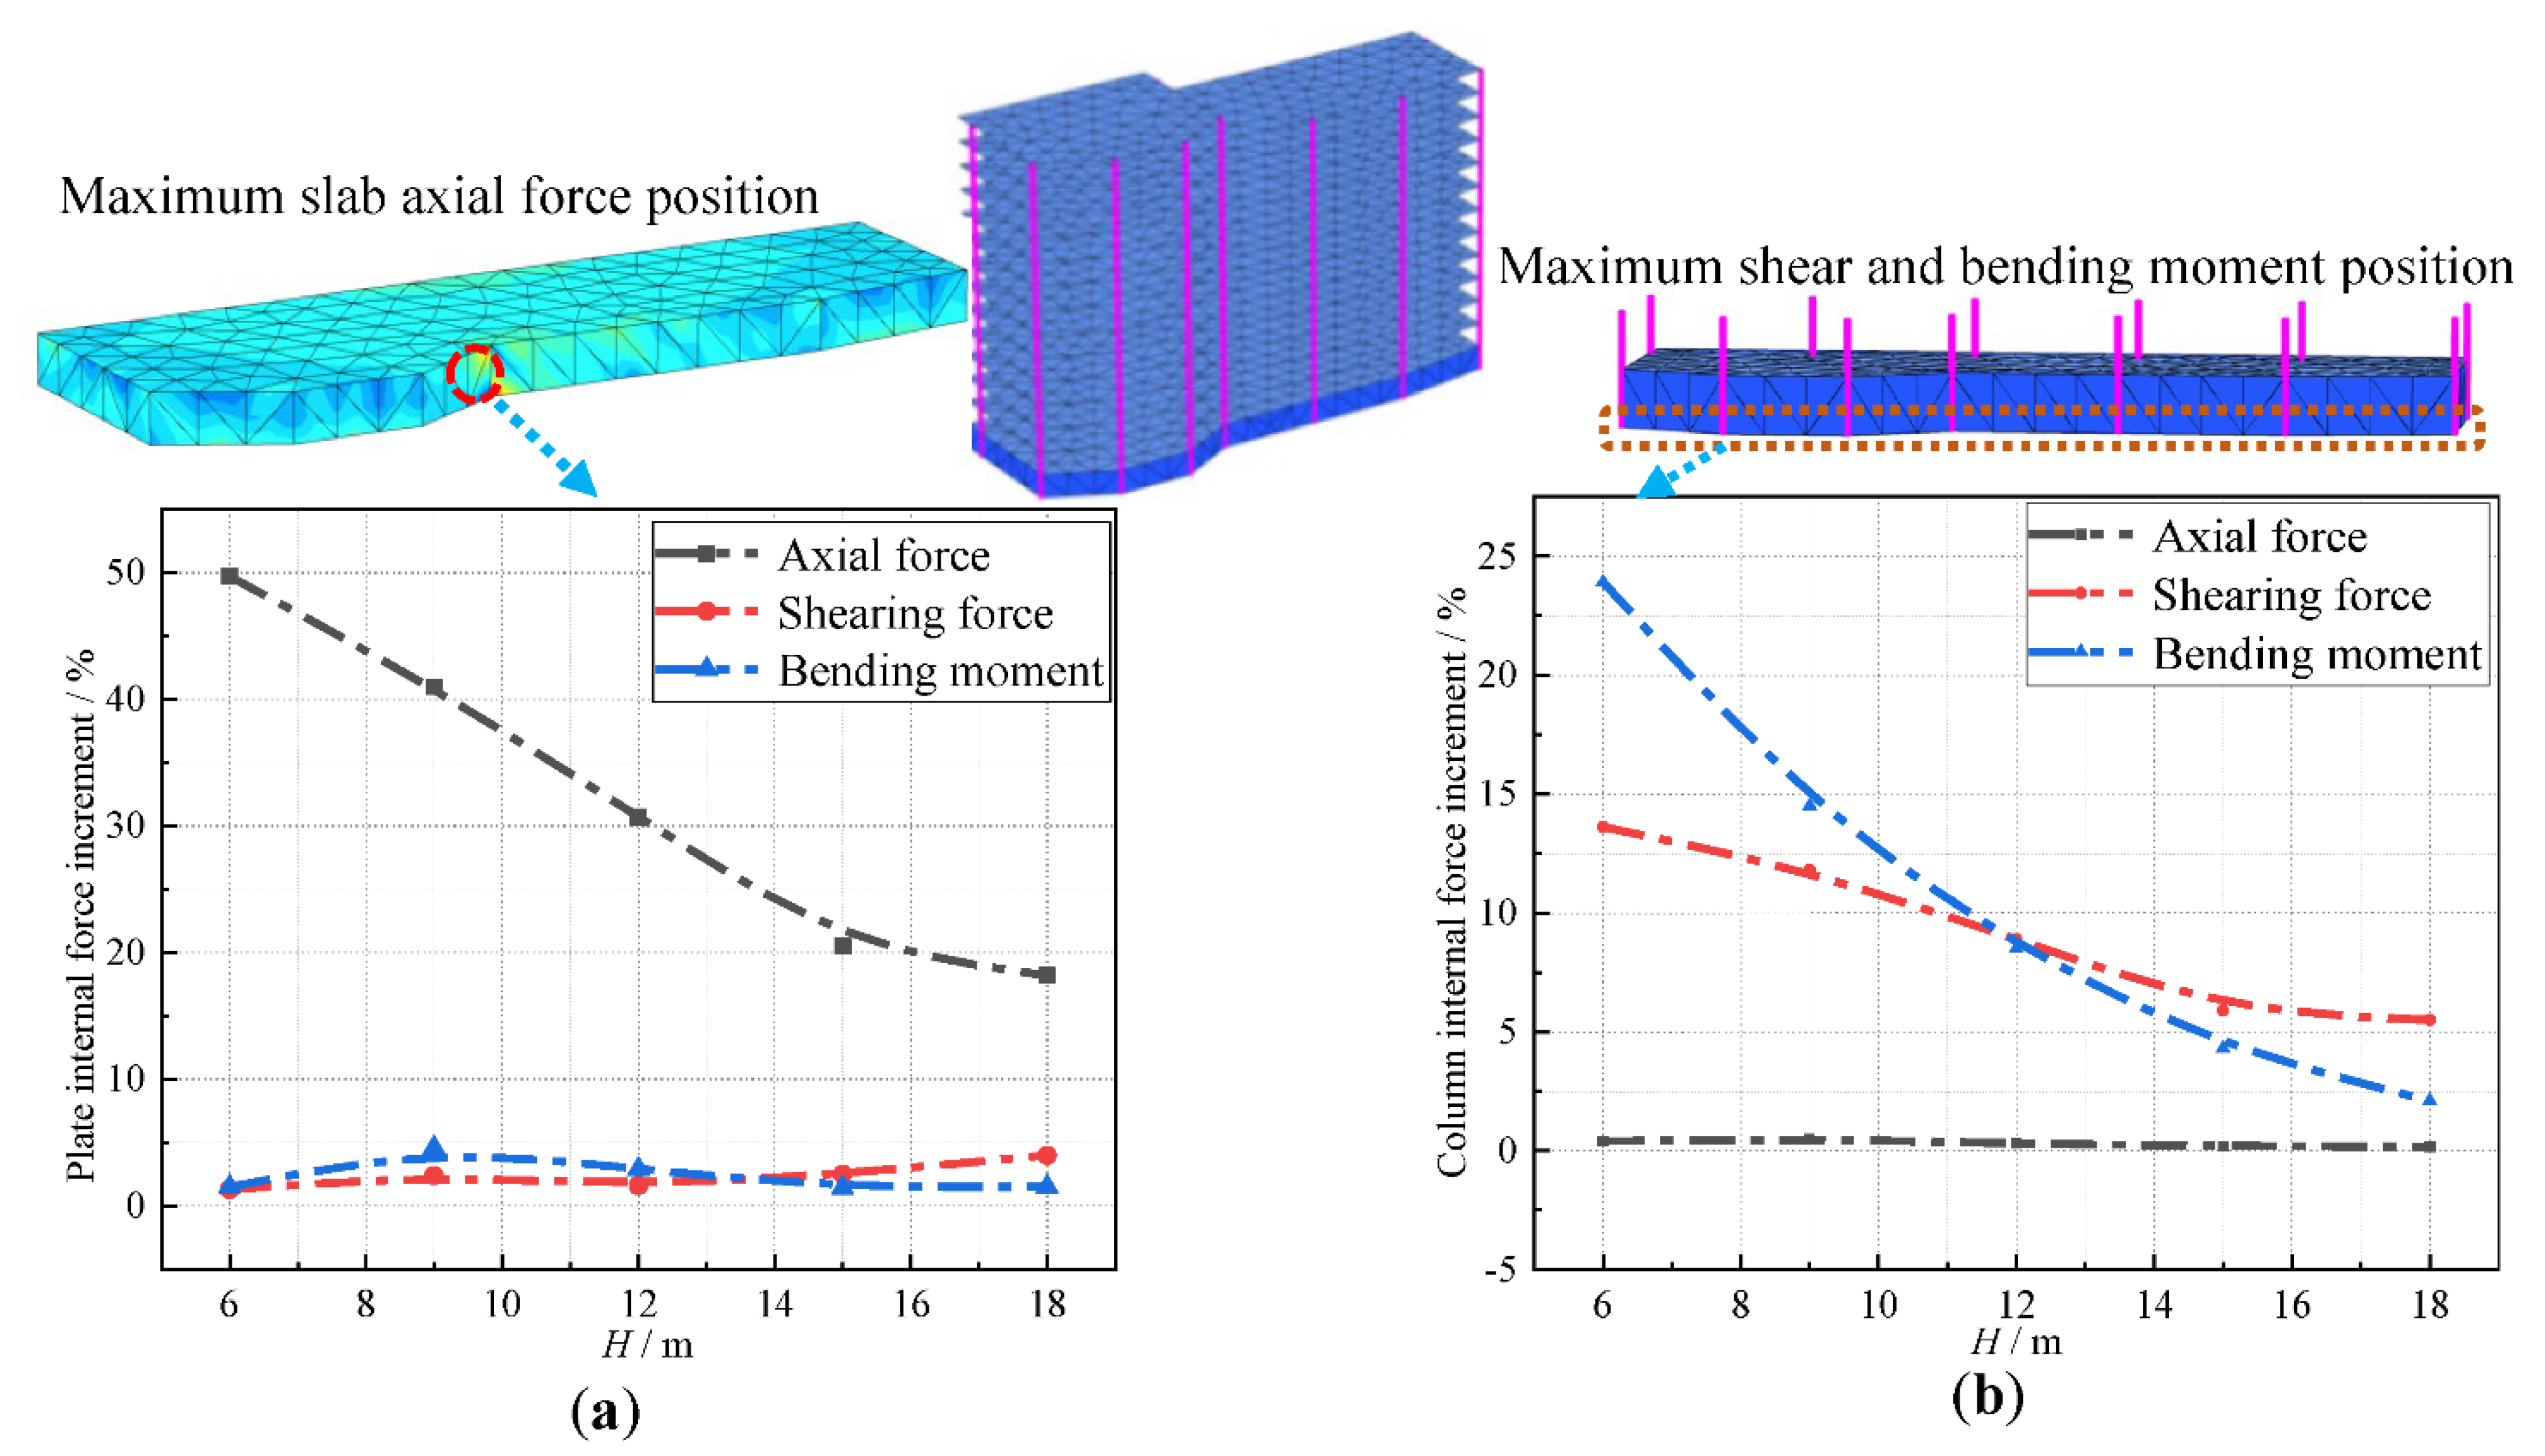
3.
The change of shaft force caused by shield tunneling through buildings is mainly reflected in the building plate structure. At H = 6 m, the shaft force increase in the plates reaches 49.7%. The change of shear force and bending moment is mainly reflected in the column structure, with a maximum increase of 13.6% and 23.9%, respectively. The maximum point of the axial force appears at the junction of the foundation slab and side plate, and the maximum point of shear force and bending moment appears at the junction of the foundation slab and column. This shows that the foundation plays a key role in resisting the influence of shield tunneling on buildings.
4.
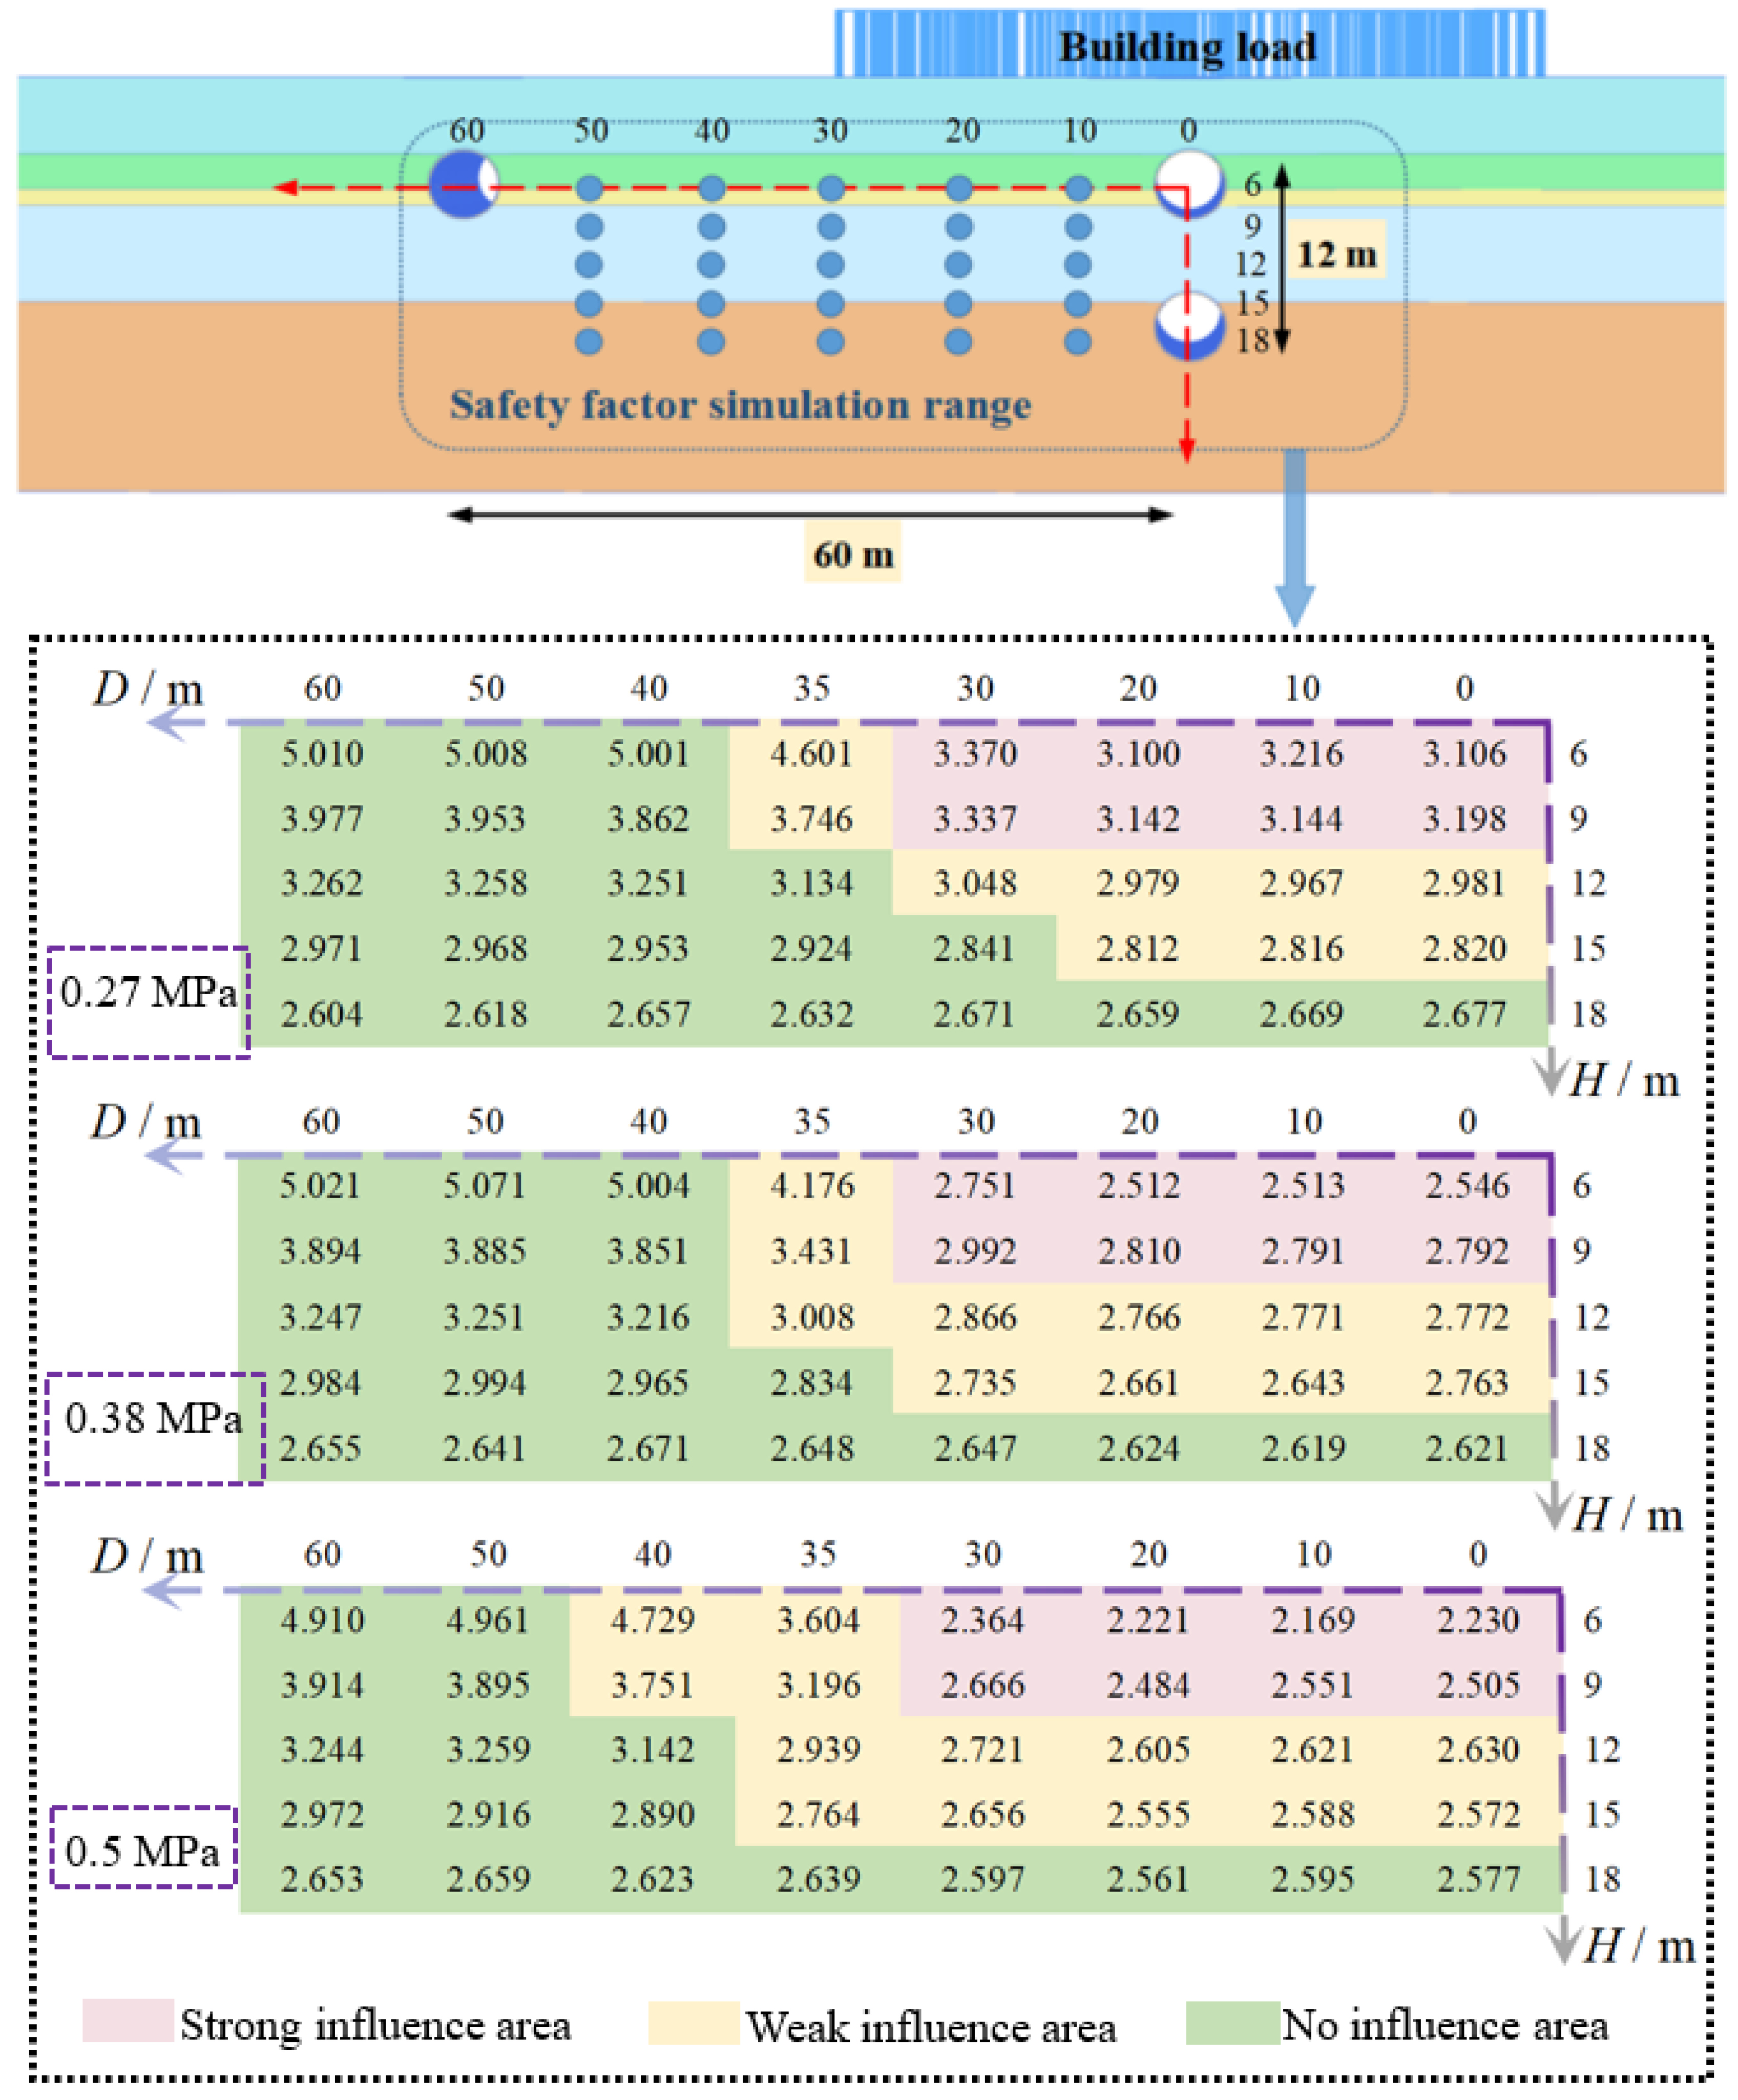
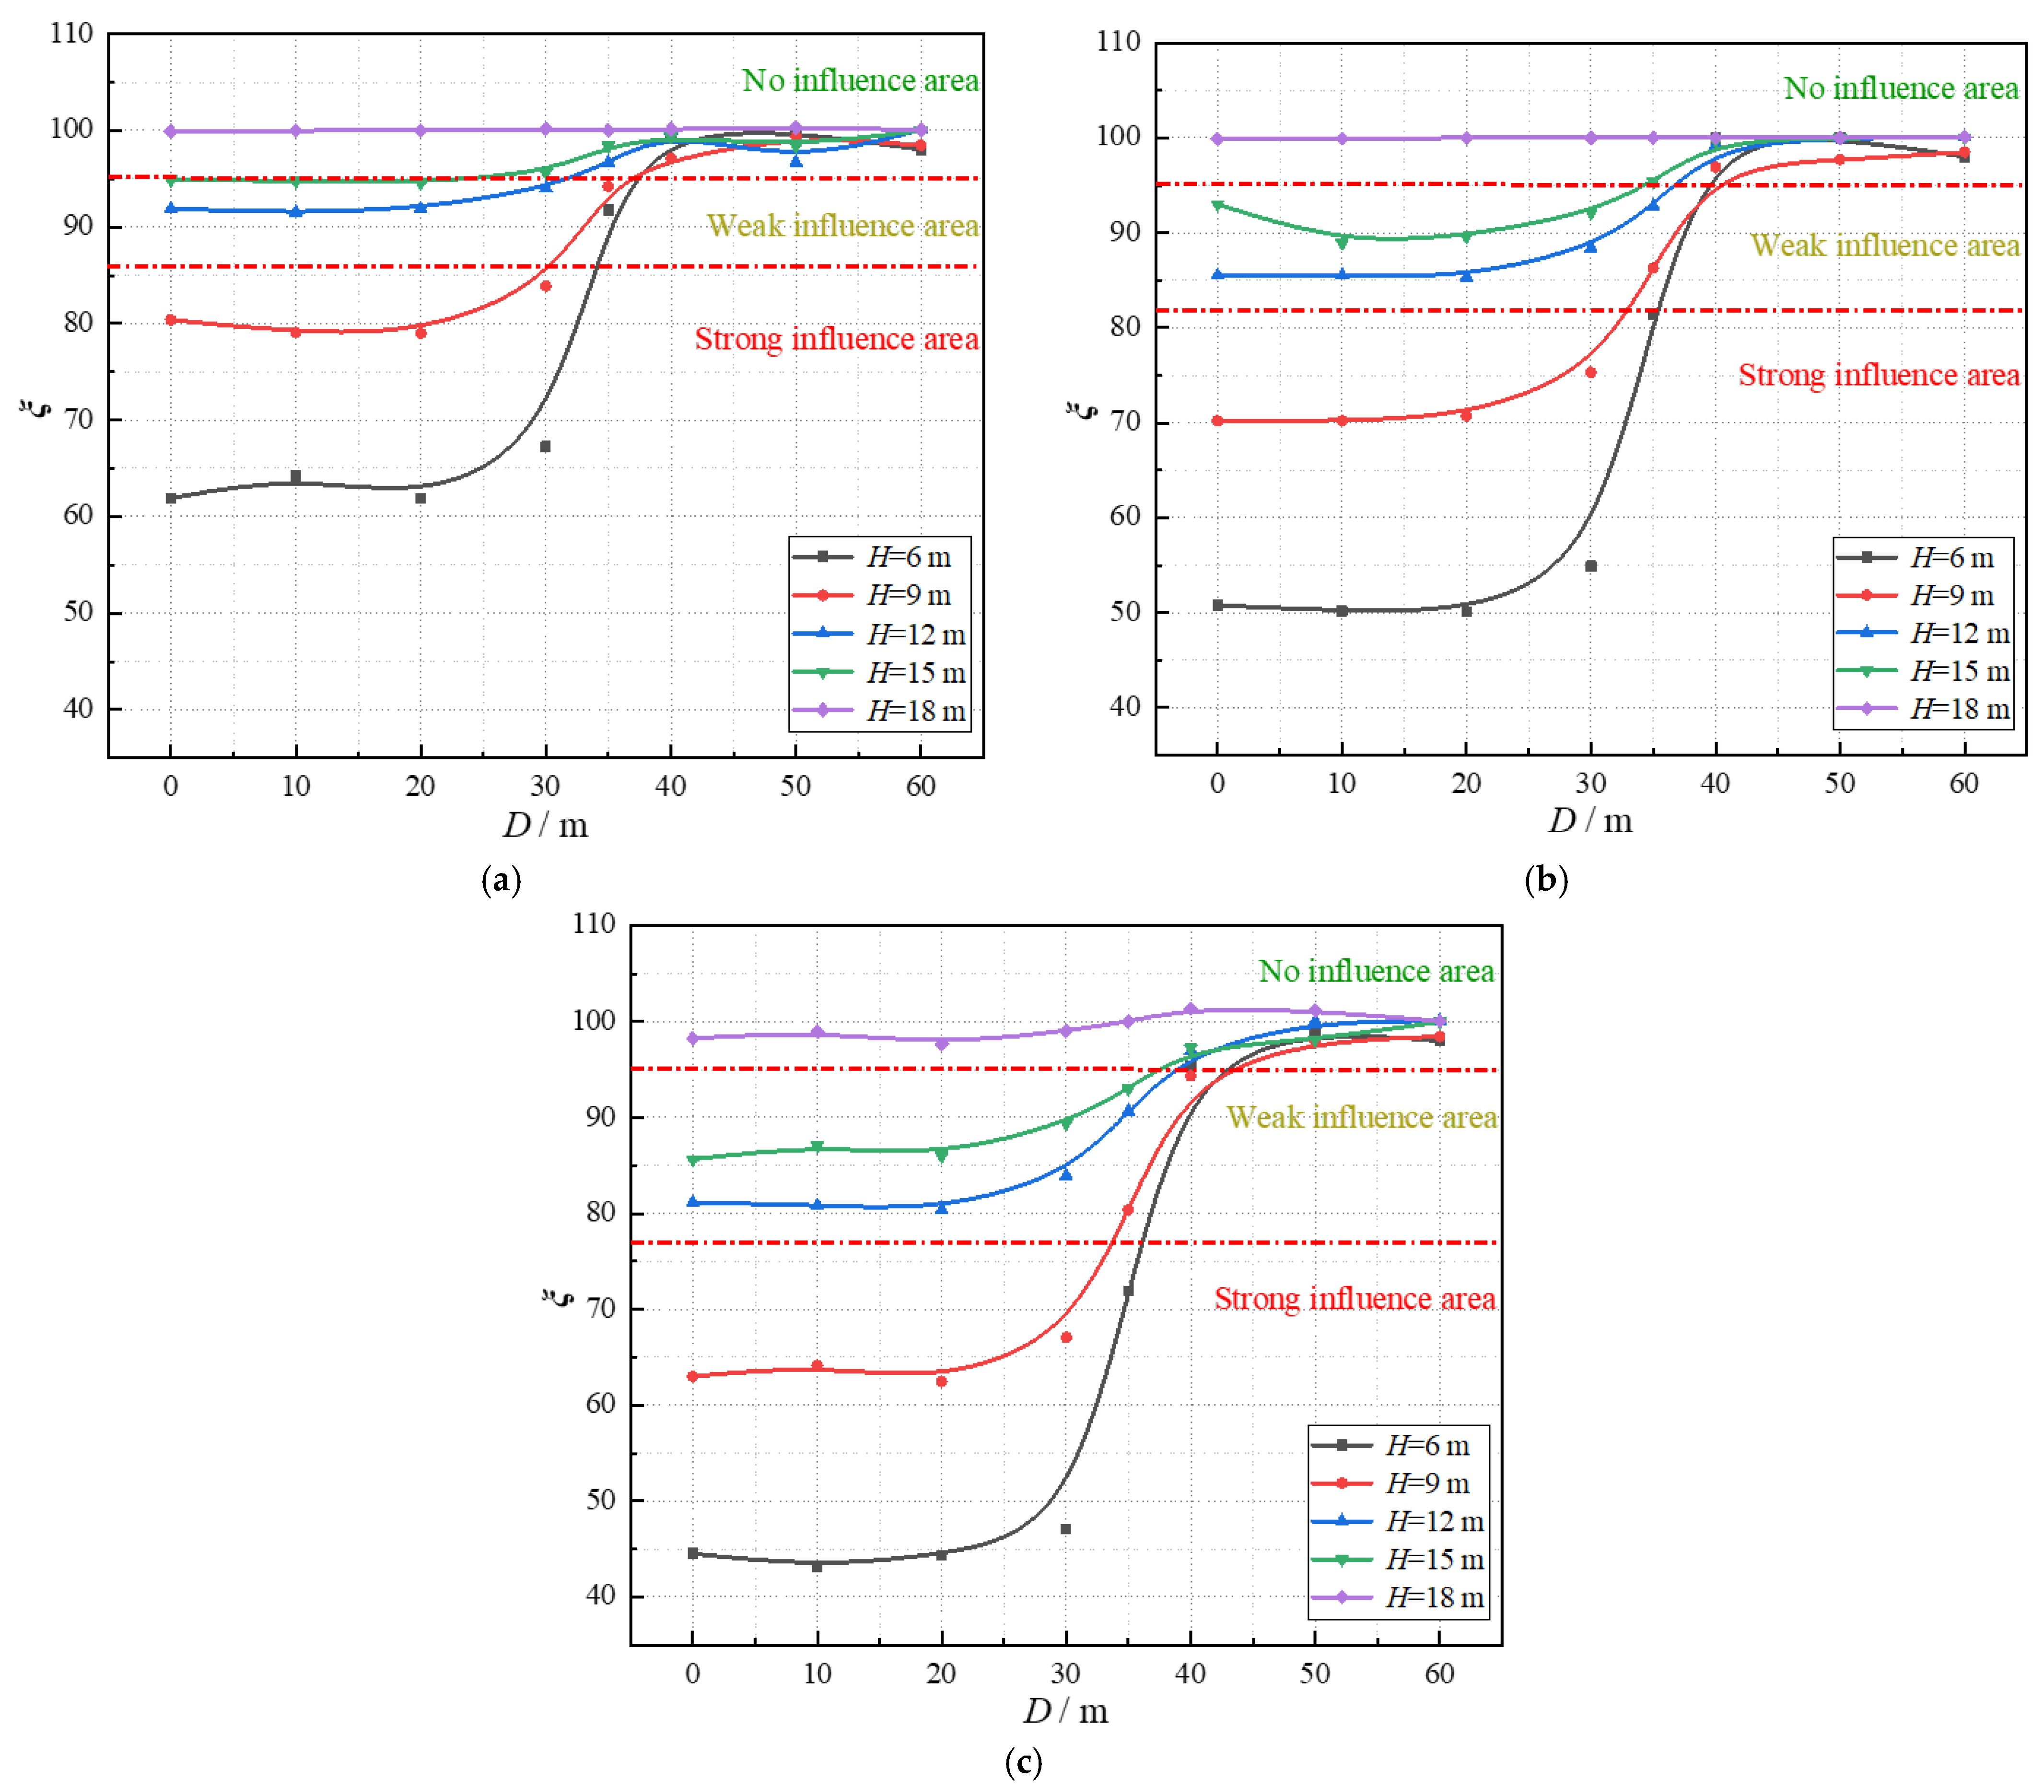
The strength reduction method, which is used to study the engineering impact zone of the model and the variation law of the safety factor of the lining of the surrounding clay with or without building load, is obtained. The influence degree of the building load on the tunnel construction is reflected by the relative ratio ξ of the safety factor with or without building load.

Author Contributions

Conceptualization, X.F.; methodology, X.F.; software, D.H.; validation, D.H., X.F. and Z.H.; formal analysis, Z.H.; investigation, X.F. and D.H.; resources, X.F..; data curation, X.F. and D.H.; writing—original draft preparation, X.F. and D.H.; writing—review and editing, Z.H.; visualization, D.H.; supervision, X.F. and Z.H.; project administration, X.F.; funding acquisition, Z.H. All authors have read and agreed to the published version of the manuscript.

Funding

This work is supported by the Guangxi Natural Science Foundation (2022GXNSFBA035580), Guangxi Science and Technology Base and Talent Special Project (AD21220039), and the Science and Technology Progress and Innovation Plan Project of the Department of Transportation of Hunan Province (202147).

Institutional Review Board Statement

Not applicable.

Informed Consent Statement

Not applicable.

Data Availability Statement

Some or all data, models, or code that support the findings of this study are available from the corresponding author upon reasonable request.

Conflicts of Interest

The authors declare that there is no potential conflict of interest with respect to the research, authorship, and/or publication of this article.

References

  1. He, M.D.; Liu, J.; Le, G.P.; Wang, M.S.; Zhang, D.L. Study of impact of shield tunneling side-crossing on adjacent high buildings. Chin. J. Rock Mech. Eng. 2010, 29, 603–608. [Google Scholar]
  2. Peck, R.B. Deep excavations and tunneling in soft ground. In Proceedings of the 7th International Conference on Soil Mechanics and Foundation Engineering, Mexico City, Mexico, 25 August 1969; pp. 225–290. [Google Scholar]
  3. Sagaseta, C. Analysis of undraind soil deformation due to ground loss. Geotechnique 1987, 37, 301–312. [Google Scholar] [CrossRef]
  4. Verruijt, A.; Booker, J.R. Surface settlements due to deformation of a tunnel in an elastic half plane. Geotechnique 1996, 46, 753–756. [Google Scholar] [CrossRef]
  5. Li, S.H.; Zhang, M.J.; Li, P.F. Analytical solutions to ground settlement induced by ground loss and construction loadings during curved shield tunneling. J. Zhejiang Univ. Sci. A 2021, 37, 296–313. [Google Scholar] [CrossRef]
  6. Wei, G.; Xu, R.Q. Prediction of longitudinal ground deformation due to tunnel construction with shield in soft soil. Chin. J. Geotech. Eng. 2005, 9, 1077–1081. [Google Scholar]
  7. Ouyang, W.B.; Ding, W.Q.; Xie, D.W. Calculation method for settlement due to shield tunnelling considering structure stiffness. Chin. J. Undergr. Space Eng. 2013, 9, 155–160. [Google Scholar]
  8. Lai, H.P.; Wang, T.T.; Kang, Z. Theoretical method of chamber pressure for EPB shield tunneling under-crossing existing metro tunnels. KSCE J. Civ. Eng. 2021, 25, 2725–2736. [Google Scholar] [CrossRef]
  9. Jin, D.L.; Shen, X.; Yuan, D.J. Theoretical analysis of three-dimensional ground displacements induced by shield tunneling. Appl. Math. Model 2020, 79, 85–105. [Google Scholar] [CrossRef]
  10. Fang, Y.; Chen, Z.T.; Tao, L.M. Model tests on longitudinal surface settlement caused by shield tunnelling in sandy soil. Sustain. Cities Soc. 2019, 47, 101504. [Google Scholar] [CrossRef]
  11. Hu, X.Y.; He, C.; Walton, G.; Fang, Y.; Dai, G.H. Laboratory model test of EPB shield tunneling in a Cobble-Rich soil. J. Geotech. Geoenviron. Eng. 2020, 146, 4020112. [Google Scholar] [CrossRef]
  12. Huang, Z.; Zhang, C.L.; Fu, H.L. Numerical study on the disturbance effect of short-distance parallel shield tunnelling undercrossing existing tunnels. Adv. Civ. Eng. 2020, 2020, 8810658. [Google Scholar] [CrossRef]
  13. Lin, X.T.; Chen, R.P.; Wu, H.N. Deformation behaviors of existing tunnels caused by shield tunneling undercrossing with oblique angle. Tunn. Undergr. Space Technol. 2019, 89, 78–90. [Google Scholar] [CrossRef]
  14. Liu, Z.; Ming, W.H.; Li, J.M.; Zhou, C.Y.; Zhang, L.H. Numerical prediction of the optimal shield tunneling strategy for tunnel construction in karst regions. PLoS ONE 2021, 16, e0252733. [Google Scholar] [CrossRef]
  15. Nagel, F.; Stascheit, J.; Meschke, G. Numerical simulation of interactions between the shield-supported tunnel construction process and the response of soft water-saturated soils. Int. J. Geomech. 2012, 12, 689–696. [Google Scholar] [CrossRef]
  16. Gong, C.J.; Ding, W.Q.; Xie, D.W. Twin EPB tunneling-induced deformation and assessment of a historical masonry building on Shanghai soft clay. Tunn. Undergr. Space Technol. 2020, 98, 103300. [Google Scholar] [CrossRef]
  17. Dai, X.; Guo, W.; Cheng, X.S.; Huo, H.F.; Liu, G.G. Field measurement and numerical analysis for evaluating longitudinal settlement induced by shield tunneling parallel to building. Rock Soil Mech. 2021, 42, 233–244. [Google Scholar] [CrossRef]
  18. Sirivachiraporn, A.; Phienwej, N. Ground movements in EPB shield tunneling of Bangkok subway project and impacts on adjacent buildings. Tunn. Undergr. Space Technol. 2012, 30, 10–24. [Google Scholar] [CrossRef]
  19. Zhu, J.T. Influence Zoning Analysis of Shield Tunneling on Adjacent Building and Its Numerical Simulation; Anhui Jianzhu University: Hefei, China, 2018. [Google Scholar]
  20. Tao, S.H. Application of Peck formula in Quasi-rectangular shield tunnel construction in soft ground. Subgrade Eng. 2021, 2021, 153–157. [Google Scholar]
  21. Huang, Z.; Zhang, H.; Fu, H.L.; Ma, S.K.; Liu, Y. Deformation response induced by surcharge loading above shallow shield tunnels in soft soil. KSCE J. Civ. Eng. 2020, 24, 2533–2545. [Google Scholar] [CrossRef]
  22. Lv, X.L.; Li, F.D.; Huang, M.S.; Wan, J.L. Three-dimensional numerical and analytical solutions of limit support pressure at shield tunnel face. J. Tongji Univ. 2012, 40, 1469–1473. [Google Scholar]
  23. Lv, X.L.; Wang, H.R.; Huang, M.S. Limit theoretical study on face stability of shield tunnels. Chin. J. Geotech. Eng. 2011, 33, 57–62. [Google Scholar]
  24. Schanz, T.; Vermeer, P.A.; Bonnier, P.G. The hardening soil model: Formulation and verification. In Plaxis Symposium on beyond 2000 in Computational Geotechnics; Taylor & Francis Group: London, UK, 1999; pp. 281–296. [Google Scholar]
  25. Huang, B.Q.; Zhu, H.H. Volumetric yielding mechanism of hardening-soil model and its constitutive integration algorithm. Rock Soil Mech. 2015, 36, 31–37, 42. [Google Scholar]
  26. Ye, F.; Gou, C.F.; Mao, J.H.; Yang, P.B.; Chen, Z.; Jia, T. Calculation of critical grouting pressure during shield tunneling in clay stratum and analysis of the influencing factors. Rock Soil Mech. 2015, 36, 937–945. [Google Scholar]
  27. Li, S.H.; Song, Z.P. Research on the calculation of the settlement width through influenced by shield tunneling. Highway 2018, 63, 302–308. [Google Scholar]
  28. Lee, K.M.; Rowe, R.K. Subsidence owing to tunnelling. II. Evaluation of a prediction technique. Can. Geotech. J. 1992, 29, 941–954. [Google Scholar] [CrossRef]
  29. Zhu, C.H.; Li, L. Estimation and regularity analysis of maximal surface settlement induced by subway construction. Chin. J. Rock Mech. Eng. 2017, 36, 3543–3560. [Google Scholar]
  30. Wei, X.J.; Zhang, J.J.; Zhang, S.M. Grope for shield tunnel construction induced ground maximal settlement. Rock Soil Mech. 2008, 29, 445–448. [Google Scholar]
  31. Atkinson, J.H.; Potts, D.M. Subsidence above shallow tunnels in soft ground. J. Geotech. Eng. Div. 1977, 103, 307–325. [Google Scholar] [CrossRef]
  32. Clough, G.W.; Schmidt, B. Design and Performance of Excavations and Tunnels in Soft Clay; Elsevier Science Publishing Company: New York, NY, USA, 1981; pp. 569–634. [Google Scholar] [CrossRef]
  33. Ministry of Housing and Urban Rural Development of the people’s Republic of China. Code for Deformation Measurement of Building and Structure JGJ8-2016; Construction Industry Press: Beijing, China, 2016.
  34. Chou, W.G.; Sun, K.Q.; Zheng, Q.; Lu, F. Study on influence division of fill and excavation above tunnel by the initial depth. China Civ. Eng. J. 2017, 50, 8–13. [Google Scholar]
  35. China Academy of Building Research Technical. Code for Tall Building Raft Foundations and Box Foundations JGJ6-2011; China Architecture & Building Press: Beijing, China, 2011. [Google Scholar]
  36. Zhang, Z.G.; Chou, W.G. Study of the zones influenced by the construction of metro running tunnels approaching existing buildings. Mod. Tunn. Technol. 2016, 53, 75–82. [Google Scholar]
Figure 1. Construction of the numerical model and simulation of shield tunneling process. (a) The refined numerical model. (b) The simulation of shield tunneling process.
Sustainability 14 13391 g001aSustainability 14 13391 g001b
Figure 2. Three-dimensional model of the soft soil layer.
Sustainability 14 13391 g002
Figure 3. The comparison between the theoretical and the numerical solution of the maximum settlement.
Sustainability 14 13391 g003
Figure 4. Distance and settlement curves at different burial depths.
Sustainability 14 13391 g004
Figure 5. The horizontal section of the settlement curve of the monitoring point A under different H.
Sustainability 14 13391 g005
Figure 6. The curve of the shield tunneling depth and stage displacement under different H.
Sustainability 14 13391 g006
Figure 7. Effect of different D on S.
Sustainability 14 13391 g007
Figure 8. The deformation curve of the foundation slab. (a) Maximum subsidence. (b) Maximum floating value.
Sustainability 14 13391 g008
Figure 9. Internal force increment curve of building slab and column structure. (a) Building slab structure. (b) Building column structure.
Sustainability 14 13391 g009
Figure 10. The schematic diagram of the inclination.
Sustainability 14 13391 g010
Figure 11. Maximum horizontal inclination curve of the column a1.
Sustainability 14 13391 g011
Figure 12. The horizontal inclination value of the a1 column with L and building deformation (H = 6 m). (a) Inclination value of the a1 column with L. (b) Building deformation.
Sustainability 14 13391 g012
Figure 13. Variation curve of safety factor and its relative ratio with H. (a) Building load = 0.27 MPa. (b) Building load = 0.38 MPa. (c) Building load = 0.5 MPa.
Sustainability 14 13391 g013
Figure 14. Schematic diagram of safety factor under different building loads.
Sustainability 14 13391 g014
Figure 15. Variation curve of ξ with D under different H. (a) Building load = 0.27 MPa. (b) Building load = 0.38 MPa. (c) Building load = 0.5 MPa.
Sustainability 14 13391 g015
Table 1. The formation parameters of the soft soil.
LayerThickness/d
(m)
Unit Weight of Soil/γ (kN·m−3) E 50 ref
(kN m−2)
E oed ref
(kN m−2)
E ur ref
(kN m−2)
Cohesion/c
(kN·m−2)
Internal Friction Angle/φ
(°)
Vur
Plain fill6.4517.811.25 × 1039 × 10355.56 × 1035250.25
Mucky clay31920 × 10325.61 × 10394.84 × 10310180.2
Clay1.419.713.5 × 10313.5 × 10340.5 × 10327220.2
Plastic oak Sandy clay8.118.330 × 10336 × 103110.8 × 1035250.2
Weathered rock16.052015 × 10315 × 10345 × 10325320.2
Notes: In Table 1, E 50 ref is the secant stiffness of the standard triaxial drainage test; E oed ref is the tangent stiffness of the side limit compression test; E ur ref is the unloading/reloading stiffness; and vur is the Poisson ratio of unloading/reloading.
Table 2. The material parameters of the shield and the building.
MaterialSevere/γ
(kN·m−3)
Elastic Modulus/E
(kN/m−2)
Thickness/d (m)Poisson’s Ratio/v
Lining2727.6 × 1060.30.167
Shield machine plate and shell plate and shell12023 × 1060.30
Floor2530 × 1060.10
Foundation side wall2530 × 1060.20
Foundation slab2530 × 1060.250
Beam2530 × 106//
Notes: The materials used for construction shown in Table 2 are elastic, the cross-sectional area of beam material is 0.36 m2, and the moment of inertia equals to 0.0108 m4.
Table 3. The change rate of the surface settlement.
Change RateH = 6 mH = 9 mH = 12 mH = 15 mH = 18 m
D = 0–5 m41.1%13.1%10.1%6.5%7.6%
D = 5–10 m45.4%34.4%25.2%15.8%15.6%
D = 10–15 m25.4%40.6%34.0%29.5%24.3%
D = 15–20 m42.3%36.2%38.7%37.3%34.6%
D = 20–25 m38.9%43.5%41.9%39.6%40.9%
D = 25–30 m57.1%48.5%44.6%40.5%37.9%
D = 30–35 m54.1%50.6%44.9%40.5%39.5%
Table 4. Maximum settlement difference of adjacent columns at different positions.
Maximum Settlement Difference of Adjacent Columns (mm)H = 6 mH = 9 mH = 12 m
D = 0 m8.7639.41007.821
D = 5 m16.70012.5048.261
D = 10 m12.70110.7368.394
D = 15 m13.88211.3307.741
D = 20 m15.51812.7568.855
D = 25 m8.6007.6546.993
D = 30 m12.60011.1749.065
D = 35 m6.3977.8757.897
Table 5. Area distribution ratio of strong, weak, and no influence areas.
Influence Area7 Floors (0.27 MPa)10 Floors (0.38 MPa)13 Floors (0.5 MPa)
Strong influence area20.0%20.0%20.0%
Weak influence area22.5%27.5%35%
No influence area57.5%52.5%45%
Publisher’s Note: MDPI stays neutral with regard to jurisdictional claims in published maps and institutional affiliations.

