Article

Assessment of Hydro-Agricultural Infrastructures in Burkina Faso by Using Multiple Correspondence Analysis Approach

1
Spheres Research Unit, Water, Environment and Development Laboratory, Environmental Sciences and Management Department, Arlon Campus Environment, University of Liège, 185 Avenue de Longwy, 6700 Arlon, Belgium
2
Ministry in Charge of Agriculture and Irrigation, Ouagadougou 03 BP 7005, Burkina Faso
3
Department of Natural Resources Management, Institute of Environment and Agricultural Research, Ouagadougou 04 BP 8645, Burkina Faso
4
Institute of Environmental Sciences and Rural Development, University of Dédougou, Dédougou 09 BP 176, Burkina Faso
5
Sahara and Sahel Observatory, BP 31, Carthage 1080, Tunisia
6
Institute of Environmental Science, Engineering and Management Industrial University of Ho Chi Minh City, Ho Chi Minh City 700000, Vietnam
*
Author to whom correspondence should be addressed.
Sustainability 2022, 14(20), 13303; https://doi.org/10.3390/su142013303
Submission received: 14 September 2022 / Revised: 5 October 2022 / Accepted: 12 October 2022 / Published: 16 October 2022

Abstract

:
Due to the semi-arid nature of the Sahelian countries in Africa, irrigation infrastructures are essential in supporting the improvement of agricultural production. Their proper operation is, therefore, a key indicator for the sustainable development of agriculture in this region. However, there is a lack of critical assessment on the operating state of these hydro-agricultural facilities in Burkina Faso. In this study, we applied a multiple correspondence analysis (MCA) to 4070 hydro-agricultural facilities from 1950 to 2020 and classified them according to the Permanent Interstate Committee for Drought Control in the Sahel’s (CILSS) typology classification system (Type 1 to Type 5). The MCA made it possible to see the relationships between a development typology and variables such as “functionality”, “condition of the development”, or “year of construction”. The results indicate that the irrigated lands with surface areas of less than 100 ha, which were funded by the government or organizations (associations, NGOs) and managed by local communities, are the least functional ones and in bad condition. Their dysfunction indeed conceals deep-seated causes that have not yet been resolved as the infrastructures keep on deteriorating. Therefore, establishing a sustainable and efficient management system for these agricultural infrastructures is imperative. The findings of this study can be used as a practical decision-making tool for implementing agricultural policies in the Sahel region.

1. Introduction

Since the beginning of the 1970s, all African tropical countries in the south of the Sahara have experienced chronic droughts, the most catastrophic of which occurred in the years 1972–74 and 1983–84 [1]. In Burkina Faso, the fight against the droughts during those years was the basis for implementing strategies calling for water control to improve agricultural productivity. Several types of development were created, namely the development of extensive plains (Sourou valley, Kou valley, Bagré site, SOSUCO sugarcane farm) and the construction of numerous small dams and associated irrigation schemes. However, these infrastructures have been little used, and management is mainly deficient [2].
Hydro-agricultural developments in Burkina Faso took off in the 1970s. They raised much hope by providing several annual harvests for producers and strengthening their resilience to the climatic hazards inherent for rainfed crops [3]. Management difficulties have severely limited productivity, leading to farmer disaffection. These difficulties include the deterioration of the water infrastructure, problems of organization or cooperation among farmers, land tenure, management problems, and the absence of secure outlets and structures for the disposal and packaging of crops [3,4,5,6,7]. The state of the water infrastructure, which is becoming increasingly expensive nowadays, is deteriorating quite rapidly [8]. The well-known downward spiral of construction–neglect–rehabilitation is an old management problem and is still a significant reason for institutional redesign and modernization [9]. While it is true that investments in irrigation and government-led irrigation management have contributed to a significant increase in food production, the performance of many irrigation systems has generally fallen short of expectations [10]. Moreover, the maintenance and safety situation of the hydraulic schemes at the technical level is characterized by a general failure of the Operation and Maintenance (O&M) function, and this is especially alarming at the level of the many dams (not) managed by local groups [11].
From the beginning of irrigation in the 1960s to the 1990s, irrigation development took the form of large-scale and small-scale village schemes. However, from the 2000s onwards, Burkina Faso’s authorities have encouraged individual initiatives to develop an informal irrigation sector oriented toward producing high-value-added crops while continuing to create large- and medium-sized schemes [12,13]. Additionally, from the 2000s onwards, particular emphasis has been placed on small-scale irrigation, given the difficulties encountered in the various types of facilities, and as part of the promotion of individual or private initiative. This new method is intended essentially for crops other than rice [2] and, to a lesser extent, for the extension and rehabilitation of large schemes. Since then, small-scale private irrigation has begun to occupy an important place in national strategies and policies [14,15,16,17].
The causes that could explain the practical functioning problems in the irrigated systems are, among others, the application of Structural Adjustment Policies (SAP) [18,19,20,21,22,23]. Indeed, financial logic has largely taken precedence over the logic of participatory development which is based on training and support for producers. The improvement of the latter’s families’ living standards through better productivity of the land, their quality of water and mostly their work is often more motivating than active participation in the co-management of infrastructures that are generally designed without their involvement [24]. The socio-economic context of the time and the imperatives of the SAP led the Burkinabe government to disengage from the processes of agro-pastoral production or the direct management of hydro-agricultural facilities [20]. This withdrawal of the public authorities should be a gradual and reasoned transfer of their responsibilities and functions to the private sector and autonomous farmers’ organizations. The success of this gamble should be conditioned by assurances that the conditions for this disengagement of the state are met; farmers’ organizations should be ready to assume management responsibilities; and the new roles and functions of the state should be able to guarantee the proper use of the schemes and the necessary valorization of the investments made [18]. Cultural, institutional and organizational constraints penalize the functioning of farmers’ organizations and limit the performance of irrigated areas [21]. Illiteracy and insufficient training of actors is also a characteristic of small-scale irrigators. This situation and their low level of organization limit their business and negotiation capacities and make it difficult for them to access equipment, inputs and other modern production factors. Furthermore, the know-how and skills required for the actors working in the irrigated areas are not always sufficient. Thus, water management is often left to a farmer assisted by a supervisor who does not always master water management and the maintenance of works, due to a lack of appropriate training, although he is familiar with agricultural production techniques [25].
Given the difficulties in managing hydro-agricultural schemes, decision-makers and donors are wondering what type and size of schemes to promote (small- or large-scale irrigation), their management mode (collective or individual) and the crops to favor (rice, trees, market gardens or mixed crops). This reflection takes place in a context of water scarcity, increasing competition between agricultural and non-agricultural uses and concerns about protecting natural ecosystems [13,26,27,28,29,30,31]. However, there is still a lack of precise diagnoses or inventories of hydro-agricultural infrastructures organized by the category of development that can guide decision-makers on the types of development that most need to be supported. It is therefore urgent to carry out a general diagnosis of hydro-agricultural facilities by typology and to highlight the types of facilities that are suffering from management problems in order to guide actions for the improvement of irrigated systems’ performance.
Although diagnoses and assessments have been made by several authors, such as [2,3,11,14,18,24,27,32,33,34], we are witnessing a continuous degradation of irrigated systems.
The objective of this inventory is to characterize agricultural facilities in Burkina Faso and to highlight the types of facilities that have the highest rate of dysfunction from a physical point of view. In fact, the observation that infrastructure is dysfunctional is tantamount to showing that there are organizational difficulties in the operation and maintenance of this infrastructure and equipment. Thus, if we succeed in showing the characteristics of the least functional facilities, this will be useful to decision-makers in orienting their actions in the search for solutions.
The present work also aims at improving knowledge of the state of irrigation infrastructure in Burkina Faso. Indeed, due to the lack of data on the physical state of the hydro-agricultural facilities, such an assessment has not always been easy to establish.
Most of the assessments are made by presenting the balance of achievements and existing potential as well as the difficulties encountered by irrigated agriculture. These assessments are generally established using descriptive statistics. In the present study, our approach will be to use a method that allows us to answer questions such as: What is the link between a development typology and the variable functionality or the condition of the hydro-agricultural development? What is the period during which a typology starts its development or stops its growth? What is the type of water resource or means of extraction linked to a given development typology? Lastly, what general trends can be identified?

2. Materials and Methods

2.1. Study Area

Burkina Faso is a land-locked continental country located in the heart of West Africa (between 9°20′ and 15°05′ north latitude, and 5°20′ west longitude and 2°03′ east longitude) (Figure 1). It has a land area of 274,000 km2 and is a neighbor to six countries (Benin, Côte d’Ivoire, Ghana, Mali, Niger and Togo). Burkina Faso therefore remains a crossroads for trade in the sub-region and a transit country between the Sahelian countries (Mali, Niger) and the coastal countries. Its closest point to the Atlantic Ocean is 500 km away [12].
Burkina Faso’s climate is dry and tropical with a relatively long dry season and a short wet season. From north to south, three climate zones can be distinguished [35]: (i) the Sahelian zone in the north with an annual rainfall of less than 600 mm; (ii) the Northern Sudanese zone, located between 11°30′ and 14° north latitude, with an annual rainfall of between 600 and 900 mm; and (iii) the Southern Sudanese zone, located south of 11°30′ north latitude, with an annual rainfall of between 900 and 1200 mm.
The hydrographic network that drains the country is linked to three international watersheds: the Volta, the Niger and the Comoé. These three basins are subdivided into four national watersheds over the territory of Burkina Faso. They cover the national territory in the following proportions: the Mouhoun basin (33%), the Nakanbé basin (30%), the Niger basin (30%) and the Comoé basin (7%). Finally, at a lower level, these four national basins are subdivided into 17 national sub-watersheds [36]. This hydrographic network is fairly dense, but most of the rivers have a temporary flow and their flows show decreasing trends. Only a few rivers in the Comoé, Mouhoun and Léraba provinces (west) have a permanent flow.

2.2. The Database

In view of the large number of hydro-agricultural developments throughout the country and the lack of data allowing the projections of consistent actions with existing achievements, the ministry in charge of agriculture in Burkina Faso, through the department in charge of hydro-agricultural developments, has taken the option of equipping itself with a minimum of tools and means necessary for the knowledge of achievements in terms of hydro-agricultural developments [37]. This initiative has made it possible to recruit consultancy firms to carry out a nationwide survey to identify hydro-agricultural developments completed in 31 December 2019. These data were then completed by additional surveys with the collaboration of the regional directorates of the Ministry of Agriculture until 31 December 2020. The processed and analyzed data are those from these surveys [38]. The database contents are detailed below.

2.3. Description and Explanation of Variables and Concepts

2.3.1. Hydro-Agricultural Development Data

The database of hydro-agricultural developments includes 142 variables divided into six main categories of data: (1) administrative and location; (2) development and operation; (3) crops data; (4) organization and management; (5) water mobilization structure and management; and (6) the means of water extraction.
In the framework of our study, we are interested in the data that allow us to characterize the facilities according to the typology defined by the Permanent Inter-State Committee for Drought Control in the Sahel (CILSS), as well as the variables that allow us to assess their physical condition.
The data on each hydro-agricultural development identified and used for our analyses are: (i) type of hydro-agricultural development, (ii) area developed, (iii) year of completion, (iv) initiative, (v) functionality, (vi) condition or state, (vii) type of workforce, (viii) main water resource, (ix) means of water extraction, and (x) typology of the hydro-agricultural development. The definitions of the 10 variables used in the analysis are provided in Appendix A.

2.3.2. Choice of Statistical Method

After pruning the database of variables and individuals that would not be used in the analysis, we had 4070 individuals and ten qualitative variables (See Table 1). A first approach was to conduct an exploratory analysis without knowing a priori the links between the variables.
A multiple correspondence analysis (MCA) is a descriptive method which makes it possible to study the links between several qualitative variables [39]. This method was chosen firstly because of the nature of our qualitative variables. Additionally, the MCA is a method well adapted to exploring surveys [40].
Most of the assessments of hydro-agricultural developments in Burkina Faso were not conducted with an exploratory analysis approach, generally due to the kind of data available. Therefore, this being the first time that a general census of the developments has been carried out, it was necessary to find a way of using these data to produce useful information for decision-makers. In addition, we felt it was important to use another approach to highlight phenomena that could exist and persist since the beginning of hydro-agricultural infrastructures in Burkina Faso.

2.3.3. The MCA Principles

A correspondence analysis is a well-established method in the family of multivariate data analysis methods, which first appeared in the 1960s [41,42]. The objective of correspondence analyses is to obtain a graphical representation of the original data matrix in as few dimensions as possible [43]. An MCA is an exploratory method of graphing associations between variables in large categorical datasets to explore their relationships [42,44].
The principle of the MCA is to study the links that may exist between the p (p > 2) variables considered [45]. In the present study, the MCA is used to highlight the characteristic features of a typology of hydro-agricultural development according to the CILSS classification. Then it relates a given typology of hydro-agricultural development with variables such as “functionality “, “year of completion “, and “condition “. The variables and the corresponding modalities are shown in Table 1.

2.4. Interpretation of the MCA Results

2.4.1. The Key Stages and Concepts of Interpretation

The interpretation of the results of an MCA is roughly the same as in a correspondence analysis on a contingency table and in a principal component analysis (PCA) [45]. It should be noted here that the percentages of inertia or variance are of limited interest. The selection and interpretation of the factorial axes will be performed essentially with the help of the contributions of the active variables and the test values associated with the additional variables. Interpreting an axis means finding what is similar, on the one hand, between all the elements to the right of the origin and, on the other hand, between all that is written to the left. One then must express concisely and precisely the contrast (or opposition) between the two extremes [41].

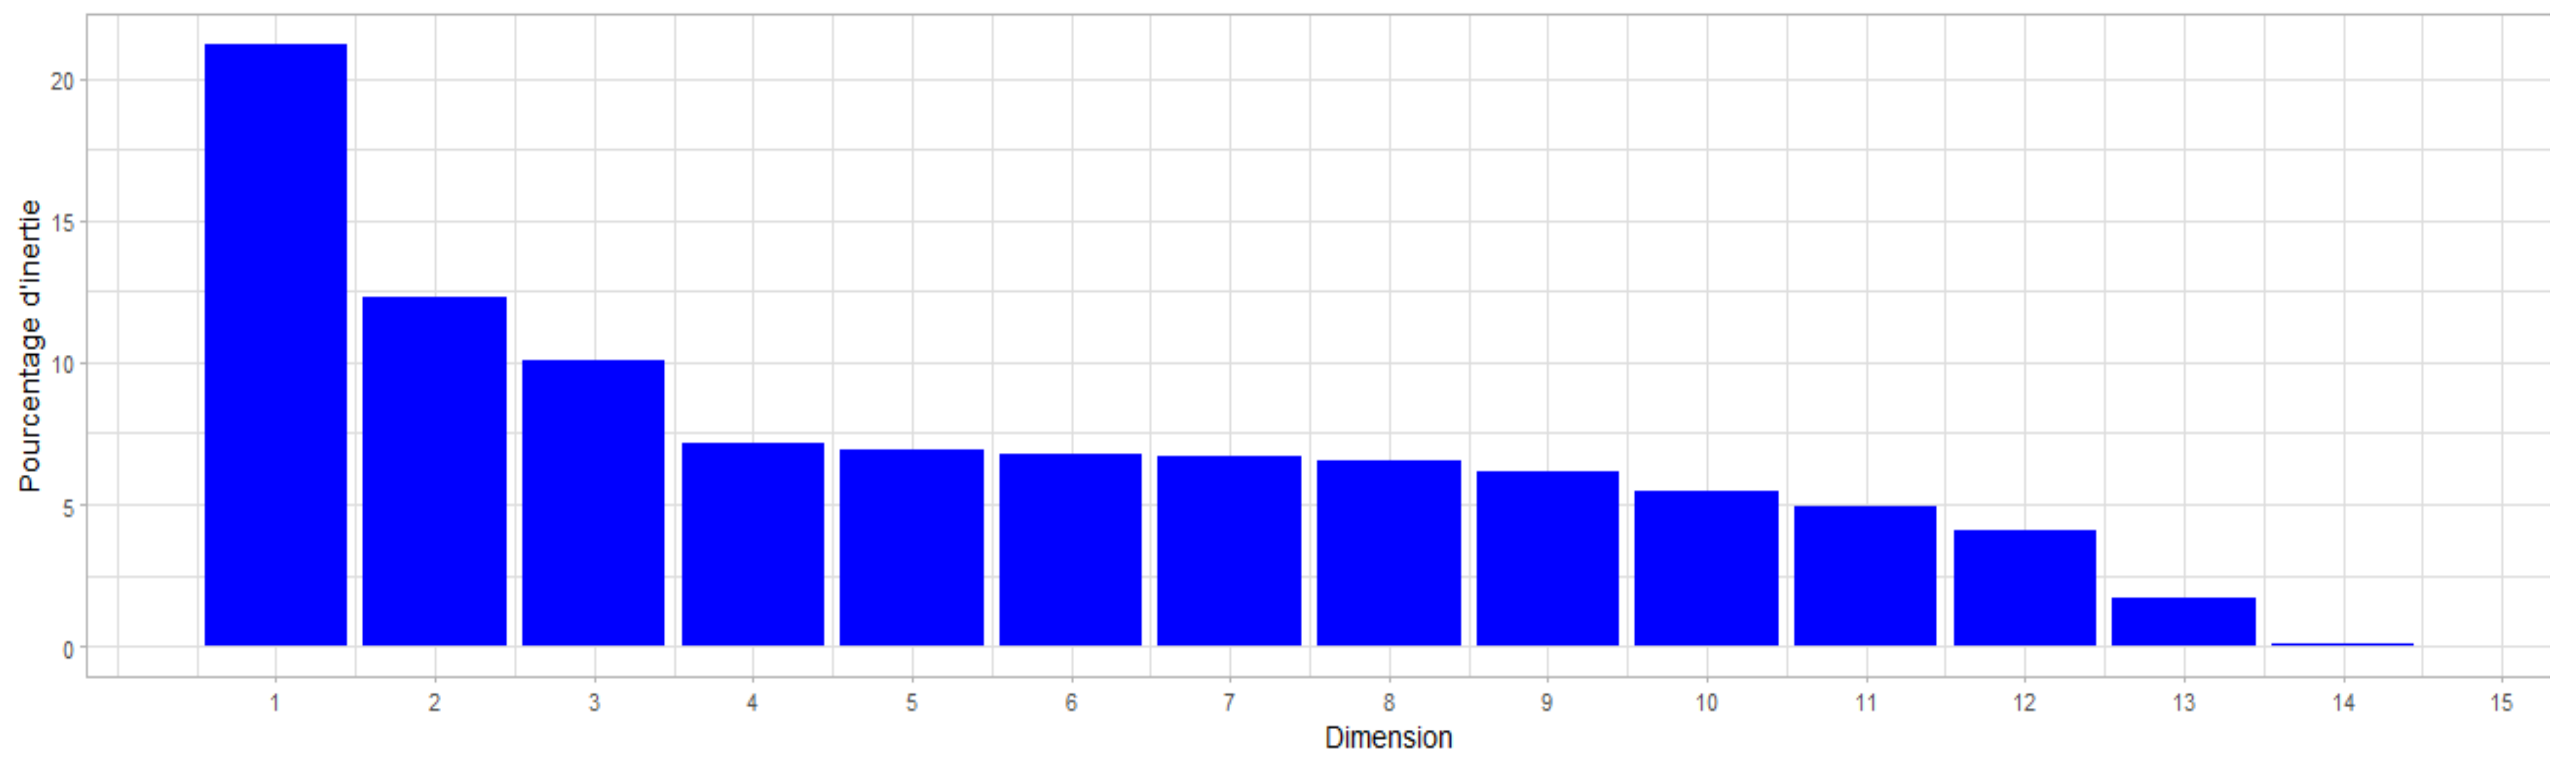
2.4.2. The Number of Axes to Be Retained

There is no clear rule for limiting the number of axes considered [39]. In the case of our study, Figure 2 and Table 2 show the eigenvalue scree and the inertia rates related to each dimension. The eigenvalues are very dispersed, which is one of the intrinsic characteristics of the MCA. The first three dimensions will be retained. These first three axes cover 43.54% of the information. Indeed, the interpretation of the first three dimensions allowed us to meet the objectives of our study.

2.4.3. The Notion of Contribution (Ctr)

The contribution of a point to an axis is a statistic that depends on both the distance between the point and the origin along the axis and the weight of the point. The contributions of the points to the axes are a major aid to interpretation [41,46]. For each point in the cloud, there is an amount of variance due to the point. The proportion of the variance of the cloud due to the point, denoted by Ctr, is called the contribution of the point to the cloud [41].

2.4.4. Difficulties in Interpretation

The difficulty of interpreting the results of an MCA depends on the data under study. It is a subjective process since it is carried out by each person according to his or her intuitions and requires a collaboration between a statistician who masters the method and a specialist who is familiar with the data being processed [39]. In the context of our study, we discussed our results in relation to the results of other studies and the major events marking the development of hydro-agricultural infrastructure in Burkina Faso in order to support or qualify our observations.

2.4.5. The General Principle of Interpretation

The general principle is to identify the modalities with significant contributions on the axes and then to look at their positioning on the figures. Given that comparing the contribution of a modality (j) to its weight is equivalent to comparing its coordinate on the k-axis (akj) to the eigenvalue associated with this axis (µk), a modality will have a significant contribution if its coordinate is strictly greater than the square root of the eigenvalue associated with the axis a j k > | μ k [45]. In the case of our study, for the first dimension (Dim1), we retained an important mode if its coordinate is greater than 0.80. This value is nothing more than the square root of the variance of the first dimension. On the second dimension (Dim2), a category is important when its coordinate is greater than 0.61. As for the third dimension (Dim3), a modality has a significant contribution when its coordinate is greater than 0.55.

2.4.6. Additional Elements in an MCA

Additional elements considerably enrich the interpretation of the data [41]. Supplementary items are used a posteriori to characterize the axes. Their introduction into the factor analysis is a fundamental contribution because it will allow the interpretation of the factors to be reinforced and enriched [47]. An additional variable will have a significant correlation with an axis if its test value on this axis is greater than or equal to 2 [40,47]. In the present study, the variables taken as supplementary are: (1) the typology of the development; (2) its functionality; (3) its condition; (4) the area developed; and (5) the year of the development. Indeed, the typology of the facility, its functionality and its condition are the main variables to be explained. It is therefore not appropriate to include them in the construction of the factorial axes. The year of construction and the surface area are quantitative variables at the outset, which were made qualitative by dividing them into classes. We have therefore kept them as additional variables.

2.4.7. The Tools Used

The multiple correspondence analysis (MCA) was carried out with the software R and the packages FactoMineR and Factoshiny [48,49].

3. Results

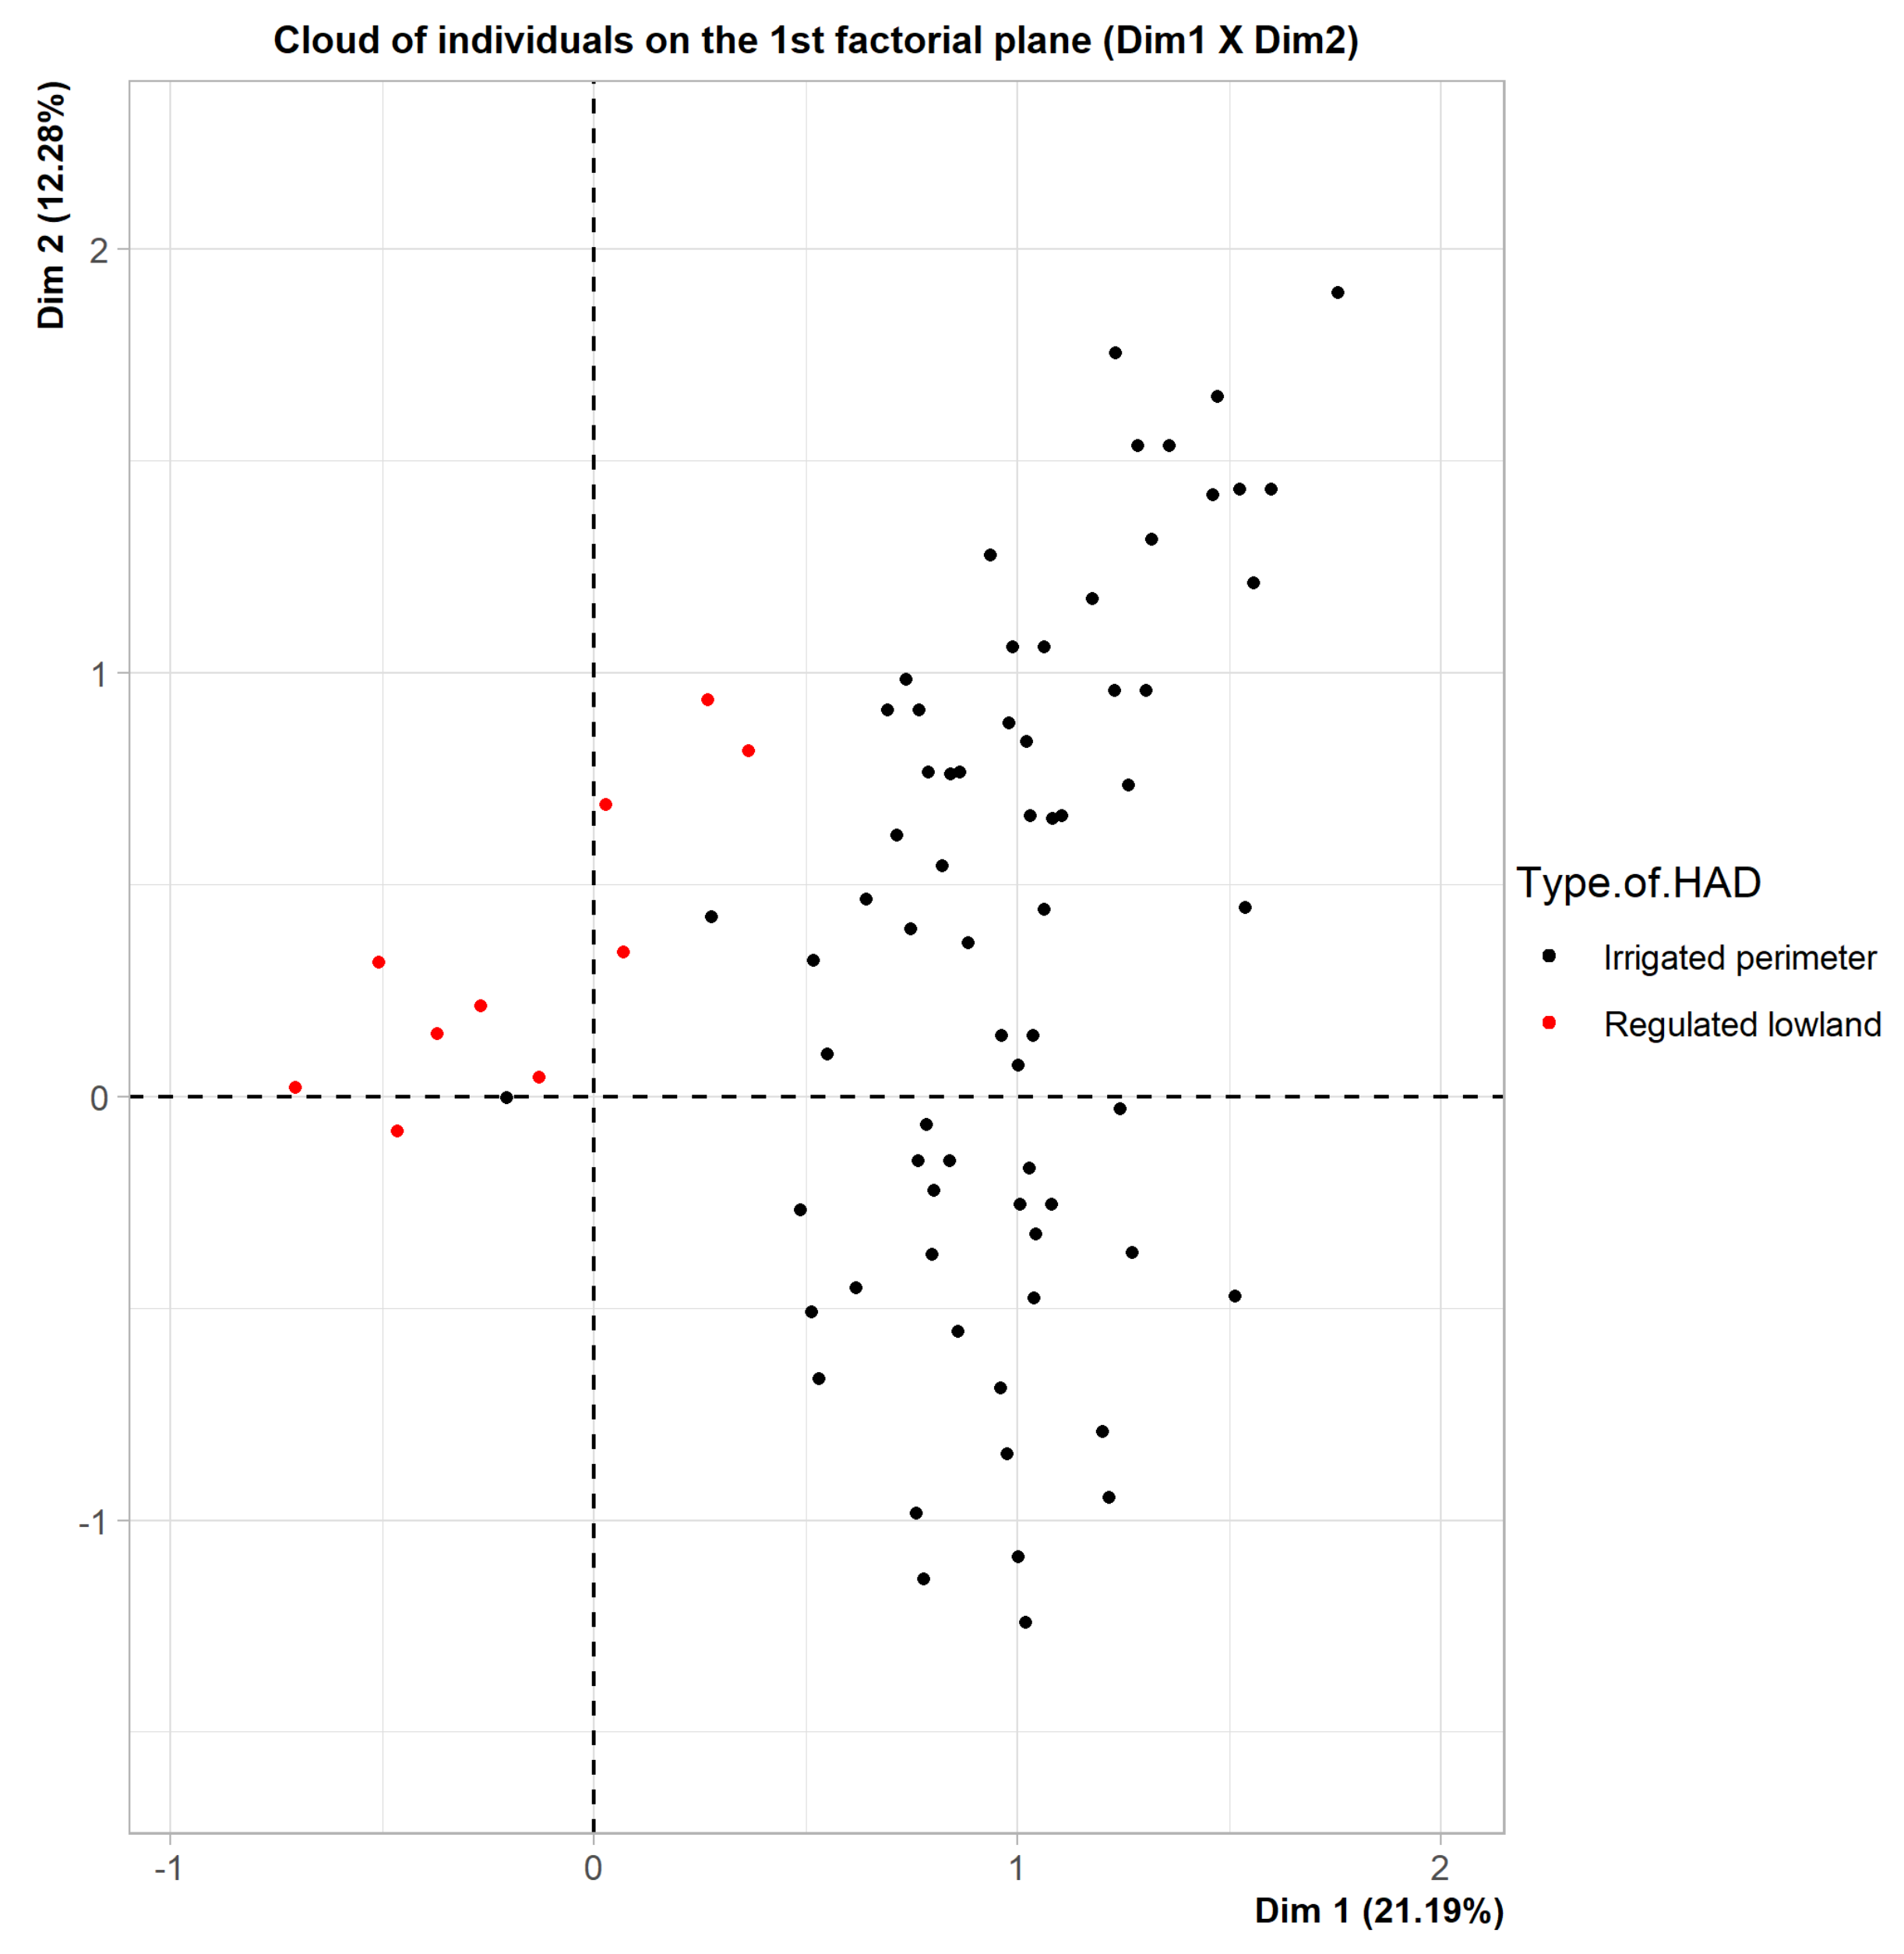
3.1. General Appearance of the Cloud of Individuals

The general appearance of the cloud of individuals on the first factorial plane (Dim1 X Dim2) highlights two distinct classes (Figure 3). These classes will strongly dominate the interpretations; on the left, there are the regulated lowlands, and on the right, the irrigated perimeters. In our sample of 4070 individuals, we have 2382 regulated lowlands against 1688 irrigated perimeters. The small number of projected points in Figure 3 indicates that the projected points are mostly overlapping. Indeed, most of the individuals in the regulated lowland category chose the same modalities.

3.2. Interpretation of the Different Dimensions without Additional Variables

Figure 4 illustrates the three dimensions that were kept in our MCA. They can be interpreted in the following ways:
The first dimension (Dim1) can be summarized as a “characterization of hydro-agricultural facilities”. It opposes the types of development, the types of water mobilization works and the means of water extraction. In Figure 4a, in terms of negative values, the important modalities are regulated lowland (−0.83), runoff water (−0.83), and natural onflow (−0.82). In positive terms, the important modalities are irrigated perimeter (1.17), employee (1.88), dam (1.09), bouli (1.08), river (1.39), drilling (1.22), lake (2.02), well (1.14), bypass (0.84), manual (1.13), pumping (1.23) and downstream intake (1.02). The modalities identified above (strong correlation with Dim1) characterize, on the one hand, the regulated lowlands with runoff as a water source and natural onflow as a means of water extraction. On the other hand, the irrigated perimeters have dams, rivers, boulis, drilling, lakes and wells as works used to mobilize water, with downstream intake, pumping, bypasses, or manual means of extraction.
The second dimension (Dim2) is that of the “differentiation of the types of irrigated perimeters”. It tends to discriminate between irrigated perimeters according to the type of water resource mobilization work and the means of water extraction. In terms of negative values, Figure 4a shows the modalities that have a significant contribution to the formation of the axis: manual (−1.72), well (−1.67) and bouli (−1.20). In positive terms, the important modalities are: employee (2.23), family and employee (0.79), dam (1.33), river (1.33), lake (2.73), drilling (0.65), downstream intake (1.72), bypass (1.51) and pumping (1.06). The manual extraction of water with a well or a bouli as the water mobilization work will characterize a category of irrigated perimeters. The same will be valid for the dam, the river and the borehole with downstream extraction, diversion, or pumping.
Finally, the third dimension (Dim3) is “irrigated perimeters, water resources, extraction means and workforce”. This axis can be interpreted as the axis of opposition between perimeters irrigated by a dam with downstream intake works and a diverse workforce (family and employee) and another category of irrigated perimeters with the river, the borehole, the pond or the lake as the water mobilization works with a salaried workforce. In terms of negative values, Figure 4b shows the modalities that have a significant contribution: downstream intake (−3.84), dam (−1.59) then family and employee (−0.76). In positive terms, the important modalities are: private (0.63), employee (3.5), river (2.00), drilling (0.87), lake (4.36) and pond (3.62).

3.3. Interpretation of the Different Dimensions with Additional Variables

Figure 5 is the graphical representation of the modalities of the additional variables. It can be interpreted as follows:
Dim1 can be labelled “typology, area, year of completion”. Figure 5a shows that Axis 1 discriminates between Type 1 schemes on the left and Types 2, 3, 4, and 5 on the right. Type 1 is found on the side of areas between 10 and 100 ha, mostly built between 2011 and 2020 and mostly in bad condition. The other types are generally less than or equal to 10 ha or are more than 100 ha in size and were mostly built before 2000. The modalities that have a significant negative test value are Type 1 (−62.45), developments with an area of more than 10 ha and less than or equal to 100 ha (([10 ha–20 ha], −14.33), ([20 ha–50 ha], −19.62), ([50 ha–100 ha], −4.51)), bad condition (−3.37) and years of completion between 2011 and 2020 ([2011–2020], −8.28). In terms of the positive values, the modalities are: Type 2 (40.28), Type 3 (34.88), Type 4 (7.00), the developed areas less than or equal to 10 ha ([<=10 ha], 30.50), the developments with an area greater than 100 ha ([100 ha >= [, 3.84), good condition (7.15), and years of development from before 1980 to 2000: ([<=1980], 7.45), ([1981–1990], 7.83), ([1991–2000], 5.61).
Dim2 can be summarized as “typology and area developed”. This dimension contrasts Type 2 irrigated schemes, which are mostly less than or equal to 10 ha and were completed between 2001 and 2010, with Types 4 and 5 irrigated schemes, which are larger than 100 ha and were completed no later than 1990. On the negative side, the modalities with a significant correlation on Dim2 (Figure 5a) are Type 2 (−7.89), the area developed less than or equal to 10 ha ([<=10 ha], −12.11) and the year of completion between 2001 and 2010 ([2001–2010], −4.39). In positive terms, the modalities that are strongly related to Dim2 are Type 4 (7.78), Type 5 (4.10), the years of realization until 1990 ([<=1980], 9.69), ([1981–1990], 5.16), and the areas larger than 10 ha: (([10 ha–20 ha], 5.31), ([20 ha–50 ha], 5.11), ([50 ha–100 ha], 3.15), ([100 ha>=], 6.97)).
Finally, the third dimension (Dim3) is “functionality and condition”. Dim3 separates functional facilities in good or medium condition from non-functional facilities in bad condition. In negative terms, the modalities that have a close relationship with Dim3 (Figure 5b) are: Type 3 (−25.02), Type 5 (−5.87), having the year of completion before 2000 (([<=1980], −11.57), ([1981–1990], −8.59), ([1991–2000], −5.78)), the modality no (−3.46), in a bad condition (−5.06), and the developed areas between 10 and 20 ha and more than 100 ha: ([10 ha–20 ha], −3.19), ([100 ha >=], −3.54). While the characteristics of facilities close to functional, good or average are “Type 2”, the facilities close to non-functional and in bad condition are “Type 3”.

3.4. Interpretation of the Axes with Active and Additional Modalities Together

Interpretations based on active variables are undoubtedly interesting but have the defect of being tautological: one explains the results using the data that have been used to obtain them. We cannot, therefore, be confident that a significant phenomenon has been discovered. Hence, this is the reason for introducing additional variables. Moreover, the use of supplementary variables in an MCA is crucial because they allow the results to be explained with much greater credibility. Indeed, they are neutral in the construction of the axes. Therefore, a joint analysis with both types of data (active and illustrative) will make the interpretations more effective.
The first dimension (Dim1) separates hydro-agricultural developments into two main categories: the regulated lowlands on the left and irrigated schemes on the right. Using the contributions of the active variables and the degree of correlation of the additional variables with Dim1, we see that the regulated lowlands are Type 1, with areas generally between 10 and 100 ha, mostly constructed between 2001 and 2020, and are generally in bad condition. On the other side of the axis, the irrigated perimeters are associated with Types 2, 3, 4 and 5. The best represented are Type 4 and Type 5, with areas of over 100 ha, most of which were built before the year 2000 and are associated with the modality of having a good condition. The regulated lowlands are therefore the type of development that has the most structures in bad conditions as compared to the irrigated perimeters.
The second dimension tends to discriminate between irrigated areas according to the type of water resource mobilization structure and the means of water extraction. Manual watering from wells or boulis as the water mobilization structure is associated with Type 2 irrigated areas. These schemes are generally less than or equal to 10 ha in size and were built between 2001 and 2010. Dams, rivers and boreholes with a means of downstream extraction, diversion, or pumping are associated with Types 4 and 5 irrigated areas with a surface area greater than 100 ha and built before 1991. Thus, axis 2 opposes the Type 2 irrigated perimeters, which mostly have a surface area less than or equal to 10 ha and were built between 2001 and 2010, and the Type 4 and 5 irrigated perimeters, which have a surface area greater than 100 ha and were built at the latest in 1990.
The third dimension reveals that within the irrigated perimeters, the facilities are in poor condition from those in an average or good operating condition. In this dimension, the facilities in a poor operating condition are on the side of the Type 3 modality. The facilities in a good or average operating condition are on the side of the modalities Type 2, Type 4 and Type 5.
In a nutshell, we can say that dimension 1 (Dim1) and dimension 3 (Dim3) allow us to discriminate between functional and non-functional facilities and the states of the latter (good, average or bad). In addition, Dim1 contrasts the irrigated perimeters and regulated lowlands. As for dimension 2, it discriminates the irrigated perimeters by typology. These are Types 5 and 4 at the top of the axis, with areas of more than 100 ha and built before 1990 (Figure 5). Type 2 is at the bottom of the axis, with areas of less than 10 ha, most of which were built in the 2000s.
Table 3 and Table 4 are a summary that presents some characteristics of the development typologies. They also give in brackets the percentages of each modality for a given variable and by development typology.

4. Discussion

Type 1 hydro-agricultural schemes are the most prevalent and have been growing since the 2000s, according to the studies’ results. In comparison to irrigated perimeters, these facilities are still the ones in which we most frequently find “less functional” and “imperfect” constructions. Comparing the state of Type 1 facilities to other types, this conclusion seems reasonable. This kind of development uses compacted embankments as basic structures to partially control the water flow [2,50]. Therefore, it is methodically intentional that this kind of development should be renovated following each rainy season harvesting campaign. After two production seasons, if this is not done, there is a serious risk of structural deterioration. The fact that these structures are basic in nature does not, however, relieve users and management services of their responsibility to guarantee that these structures are maintained before and following each production season.
Inland valley development projects and programs were implemented by the government during the 2000s to help with food security and poverty reduction [51]. Moreover, some NGOs and associations made investments in lowland development during the same period. Our results indicated a significant increase in this type of development from the 2000s onward, which might be explained by the intervention of all these programs in Type 1 developments. Furthermore, lowland rice constitutes 67% of the nation’s rice-growing areas and accounts for 43% of its production, according to government figures, which show that rice production surged by 190% between 2000 and 2015 [52]. Because building lowlands is less expensive than constructing irrigated areas, the lowlands have developed quickly.
Our findings show that among the irrigated perimeters, Type 3 is the second most common after Type 2 and has the most damaged or neglected structures. This finding is the one that all the writers agree on the most [27,32,53]. Type 3 irrigated perimeters are those which are typically constructed around tiny dams with a surface area of less than 100 ha and are controlled by the community. In the past, the Office National des Barrages et des Aménagements Hydro-agricoles (ONBAH) and the Fonds de l’Eau et de l’Equipement Rural were in charge of overseeing this type of irrigated perimeter for operation and maintenance support (FEER). Before their dissolution following the execution of structural adjustment measures, these state-owned businesses played a significant role in the design, development and administration of hydro-agricultural schemes. Since 1991, the government of Burkina Faso has worked to restructure the economy through a structural adjustment program with the assistance of the World Bank and its other partners [13].
As a result, the Dublin conference (1992) emphasized user participation in irrigation management, which has since spread throughout the world. It has frequently been enforced by donors who want to cut public spending and improve the administration of irrigated regions constructed as part of huge development projects, which up until then were virtually always closely overseen and supervised by the State [24]. Given our findings, which show more failures in this kind of infrastructure, the backdrop of the retrocession of Type 3 schemes shows that farmer self-management has not necessarily succeeded in the case of Burkina Faso.
Types 4 and 5 are extremely uncommon, yet they are big, highly useful and generally in good shape. Additionally, they were primarily constructed before 2000. Our observations can be explained by the advantages of governmental supervision for Type 4 and a public–private partnership (PPP) operating mode for Type 5 in these advances. Indeed, these significant developments, such as the Sourou Valley, the Kou Valley, the Bagré site (type 4) or SOSUCO (type 5), are a result of the droughts of the 1970s, and the State provided systematic assistance in their management. For instance, the Sourou Valley Development Authority (AMVS), established in 1986 (see Kiti n°86–286/CNR/PRES of 14 June 1986, for the foundation of the AMVS), oversees and coordinates the Sourou Valley’s irrigated regions [54]. The Bagré Project Management Authority, which is responsible for the Bagré site, was established on 25 June 1986 by Kiti n°86–240/CNR/PRES/Eau. It has the legal status of a public administrative institution with legal personality and management autonomy [55]. Public investments enable these institutions to fulfill their purpose, which is to carry out the State’s irrigation strategy. Therefore, it makes sense to observe that these facilities’ operations generally run well.
Our findings show that among the irrigated perimeters, Type 2 schemes are the ones expanding the most and, for the most part, are in good condition. This trend started in the 2000s.
National policies and strategies were implemented in the 2000s to support private initiative in agriculture production [56]. The Decentralized Rural Development Policy Letter (LPDRD), the National Food Security Strategy (SNSA), the Rural Development Strategy (SDR) and the National Rural Sector Program are just a few examples (PNSR). Therefore, the spread of Type 2 schemes would begin with the implementation of these policies and tactics. Even across all of Africa, it has been seen that Type 2 irrigation has increased during the past 20 years [57].
In 1995, the total area of private irrigated farms in Burkina Faso was estimated at 4000 ha [13]. According to statistics from the national directory of hydro-agricultural developments, in 2020, the total area under the private initiative was estimated at 15,000 ha with a larger number of individual investors.
An ongoing initiative called “Budgetary Program 075” (hydro-agricultural and irrigation facilities) significantly supported private operators between 2015 and 2020. These include discounted rates on market garden wells, motor pumps, run-off water collection basins (BCER), and the supply of polyvinyl chloride (PVC) pipes for irrigation [58]. The management of the infrastructure in Type 2 may be the cause of its typically decent state.
It would be wise to carry out more in-depth studies on irrigated systems by typology to evaluate their performance and suggest suitable solutions in terms of moving forward in the quest to discover “quick fixes” to the various management problems of irrigated systems. A technique for assessing the performance and diagnostics of irrigated systems was developed by the IIMI/PMI-BF in 1996 [59]. This methodology has made it possible to assess the effectiveness of five tiny irrigated perimeters surrounding Burkina Faso dams (Type 3) [33]. The performance of Type 4 irrigation systems in the southwest of Burkina Faso (Kou valley and Karfiguéla) was assessed using the same methods [8]. Innovative techniques tailored to a rural setting can be employed in this inquiry to understand the root reasons of irrigation system malfunction and to develop adequate solutions, such as the WASO approach [60]. This method has provided the dual benefits of revealing both the points of view of the irrigators (even the illiterate ones) surveyed and the solutions to the issues as seen by the responder.
Our study does not claim to have exhausted the question of the evaluation of hydro-agricultural schemes in Burkina Faso. We have focused on aspects of the physical infrastructure conditions based on surveys conducted by several investigators which may involve errors in assessment and data collection. Other assessments have typically taken stock from an agronomic point of view, from an organizational point of view, from a water management point of view, etc. One could also take into account the socio-economic, cultural and educational characteristics of the beneficiaries/farmers of the schemes. This could also explain the condition of the schemes despite their classification: thus, this is a limitation of the study. The MCA method depends on the quality of the data collected, but we have tried to correlate our results with the results of other studies, different findings and milestones in the development of hydro-agricultural schemes in Burkina Faso in order to discuss our results. This work can serve as a reference for the periodic evaluation of hydro-agricultural schemes in Burkina Faso.

5. Conclusions

The inventory of hydro-agricultural developments in Burkina Faso, based on the multiple correspondence analysis, has made it possible to characterize the irrigated systems by typology and the key periods in their historical development. This study confirms, in figures, all previous studies that note the continuous degradation of the agricultural facilities. However, it has the privilege of highlighting, by typology, the facilities that have the most operating difficulties, particularly Type 3. This information is essential for public authorities, NGOs, and technical and financial partners to make decisions regarding the orientation of their actions in the rural world.
While it is essential to have an inventory of hydro-agricultural facilities at a given time, it is also necessary to be able to monitor their evolution. While the information provided by the data in the national directory of hydro-agricultural facilities is useful, the latter has been the result of a long process. The survival and importance of this database will depend on the quality of its data and its periodic updating, hence the need to set up a dynamic database and update it periodically to be able to monitor changes in time and space. The reason is that this information is important for all rural development actors.

Author Contributions

Conceptualization, C.B.B., J.W., F.T., B.D. and B.T.; methodology, C.B.B., J.W., F.T., B.D., S.P., N.T.T.T. and B.T.; investigation, C.B.B., A.B. and M.H.; resources, C.B.B., M.H., A.B. and S.P.; data curation, C.B.B. and M.H.; writing—original draft preparation, C.B.B.; writing—review and editing, F.T., S.P., B.D., J.W., N.T.T.T., A.B., M.H. and B.T. All authors have read and agreed to the published version of the manuscript.

Funding

Wallonie–Bruxelles International (WBI) of Belgium and the Ministry of Agriculture of Burkina Faso provided funding for this study (grant number SUB/2021/496004).

Institutional Review Board Statement

Not applicable.

Informed Consent Statement

Not applicable.

Data Availability Statement

Data from this study are available from the Directorate General of Hydro-Agricultural Development and Irrigation of the Ministry of Agriculture of Burkina Faso.

Acknowledgments

The authors are grateful to the “Direction Générale des Aménagements Hydro-agricoles et du Developpement de l’Irrigation (DGAHDI)” in Burkina Faso for supplying data. We also acknowledge Amadou Keita, Tasséré Sawadogo, Ilboudo Mahamadou, Clément Ouedraogo and Dial Niang for the helpful discussions we had. We thank Adolphe Zangre for accompanying and facilitating our access to data and various resources. Special thanks to my colleagues Kibissi Paré, Alexandre Moyenga, Mickael Konkole, Inoussa Belembaogo and Yaya Ouibga for helping collect accurate data. Thanks to Nadège Bazié for proofreading the English version of the paper and Luc Tiégna for the design of a dynamic database of hydro-agricultural developments in Burkina Faso. We are grateful to Amidou Savadogo, a former general manager of DGHADI, for affording the establishment of a national directory of hydro-agricultural infrastructure in Burkina Faso serious consideration. Peace be upon him. We also acknowledge Wallonie-Bruxelles International (WBI), a Belgian organization that supported our PhD studies.

Conflicts of Interest

The authors declare no conflict of interest. The funders had no role in the design of the study; in the collection, analyses, or interpretation of data; in the writing of the manuscript; or in the decision to publish the results.

Appendix A

VariablesDefinition
Type of hydro-agricultural development (Type.of.HAD)Hydro-agricultural developments are classified into two (02) types. The irrigated perimeters where water control is total and the regulated lowlands where water control is partial. The lowlands are the axes of preferential convergence of surface water, hypodermic runoff and groundwater [61,62]
Developed area (Dev.Area)The developed area is the area that the irrigation network can supply with water, in the case of irrigated perimeters. It corresponds to all the space that can retain a water level that allows rice to be grown, in the case of regulated lowlands.
Year of completion of the hydro-agricultural development (Year.Comp.HAD)The year of completion of the development is the year in which the development work is completed.
Initiative of the hydro-agricultural development (Intiative.of.HAD)The development initiative refers to the origin of the investment in the irrigation system or the regulated lowland. It answers the question:
who financed the development work? There are therefore two (02) types of initiative: public or private:
Public initiative (state, donors, NGOs);
Private initiative consists of the farmer investor (farmer or group of farmers); and the non-farmer private investor (individual or company).
Functionality of the hydro-agricultural development (Functionality.of.HAD)The functionality of the scheme refers to the infrastructure that has been built. In the case of an irrigated perimeter, it is therefore a question of seeing whether the irrigation network and its means of drainage as well as the other works are still used by the farmers to bring water to the crops. If the irrigation system is no longer in use, then the scheme is said to be non-functional. There may be cases where the site is in use, but no longer uses the works that were built, so the scheme is declared nonfunctional.
Condition of the hydro-agricultural development (Condition.of.HAD)The quality of the works of the development has three (03) modalities (good, average, bad).
A development in good condition means that it has not suffered any significant deterioration.
A development is in average condition when the structures are somewhat degraded with demolished structures that can no longer fulfil their role.
A development is in bad condition when the structures are completely damaged and can no longer perform their functions.
Type of workforce (Type.Workfoce)The type of labour has three modalities: Family, Employee or Family and Employee. Family workforce: this is when production activities are performed by members of a family. It also includes self-help systems in communities.
Employee workforce: this is when the people involved in all production activities are employees paid for their services. Family and Employee workforce: this is when production activities use both types of workforces mentioned above.
Main water infrastructure (Water.Infrastructure)The water resource is the structure that mobilizes the water. In the case of irrigated areas, it can be a dam, a borehole, a pond, a river, a well, a bouli, a natural or artificial lake or a sump. In the case of regulated lowlands, the water resource is called ‘run-off’.
Means of water extraction (Means.of.Water.Ex)The means of dewatering is the equipment, technique or method used to move water from the resource to the irrigated area. In the case of irrigated areas, it can be by intake downstream of a dam, by pumping (motor pump, submersible pump, hydroscrew, etc.), by bypass from a watercourse, by siphoning, or manually using wells. In the case of shallow areas, natural onflow is used as a means of drainage.
Typology of the hydro-agricultural development (Typology.of.HAD)
Type 1: improvement of rainwater mobilization (controlled flooding schemes and lowlands generally on a few dozen to a few hundred hectares managed by village communities or communes).
Type 2: individual irrigation of high value agricultural products (developments of less than one hectare to a few tens of hectares carried out on an individual or enterprise basis).
Type 3: small- and medium-scale irrigation managed by village communities for household food needs and local markets (developments of less than 100 ha exploited collectively, carried out with external financing, but with possible participation of the community, including Village Irrigated Perimeters (VIP) and Small Market Garden Perimeters (SMP)).
Type 4: modernization and expansion of existing large public irrigated perimeters, particularly for rice (developments of 100 ha to more than 1000 ha, publicly financed through a development company, with possible participation of the beneficiaries, operated by a traditional peasantry and structured in producers’ organizations).
Type 5: commercial irrigation (national or export markets) based on PPPs with areas of a few hundred to a few thousand hectares. The developments benefit from public funding in return for private (agro-industrial) contractors complying with a set of specifications, which may include services to be rendered to family producers installed on the same development [63].

References

  1. Albergel, J.; Carbonnel, J.P.; Grouzis, M. Péjoration climatique au Burkina Faso. Cah. ORSTOM Sér. Hydrol. 1984, 12, 3–19. [Google Scholar]
  2. MAHRH. Politique Nationale de Developpement Durbale de L’agriculture Irriguée: Stratégie, Plan D’action, Plan D’investissement à L’horizon 2015. 2006. Available online: http://extwprlegs1.fao.org/docs/pdf/bkf174080.pdf (accessed on 26 May 2020).
  3. Nebie, O. Les aménagements hydro-agricoles au Burkina Faso: Analyse et bilan critiques. Trav. De L’institut De Géographie De Reims 1993, 83, 123–140. [Google Scholar]
  4. Piquemal, D. Inventaire et bilan des retenues d’eau au Burkina Faso. Les Cah. d’Outre-Mer 1991, 44, 259–280. [Google Scholar] [CrossRef]
  5. Pale, S. Vers une Meilleure Gestion de L’eau Agricole à Partir des Plateformes Libres de Télédétection et de Communication au Burkina Faso; Université de Liège: Liège, Belgique, 2020. [Google Scholar]
  6. Traoré, F. Optimisation de L’utilisation des Ressources en Eau du Bassin du Kou Pour des Usages Agricoles; Université de Liège: Liège, Belgique, 2012. [Google Scholar]
  7. Wellens, J. Un Cadre Pour L’utilisation des Outils D’aide à la Décision à Diverses Echelles Spatiales Pour la Gestion de L’agriculture Irriguée en Afrique de l’Ouest; Université de Liège: Liège, Belgique, 2014. [Google Scholar]
  8. Dembele, Y.; Yacouba, H.; Keïta, A.; Sally, H. Assessment of Irrigation System Performance in South-Western Burkina Faso. Irrig. Drain. 2012, 61, 306–315. [Google Scholar] [CrossRef]
  9. Waalewijn, P.; Trier, R.; Denison, J.; Siddiqi, Y.; Vos, J.; Amjad, E. Gouvernance de L’eau en Irrigation et Drainage. 2020, p. 174. Available online: https://openknowledge.worldbank.org/handle/10986/32339?locale-attribute=fr (accessed on 13 September 2022).
  10. Banque Mondiale. Reengaging in Agricultural Water Management: Challenges, Opportunities, and Trade-Offs; Water for Food Team, Agriculture and Rural Development Department (ARD) World Bank: Washington, DC, USA, 2006. [Google Scholar]
  11. Millenium Challenge Account Burkina-Faso. Rapport de L’étude Pour L’élaboration D’une Stratégie Nationale et d’un Plan D’actions Pour L’entretien et la Sécurité des Aménagements Hydrauliques (SNESAH); Millenium Challenge Account Burkina-Faso: Washington, DC, USA, 2014. [Google Scholar]
  12. Namara, R.E.; Sally, H. Proceedings of the Workshop on Irrigation in West Africa: Current Status and a View to the Future, Ouagadougou, Burkina Faso, 1–2 December 2010; IWMI: Colombo, Sri Lanka, 2014. [Google Scholar]
  13. PDIP. Document-Cadre de Développement de L’irrigation Privée: Document de Travail; PDIP: Tapoa, Burkina Faso, 1995; p. 51. [Google Scholar]
  14. Gadelle, F. L’avenir de L’irrigation en Afrique de L’ouest. 2001, p. 11. Available online: https://publications.iwmi.org/pdf/H030868.pdf (accessed on 13 September 2022).
  15. Sally, H.; Abernethy, C.L. Private Irrigation in Sub-Saharan Africa: Regional Seminar on Private Sector Participation and Irrigation Expansion in Sub-Saharan Africa, Accra, Ghana, 22–26 October 2001; International Water Management Institute (IWMI): Colombo, Sri Lanka; Food and Agriculture Organization of the United Nations (FAO): Rome, Italy; Technical Centre forAgricultural and Rural Cooperation (CTA) ACP-EU: Wageningen, The Netherlands, 2002; 328p. [Google Scholar]
  16. Sonou, M.; Abric, S. Capitalisation D’expériences sur le Développement de la Petite Irrigation Privée Pour des Productions à Haute Valeur Ajoutée en Afrique de l’Ouest. 2009, p. 139. Available online: https://www.pseau.org/outils/ouvrages/arid_fao_iwmi_practica_capitalisation_d_experiences_sur_le_developpement_de_la_petite_irrigation_privee_pour_des_productions_a_haute_valeur_ajoutee_en_afrique_de_l_ouest_2010.pdf (accessed on 13 September 2022).
  17. Sylla, A.; Al-Hassan, R.; Egyir, I.; Anim-Somuah, H. Perceptions about quality of public and private agricultural extension in Africa: Evidence from farmers in Burkina Faso. Cogent Food Agric. 2019, 5, 1685861. [Google Scholar] [CrossRef]
  18. Sally, H.; Pouya, A.M. Quel Environnement Pour le Développement de L’irrigation au Burkina-Faso? 1993, p. 220. Available online: https://publications.iwmi.org/pdf/H_13106i.pdf (accessed on 13 September 2022).
  19. Zoungrana, T.P. Les Recompositions Territoriales dans les Aires D’amenagement Hydro-Agricole du Burkina Faso: Une Riposte des Acteurs Locaux a la Logique Verticale de l’état. 2010. Available online: https://www.academia.edu/30747792/Les_Recompositions_Territoriales_Dans_Les_Aires_D_Amenagement_Hydro_Agricole_Du_Burkina_Faso_Une_Riposte_Des_Acteurs_Locaux_a_La_Logique_Verticale_De_L_%C3%89tat (accessed on 13 September 2022).
  20. Zagré, P. Les Politiques économiques du Burkina Faso: Une Tradition D’ajustement Structurel; KARTHALA Editions: Paris, France, 1994. [Google Scholar]
  21. Senahoun, J. Universität Hohenheim. 2000, p. 213. Available online: https://agritrop.cirad.fr/531940/ (accessed on 13 September 2022).
  22. Bassolet, B. Le Programme D’ajustement Structurel du Secteur Agricole (PASA) au Burkina Faso: Principales Orientations et Propositions D’activités de Recherche (Mimeo). Document Ronéotypé. 1992. Available online: http://hubrural.org/IMG/pdf/rapport-pasa-uemoa.pdf (accessed on 13 September 2022).
  23. Kouassi, B.Y. Innovations Technologiques et Productions Agricoles en Afrique de L’Ouest: Exemple du Burkina Faso, du Ghana et du Togo; KARTHALA Editions: Paris, France, 2009. [Google Scholar]
  24. Jamin, J.Y.; Bisson, P.; Fusillier, J.L.; Kuper, M.; Maraux, F.; Perret, S.; Vandersypen, K. La Participation des Usagers à la Gestion de L’irrigation: Des Mots D’ordre Aux Réalités dans les Pays du sud. Les Colloques de l’Académie d’Agriculture de France. 2005. Available online: https://agritrop.cirad.fr/530581/ (accessed on 7 January 2022).
  25. Le bulletin D’information sur la Sécurité Alimentaire au Burkina Faso-n° 11, juillet, août, Septembre 2007-Burkina Faso|ReliefWeb. Available online: https://reliefweb.int/report/burkina-faso/le-bulletin-dinformation-sur-la-s%C3%A9curit%C3%A9-alimentaire-au-burkina-faso-n%C2%B0-11 (accessed on 27 June 2022).
  26. ABN; DHV. Etude d’élaboration du programme d’investissement et de formulation des projets d’investissement nécessaires à la mise en œuvre de la vision partagée. In Elaboration du Programme d’Investissement Rapport Définitif; ABN: Niamey, Niger, 2007. [Google Scholar]
  27. Barbier, B.; Ouedraogo, H.; Dembélé, Y.; Yacouba, H.; Barry, B.; Jamin, J.-Y. L’agriculture irriguée dans le Sahel ouest-africain: Diversité des pratiques et des performances. Cah. Agric. 2011, 20, 24–33. [Google Scholar] [CrossRef]
  28. De Condappa, D.; Chaponnière, A.; Lemoalle, J. A decision-support tool for water allocation in the Volta Basin. Water Int. 2009, 34, 71–87. [Google Scholar] [CrossRef] [Green Version]
  29. FAO. Évaluation du Programme de la FAO au Burkina Faso 2010–2014 Etude de cas sur L’aménagement de Trois Bas-fonds Rizicoles dans la Région Nord au Burkina Faso; FAO: Rome, Italy, 2015; p. 32. [Google Scholar]
  30. Venot, J.-P.; Cecchi, P. Use-value or performance: Towards a better understanding of small reservoirs in sub-Saharan Africa. Cah. Agric. 2011, 20, 112–117. [Google Scholar] [CrossRef]
  31. Zwarts, L.; van Beukering, P.; Koné, B.; Wymenga, E. Le Niger, une Artère Vitale. Gestion Efficace de l’eau dans le Bassin du haut Niger. 2005. Available online: https://www.altwym.nl/wp-content/uploads/2005/11/Le-Niger-une-artere-vitale-vrkleind.pdf (accessed on 13 September 2022).
  32. Global Water Partnership. Evaluation de la Gouvernance de L’eau au Burkina Faso: Analyse de la Situation Actuelle. Identification et Analyse des Actions Prioritaires; GWP/AO: Ouagadougou, Burkina Faso, 2009. [Google Scholar]
  33. IIMI-PMI/BF; Sally, H.; Keita, A. Analyse-Diagnostic et Performances de 5 Périmètres Irrigués Autour de Barrages au Burkina Faso: Rapport Final-Tome 1 du Projet Management de l’Irrigation [Analysis-Diagnosis and Performance of Five Reservoir-Based Irrigation Schemes in Burkina Faso: F]; IWMI: Colombo, Sri Lanka, 1996. [Google Scholar]
  34. Kambou, D. Évaluation des Performances Techniques de L’irrigation au Burkina Faso; Université de Liège: Liège, Belgium, 2019. [Google Scholar]
  35. Somé, L. Contribution à la Base de Données Sous-Régionale Pour une Gestion Intégrée de L’environnement en Afrique de L’ouest: Les Ressources en eau au Burkina Faso; Conseil National Pour la Gestion de l’Environnement (CONAGESE), Ministère en Charge de l’Environnement: Ouagadougou, Burkina Faso, 2002; 31p. [Google Scholar]
  36. MAHRH. Etat des Lieux des Ressources en eau du Burkina Faso et de Leur Cadre de Gestion; MAHRH: Ouagadougou, Burkina Faso, 2001. [Google Scholar]
  37. DGAHDI. Termes de Référence Pour L’établissement du Repertoire National des Amenagements Hydro-Agricoles au 31 Décembre 2019; DGAHDI: Ouagadougou, Burkina Faso, 2018. [Google Scholar]
  38. AC3E; CETRI; BERA; CINTECH; INSUCO. Établissement du Répertoire des Aménagements Hydro-Agricoles Réalisés sur le Territoire National au 31 Décembre 2019: Rapport de L’étude; INSUCO: Ouagadougou, Burkina Faso, 2019. [Google Scholar]
  39. Foucart, T. L’analyse des Données: Mode D’emploi: Méthodes et Etudes de Cas; Pr. Universitaires de Rennes: Rennes, France, 2003. [Google Scholar]
  40. Gonzalez, P.-L. Analyse des Correspondances Multiples. p. 29. Available online: https://docplayer.fr/22410840-Analyse-des-correspondances-multiples-pierre-louis-gonzalez.html (accessed on 13 September 2022).
  41. Le Roux, B.; Rouanet, H. Multiple Correspondence Analysis; SAGE: Thousand Oaks, CA, USA, 2010. [Google Scholar]
  42. Parchomenko, A.; Nelen, D.; Gillabel, J.; Rechberger, H. Measuring the circular economy—A Multiple Correspondence Analysis of 63 metrics. J. Clean. Prod. 2019, 210, 200–216. [Google Scholar] [CrossRef]
  43. Hoffman, D.L.; Franke, G.R. Correspondence analysis: Graphical representation of categorical data in marketing research. J. Mark. Res. 1986, 23, 213–227. [Google Scholar] [CrossRef]
  44. Clausen, S.E. Applied Correspondence Analysis: An Introduction; SAGE: Thousand Oaks, CA, USA, 1998. [Google Scholar]
  45. Saporta, G. Probabilités, Analyse des Données et Statistique; Editions Technip: Paris, France, 2008. [Google Scholar]
  46. Husson, F.; Pagès, J. Analyse des Correspondances Multiples. p. 41. Available online: https://lms.fun-mooc.fr/c4x/agrocampusouest/40001S03/asset/AnaDo_ACM_cours_slides.pdf (accessed on 13 September 2022).
  47. Lebart, L.; Morineau, A.; Piron, M. Statistique Exploratoire Multidimensionnelle; Dunod: Paris, France, 1995; p. 458. [Google Scholar]
  48. Lê, S.; Josse, J.; Husson, F. FactoMineR: An R package for multivariate analysis. J. Stat. Softw. 2008, 25, 1–18. [Google Scholar] [CrossRef] [Green Version]
  49. Tuto ACM avec R et FactoMineR et Factoshiny. 13 January 2020. Available online: https://www.youtube.com/watch?v=mUKz4L2ZsuY (accessed on 23 June 2022).
  50. INERA; SP/CPSA; PDA; PAFR; UNC-CBF; PRP. Manuel Technique D’amenagements de Bas-Fonds Rizicoles au Burkina-Faso; INERA: Ouagadougou, Burkina Faso, 2006. [Google Scholar]
  51. DGESS. Répertoire 2021 des Projets et Programmes du MAAHM; DGESS: Ouagadougou, Burkina Faso, 2021. [Google Scholar]
  52. MAAH; DGAHDI; JICA. Projet D’étude sur L’élaboration du Programme National de Développement de Bas-fonds au Burkina-Faso; Sanyu Consultants Inc.: Shizuoka, Japan, 2019.
  53. IIMI-PMI/BF; Pouya, A.M.; Sally, H. Les Objectifs et les Performances des Petits Périmètres Irrigués Autour des Barrages, les Actes de L’atelier du 8–10 Juin 1994 à Ouagadougou; IWMI: Colombo, Sri Lanka, 1994; p. 146. [Google Scholar]
  54. Somda, J.; Ouadba, J.M.; Huberman, D. Valeur économique de la Vallée du Sourou: Une évaluation Préliminaire; IUCN: Gland, Switzerland, 2010; p. 46. [Google Scholar]
  55. La SEM Bagrepôle-Bagrepole. Available online: http://www.bagrepole.bf/a-propos (accessed on 23 June 2022).
  56. OCDE. Cadre D’action Pour L’investissement Agricole au Burkina Faso; OECD: Paris, France, 2012. [Google Scholar] [CrossRef]
  57. Union Africaine. Cadre de Développement de l’Irrigation et de Gestion de l’Eau Agricole en Afrique; Union Africaine: Addis Ababa, Ethiopia, 2020. [Google Scholar]
  58. MAAH. Annuaire des Statistiques Agricoles 2020; Ministère en Charge de l’Agriculture: Ouaga, Burkina Faso, 2020. [Google Scholar]
  59. IIMI-PMI/BF. Méthodologie D’évaluation des Performances et de Diagnostic des Systèmes Irrigués. 1996. Available online: https://publications.iwmi.org/pdf/H_9196i.pdf (accessed on 13 September 2022).
  60. Keïta, A.; Koïta, M.; Niang, D.; Lidon, B. Waso: An Innovative Device to Uncover Independent Converging Opinions of Irrigation System Farmers. Irrig. Drain. 2019, 68, 496–506. [Google Scholar] [CrossRef]
  61. Albergel, J. Mise en Valeur Agricole des Bas-Fonds au Sahel: Typologie, Fonctionnement Hydrologique, Potentialités Agricoles: Rapport Final d’un Projet CORAF-R3S; Diffusion CIEH: Ouagadougou, Burkina Faso; CIRAD-CA: Montpellier, France, 1993. [Google Scholar]
  62. Raunet, M. Bas-fonds et riziculture en Afrique. Approche structurale comparative. 1985, p. 21. Available online: https://agritrop.cirad.fr/426885/1/document_426885.pdf (accessed on 13 September 2022).
  63. CILSS. Cadre Stratégique Pour L’eau Agricole au Sahel. CILSS, Sahelian Zone of Africa. 2017. Available online: https://documents1.worldbank.org/curated/pt/566751530178678051/pdf/Strategic-Framework-for-Agricultural-Water-Management-in-Sahel.pdf (accessed on 13 September 2022).
Figure 1. Location map of Burkina Faso, a country in West Africa.
Sustainability 14 13303 g001
Figure 2. Histogram of percentages of inertia obtained as a result of applying multiple correspondence analysis (MCA) to the data.
Sustainability 14 13303 g002
Figure 3. Graphical display in two dimensions of individuals in principal coordinates resulting from the MCA of data. The percentage of inertia accounted for by the two dimensions is 33.47%.
Sustainability 14 13303 g003
Figure 4. Graphical representation of the results of the MCA. (a) Representation on the first factorial plane (Dim1 × Dim2) of the 20 modalities of the five active variables. (b) Representation on the second factorial plane (Dim1 × Dim3) of the 20 modalities of the five active variables.
Sustainability 14 13303 g004
Figure 5. Graphical representation of the results of the MCA. (a) Representation on the first factorial plane (Dim1 × Dim2) of the 20 modalities of the five additional variables. (b) Representation on the second factorial plane (Dim1 × Dim3) of the 20 modalities of the five additional variables.
Sustainability 14 13303 g005
Table 1. List of variables and modalities.
VariablesModalities
Type of hydro-agricultural development (Type.of.HAD)Irrigated perimeterRegulated lowland
Developed area (Dev.Area)[<=10 ha][100 ha>=][10 ha–20 ha][20 ha–50 ha][50 ha–100 ha]
Year of completion of the hydro-agricultural development (Year.Comp.HAD)[1981–1990][1991–2000][2001–2010][2011–2020][<=1980]
Initiative of the hydro-agricultural development (Intiative.of.HAD)PublicPrivate
Functionality of the hydro-agricultural development (Functionality.of.HAD)YesNo
Condition of the hydro-agricultural development (Condition.of.HAD)GoodMediumBad
Type of workforce (Type.Workfoce)FamilyEmployeeFamily and Employee
Main water infrastructure (Water.Infrastructure)DamDrillingRiverBouli (deepened pond)
WellPondRunoff waterLake
Means of water extraction (Means.of.Water.Ex)Downstream intakePumpingBypassManualNatural onflow
Typology of the hydro-agricultural development (Typology.of.HAD)Type1Type2Type3Type4Type5
Table 2. List of dimensions, related eigenvalues and inertia rates.
Dim.1 Dim.2 Dim.3 Dim.4 Dim.5 Dim.6 Dim.7 Sun.8 Sun.9 Sun.1 0Sun.1 1Sun.1 2Sun.1 3Sun.1 4Sun.1 5
Eigenvalue 0.636 0.368 0.302 0.215 0.207 0.204 0.200 0.196 0.185 0.1640.1480.1220.0500.0020.001
% of var.21.18912.28010.0687.1536.8966.7926.6706.5226.1535.4774.9364.0711.6770.0740.041
Cumulative%ofvar21.18933.46943.53750.69157.58764.37971.05077.57283.72589.20294.13898.20999.88599.959100.00
Table 3. Brief description of each hydro-agricultural management typology, associated with the percentage of each modality per variable.
TypologyType of Water ManagementType of HADYear of CompletionArea DevelopedInitiative
Type 1Regulated lowland development and controlled floodingRegulated lowlandMostly constructed between 2001 and 2020
[2011–2020] (67%)
[2001–2010] (28%)
[1991–2000] (4%)
[<=1980] (1%)
Generally, between 10 and 50 ha
[<=10 ha] (24%)
[100 ha>=] (1%)
[10 ha–20 ha] (32%)
[20 ha–50 ha] (38%)
[50 ha–100 ha] (5%)
Mostly Public (85%)
Private (15%)
Type 2Small-scale private irrigationIrrigated perimeterMostly constructed between 2001 and 2020
[2011–2020] (53%)
[2001–2010] (35%)
[1991–2000] (8%)
[1981–1990] (3%)
[<=1980] (1%)
Mostly less than or equal to 10 ha
[<=10 ha] (84%)
[10 ha–20 ha] (7%)
[20 ha–50 ha] (7%)
[50 ha–100 ha] (1%)
[100 ha>=] (1%)
Private (91%)
Public and private (9%)
Type 3Community-based irrigationIrrigated perimeterMostly constructed between 2001 and 2020
[2011–2020] (58%)
[2001–2010] (24%)
[1991–2000] (8%)
[1981–1990] (6%)
[<=1980] (4%)
Mostly less than or equal to 50 ha
[<=10 ha] (66%)
[10 ha–20 ha] (17%)
[20 ha–50 ha] (14%)
[50 ha–100 ha] (3%)
Public (97%)
Private and public (3%)
Type 4Large-scale public irrigationIrrigated perimeterMostly constructed between 1991 and 2000
[2011–2020] (11%)
[2001–2010] (16%)
[1991–2000] (33%)
[1981–1990] (11%)
[<=1980] (29%)
Mostly high than 100 ha [100 ha>=] (82%)
[50 ha–100 ha] (16%)
[20 ha–50 ha] (2%)
Public
Type 5Commercial irrigation under PPPIrrigated perimeterMostly before 2010
[2001–2010] (67%)
[<=1980] (33%)
Higher than 100 ha
[100 ha>=] (100%)
Public
Table 4. Brief description of each hydro-agricultural management typology, associated with the percentage of each modality per variable (cont.).
TypologyType of WorkforceMain Water RessourceMeans of Water ExtractionFonctionality and ConditionFrequency
Type 1Family (96%)
Family and employee (4%)
Runoff water (99%)
Pond (1%)
Natural onflow“Less functional” and “imperfect” constructions
Nonfunctional (11%)
Functional (89%)
Bad condition (36%)
Good condition (4%)
Medium condition (60%)
Most prevalent (58%)
Type 2Employee (11%)
Family (79%)
Family and employee (10%)
Well (48%), river (21%), dam (16%), drilling (9%), bouli (4%), pond (2%)Pumping (52%)
Manual watering (46%)
natural onflow (1%)
Downstream intake (1%)
Nonfunctional (8%)
Functional (92%)
In good condition (8%)
Bad condition (25%)
Medium (67%)
Most expanding (18%)
Type 3Family (90%) family and employee (10%)Dam (41%), Well (35%), river (10%), drilling (7%), bouli (5%), pond (1%)
runoff (1%)
Pumping (50%)
Manual watering (39%)
natural onflow (1%)
Downstream intake (10%)
Nonfunctional (17%)
Functional (83%)
In good condition (14%)
Bad condition (36%)
Medium (50%)
Most common after Type 1 (23%)
Type 4Family (85%), family and employee (13%)
Employee (2%)
River (49%), dam (36%), Well (7%), drilling (4%), bouli (2%), pond (2%)Pumping (60%)
Downstream intake (20%)
Bypass (11%)
Manual watering (9%)
Nonfunctional (2%)
Functional (98%)
In good condition (4%)
Bad condition (20%)
Medium (76%)
Rare
Type 5Family and employee (67%)
Employee (33%)
Dam (100%)Downstream intake (100%)Functional (100%)
In good condition (33%)
Medium (67%)
Extremely rare
Publisher’s Note: MDPI stays neutral with regard to jurisdictional claims in published maps and institutional affiliations.

