Article

Balance between Hosts and Guests: The Key to Sustainable Tourism in a Heritage City

by
Manuel Rama
1,
Emilio Carral
2,
Sara González-García
1,
Elías Torres-Feijó
3,
Maria Luisa del Rio
4,
María Teresa Moreira
1 and
Gumersindo Feijoo
1,*
1
CRETUS, Department of Chemical Engineering, Universidade de Santiago de Compostela, 15782 Santiago de Compostela, Spain
2
Galabra Research Group, Functional Biology Department, Ecology Section, Universidade de Santiago de Compostela, 27002 Lugo, Spain
3
Galabra Research Group, Galician Philology Department, Universidade de Santiago de Compostela, 15782 Santiago de Compostela, Spain
4
Galabra Research Group, Business Organization and Marketing Department, Marketing and Market Research Area, Universidade de Santiago de Compostela, 15782 Santiago de Compostela, Spain
*
Author to whom correspondence should be addressed.
Sustainability 2022, 14(20), 13253; https://doi.org/10.3390/su142013253
Submission received: 15 August 2022 / Revised: 12 October 2022 / Accepted: 13 October 2022 / Published: 14 October 2022
(This article belongs to the Section Tourism, Culture, and Heritage)

Abstract

:
A sustainable city implies socio-economic characteristics that allow citizens to maintain a certain quality of life. However, the effect of overtourism in some tourist cities negatively affects the community. In this study, a methodology was developed to analyze how tourism affects the way of life of residents in Santiago de Compostela. This work aims to define a set of environmental and socio-economic indicators to assess the impact of tourism activity. To this end, surveys were carried out among the three groups involved in the tourism sector: Citizens, traders, and visitors. Thereby, data were collected from the responses to the surveys conducted. Finally, this set of indicators was aggregated to a sustainability score on a scale of 1 to 10. The results show a sustainability score of 6.84, and the main weak points were the mobility between the residence of citizens and peripheral areas and the change in the offerings by the commerce promoted by tourism. Consequently, this methodology is useful for policy makers when making decisions and proposing actions to foster sustainable tourism.

1. Introduction

The urban population has grown exponentially since 1950, and it is estimated that 60% of the world’s population will reside in cities by 2050 [1]. Consequently, a large share of natural resources is destined for consumption in cities, being responsible for a large amount of global emissions and waste [2,3]. However, cities contribute about 80% of the global gross domestic product (GDP), being a major driver for the economy [3]. Consequently, cities can be considered key hotspots for global sustainable development.
The Agenda 2030 action plan established by the United Nations in 2015 defined 17 Sustainable Development Goals (SDGs) to be achieved by 2030. This action plan, in which all members made a commitment to meet these objectives, contains, among others, a specific goal focused on making cities and human settlements inclusive, safe, resilient, and sustainable. This goal is SDG number 11 and is titled Sustainable cities and Communities [4]. This goal implies that policymakers must not only act on the environmental impacts of cities, but also ensure the social and economic well-being of their citizens. Consequently, the main function of a city should be to be able to maintain or improve the quality of life of its residents [5].
City tourism is a sector that has been growing since the 1960s, with an increase in travel to cities of 82% between 2007 and 2014 [6]. In Spain, the tourism sector contributed approximately 12% to its GDP, being one of the most important sectors [7]. The arrival of tourism in a city can be beneficial both socially and economically (increase in services and supply, economic growth of the city, etc.), but in excess, it can also be one of the driving factors that can affect the quality of life of its citizens [8,9,10]. Therefore, some researchers have studied the consequences of overtourism in cities, and how it affects the lives of their residents. Overtourism is a problem that affects several European cities such as Barcelona, Seville, or Venice [11]. The way in which this phenomenon can affect the quality of life in a city can be evidenced in several ways. For example, in Venice, the massive use of boats in the canals damages the stability of the city’s buildings [12]. In Seville, the concentration of tourism in its old city displaces citizens to other areas [13]. In addition, excessive tourism creates feelings of rejection among citizens in relation to visitors [9,10,14]. Moreover, in economic terms, cities with a large tourist flow with a strong economic dependence on tourism may have major economic problems when external factors cause tourism to fall such as the economic crisis or the recent pandemic caused by COVID-19 [15,16]. Additionally, overtourism can also indirectly contribute to local environmental impacts due to increased waste from overconsumption [17], such as waste related to the agro-industrial sector [18].
The evaluation of the impact of tourism in cities through indicators has been used to determine how the city and citizens are affected by tourism and provide information to design sustainable tourism strategies and avoid overtourism [8,19,20,21,22]. The dynamics followed in this type of work were used to determine a series of indicators and obtain the corresponding information through specifically designed surveys. Thereby, a literature review of articles using this type of survey to analyze tourism within specific cities was conducted. Previous works have highlighted residents’ perceptions of tourism activities [8,20]. Emotional solidarity aims to explain residents’ attitudes towards tourism in different contexts [23,24] and how indicators beyond the attractions and facilities offered in a given context can determine the tourist attractiveness of an area [19,25]. It is also interesting to take into account the role of other stakeholders such as the resource administration as detailed by Tsaur et al. [22]. However, there are few studies in the literature that evaluate the impact of tourism considering an integrated perspective of the visitors and residents in the same study [26,27].
For this reason, this article proposes a methodology to determine how tourism affects the way of life of the citizens of Santiago de Compostela (one of the most important touristic cities in Spain, which is the destination of the St. James Way), taking into consideration the perspective of both visitors and residents. Therefore, this article seeks an answer to these questions: Does tourism have any impact on Santiago de Compostela? What are the potential impacts of tourism on the city?
On this basis, a methodology was developed that was based on the use of multiple socioeconomic indicators selected from a specific survey of three population groups involved: Citizens, traders, and tourists. The main novelty of this study was that, for the first time, the behavior of these interrelated actors was integrated to determine the impact and consequences of tourism in this historical city. Moreover, this methodology could be applied to other cities with similar characteristics (growing tourism, the relevance of its historical area, etc.) to assess the impact of tourism on the well-being of its residents. On the other hand, it could also provide policy makers with valuable information that would be useful for proposing actions towards more integrated and sustainable tourism.

2. Materials and Methods

2.1. Case Study

Santiago de Compostela is a city located in the region of Galicia (NW Spain) (Figure 1). According to the number of inhabitants, Santiago de Compostela is the fifth most populated city in Galicia with 97,260 inhabitants registered in 2019 [28]. It is the Galician city with the highest GDP per inhabitant with 37,508 € per capita in 2018, and the service sector is the largest contributor to its economy with more than 80% [29]. The large flow of tourists visiting the city is behind these figures and highlights the important role that tourism plays in the local economy. Figure 1 represents the boundaries of the municipality composed of the rural area and the city, which is distributed in three subareas: Old Town (Historical Center), Industrial, and Residential areas.
Three main reasons support the growing tourism in the city: First, the city was declared a UNESCO World Heritage Site in 1985. Secondly, it is a historic university city with one of the oldest universities in Spain (founded in 1495), which contributes to the mobility of students and researchers and, consequently, to the celebration of congresses and different related businesses. Finally, Santiago de Compostela is the final destination of the St. James Way, one of the most important pilgrimage routes in Europe [30].
Since 1993, the regional government has promoted the St. James Way as a tourist destination, considerably increasing the arrival of pilgrims, especially in the Holy Year or “Xacobeo” (celebrated the year when July 25th is Sunday). Thus, while the number of pilgrims in the “Xacobeo” year of 1993 was 99,436, the figure rose to 327,378 in 2018 (which was not a “Xacobeo” year). In addition, not only did the arrival of pilgrims to the city increase, but also the number of tourists visiting the city increased, reaching a peak of 842,895 visitors in 2017 (68% more than in 2005) [31].
Considering this economic growth in the tourism sector, proportional growth in the size of the city could be expected. However, while other Galician cities with a similar size compared to Santiago de Compostela, such as Lugo and Pontevedra, grew in population size by 13% and 12%, respectively, in the period between 1998 and 2018, the population of Santiago de Compostela only grew by 3% in the same period [28]. However, this growth was evident in some municipalities bordering the city such as Oroso, Teo, and Ames, which increased their population by 57%, 33%, and 120%, respectively, indicating that their population more than doubled in the period between 1998 and 2018 [28]. Thus, from these data, some questions arise in this regard: Why do citizens prefer to reside in peripheral cities? Is tourism related to this mobilization of citizens? Thus, the starting hypothesis was that the tourist pressure on the city is affecting the lifestyle of its citizens. Therefore, the main objective of this work was to determine to what extent this pressure affects the lifestyle of citizens and how to obtain relevant information when planning integrated and sustainable tourism strategies.

2.2. Indicators Selection

The starting point of the present study was the elaboration of three specific surveys performed by the Galabra Research Group to the three most potential collectives directly related to tourism: Citizens, traders, and visitors. The number of people surveyed was 929 citizens, 46% of whom were men and 54% women, with approximately 60% between the ages of 30 and 64. In the case of visitors, 2081 people were interviewed, of which 56% were women and 44% were men, and 64% were between 30 and 64 years of age. With respect to the traders, data on sex and age were not considered, and a total of 410 people were interviewed. These surveys were part of the project led by the Galabra Research Group “Speeches, images and cultural practices about Santiago de Compostela as the goal of the Caminos” and “Narratives, Uses and Consumptions by Visitors as Allies or Menaces for the Community Well-Being: The Case of Santiago de Compostela” [32]. The aim of the questionnaires was to obtain information about the discourses, images, and referenced practices of traders, residents, and visitors. Thus, the socio-economic indicators used in this study were selected from the questions posed. Consequently, a two-stage selection method was used to identify the questions that contained the information necessary for the purpose of this work. To carry out this screening, the opinion of different experts with backgrounds in various research areas such as environmental engineering, philology, biology, and economics was taken into account. First, the questions were classified according to the information contained considering the approach from a sustainable city and integrated tourism. Information such as i) the socioeconomic situation of residents and visitors, ii) the use that citizens make of the different areas of the city, iii) the social commitment of residents, and iv) the economic relationship between residents, tourism, and the city’s services and offers were established as reference frameworks [8,33]. In this way, all questions containing information within these defined frameworks were selected in this first step.
Nevertheless, most of these questions contained qualitative information. Thus, and with the objective of obtaining quantitative data from these questions, it was necessary to classify the answers to each question into different categories and give each of them a numerical value [34]. However, some of the questions selected in the previous stage cannot be directly quantified. For this reason, a second screening stage was carried out in which questions that could not be quantified or categorized and scaled were discarded
Finally, the number of questions selected was 19, 19, and 13 for the groups of citizens, traders, and visitors, respectively. These selected questions were renamed to be transformed into indicators as shown in Table 1. To simplify reading and comprehension, each indicator was coded with the letters C, T, or V, depending on whether citizens, traders, or visitors are involved, and a number. Table S1 of the Supplementary Material shows the indicators and the preceding questions.

2.3. Sustainability Score Calculation

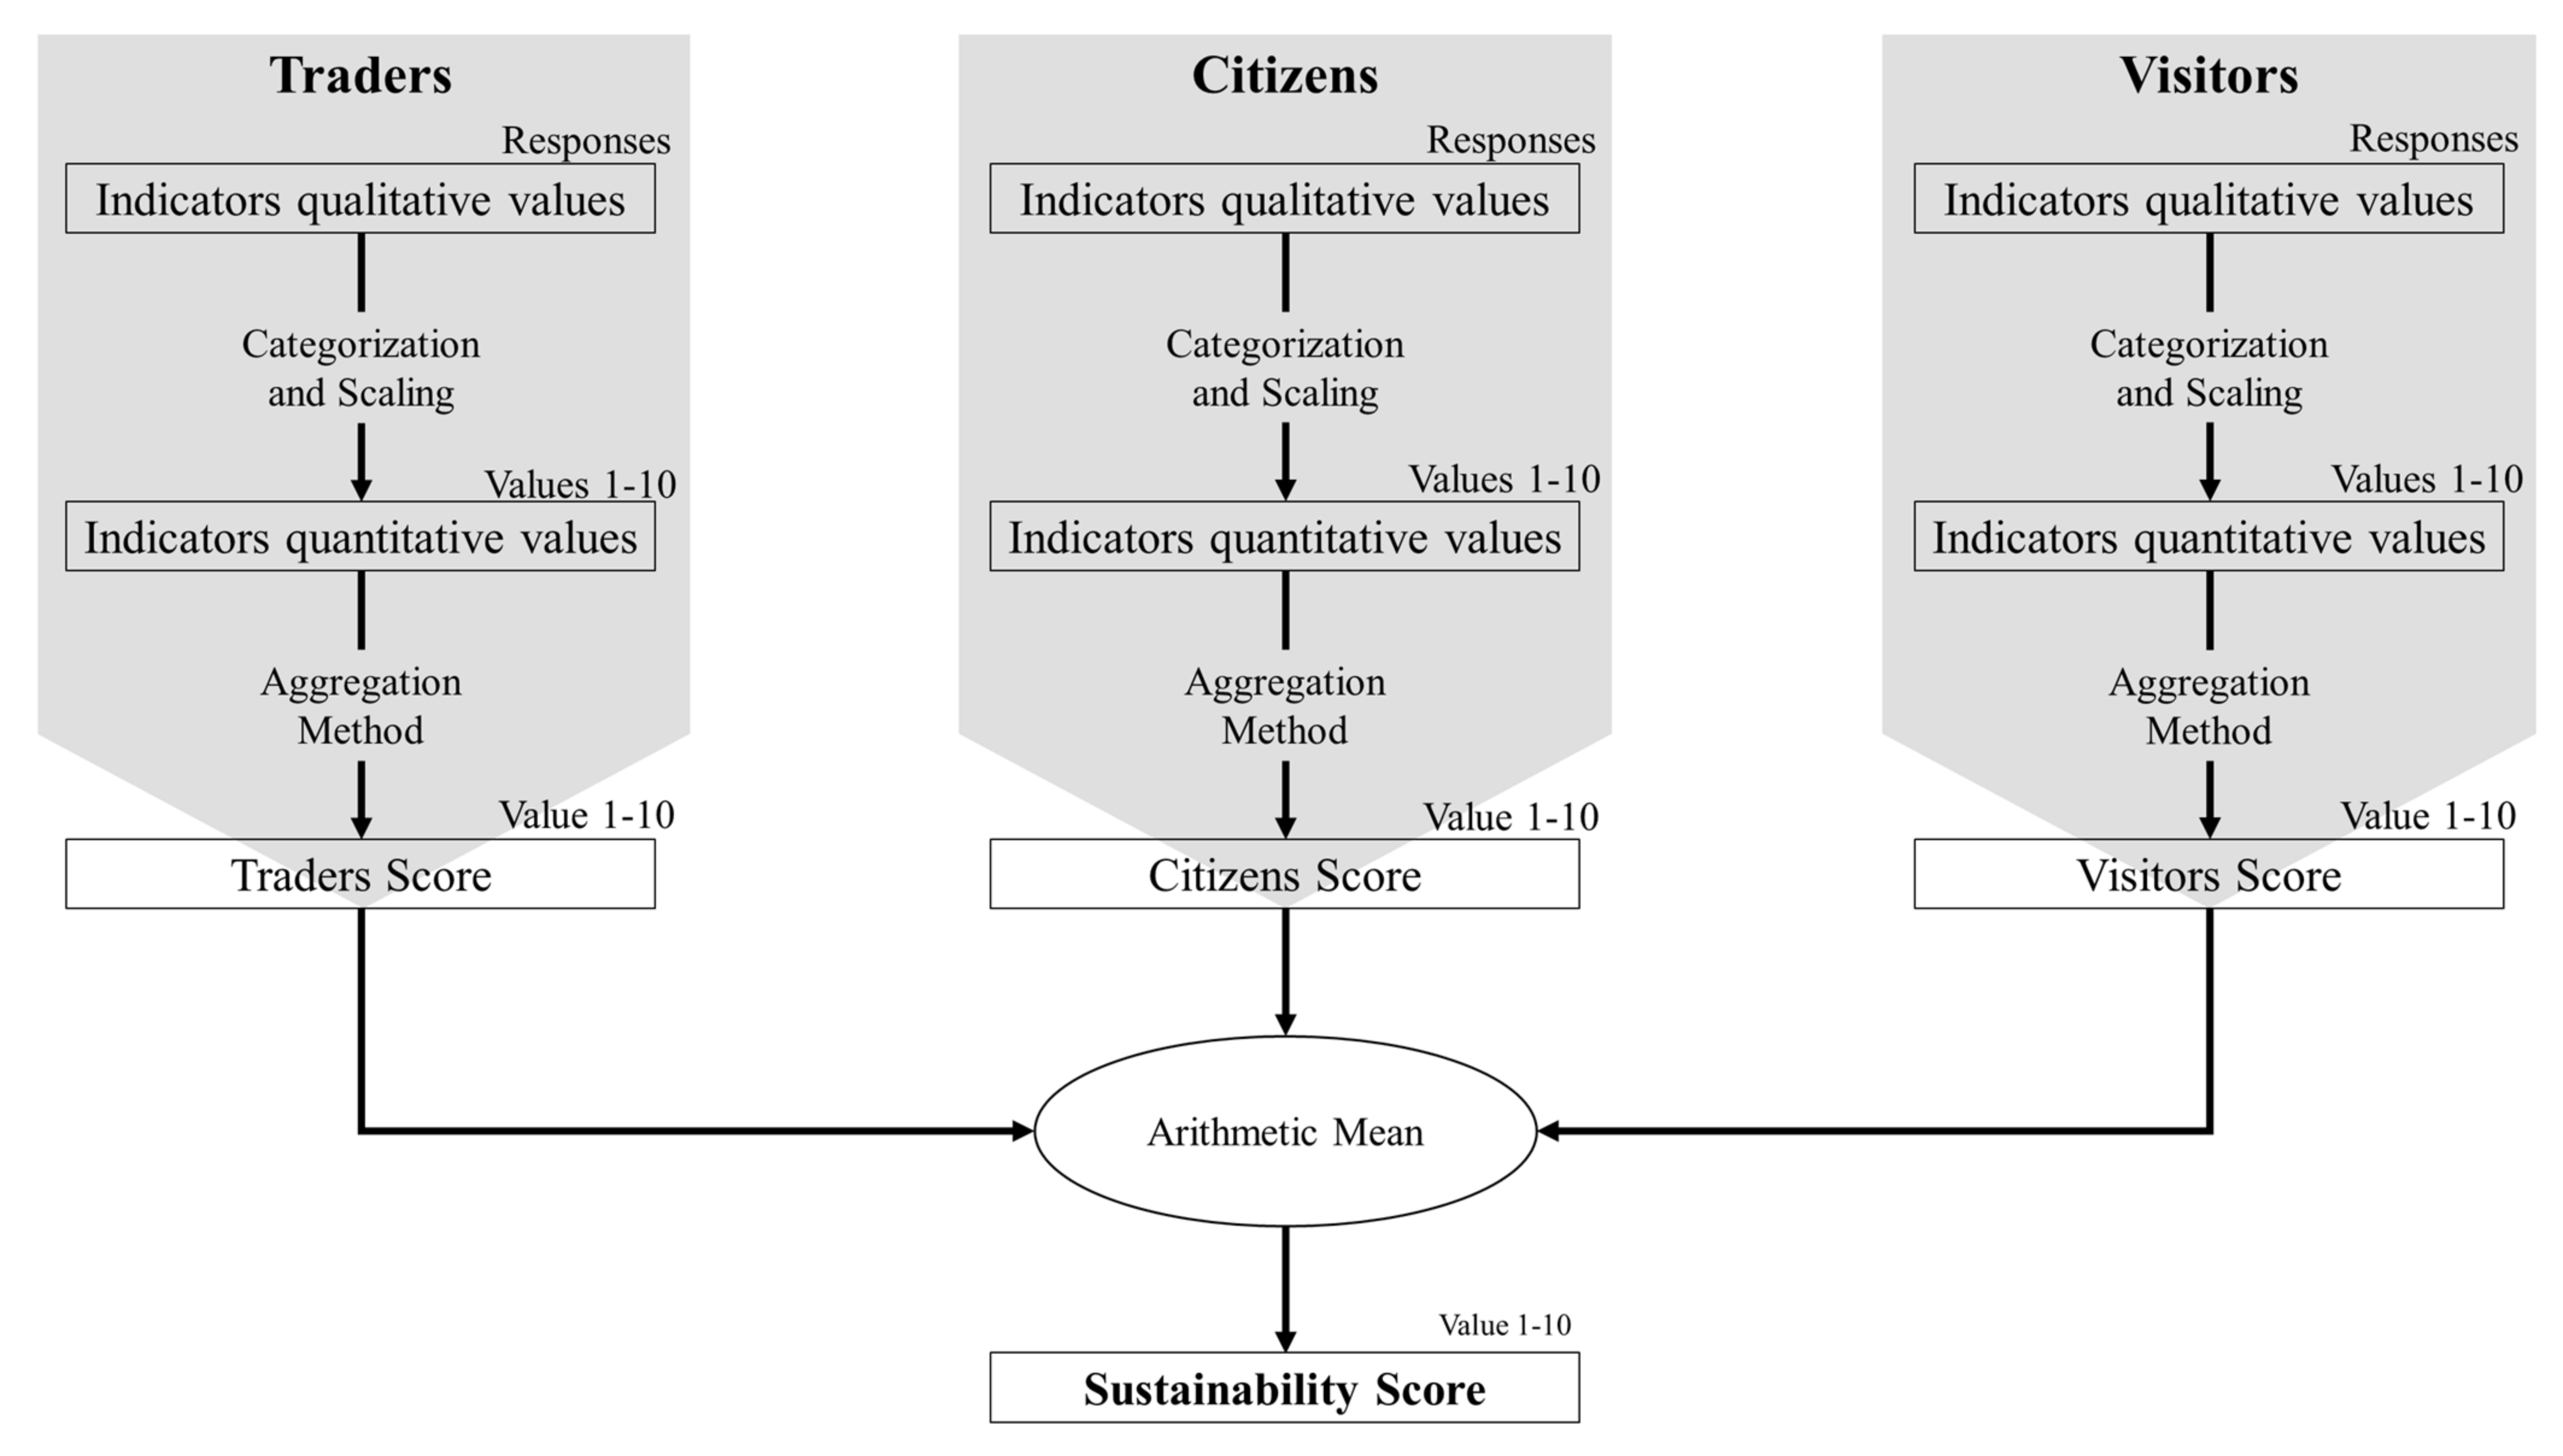
The objective of this study was to determine a sustainability score for Santiago de Compostela in relation to its tourism situation. This sustainability score, which reflects the degree of sustainability of tourism and its relationship with residents and traders, was calculated from the selected indicators. The score takes values on a scale of 0 to 10. Thus, a high score should mean that the relationship of citizens and traders with tourism was good, so that visitors should be integrated without harming the quality of life of residents. Figure 2 shows schematically how this sustainability score was calculated, which consisted of several steps. First, the different indicators were categorized and scaled by transforming the qualitative values (i.e., the answers to the questions to which each indicator corresponds) into numerical ones. Second, the indicator values within the same group (i.e., citizens, traders, or visitors) were summed to assign a score to each of the groups. Finally, the sustainability score of the city was the result of the weighted average of the scores of the groups. These steps are explained in more detail below.

2.3.1. Categorization and Scaling of Indicators

The information provided by the indicators was mostly qualitative, as mentioned above. Following the method described by Guttman [34], it was possible to scale the qualitative data. Therefore, to obtain quantitative values for these selected indicators, the responses for each indicator were grouped into different categories. Therefore, for each indicator, a certain number of categories were identified based on how the responses were grouped. The minimum number of categories identified in an indicator was two, corresponding to indicators with binary responses such as “Yes” or “No”.
On the other hand, the maximum number of categories identified was 8. In the case of indicators with two categories, a score of 1 was assigned to one of the categories and q score of 10 to the other. For indicators where more than two categories were identified, the values assigned to each category were calculated according to equation 1 [34]:
Y = X + M a x M i n n 1
where Y is the value of the category, X is the value of the lower category, Max is the maximum value of the scale (i.e., 10), Min is the minimum value of the scale (i.e., 1), and n is the number of categories identified in that indicator. For example, for an indicator in which 4 categories were identified (n = 4), Category 1 was assigned the lowest value on the scale (1), then the value of Category 2 was calculated considering the value of X (lower Category value) corresponding with the Category 1 value (1), and therefore the Category 2 value was:
Category   2 = 1 + 10 1 4 1 = 4
Thus, depending on the number of categories that were identified in each indicator, the value of each category was assigned. Table 2 shows the values of all the categories according to the number of categories identified according to the indicator.
The assignment of values to each category was based on whether the responses within a category were in line with the social, economic, and environmental principles of sustainability [35]. Therefore, the highest values were assigned to categories implying tourism that does not negatively influence the quality of life of residents [8], the economic offering of the city does not vary [36], and tourists use low-emission transport and consume local products [37]. Regarding the citizens and traders, the highest category values were assigned to those who have a high educational level, a high economic level, reside in the city (near the areas with greater tourist pressure), their economy does not depend on tourism, their purchases are made in the nearest local stores, their place attachment and their use of the areas are those with greater tourist pressure, and their social commitment to the city is high [33].
For example, if the question is “Where in the city do you shop?”, the category with the highest score (10) was the one that considers the closest establishments, since, from an environmental approach, it considerably reduces the emission of greenhouse gases (quantified as Carbon Footprint), which is linked to the distance between the home and the store [38]. In this sense, in some indicators, the Carbon Footprint was also considered as a criterion to assign values to the categories, considering that it is a widely used environmental parameter and to which society is sensitized.
Once the responses to each question were categorized, all the indicators were scaled according to the number of responses, classified in each category, and received the value assigned to that category as shown in Equation (2) [34]
I j = i = 2 n C i · R i T R j
where Ij is the Indicator j (C1–C19, T1–T19, or V1–V13 in the case of citizens, traders, or visitors, respectively), n is the total number of categories in Ij, Ci is a category identified within the indicator Ij, Ri is the number of responses classified within Ci, and TRj is the number of responses considered valid in Ij. In all indicators, some of the responses were not accounted for because they could not be classified within the categories. These responses correspond with answers such as “do not know” and “no answer”. Accordingly, each indicator Ij was quantified, obtaining a value on a scale between 1 and 10.

2.3.2. Aggregation

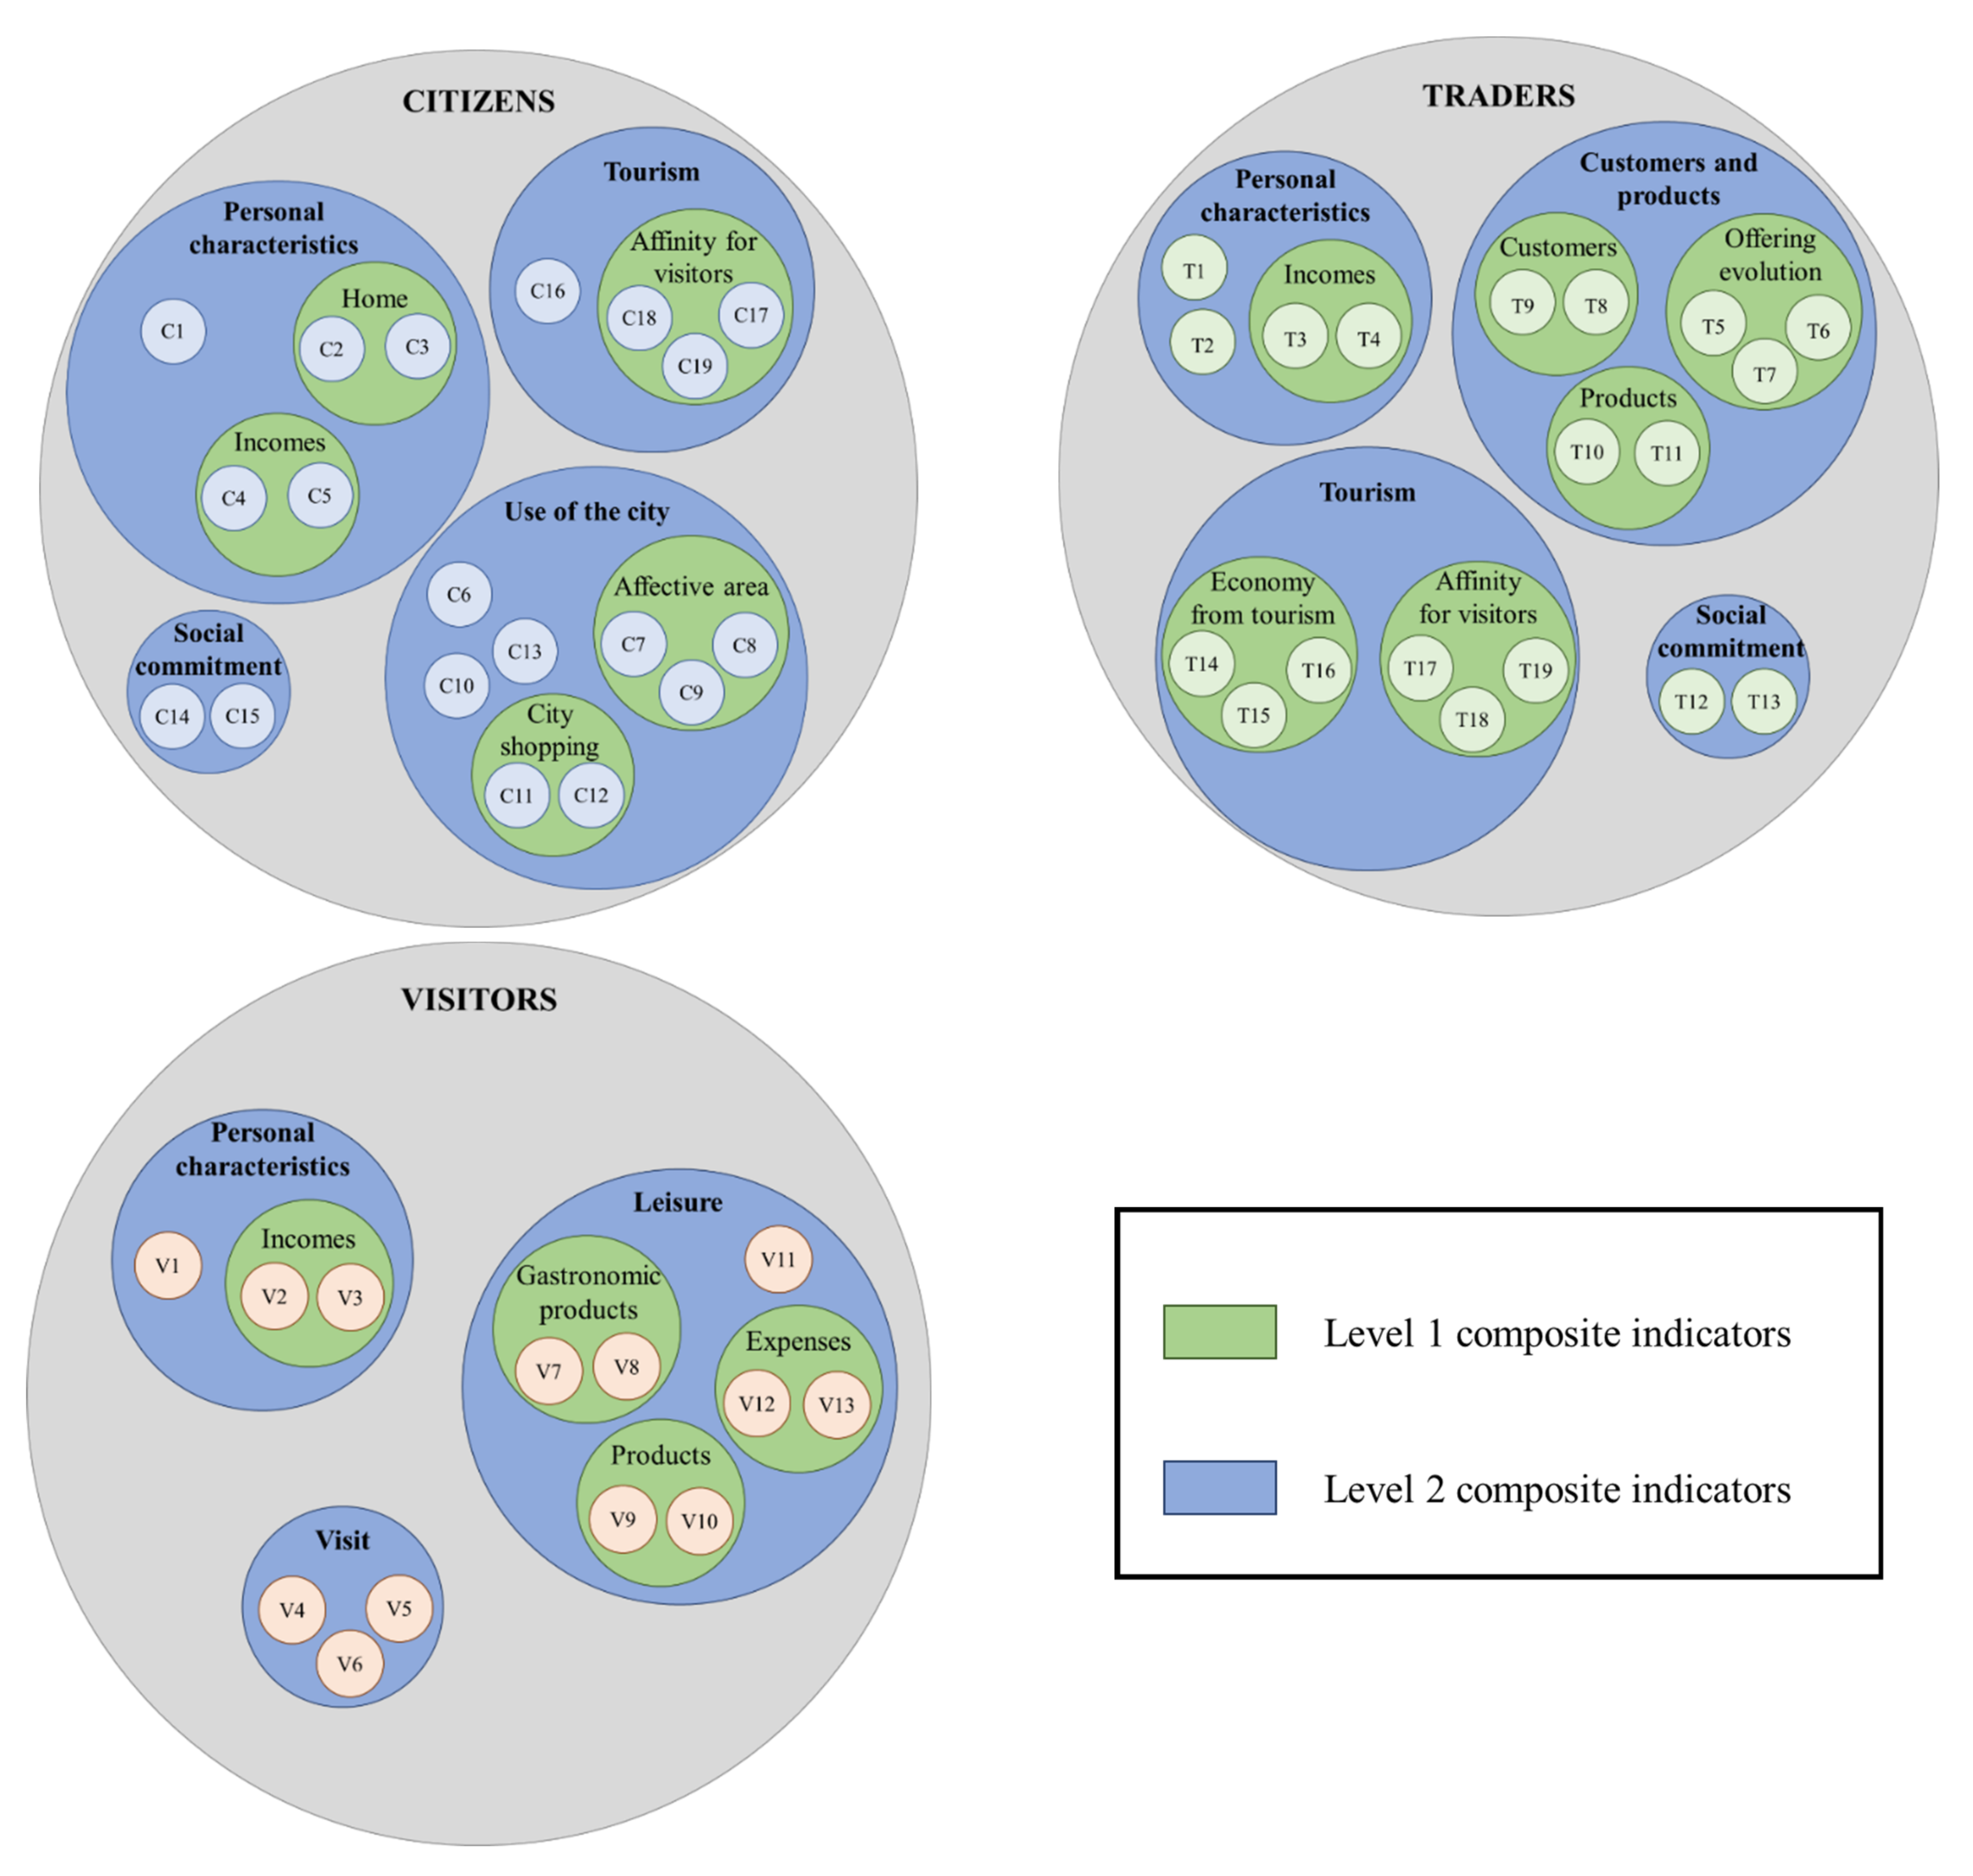
The aggregation method allowed us to first calculate the scores of each population group (citizens, traders, and visitors), and then from these scores, estimate the sustainability score of the city. To do so, it was necessary to define the specific aggregation method and the weight of each indicator [39]. In the present study, the arithmetic mean of the value of the selected indicators for each separate group was considered as the aggregation method, and equal weight was attributed to all indicators. Thus, to calculate the scores for each group, the indicators belonging to each of the groups were first aggregated into Level 1 composite indicators (level 1 CI), and then these were aggregated into Level 2 composite indicators (level 2 CI). These composite indicators were defined taking into account the relationship of some of the indicators to each other and the information that each indicator contains. Table 3 shows which Level 1 CI and Level 2 CI were defined for each of the population groups.
In addition, Figure 3 shows how the indicators were grouped into these composite indicators. All indicators were part of Level 2 CI, which was more generic. However, not all the indicators were grouped into Level 1 CI because they were not sufficiently related to be grouped. For example, C16, C17, C18, and C19 were grouped within the Level 2 composite indicator “Tourism” since all of these are related to the link between tourism and citizens; however, C17, C18, and C19 are related to the image perceived by citizens of tourism while C16 is related to an economic aspect. For this reason, C17, C18, and C19 were grouped in the Level 1 composite indicator “Affinity for visitors”, which, together with C16, were part of the “Tourism” level 2 composite indicator. In this way, some indicators were added directly to the Level 2 CI, as they were not grouped into the Level 1 CI. These were, within the group of citizens, C1, C6, C10, C13, C14, C15, and C16; in the group of traders, T1, T2, T12, and T13; and in the group of visitors, V1, V4, V5, V6, and V11.
Hence, the values of the Level 1 CI were calculated as the arithmetic mean of those from the corresponding indicators within each composite indicator. Values of the Level 2 CI were calculated as the arithmetic means of those indicators and the level 1 CI, which were grouped in each level 2 CI. Thus, both the Level 1 CI and Level 2 CI obtained values between 1 and 10. Accordingly, the scores of each population group were calculated as the average value of the Level 2 CI. Finally, the sustainability score for the city of Santiago de Compostela was calculated as the average of the scores that each group obtained.

3. Results and Discussion

3.1. Scaling and Categorization

As explained previously in the Material and Methods section, all the responses obtained for each question or indicator were classified into different categories. Table 4 shows the categories considered for each indicator. The values of each category corresponded to those stated in Table 2 according to the number of categories for each indicator. The number of categories is given by the number of possible answers to the surveys. Thus, the categories that appear on the left of Table 4 were the categories with the lowest score, and those that are on the right were the categories with the highest scores. It should be noted that the highest scores are given to categories that favor more sustainable tourism. Therefore, the responses from C1 and T1, for example, were classified into three different categories, and according to Table 2, a value was assigned: “No education or primary education” with a value of 1, “Secondary education” with a value of 5.5, and “University education” with a value of 10. The highest value in this category was assigned taking into account that the degree of education positively influences the social aspect of the sustainability of an urban system [40,41]. In the case of “place of residence”, implicit in indicators C2, C3, and T2, the highest values were assigned to residents in the city and near the Old Town. This implies favoring the city model in which living in the most touristic areas was economically affordable and comfortable. In terms of income level, the categories with the highest values were those that imply a high level of income (C4, T3, and V3) or an income-earning employment situation (C5, T4, and V2).

3.1.1. Citizens

Based on the indicators selected for the group of citizens, the values of the categories corresponding to the indicators of “use of the city” and “the affective areas” (C6, C7, and C13) were assigned to favor the use of the areas with more tourist intensity (Old Town, cathedral, etc.). Moreover, for the categories of indicators C8 and C9, a value of 10 was assigned to the answers in which citizens declared that the affective places selected by them would coincide with those selected by other citizens for indicator C8, and those who stated that there are elements in the city that should be known as the image of Santiago de Compostela in the case of indicator C9. In addition, the categories of indicator C10 were scaled, assigning the highest values to the categories that represent more years residing in the city. This implies favoring citizens with longer stays in Santiago, which was considered a good indicator of the quality of life [33].
The categories of indicators related to the commerce and purchases of citizens, C11 and C12, were scaled so that the categories involving local products and commerce received the highest values. The rationale was that local trade and consumption of local products have a lower carbon footprint [37,42].
Additionally, a high degree of place attachment and social commitment among citizens are symptoms of good health within a community [33]. For this reason, the categories belonging to indicators C14 and C15 were assigned higher values based on the higher degree of place attachment or community engagement. Finally, the citizen group indicators within the level 2 composite indicator "Tourism", C16, C17, C18, and C19, defined the relationship between citizens and tourism. Consequently, this concerned whether there is a high economic dependence, whether they agree with the image of the city that is sold, whether tourism modifies their way of life, or whether they prefer the current type of city compared to the early 1990s when there was not yet such a high tourist intensity. The categories of these indicators were scaled, assigning the highest values to the categories that indicated, in the case of C16, a non-economic dependence on tourism, so that if tourism falls, it does not affect the city’s economy to a large extent. Regarding the image of the city of C17, the categories with the highest values were those that reflect the responses of the citizens who most agree with the social perception of Santiago de Compostela, because it is a symptom that they like the type of tourism that visits the city.
For the lifestyle of citizens in C18, the highest values were assigned to the responses in which tourism does not modify the lifestyle of citizens. In other words, the less tourism modifies the lifestyle of citizens, the higher the score for this indicator. Finally, the values assigned to the C19 categories were established, taking into account that if citizens preferred the city when the tourism intensity was lower, tourism is negatively affecting citizens. Thus, the highest values were assigned to the categories that indicate a preference for the city at present.

3.1.2. Traders

Considering the indicators selected for the group of traders, the values of the categories of those indicators within the level 2 composite indicator “customers and products” (T5, T6, T7, T8 T9, T10, and T11) were assigned to favor the categories that included responses that take into account that the offer has not changed with tourism, most of the customers were city residents, and the products demanded by citizens and visitors are the same. In other words, these answers were in line with the idea that tourism plays an important role within the city but was not the main source of income for traders. On the other hand, as in the case of citizens, the categories belonging to the indicators of place attachment, as well as of social commitment, T12 and T13, the highest values were assigned to the categories that encompass the responses indicating a greater place attachment and a high degree of social commitment.
In addition, the categories of those indicators within the level 1 composite indicator “Economy from tourism” (T14, T15, and T16) were scaled considering that a trade that depends mainly on tourism is a vulnerable and fragile trade. In fact, currently, due to the global pandemic caused by COVID-19, the economy of tourist cities such as Venice has been seriously affected [16]. In another way, for the indicators grouped in the level 1 composite indicator “Affinity for visitors”, T17, T18, and T19, the categories were scaled considering that traders agree with the image of the city that is sold and that they like the type of tourist who visits the city.

3.1.3. Visitors

Finally, for the indicators selected for the group of visitors, the indicator related to transport used to get to the city (V4) was categorized, assigning the lowest values to visitors arriving by plane and the highest to visitors who traveled by bicycle or walking. These values were established considering CO2 emissions and the contribution to climate change of each means of transport. The categories of the V5 and V6 indicators were scaled by assigning higher values to the categories that imply that the visit was satisfactory, as well as that the visitors discovered interesting activities that they were not aware of. As for the group of citizens, the categories of indicators within the level 1 composite indicator “Gastronomic products” V7 and V8, and within the level 1 composite indicator “Products” V9 and V10, which are related to commerce and consumption in bars and restaurants, were scaled, more favorably evaluating those categories that involve consumption in local trade and local products.
Regarding the accommodation contemplated in indicator V11, it was categorized by valuing tourists staying within the city limits more positively. Finally, from the economic perspective of the visitor, indicators within the level 1 composite indicator “Expenses”, V12 and V13, were scaled considering the total expenses of the visitors in the city. For the first (V12), the expenses were classified into two types of expenses: Expenses such as accommodation and transportation and leisure expenses. The objective of this classification was to identify the amount of spending that was allocated only to accommodation and transport, which was favorable as it was low and affordable, and spending on leisure, cultural, gastronomic activities, etc. This type of leisure spending was favorable if it was higher because it economically benefits more sectors of the city. The categories of indicator V13 were designated considering the average expenditure per visit and person in Galicia, which is approximately 1100 €. In this sense, the values were assigned to the different categories considering the most favorable category, the one in which the expense exceeds the amount of 1100 €.

3.2. Final Scores and Sustainability Score

Once the categories of each indicator were defined and scaled, we calculated the score for the indicators. These scores of the indicators were quantified on a scale from 1 to 10, and then they were added by means of the arithmetic mean as explained above in Section 2.3 to calculate the score for each group. Table 5 shows the scores for the groups identified in this study and the total score for Santiago de Compostela. All groups obtained similar values between 6.95 and 6.69 so there was no specific group with a limiting score or a key factor to improve the overall score of the city. Considering that the maximum value that could be reached was 10, these values indicate the possibility of a large improvement in terms of sustainability.
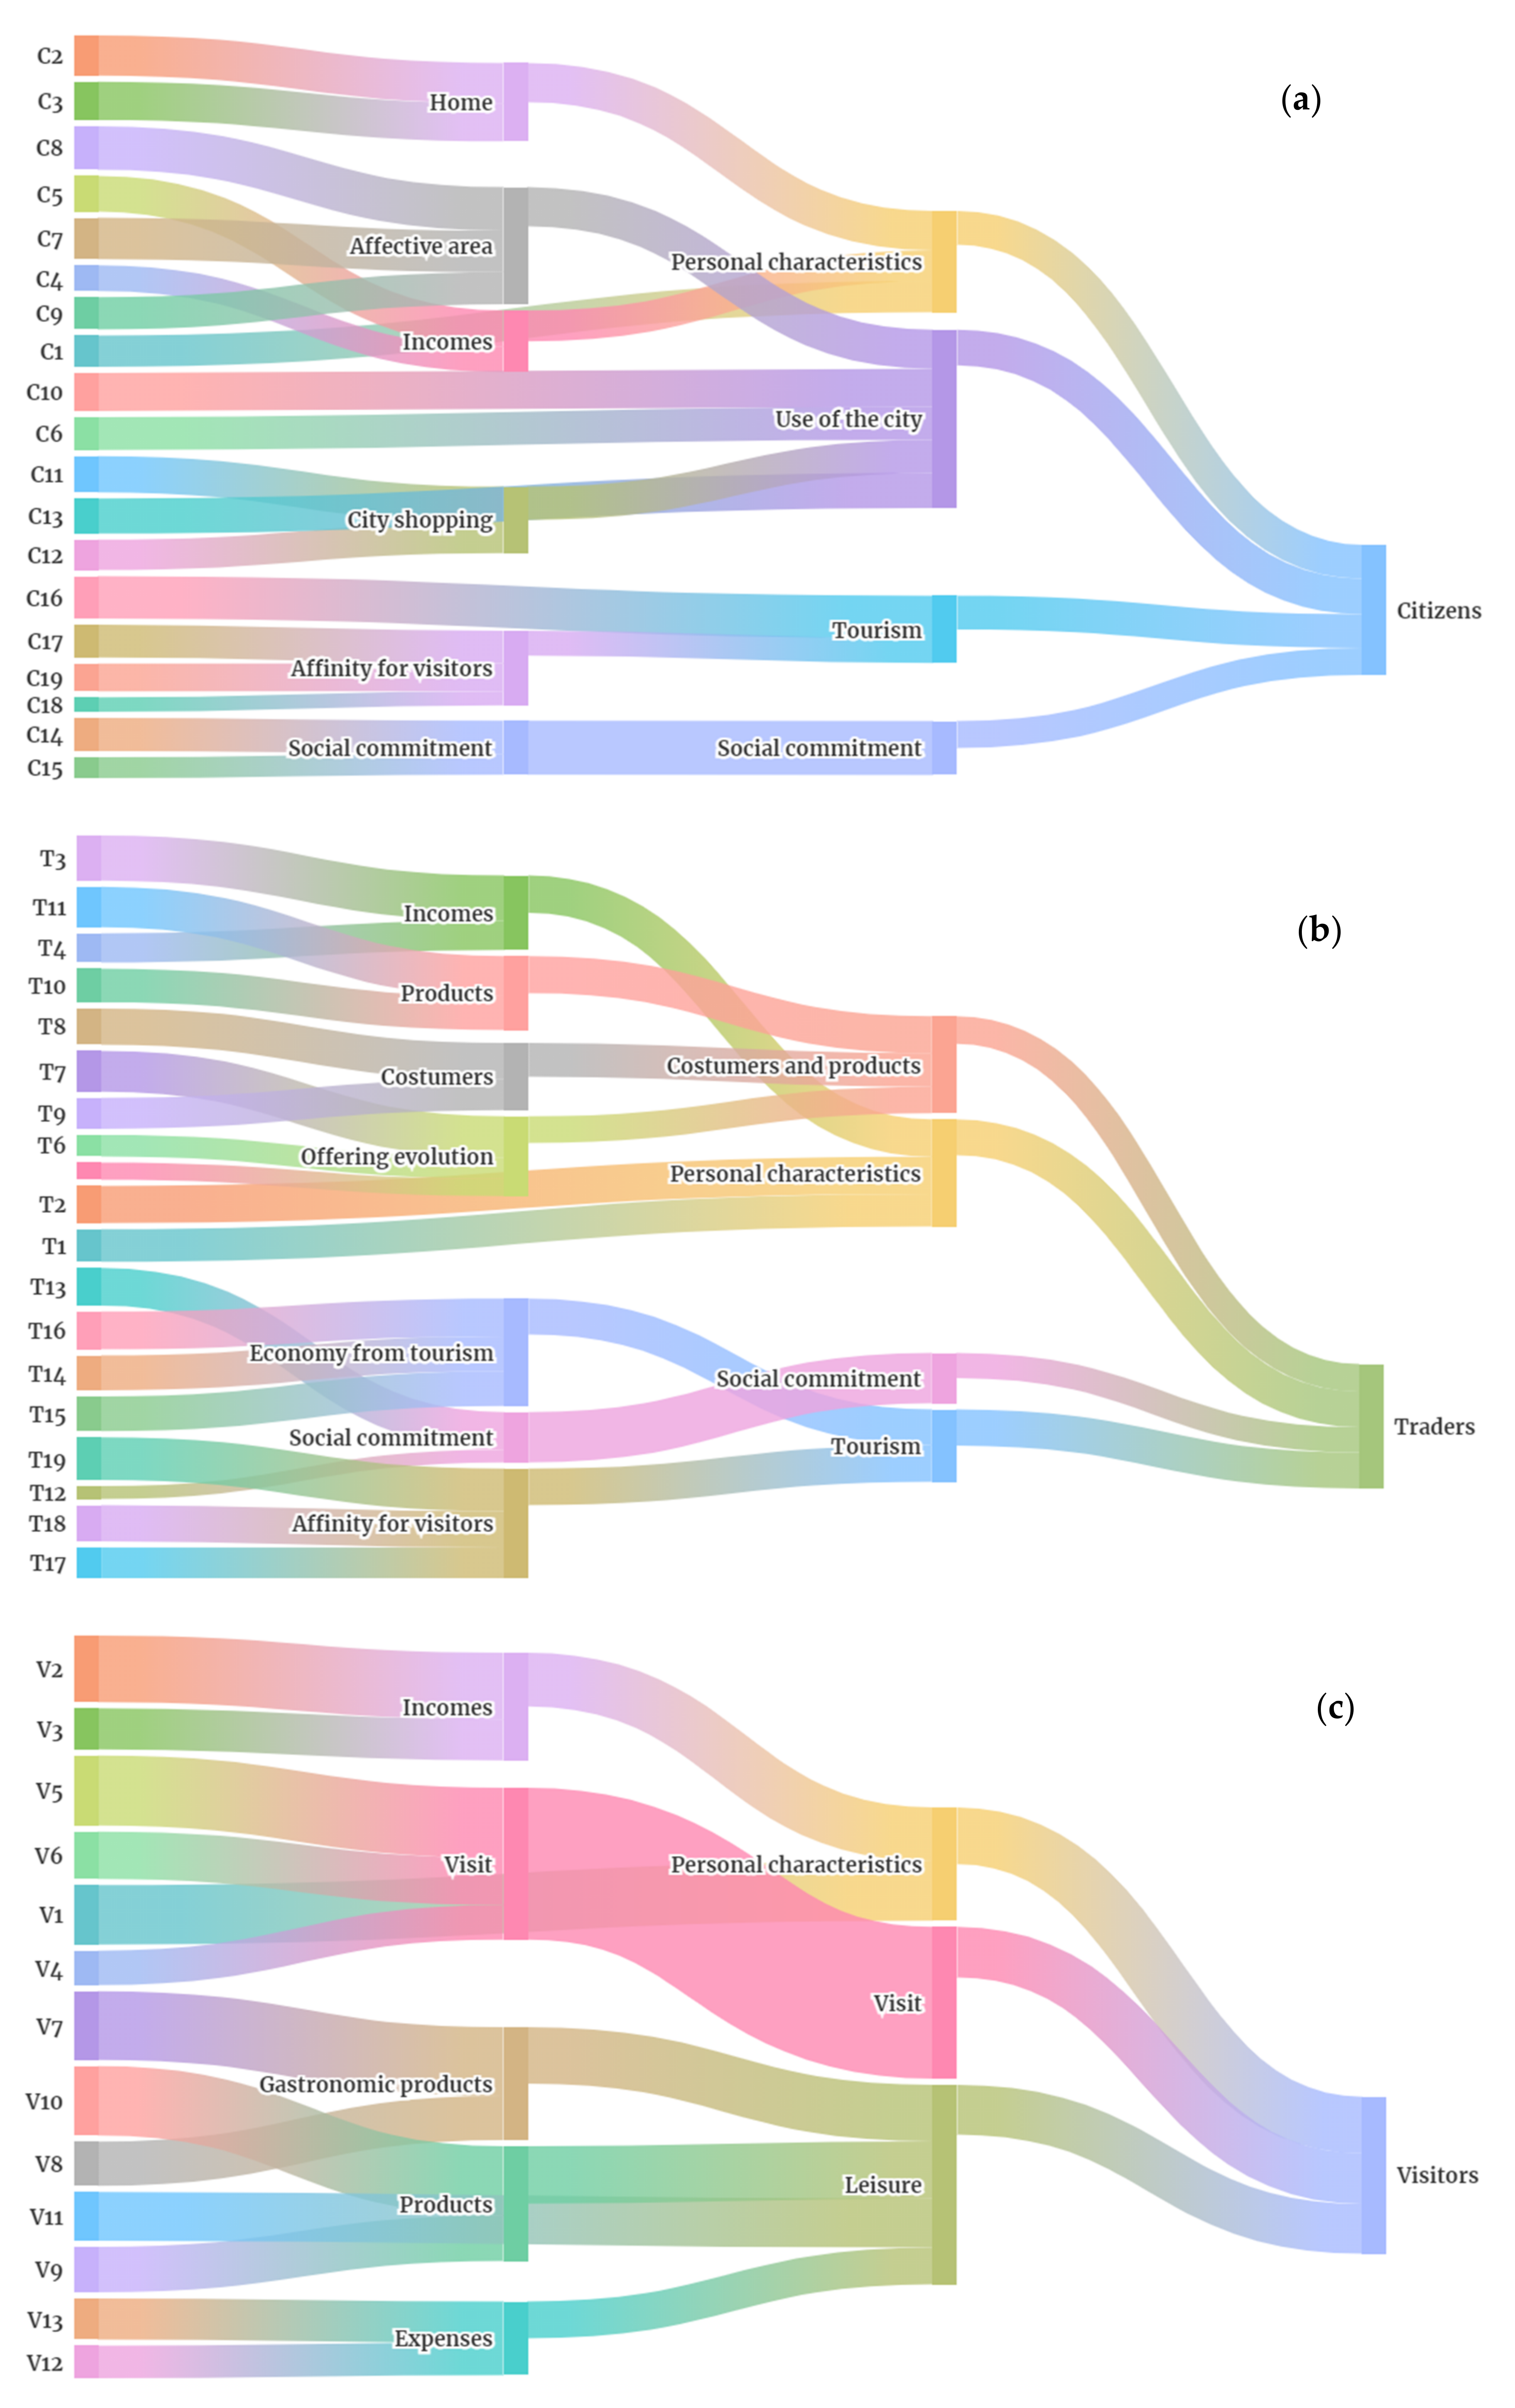
With the aim of proposing improvement actions to the sustainability score of the city, attention should be paid to the indicators that received the lowest marks so that specific actions can be defined. Figure 4 shows how the indicators were aggregated to obtain the score for each group. The width of each line corresponds to the scores calculated for each indicator; therefore, the thinnest lines show indicators that obtained the lowest scores. So, in the case of citizens, the indicators with the lowest values were C4, C15, and C18, which correspond with “Family income level”, “Community Participation”, and “Citizen Lifestyle”, respectively. The values obtained from each indicator are detailed in Table S2 in the Supplementary Material, which complements Figure 4. This table shows that the value for the indicator “Family income level” was approximately 5.5, which indicates a medium level of income among the respondents. The “Community Participation” indicator referred to the level at which citizens participate in community activities (sports and cultural associations, politics, etc.). Citizen participation in these types of activities creates social ties with the city, generating a healthier community [40]. Moreover, high values in this indicator, as well as in “Place attachment”, were related to durable settlements allowing the growth of the city [29]. On the other hand, most citizens consider that tourism affects their lifestyle as indicated by “Citizen Lifestyle”. However, how was it affecting their lifestyle? According to the respondents, the main reason is the saturation of tourism in the old town. This phenomenon is currently displacing the citizens of the historic area. Even though the indicators for “Residence within the city” and “Leisure places” both received high values, most of the citizens do not reside in the city center, and the use of green areas by citizens increased in detriment to the use of the historic area [32]. Consequently, we observed a trend towards depopulation of the Old Town.
In the case of traders, indicators T5, T6, and T12, which corresponded to “Offering evolution”, “Perception of changes in the offer”, and “Community Participation”, were identified as the indicators with the lowest scores. As would be expected after the result of the "Community participation" indicator obtained in the group of citizens, this indicator also has a low score in the group of traders, because most of the traders are residents of the city. Regarding the evolution of the offer, this indicates how trade adapted according to the demand of the clients. When this change in the offering is encouraged by the tourism sector, as in the case of Santiago de Compostela, it may cause the variety of products offered to decrease. Therefore, all restaurants adapt to this demand by increasing the difference between the menu of a restaurant with respect to the daily diet of a resident [43]. Furthermore, as the demand for the same products increases drastically, local production may not be enough to supply this demand, and therefore many of the products offered were imported from other countries with the environmental implications that this brings, such as a higher CF [37]. In addition, the change in the offers promoted by tourism is one more way in which tourism affects the lifestyle of residents, since the offers were more appropriate to the profile of a visitor than to a resident.
Finally, considering visitors, the indicators with the lowest scores were V3, V4, V12, and V13, which corresponded to “Family income level”, “Transport used”, “Spending on visit”, and “Total spending per person”. As in the case of citizens, the score for the indicator “Family income level” was approximately 5.5 (Table S2 of the Supplementary Material). This indicates that the income of the interviewed visitors was adjusted to the normal income. Regarding the low score for the “Transport used” indicator, which referred to the means of transport used to visit the city, it indicates that the most used means are planes, private cars, and buses, which are means with a large contribution to climate change [44]. Even though many visitors came to Santiago on foot or by bicycle following the Way of St. James, most of the tourists arrived on this type of transport. Tourism mobility is not only an environmental problem in Santiago de Compostela as in isolated cities or countries, but it is also an international problem [45,46,47]. A possible solution to reduce the emissions associated with air transport trips is to promote domestic tourism, that is, tourism without leaving the country or the region, without the need for long-distance trips [48].
On the other hand, the low scores obtained in indicators V12 and V13 related to spending could be due to the fact that the cost of living in Santiago is lower than in other cities. However, taking into account the scores of indicators V8 and V9, which correspond to spending in the city’s establishments, the values were 5.77 and 5.93, respectively (Table S2 “Supplementary Material”), which exceed 5.50 but are also quite low. This indicates that the daily spending in the city of the visitors is low. One of the reasons could be that the product offering was not attractive to most visitors. Considering that traders perceive that the offer of trade has changed as tourism in the city has increased, it is possible that this evolution was promoted by a minority of visitors. Better advertising and an expansion of the offerings could favor consumption and thus increase the expenditure of visitors. Even though spending on gastronomic products is low, indicators V7 and V10 show that the consumption of local products prevails over other products, and that these gastronomic products are purchased in local stores, which favors the local economy and is more sustainable.

4. Conclusions

Tourism in Santiago de Compostela has markedly increased in the last thirty years. In addition, the Old Town and the cathedral of the city are the main tourist attraction, making it the area with the greatest tourist pressure. This study presents the development of a methodology based on a series of indicators to determine the impact that this growth in tourism has on the three groups involved: Citizens, traders, and visitors.
The final result obtained on a scale of 1 to 10 was 6.84, which indicates that despite not being a bad value, tourism’s relationship with city residents can be considerably improved. Considering the values obtained for the indicators, this study concluded that the way of life of the citizens was altered significantly due to tourism. One of the main consequences was the displacement of the citizens’ residences to more peripheral places of the city, moving away from the Historical Center. Another is the change in the places of leisure, where the use of green areas increased as the use of the Historical Area decreased. In addition, commerce varied the offerings available for tourism, casting the demand of residents aside. However, despite this, visitor expenditure was low in relation to the regional average expenditure per visitor. Thus, the variation in this supply was detrimental to residents and unattractive to visitors.
Some possible solutions to better integrate tourism in the city could be to dilute the pressure of the Old Town and enhance tourism in the different neighborhoods of Santiago de Compostela. In addition, the range of products on offer (poor gastronomic examples) should be expanded, and the advertising of the products offered by the city should be improved to encourage consumption and increase visitor spending. Accordingly, local and regional governance could improve the reach and impact of the online advertising of Galician products, which could be a good way to publicize more products and broaden the range of offerings.
This paper analyzes the impact of tourism in Santiago de Compostela, but the methodology used can be applied to other cities on St. James Way or other cities with important historical areas with similar characteristics. Moreover, it can be applied by updating the data so that the trends adopted by the indicators over time can be observed. Therefore, this work may be of interest to policy makers, as it provides useful information to design strategies for more integrated and sustainable tourism in the future.

Supplementary Materials

The following supporting information can be downloaded at: https://www.mdpi.com/article/10.3390/su142013253/s1, Table S1: Equivalence between questions in the Rede Galabra questionnaire and the indicators used; Table S2: Scores calculated for the indicators.

Author Contributions

Conceptualization, M.R., E.C., S.G.-G., E.T.-F., M.L.d.R., and G.F.; methodology, M.R.; validation, M.R., E.C., S.G.-G., E.T.-F., M.L.d.R., and G.F; formal analysis, M.R., S.G.-G., and G.F.; investigation, M.R., E.C., S.G.-G., E.T.-F., and M.L.d.R.; resources, E.C., E.T.-F., and M.L.d.R.; data curation, M.R., E.C., S.G.-G., E.T.-F., M.L.d.R., and G.F.; writing—original draft preparation, M.R., S.G.-G., M.T.M.; M.R., E.C., S.G.-G., E.T.-F., M.L.d.R., M.T.M., and G.F; visualization, M.R. and G.F.; supervision, M.R., E.C., S.G.-G., E.T.-F., M.L.d.R., and G.F.; funding acquisition, S.G.-G., E.T.-F., and M.T.M. All authors have read and agreed to the published version of the manuscript.

Funding

This research was partially supported by two projects granted by the Spanish Government and FEDER/Ministry of Science and Innovation and Universities—Spanish National Research Agency CTQ2016-75136-P and FFI2017-88196-R.

Institutional Review Board Statement

Ethical review and approval were waived for this study due to the total anonymity of the surveys carried out.

Informed Consent Statement

Informed consent was obtained from all subjects involved in the study.

Data Availability Statement

Not applicable.

Acknowledgments

S.G.-G. would like to express her gratitude to the Spanish Ministry of Economy and Competitiveness for financial support (Grant reference RYC-2014-14984). The authors M.R., S.G-G, M.T.M., and G.F. belong to CRETUS and the authors E.C. and E.J.T.F. belong to the Galician Potential Growth Research Group ED431B 2020/40. All these programs are co-funded by FEDER (EU).

Conflicts of Interest

The authors declare no conflict of interest.

References

  1. Steffen, W.; Broadgate, W.; Deutsch, L.; Gaffney, O.; Ludwig, C. The trajectory of the anthropocene: The great acceleration. Anthr. Rev. 2015, 2, 81–98. [Google Scholar] [CrossRef]
  2. Chrysoulakis, N.; Lopes, M.; San José, R.; Grimmond, C.S.B.; Jones, M.B.; Magliulo, V.; Klostermann, J.E.M.; Synnefa, A.; Mitraka, Z.; Castro, E.A.; et al. Sustainable urban metabolism as a link between bio-physical sciences and urban planning: The BRIDGE project. Landsc. Urban Plan. 2013, 112, 100–117. [Google Scholar] [CrossRef]
  3. The World Bank. Available online: http://www.worldbank.org/en/topic/urbandevelopment/overview (accessed on 15 July 2022).
  4. United Nations. Available online: https://sdgs.un.org/goals (accessed on 15 July 2022).
  5. Marans, R.W. Quality of urban life & environmental sustainability studies: Future linkage opportunities. Habitat Int. 2015, 45, 47–52. [Google Scholar]
  6. Postma, A.; Buda, D.M.; Gugerell, K. The future of city tourism. J. Tour. Futures 2017, 3, 95–101. [Google Scholar] [CrossRef] [Green Version]
  7. OCDE Data. Available online: https://data.oecd.org/industry/tourism-gdp.htm (accessed on 15 July 2022).
  8. Biagi, B.; Ladu, M.G.; Meleddu, M.; Royuela, V. Tourism and the city: The impact on residents’ quality of life. Int. J. Tour. Res. 2020, 22, 168–181. [Google Scholar] [CrossRef]
  9. López Pena, Z.; Samartim, R.; Bello Vázquez, R.; Pazos-Justo, C.; Iriarte Sanromán, Á.; Sotelo Docío, S. Visitar, Comerciar e Habitar a Cidade. Desenvolvemento do Proxecto Expositivo e Participación Social en Santiago de Compostela; Andavira: Santiago de Compostela, Spain, 2020. [Google Scholar]
  10. Torres Feijó, E.; del Rio Araujo, M.L.; Carral, E.V.; Rodríguez Prado, M.F.; Pichel Iglesias, I. A Cidade, o Camiño e nós. Desenvolvemento do Proxecto Expositivo e Participación Social en Santiago de Compostela; Andavira: Santiago de Compostela, Spain, 2020. [Google Scholar]
  11. Claudio, M.; Joseph, M.C.; Marina, N. Overtourism: A Growing Global Problem. The Conversation España 2018. Available online: https://theconversation.com/overtourism-a-growing-global-problem-100029 (accessed on 15 July 2022).
  12. Trancoso González, A. Venice: The problem of overtourism and the impact of cruises. Investig. Reg. 2018, 42, 35–51. [Google Scholar]
  13. Diaz-Parra, I.; Jover, J. Overtourism, place alienation and the right to the city: Insights from the historic centre of Seville, Spain. J. Sustain. Tour. 2021, 29, 158–175. [Google Scholar] [CrossRef]
  14. Ramos, S.P.; Mundet, L. Tourism-phobia in Barcelona: Dismantling discursive strategies and power games in the construction of a sustainable tourist city. J. Tour. Cult. Chang. 2020, 19(1), 113–131. [Google Scholar] [CrossRef]
  15. Cristiano, S.; Gonella, F. ‘Kill Venice’: A systems thinking conceptualisation of urban life, economy, and resilience in tourist cities. Humanit. Soc. Sci. Commun. 2020, 7, 1–13. [Google Scholar] [CrossRef]
  16. Ortega, B.; Sanjuán, J. A measure of the economic dependence of countries on tourism. In Proceedings of the International Conference on Tourism and Business, Lucerne, Switzerland, 25–27 August 2022; pp. 1–3. [Google Scholar]
  17. Moonga, M.S.; Namafe, C.; Chileshe, B. Sustainability model for integrating green concepts and practices into the curricula of tourism and hospitatily training institutions in Zambia. Int. J. Res. Sci. Innov. Appl. Sci. 2022, 6, 709–715. [Google Scholar]
  18. Iglesias-Iglesias, R.; Fernandez-Feal, M.C.; Kennes, C.; Veiga, M.C. Valorization of agro-industrial wastes to produce volatile fatty acids: Combined effect of substrate/inoculum ratio and initial alkalinity. Environ. Technol. 2021, 42, 3889–3899. [Google Scholar] [CrossRef] [PubMed]
  19. Choi, W.M.; Chan, A.; Wu, J. A qualitative and quantitative assessment of Hong Kong’s image as a tourist destination. Tour. Manag. 1999, 20, 361–365. [Google Scholar] [CrossRef]
  20. Stylidis, D.; Biran, A.; Sit, J.; Szivas, E.M. Residents’ support for tourism development: The role of residents’ place image and perceived tourism impacts. Tour. Manag. 2014, 45, 260–274. [Google Scholar] [CrossRef]
  21. Özgit, H.; Akanyeti, I. Environmental regulations versus sustainable tourism indicators: A pathway to sustainable development. Worldw. Hosp. Tour. Themes 2022, 14, 393–402. [Google Scholar] [CrossRef]
  22. Tsaur, S.H.; Lin, Y.C.; Lin, J.H. Evaluating ecotourism sustainability from the integrated perspective of resource, community and tourism. Tour. Manag. 2006, 27, 640–653. [Google Scholar] [CrossRef]
  23. Woosnam, K.M. Using emotional solidarity to explain residents’ attitudes about tourism and tourism development. J. Travel Res. 2021, 51, 315–327. [Google Scholar] [CrossRef]
  24. Ribeiro, M.A.; Pinto, P.; Silva, J.A.; Woosnam, K.M. Residents’ attitudes and the adoption of pro-tourism behaviours: The case of developing island countries. Tour. Manag. 2017, 61, 523–537. [Google Scholar] [CrossRef]
  25. Vengesayi, S.; Mavondo, F.T.; Reisinger, Y. Tourism destination attractiveness: Attractions, facilities, and people as predictors. Tour. Anal. 2009, 14, 621–636. [Google Scholar] [CrossRef]
  26. Campos Herrero, C.; Laso, J.; Cristóbal, J.; Fullana-i-Palmer, P.; Albertí, J.; Fullana, M.; Herrero, A.; Margallo, M.; Aldaco, R. Tourism under a life cycle thinking approach: A review of perspectives and new challenges for the tourism sector in the last decades. Sci. Total Environ. 2022, 845, 157261. [Google Scholar] [CrossRef]
  27. Ribeiro, M.A.; Woosnam, K.M.; Pinto, P.; Silva, J.A. Tourists’ destination loyalty through emotional solidarity with redents: An integrative moderated mediation model. J. Travel Res. 2018, 57, 279–295. [Google Scholar]
  28. Galician Institute of Statistics. Municipal Population Census. Statistical Exploitation. 1998–2021. Available online: http://www.ige.eu/web/mostrar_actividade_estatistica.jsp?idioma=gl&codigo=0201001002 (accessed on 15 July 2022).
  29. Galician Institute of Statistics. Municipal Gross Domestic Product. Statistical Review 2019. Available online: https://www.ige.eu/web/mostrar_actividade_estatistica.jsp?idioma=gl&codigo=0307007007 (accessed on 19 July 2022).
  30. Lopez, L.; Pazos Otón, M.; Piñeiro Antelo, M.A. Is there overtourism in Santiago de Compostela? Contributions for an ongoing debate. Boletín Asoc. Geógrafos Españoles 2019, 83, 1–48. [Google Scholar]
  31. Galicia Institute of Statistics. Travelers, Nights and Average Stay in Hotel Establishments by Tourist Points-Municipalities. Monthly Data. Available online: http://www.ige.eu/web/mostrar_actividade_estatistica.jsp?codigo=0305002&idioma=es (accessed on 19 July 2022).
  32. Rede Galabra. Impacts of the Camino on the Local Community of Santiago de Compostela. Available online: https://redegalabra.org/impactos-caminho-comunidade-local-santiago-compostela/ (accessed on 15 August 2022).
  33. Tournois, L.; Rollero, C. “Should I stay or should I go?” Exploring the influence of individual factors on attachment, identity and commitment in a post-socialist city. Cities 2020, 102, 102740. [Google Scholar] [CrossRef]
  34. Guttman, L. A basis for scaling qualitative data. Am. Sociol. 1944, 9, 139–150. [Google Scholar] [CrossRef]
  35. Feleki, E.; Vlachokostas, C.; Moussiopoulos, N. Characterisation of sustainability in urban areas: An analysis of assessment tools with emphasis on European cities. Sustain. Cities Soc. 2018, 43, 563–577. [Google Scholar] [CrossRef]
  36. Barata-Salgueiro, T.; Guimarães, P. Public policy for sustainability and retail resilience in Lisbon city center. Sustainability 2020, 12, 9433. [Google Scholar] [CrossRef]
  37. Gössling, S.; Garrod, B.; Aall, C.; Hille, J.; Peeters, P. Food management in tourism: Reducing tourism’s carbon “foodprint". Tour. Manag. 2011, 32, 534–543. [Google Scholar] [CrossRef]
  38. Shahmohammadi, S.; Steinmann, Z.J.N.; Tambjerg, L.; Van Loon, P.; King, J.M.H.; Huijbregts, M.A.J. Comparative greenhouse gas footprinting of online versus traditional shopping for fast-moving consumer goods: A stochastic approach. Environ. Sci. Technol. 2020, 54, 3499–3509. [Google Scholar] [CrossRef]
  39. Nardo, M.; Saisana, M.; Saltelli, A.; Tarantola, S.; Hoffman, A.; Giovannini, E. Handbook of Constructing Composite Indicators: Methodology and User Guide; OECD Publishing: Paris, France, 2008. [Google Scholar]
  40. Egger, S. Determining a sustainable city model. Environ. Model. Softw. 2006, 21, 1235–1246. [Google Scholar] [CrossRef]
  41. González-García, S.; Rama, M.; Cortés, A.; García-Guaita, F.; Núñez, A.; Louro, L.G.; Moreira, M.T.; Feijoo, G. Embedding environmental, economic and social indicators in the evaluation of the sustainability of the municipalities of Galicia (northwest of Spain). J. Clean. Prod. 2019, 234, 27–42. [Google Scholar] [CrossRef]
  42. Handy, S.L.; Clifton, K.J. Local shopping as a strategy for reducing automobile travel. Transportation 2001, 28, 317–346. [Google Scholar] [CrossRef]
  43. Carral, E.V.; Del Río, M.; López, Z. Gastronomy and tourism: Socioeconomic and territorial implications in Santiago de Compostela-galiza (NW Spain). Int. J. Environ. Res. Public Health 2020, 17, 6173. [Google Scholar] [CrossRef] [PubMed]
  44. Lenzen, M.; Sun, Y.Y.; Faturay, F.; Ting, Y.P.; Geschke, A.; Malik, A. The carbon footprint of global tourism. Nat. Clim. Chang. 2018, 8, 522–528. [Google Scholar] [CrossRef]
  45. Dwyer, L.; Forsyth, P.; Spurr, R.; Hoque, S. Estimating the carbon footprint of Australian tourism. J. Sustain. Tour. 2010, 18, 355–376. [Google Scholar] [CrossRef]
  46. Rico, A.; Martínez-Blanco, J.; Montlleó, M.; Rodríguez, G.; Tavares, N.; Arias, A.; Oliver-Solà, J. Carbon footprint of tourism in Barcelona. Tour. Manag. 2019, 70, 491–504. [Google Scholar] [CrossRef]
  47. Sharp, H.; Grundius, J.; Heinonen, J. Carbon footprint of inbound tourism to Iceland: A consumption-based life-cycle assessment including direct and indirect emissions. Sustainability 2016, 8, 1147. [Google Scholar] [CrossRef]
  48. Becken, S. The Carbon Footprint of Domestic Tourism; LEaP Research Centre: Wellington, New Zealand, 2009. [Google Scholar]
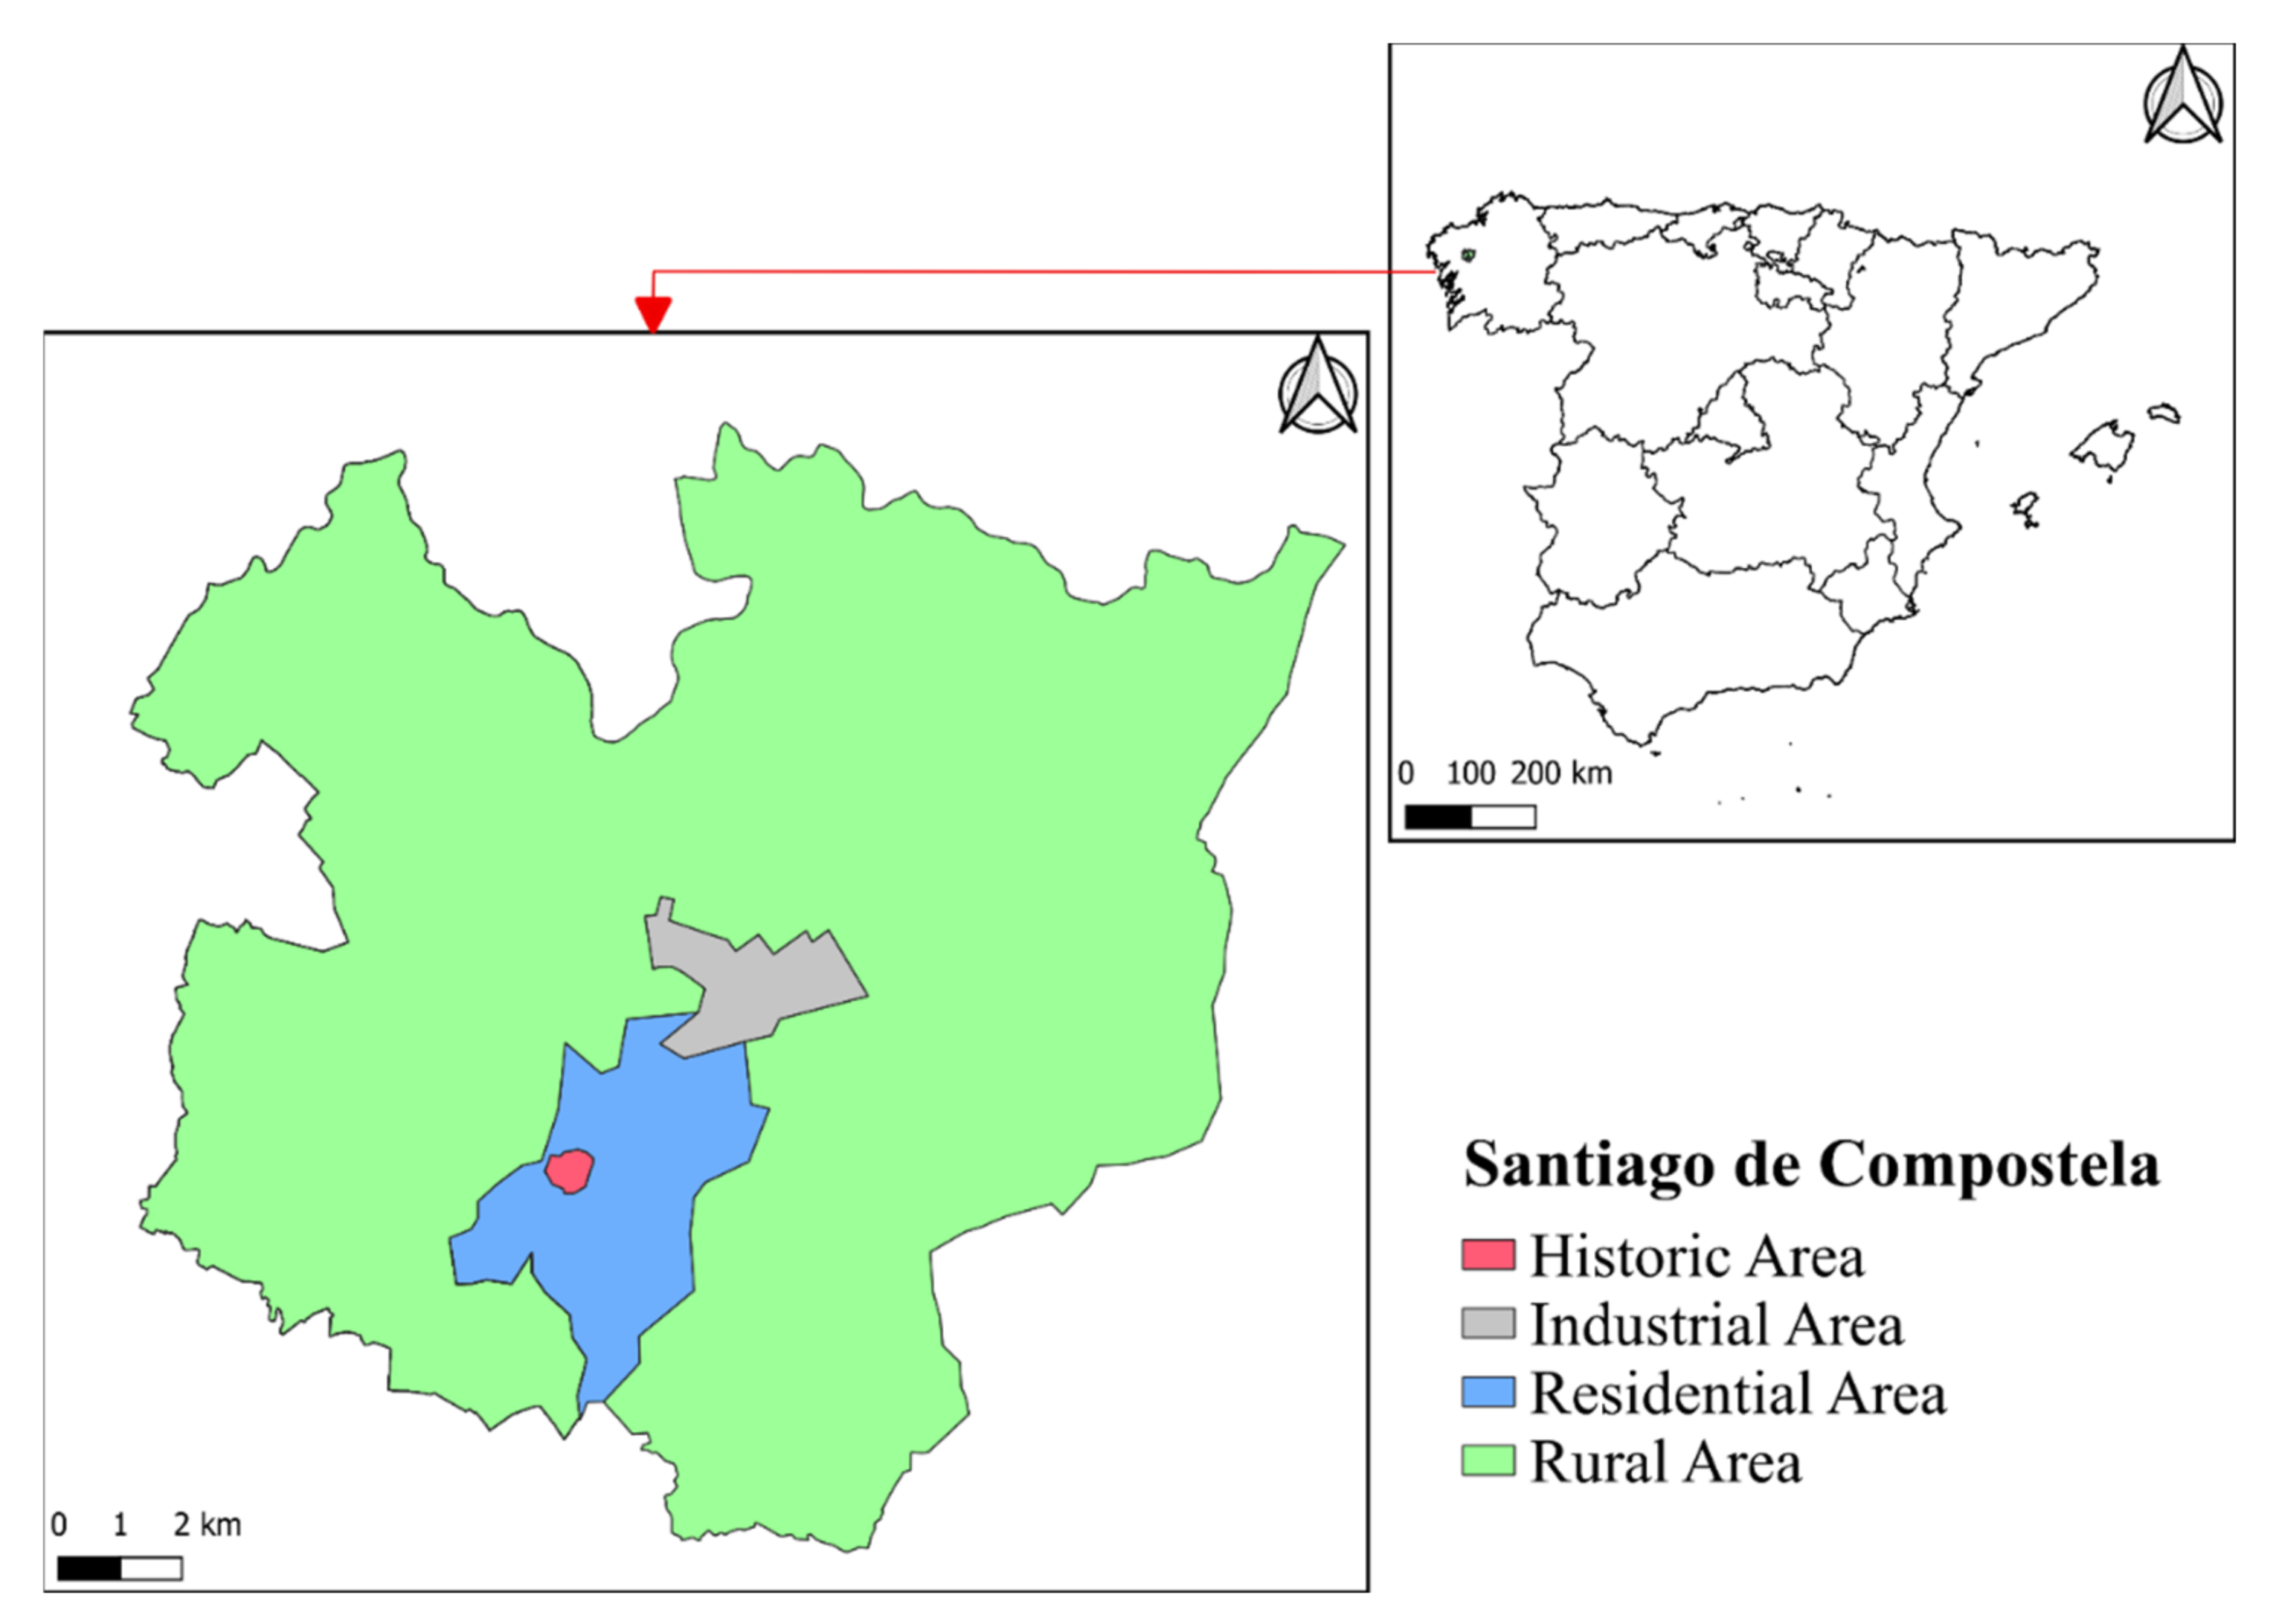
Figure 1. Location of Santiago de Compostela in Spain and distribution of the different areas of the municipality.
Sustainability 14 13253 g001
Figure 2. Scheme of the methodology used to calculate an Integrated Tourism Score of Santiago de Compostela.
Sustainability 14 13253 g002
Figure 3. Aggregation of the indicators into their respective composite indicators for each group: Citizens, merchants, and visitors.
Sustainability 14 13253 g003
Figure 4. Contribution of the indicators to the scores of each of the composite indicators in the groups of (a) citizens, (b) traders, and (c) visitors.
Sustainability 14 13253 g004
Table 1. Indicators selected from Rede Galabra questions and their description.
Cod.IndicatorDescription
Citizens
C1Level of educationEducational level of citizens
C2Municipality of residenceResidence in the city, in the metropolitan area or in a more distant location
C3Residence within the cityHow far from the city center you live
C4Family income levelHousehold income level according to high or low income
C5Employment SituationEmployment situation: Worker, unemployed, student, etc.
C6Leisure placesAreas frequented during leisure time
C7Affective areasPlaces that have affection for citizens
C8Coincidence in significant placesCitizen’s perception of the coincidence of the most affective areas
C9Alternative tourist elementsCitizens believe if there are elements that should be part of the image of the city
C10City use timeYears that a citizen has been using the city daily
C11Shopping establishmentsTypes of favorite establishments
C12Shopping SitePlace where purchases are made with respect to the district of residence
C13Use of the historic areaPart of the daily life of the citizens takes place in the historic area
C14Place attachmentHow a citizen perceives his/her belonging to the city
C15Community participationParticipate actively within the community (Neighborhood Association, municipal policy, charity, etc.)
C16Economic dependence on tourismDegree of economic dependence on tourism
C17Tourist image of the cityHow much is in accordance with the image of the city
C18Citizen lifestyleHow much tourism affects the way of life of citizens
C19City evolutionOpinion on whether citizens prefer the city in the early 1990s, when there were few tourists, or today
Traders
T1Level of educationEducational level of traders
T2Municipality of residenceResidence in the city, in the metropolitan area or in a more distant location
T3Employment situationEmployment situation: Worker, unemployed, student, etc.
T4Family income levelHousehold income level according to high or low income
T5Offering evolutionWhether or not the commercial and economic offer improved with the increase in tourism
T6Perception of changes in the offerHow much the offer changes due to tourism
T7Perception of changes in the offer (other establishments)How much the offer changes due to tourism in other establishments
T8Customers in the early 1990sType of customers that frequented the business in the early 1990s
T9Customers at presentType of customers that frequented the business at present
T10Difference in most demanded productsVisitors and citizens do or do not consume different types of products
T11Evolution in most demanded productsThe most demanded products changed with the increase in tourism or not
T12Community participationParticipate actively within the community (Neighborhood Association, municipal policy, charity, etc.)
T13Place attachmentHow a trader identifies who belongs to the city
T14Income from tourismPercentage of income from tourism at present
T15Income from tourism (early 1990s)Percentage of income from tourism in the early 1990s
T16Economic dependence on tourismDegree of economic dependence on tourism
T17Tourist image of the cityHow much is in accordance with the image of the city
T18Type of visitorHow much do you like the type of visitor who comes to city
T19Camino de Santiago as Public ImageHow much is the Camino de Santiago part of the identity of the city
Visitors
V1Level of educationEducational level of visitors
V2Employment SituationEmployment situation: Worker, unemployed, student, etc.
V3Family income levelHousehold income level according to high or low income
V4Transport usedMeans of transport used
V5Satisfaction with the visitHow satisfied are you with the visit?
V6Discovered activitiesActivities and places that surprised the visit
V7Places to plan to eat and drinkPlaces where visitors eat and drink
V8Expenditures on food productsConsumption of local gastronomic products
V9Shopping in the cityDo visitors make purchases?
V10Shopping placesPlaces where visitors shopping
V11Accommodation in the cityVisitors stay in or out of town
V12Spending on visitSpending on leisure and transport/ accommodation
V13Total spending per personTotal spending per person on the trip
Table 2. Relation between the number of categories and the values assigned to each of them on a scale of 1 to 10.
Number of CategoriesCategory 1Category 2Category 3Category 4Category 5Category 6Category 7Category 8
21.010.0
31.05.510.0
41.04.07.010.0
51.03.35.57.910.0
61.02.84.66.48.210.0
71.02.54.05.57.08.510.0
81.02.33.64.96.17.49.710.0
Table 3. Level 1 composite indicators and level 2 composite indicators of the corresponding groups considered.
Level 1 Composite IndicatorsLevel 2 Composite Indicators
Citizens
HomePersonal Characteristics
Incomes
Affective areaUse of the city
City Shopping
Social Commitment
Affinity for visitorsTourism
Traders
IncomesPersonal Characteristics
Offering evolutionCustomers and products
Customers
Products
Social Commitment
Economy from tourismTourism
Affinity for visitors
Visitors
IncomesPersonal Characteristics
Visit
Gastronomic productsLeisure
Products
Expenses
Table 4. Categories considered to classify the responses to the questions of the Rede Galabra surveys corresponding to each indicator.
IndicatorNº CategoriesCategories
Low Score CategoriesHigh Score Categories
Sustainability 14 13253 i001
Citizens
C13No education or primary educationSecondary EducationUniversity Education
C23OthersAmes-TeoSantiago de Compostela
C35Most farFarMedium DistanceNearCity center
C42LowHigh
C54UnemployedStudentsPensionersWorkers
C67Any area alikeSport and cultural areaRestorationResidential areaGreen areasHistoric areaCathedral
C75Industrial areaResidential areaBar, pubs and leisureGreen areasHistoric area
C82NoYes
C92NoYes
C105Less than 2 years2–5 years6–10 years11–20 yearsMore than 20 years
C113Shopping CenterHypermarket or SupermarketMarket and traditional shop
Citizens
C123Other districtsOther districts and in the districtIn the district
C132NoYes
C14812345678
C152No participationParticipation
C163Total dependencePartial dependenceNon dependence
C17812345678
C18887654321
C193Early 90’sEarly 90’s and at presentAt present
Traders
T13No education or primary educationSecondary EducationUniversity Education
T23OthersAmes-TeoSantiago de Compostela
T34UnemployedStudentsPensionersWorkers
T42LowHigh
T53Early 90’sEarly 90’s and at presentAt present
T6887654321
T7887654321
T83Mostly visitorsMix of visitors and citizensMostly citizens
T93Mostly visitorsMix of visitors and citizensMostly citizens
T102YesNo
T112YesNo
T122No participationParticipation
T13812345678
T143HighMediumLow
T153HighMediumLow
T163Total dependencePartial dependenceNon dependence
T17812345678
T18812345678
T19812345678
Visitors
V13No education or primary educationSecondary EducationUniversity Education
V24UnemployedStudentsPensionersWorkers
V3812345678
V45PlaneCarBusTrainWalk/Bike
V5812345678
V63CathedralCity/City SizeOther
V73Fast food chainsHotels, Hospital canteensLocal restaurants
V83Fast foodOtherTraditional food
V92NoYes
V103Shopping centerResidential areaHistoric area street markets
V112NoYes
V122Travel expensesLeisure expenses
V1350–99 €100–332 €333–665 €66–1099 €>1100 €
Table 5. Scores for the different groups and the total score for the average profile of Santiago de Compostela.
Score
Citizens6.95
Trader6.88
Visitors6.69
Santiago de Compostela6.84
Publisher’s Note: MDPI stays neutral with regard to jurisdictional claims in published maps and institutional affiliations.