Article

Driving Path and System Simulation of Green Innovation Capability of Science and Technology Enterprises in Yangtze River Delta

College of Economy and Management, Anhui University of Science and Technology, Huainan 232001, China
*
Author to whom correspondence should be addressed.
Sustainability 2022, 14(20), 13031; https://doi.org/10.3390/su142013031
Submission received: 1 September 2022 / Revised: 30 September 2022 / Accepted: 8 October 2022 / Published: 12 October 2022
(This article belongs to the Section Economic and Business Aspects of Sustainability)

Abstract

:
Green innovation integrates innovation-driven and green development strategies, which helps to realize the green transformation of production and life in the Yangtze River Delta region, and promote high-quality economic development. Based on the multidisciplinary cross attribute of system dynamics (SD), the boundary and influencing factors of the green innovation system are defined, and the system dynamics model of green innovation ability of science and technology enterprises is constructed. With the help of statistical data from 2010 to 2020, the model is simulated to explore the change trend and law of elements. The results show that: (1) The green innovation ability of science and technology enterprises is composed of three stages, knowledge innovation, technological innovation, and innovation application, which are interconnected and progressive. The change trend of each variable is conducive to the improvement of green innovation competitiveness, and the green innovation benefits are significant. (2) Green innovation is driven by multidimensional factors such as R&D investment, technological innovation investment, knowledge innovation ability, and the conversion rate of scientific research achievements. The improvement of the conversion rate of scientific research achievements has the greatest impact on the enterprise’s green innovation ability, and the change trend is more obvious. (3) Positive and negative two-direction sub-mode regulation of R&D investment, technological innovation investment, and scientific research achievement conversion coefficient will affect the speed of green innovation accumulation of enterprises, and this increment is marginally increasing with the increase of the coefficient in the short term. Finally, some suggestions are put forward to promote the green innovation ability of science and technology enterprises in the Yangtze River Delta.

1. Introduction

The continuous deterioration of the ecological environment and the shortage of resources have not been greatly improved. The protection of the ecological environment around the world is still a serious proposition. How to change the traditional economic growth model of high energy consumption and high pollution, and explore the green economy of energy saving, clean, and environmental protection, has become one of the strategies for the economic development of all countries in the world. ‘Ecological civilization construction’, ‘sustainable development’ and other concepts are the current global development model actively promoted. Innovation is the driving force of development; green innovation is the key driving force to lead green development and sustainable development, and is the development strategy of organic combination of environmental protection and economic growth. Science and technology enterprises are an important force to enhance China’s independent innovation ability, promote China’s industrial transformation and upgrading, and high-quality economic and social development. They play an increasingly important role in increasing employment and technological innovation.
‘Made in China 2025′ puts forward the strategic goal of innovation-driven and green development. The report of the 19th National Congress of the Communist Party of China pointed out that: “my country’s economy has shifted from a stage of high-speed growth to a stage of high-quality development”. Green development is an inevitable requirement for building a high-quality modern economic system, and scientific and technological innovation has become an important way for enterprises to promote green development and contribute to ecological civilization construction. At the same time, the 19th CPC National Congress made it clear that we should accelerate the building of a market-oriented green technology innovation system. The Fifth Plenary session of the 19th Central Committee further pointed out that we should “promote the development of traditional industries to intelligent and green”, which requires enterprises, as the main body of market innovation must establish a sustainable development mode with green as the guidance, technology as the support, and innovation as the power. During the “14th Five-Year Plan” period, under the dual carbon goals of “peak carbon dioxide emissions” and “carbon neutrality”, innovation and green are the main themes of the new stage of development. Taking the path of green and innovative development not only demonstrates the national green sustainable development concept, but also makes overall planning for the successful realization of the “14th Five-Year Plan” blueprint. Almost all major technological innovations in history are made by enterprises. Enterprises should become the main body of technological innovation and provide green and low-carbon products and services for society [1]. Green innovation is an important strategy for enterprises to achieve sustainable development goals, which has been widely recognized by all sectors of society. Taking the initiative to carry out green innovation will help enterprises to build a green image and improve their competitive advantages. Science and technology enterprises are an organic combination of innovation-driven and green development. Green innovation has become an effective way to break through resource and environmental constraints and promote the optimization, upgrading and transformation of science and technology enterprises. As an important engine of economic and social development, and a leader of the Yangtze River Economic Belt, the Yangtze River Delta plays an important strategic role in the overall modernization drive. Therefore, it is of practical significance to explore the driving factors and internal mechanism of green innovation capability of science and technology enterprises in the Yangtze River Delta for China’s economy to achieve the “14th Five-Year Plan” and the vision of 2035.
Based on the systematic, dynamic and non-linear characteristics of the development of green innovation capability of science and technology enterprises, this paper studies the driving path of the development of green innovation capability of science and technology enterprises from the perspective of multidisciplinary theory. Specifically, by constructing the system dynamics model of the internal and external driving mechanism of the development of green innovation capability of science and technology enterprises, the driving path of green innovation of science and technology enterprises is simulated. The research in this paper enriches the relevant theories of green innovation capability development of science and technology enterprises, reveals the driving mechanism of green innovation, and provides some references for the government to formulate regulatory policies, science and technology enterprises to change their business models, and for enterprises to build green innovation paths to achieve high-quality development.

2. Literature Review

In recent years, there have been much research on green innovation in academia, and rich results have been achieved. In terms of the research content, it mainly focuses on the evaluation index system of green innovation capability [2,3], the selection of green innovation capability model [4], spillover effect [5] and spatial characteristics [6], etc. In terms of research objects, it mainly focuses on green innovation in the manufacturing industry, regional green innovation [7] and green innovation in resource-based cities. The research areas mainly focus on the economically developed urban agglomeration or provincial cities. Some foreign scholars selected small and medium-sized enterprises as research specimen and used AHP, BWM and fuzzy TOPSIS methods to rank and select suppliers from the perspective of green innovation ability [8,9].

2.1. The Concept of Green Innovation Capability

The concept of “innovation” was first put forward by Schumpeter, who believed that innovation was the main factor driving economic cyclical growth [10]. Innovation ability can be understood as a kind of ability to integrate and apply material, economic, intellectual or social resources [11]. Green innovation is a variety of innovative activities that are driven by multiple factors, which are conducive to improving energy and resource utilization efficiency, reducing pollution emission level and improving environmental governance capacity, so as to ultimately promote sustainable economic and social development [12]. Green innovation ability, and the general innovation ability, has the connection and the difference. It embodies the principles of innovation, capability and sustainable development, and is the integration of “green + innovation + capability”. Among them, capability is the basis, innovation is the core, and green is the condition [13]. According to Braun E et al., green innovation capability refers to the technology and process used to reduce environmental pollution, raw materials and energy consumption, and the ability to produce green products. This view focuses on environmental impacts and production levels [14]. Ge SS et al., believed that regional green innovation ability was the ability of regional production or living activities to create new values, while consuming less environmental resources than before. It mainly reflected three principles: innovation, low consumption and strong ability [15]. Lee KH et al. considered that green technology innovation capability included green technology innovation input capability and green technology innovation output capability. Among them, the input capacity included the input capacity of green R&D expenses and the input capacity of green R&D personnel, and the output capacity included the output capacity of green patents and green products [16]. Zhang YZ et al. studied that green innovation capability was a kind of overall driving capability, which refer to the ability of enterprises to continuously introduce and implement new products, processes, raw materials, markets, organizations, systems and management innovation projects over a long time to realize the benefits of the innovative green economy and circular economy [17].

2.2. Evaluation Method of Green Innovation Capability

Yousaf Z thought that SMEs’ (small and medium enterprises) lack of green innovation, easily increased pollution and environment damage. Keeping in view these issues, the structural equation model was used to investigate the impact of green dynamic capability, green practice and green value co-creation, on green innovation in SMEs, and to test the mediating role of value co-creation in the links between green practices-green innovation and green dynamic capability-green innovation [18]. Tseng ML et al. refined innovation indexes from four aspects of management, process, product and technology, and used the entropy weight method to construct a green innovation capability evaluation system [19]. Singh, SK et al. investigated and collected multisource data from 248 manufacturing small and medium-sized enterprises (SMEs), and used the partial least squares (PLS) path modeling approach (PLS-PM) to examine the direct and indirect impacts of stakeholder pressure, green dynamic capability, green innovation and the performance of SMEs in emerging markets [20]. Wang Y et al., based on the panel data of 30 Chinese provinces in 2009–2017, adopted the fixed-effects model to analyze the direct impact of technical innovation capability on green economic growth, and how this impact is regulated by the technical financial environment and mediated by eco-environment governance [21]. Qiu L. et al. explored the relationship between manufacturing green product innovation and competitive advantage, i.e., green dynamic ability. He found that the resource integration capability, resource reconstruction capability and environmental insight capability of green dynamic capability played an intermediary role between green product innovation and competitive advantage [22]. Huang SZ took 212 enterprises established within 4 years in the Pearl River Delta region as the research sample, and utilized the structural equation model to analyze the impacts of exploratory learning and applied learning (dual learning) on green innovation capability, and verified the environmental protection awareness of senior executives and the adjustment effects of environmental regulation [23].

2.3. Influencing Factors of Green Innovation Capability

Green innovation capability is the ability to integrate and use innovation resources in the process of innovation, transform into new knowledge, technology, process and product, and finally create new value to support sustainable economic and social development with the goal of green development. The formation and development of green innovation capability not only depends on the interaction of internal subsystems, but also is influenced and promoted by external factors [24]. Deng YP et al. believed that the effect of environmental regulation had a significant promoting effect on enterprises’ green innovation ability, and there was a significant qualitative difference between the central and eastern regions and technology-intensive enterprises, but it had little effect on whether enterprises were state-owned enterprises [25]. Tan DQ et al. analyzed the conduction effect of foreign direct investment (FDI) under environmental regulation on regional green innovation capability at the national level, and believed that FDI under environmental regulation could significantly improve green innovation capability in eastern China, while the opposite was true in central and western China [26]. Liu ZS et al., based on the global SBM direction distance function and the global Malmquist-Luenberger index (GML index), measured the green innovation capability of China’s provinces from 2003 to 2013, and concluded that technological progress was the key factor for the change of GML index and the green innovation capability shows a time and space regular fluctuation trend of “convergence—differentiation—convergence” [27]. Xu JZ et al. empirically explored the green innovation capacity of two manufacturing enterprises in Heilongjiang Province, from the three levels of green innovation input capacity, output capacity and support capacity, by using the binary semantic combination weighting method [28]. Dai WL et al. selected 201 manufacturing enterprises to carry out an empirical study, and concluded that the pressure of public opinion on environmental protection positively affected the green innovation ability of manufacturing industry, and the leadership’s environmental awareness and green learning played a chain intermediary role between the pressure from public opinion on environmental protection and green innovation ability [29]. Sun ZQ et al. used entropy weight TOPSIS and spatial econometrics to explore the spatial agglomeration and spillover effect of green innovation capacity in 30 Provinces of China from 2008 to 2016, and concluded that green innovation output had a significant positive spillover effect in geographical space. Moreover, different green innovation factors are all different for local green innovation output and spatial spillover effects of the surrounding areas [30]. Han YQ et al. used the super-SBM model and the two-way fixed effect model to measure the impact of Internet development and environmental regulation on the green innovation efficiency of high-tech enterprises [31]. Jiang SY used multiple linear regression to explore the influence degree of different types of human capital on different types of green innovation ability from the perspectives of three types of human capital: capability, knowledge and initiative, and three types of green innovation ability: green innovation input, green innovation technology and green innovation control [32].
Overall, there are few literatures on the driving path and simulation of green innovation capability of science and technology enterprises, which are still in the exploratory analysis stage. Based on the existing research, this paper analyzes the internal and external driving factors of green innovation capability of science and technology enterprises in the Yangtze River Delta region from the perspective of interdisciplinary theory. Then, by using the system, dynamic and nonlinear characteristics of the system dynamics model, the causality tracing diagram and flow inventory diagram of the three subsystems of knowledge innovation, technology innovation and innovation application, are drawn. Finally, the driving path of green innovation capability of science and technology enterprises is simulated; the numerical value of key influencing factors is regulated and controlled; the sensitivity changes of green innovation ability of science and technology enterprises in different situations are analyzed; and the driving mechanism of green innovation is clarified, in order to provide reference for the government to formulate regulation policies, industrial transformation direction, and innovation input.

3. Materials and Methods

3.1. System Structure Analysis

3.1.1. System Boundaries and Assumptions

The green innovation development of science and technology enterprises in the Yangtze River Delta is a complex, dynamic and nonlinear opening process, and its green innovation driving force originates from internal driving force and external driving force. Figure 1 depicts the correlation mechanism of the internal and external driving factors of the green innovation capability system of science and technology enterprises in the Yangtze River Delta. The external driving factors are composed of policy regulation, regional economic development level and market factors, while the internal driving factors include the technological innovation ability of enterprises, the degree of industry-university-research cooperation, the conversion rate of R&D achievements, and the willingness of green innovation. Driven by green innovation willingness, science and technology enterprises enhance their green innovation motivation based on innovation input, green innovation culture and green innovation application and other green innovation management forces. Internal drive and external drive interaction and dynamic integration, promote the green innovation ability of science and technology enterprises to achieve high-quality development. In this paper, the spatial boundary is the Yangtze River Delta region, and the system boundary is the three subsystems of knowledge innovation, technology innovation and innovation application. The starting time point of the system model is selected as 2010, the ending time point is 2030, and the step length is set as one year.
The following assumptions are considered: (1) the three subsystems of knowledge innovation, technology innovation and innovation application are logically related, coupling with each other to form the green innovation ecosystem of science and technology enterprises; (2) the economic growth of the Yangtze River Delta region is relatively stable without major fluctuations, and the system does not need major structural adjustment due to uncontrollable variables; (3) capital, personnel, achievement transformation and other inputs are periodic and continuous activities, and the time delay of the model is not considered temporarily. The R&D data of universities and scientific research institutions in the Yangtze River Delta are used to measure the knowledge innovation ability, and the sales revenue of new products of scientific and technological enterprises is used to measure their green innovation ability.

3.1.2. System Element Analysis and Subsystem Division

Driven by internal and external environmental factors, the green innovation system of science and technology enterprises is a continuous, gradual and accumulating dynamic process [33]. From the perspective of innovation knowledge flow, this paper analyzes the influencing factors of the green innovation system of science and technology enterprises, clarifies the interaction mechanism of each factor, and further divides the green innovation capability system into subsystems.
The input in the field of knowledge innovation is mainly reflected in research and development, talents and scientific facilities and equipment, and other aspects [34]. Zou H et al. combined with simulation analysis, the influence of knowledge innovation subsidies, knowledge absorption and knowledge assimilation on the coordinated innovation strategy of knowledge innovation groups in the game system discussed [35]. Liu HY et al. thought that the three hotspots of knowledge innovation research were based on research on the knowledge innovation system within enterprises, research on the knowledge innovation mode based on innovation cooperation among enterprises, and research on the knowledge innovation among enterprises based on inter-organizational knowledge [36]. These results suggested that knowledge innovation is committed to basic science and theoretical research, and determines the development prospect of green innovation of science and technology enterprises. The knowledge innovation subsystem mainly includes government R&D investment, research institutions R&D investment, knowledge innovation ability, R&D personnel investment, number of R&D institutions, R&D conversion efficiency and other factors, which are the key and primary factors in the whole green innovation system. In the aspect of technological innovation, science and technology enterprises can transform previous knowledge innovation achievements into concrete practice and improve the number of employees in science and technology enterprises. Additionally, it can promote the transformation of scientific research achievements and the investment ratio of technological innovation through knowledge transfer, technological transformation and industry university research cooperation, as well as increasing long-term stable cooperation with R&D institutions, attracting investment, driving the rapid and stable diffusion of advanced technology along the industrial chain, and improving the technological innovation ability of enterprises [37,38]. In the aspect of innovative application, science and technology enterprises need to give full play to the leading role in innovation and improve the efficiency of resource allocation of the government, market, society and other multi-bodies, in addition to establishing long-term cooperation strategies from consultation and guidance, skill training, industrial planning and other aspects, and speeding up the free circulation and efficient interconnection of innovative elements, before realizing the penetration and integration between subsystems [39]. On this basis, the schematic diagram of the three subsystems of green innovation of science and technology enterprises in Yangtze River Delta is drawn, as shown in Figure 2.

3.2. SD Model Construction and Simulation

Most of the literature on the selection of innovation ecosystem evaluation methods is based on the direct summary of relevant data. This evaluation does not quantitatively describe the relationship between the subsystems in the innovation ecosystem and the influencing factors inside and outside the system. Therefore, it cannot adapt to the performance of green innovation capability of science and technology enterprises, which is a typical open, nonlinear and complex system. Some evaluation methods usually show the limitations of super-fuzzy, insufficient intelligence and the lack of dynamics. To some extent, the analysis and evaluation of the green innovation capability of technology-based enterprises show that the diversity, sustainability and stability of the enterprise green innovation ecosystem is the top priority of research. In this paper, the theory of system dynamics is applied to the evaluation of the green innovation ability of science and technology enterprises, and the system dynamics method is used to deal with the problem of nonlinear, time-varying and multiple feedback green innovation of enterprises.

3.2.1. Construction of Causality Diagram

The improvement of the green innovation capability of science and technology enterprises is influenced and restricted by internal and external driving factors, which is a dynamic and complex feedback loop. Through knowledge innovation, technology innovation and innovation application, enterprises can improve the knowledge innovation investment ratio and technological innovation ability, so as to improve the quality and efficiency of the number of R&D results and conversion rate, promote green innovation of science and technology enterprises, and achieve high-quality development. According to the theoretical model analysis framework, the system boundary, key variables and policy optimization status are clarified, and the interaction correlation and action path among various elements are clarified. The system dynamics causality diagram of green innovation capability driving path of high-tech enterprises in the Yangtze River Delta is constructed by using VENSIM PLE, as shown in Figure 3.
Feedback loop 1: regional economic development level → government R&D investment → R&D investment in universities and scientific research institutions → knowledge innovation investment ratio → knowledge innovation capability → industry-university-research cooperation degree → new product R&D efficiency → enterprise technological innovation capability → new product sales revenue.
Feedback loop 2: regional economic development level → government R&D investment → enterprise R&D investment → enterprise technological innovation investment ratio → new product R&D efficiency → enterprise technological innovation capability → new product sales revenue.
Feedback loop 3: Number of enterprises → investment of R&D personnel → investment ratio of technological innovation of enterprises → R&D efficiency of new products → technological innovation ability of enterprises → sales revenue of new products.
Feedback loop 4: Number of universities and scientific research institutions → investment in R&D of universities and scientific research institutions → investment ratio of knowledge innovation → efficiency of R&D transformation of universities and scientific research institutions → number of R&D achievements → transformation number of R&D achievements → technological innovation ability of enterprises → sales revenue of new products.

3.2.2. Flow Stock Diagram

According to the causal feedback loop and research hypothesis, the flow stock diagram of the green innovation system of science and technology enterprises is constructed (Figure 4). The flow chart of green innovation capability of science and technology enterprises in the Yangtze River Delta is mainly composed of four variable forms: state variable, rate variable, constant variable and auxiliary variable. The state variables include the number of enterprises, the number of universities and scientific research institutions, the number of R&D achievements, and the sales revenue of new products. The rate variable is the change in the number of enterprises, the change in the number of universities and scientific research institutions, the increase in the number of R&D achievements, and the change in the sales revenue of new products. The constant is the innovation policy index. Instrumental variables for the regional economic development level are: the government R&D investment, enterprise R&D investment, research and development of colleges and universities and research institutions, enterprise R&D investment fund, universities and research institutions R&D input, knowledge innovation investment ratio, knowledge innovation ability, the innovation service support level, degree of manufacture-learning-research cooperation, the number of enterprise employees, the enterprise technology innovation investment ratio, user innovation demand, new product R&D efficiency, R&D achievement conversion rate, R&D achievement transformation number, enterprise technological innovation capability and enterprise operating revenue. Each variable can truly and objectively reflect the actual status of knowledge innovation, technological innovation and innovation application of science and technology enterprises in the Yangtze River Delta, and accurately represent the logical relationship and dynamic correlation between each indicator variable.
Based on the real availability of China’s statistical data and the research ability of data reflecting China’s economic reality, the China High-tech Industry Statistical Yearbook, China Science and Technology Statistical Yearbook from 2010 to 2020 and other academic literatures related to China’s statistical data research, were reviewed [40,41]. We take 2010 as the base period of the investigation and research. According to the actual situation of the long-term development of China’s science and technology industry, and on the basis of summarizing a large number of previous and long-term practical investigation and research experiences, the change rate of the number of scientific and technological enterprises, the change rate of the number of universities and scientific research institutions, the investment rate of technological innovation, the intensity of industry-university-research cooperation, and the efficiency of new product R&D, are calculated. Furthermore, the DYNAMO equation of the green innovation capability ecosystem model is obtained.
Based on the SD model, this paper takes the Yangtze River Delta region as an example to carry out the simulation. Combined with the economic development of the Yangtze River Delta region and the actual development status of science and technology enterprises, the SPSS software is used to analyze the relationship between variables, fitting and establishing the corresponding functional equations. The functional equations of some variables are shown in Table 1 below.

3.2.3. Determination of Simulation Variables and Parameters

Based on the system boundary mentioned above, the model simulation time is between 2010 and 2030, in which, 2010–2020 is the model operation and actual scenario data verification stage, and 2021–2030 is the system simulation prediction period. Variables were assigned from the Statistical Yearbook of the Yangtze River Delta over the years, China Science and Technology Statistical Yearbook, China High-tech Industry Statistical Yearbook and related research documents. The measurement method of variables is mainly determined according to the regression relationship and corresponding coefficients between dependent variables and independent variables [42]. The calculation of innovation policy index refers to the PMC index measure method in the study of Zhang YG et al. (2017). The basic data of regional economic development level, the change rate of the number of enterprises, the change rate of the number of universities and scientific research institutions, the support level of innovation service institutions for users’ innovation, and the number of employees of high-tech enterprises, are obtained from the corresponding database and statistical yearbook, and calculated based on the above data.

3.2.4. Model Test

In order to test the effectiveness and credibility of the model simulation results, it is necessary to compare the simulation results of the green innovation capability system model of science and technology enterprises in the Yangtze River Delta with the actual data to verify the degree of coincidence [43,44]. Sensitivity analysis is a method to study and analyze the sensitivity of state or output changes of a system (or model) to changes in system parameters or surrounding conditions. Sensitivity analysis can also reflect which parameters have a greater impact on the system or model, as well as the associated changes of various variables in the system. This paper mainly uses historical test and sensitivity test to verify the three stock variables of the number of enterprises, scientific research achievements and the number of universities and scientific research institutions in the Yangtze River Delta from 2011 to 2020, and judges the fitting degree of the model according to the relative error between the real value and the simulation value. The calculation results show that the relative errors of the three variables are controlled within 5%, showing a good fitting and prediction effect.
We adjust the R&D achievement conversion rate in the green innovation system model of science and technology enterprises in the Yangtze River Delta region from the original 0.14 to 0.15; we compare the simulation results of new product sales revenue and its change before and after the observation of parameter changes; “Current” is recorded as the parameter value before the adjustment, and “Current1” is recorded as the adjusted value, as shown in Figure 5. Its effect is better optimization than the original model in amplitude, and the overall model is still running smoothly, with close evolution trends before and after. Therefore, it can be seen that the green innovation system of science and technology enterprises in the Yangtze River Delta has passed the parameter sensitivity test. The model can reflect the actual situation of each subsystem of green innovation, and can be used to simulate the development trend of green innovation capability in the Yangtze River Delta.

4. Results

In order to explore the effect mechanism of different innovation perspectives on the green innovation capability of science and technology enterprises and the influence degree of policy intensity regulation on the innovation ecosystem of enterprises, the SD model is simulated from the policy dimensions of government R&D investment, technological innovation and achievement transformation. With the remaining parameters unchanged, three schemes are set for each dimension, in which scheme 1 regulates variable parameters in the negative direction, and scheme 2 and scheme 3 regulate variable parameters in a positive direction, to analyze the impact of different regulation efforts on key variables under the same target policy.

4.1. Influence of Government R&D Investment Dimension

Xu Z et al. analyzed the influence of government R&D investment on enterprise R&D investment by using the system dynamics method, and found that government R&D investment has double the effect of leverage and crowded out on enterprise R&D investment, and there is an inverted U-shaped relationship between them [45]. Romer P believed that R&D investment could significantly improve the innovation efficiency and promote economic growth through technological progress, and first analyzed the positive effect of government investment in enterprise R&D on economic growth [46]. Park WG introduced government R&D investment and enterprise R&D investment at the same time, and used the improved Romer model to study that government R&D investment indirectly improved the level of economic development, and enterprise R&D investment directly promoted economic development [47]. In this paper, the innovation policy index is taken as the regulatory factor of government R&D investment, and its initial value is 0.027. the parameter value in scheme 1 is set to 0.025, and scheme 2 and scheme 3 are set to 0.029 and 0.031, respectively. Under the influence of different R&D investment policies, the evolution trend of new product sales revenue (measuring the green innovation ability of enterprises) and high-tech enterprise operating revenue is compared and analyzed, as shown in Figure 6.
Normally, government R&D funding plays a role in resource allocation in two ways: (1) to solve the spillover problem by sharing the green innovation capital input of enterprises; (2) to increase the green innovation power of enterprises to avoid the loss of social welfare caused by insufficient green innovation. It can be seen from Figure 6 that the greater the positive adjustment of government R&D investment strength and intensity, the more conducive it is to improve the green innovation ability of science and technology enterprises in the Yangtze River Delta, enhance the pulling role of enterprises, further consolidate the coordinated development of regions, and it can also drive the further penetration and integration of economic development and green innovation. In addition, it can be seen from the curve trend that the green innovation ability of science and technology enterprises in the Yangtze River Delta during the “12th Five-Year plan” and “13th Five-Year Plan” has been improved year by year, and a large number of “bottleneck” core technologies have been made breakthroughs, which cannot be separated from the scientific and technological R&D support of the government. Therefore, according to different science and technology enterprises and industrial development stages, appropriately increasing technological policy innovation input can promote the improvement of industrial technology and resource efficiency, and stimulate the green innovation ecological development potential of science and technology enterprises in the Yangtze River Delta.

4.2. Influence of Technological Innovation Dimension

Green technology innovation is characterized by high risk and high investment. Under the effect of market mechanism, enterprises can easily fall into the game dilemma of green technology innovation and choose the waiting strategy. The government’s appropriate investment in science and technology can increase the green innovation income of enterprises. Driven by interests, enterprises will carry out green innovation. Once the innovation successfully enters the market, green innovation will produce spillover effects and form certain social benefits. According to the theory of technological innovation and the theory of government intervention, in order to achieve optimal social output, the “visible hand” of the government should give full play to its role in resource allocation [48]. Therefore, the technological innovation dimension mainly observes the change of enterprises’ green innovation ability by regulating and controlling the proportion of enterprises’ technological R&D capital investment. The original technological innovation input coefficient is 0.51, and the parameter values in schemes 1, 2 and 3 are set to 0.49, 0.53 and 0.55, respectively; the change trend of key variables under different technological innovation policy schemes is shown in Figure 7.
It can be seen from Figure 7, that with the passage of time, increasing the proportion of technological R&D investment of enterprises can increase the sales revenue of new products, promote the continuous accumulation and release of innovation elements of science and technology enterprises, drive more and more enterprises to become innovation subjects, and improve the contribution rate of technological innovation to economic growth. The low level of technological input will slow down the speed of technological upgrading and reduce the contribution of innovation to economic growth. Therefore, enterprises are encouraged to increase their investment in technological development research projects and stimulate their enthusiasm for R&D; enterprises will gradually become the main body of R&D investment in technological innovation. Universities and scientific research institutions can undertake more horizontal scientific research projects from enterprises, so that scientific research can be truly combined with the actual production, and enterprises can naturally become the main body of technological innovation.

4.3. Influence of R&D Achievements Transformation Dimension

Science and technology are the main driving factors to promote high-quality economic development. To improve the conversion rate of scientific and technological R&D achievements, the government, universities and R&D institutions, enterprises and third-party technical service institutions and other main body need to participate in coordination and make efforts at the same time. Only in this way can we develop high-tech achievements that are more in line with the development of the real economy, and then transform them into new products with high added value to facilitate their incubation and upgrading. The R&D achievements transformation dimension is mainly to observe the changes in the green innovation ability of enterprises by regulating the parameters of the transformation rate of R&D achievements of enterprises. The value of the original R&D achievement transformation rate of enterprises is 0.14, and the parameter values in schemes 1, 2 and 3 are set to 0.12, 0.16 and 0.18 in turn, then the change trend of key variables under different R&D achievement transformation efficiency policy schemes is shown in Figure 8.
It can be seen intuitively from Figure 8 that adjusting the conversion rate of R&D results has a greater impact on the sales revenue of new products, which can greatly improve the green innovation ability of science and technology enterprises in the Yangtze River Delta, and the change trend is the most significant. In terms of R&D achievements transformation, Qian L et al. believed that for regions with high green R&D and low achievements, it was necessary to start from the transformation stage of green scientific and technological achievements, pay attention to the construction of scientific and technological achievements transformation platform, create a good innovation atmosphere, and establish a good enterprise awareness of cleaner production and consumption. For enterprises in low green R&D and low achievement transformation regions, it was necessary to take a two-pronged approach, focused on the marketization and commercialization of technology, while focusing on the transformation of innovation resources into patents and other outputs [49]. For building an innovation-oriented country, Wu Z et al. concluded that it was inevitable to speed up the scientific and technological achievements transformation [50]. Guan XX et al. thought that applied computer technology effectively transforms, and scientific and technological achievements in universities is of great significance to promote mass entrepreneurship and innovation [51]. The creation and transformation of scientific and technological achievements covers many stages, such as basic research, applied basic research, technology development and industrialization. It is a long process of multi value creation and realization that requires the multi-cooperation of scientific and technological personnel, colleges and universities, scientific research institutions, enterprises and governments, and others. Therefore, we can put forward suggestions and countermeasures to promote the transformation rate of scientific and technological achievements from multiple dimensions. For example, we should pay attention to stimulating the enthusiasm of scientific and technological personnel, and personnel who transform scientific and technological achievements, promoting the output of high-quality scientific and technological achievements, and accelerating the transformation of scientific and technological achievements into real productive forces.

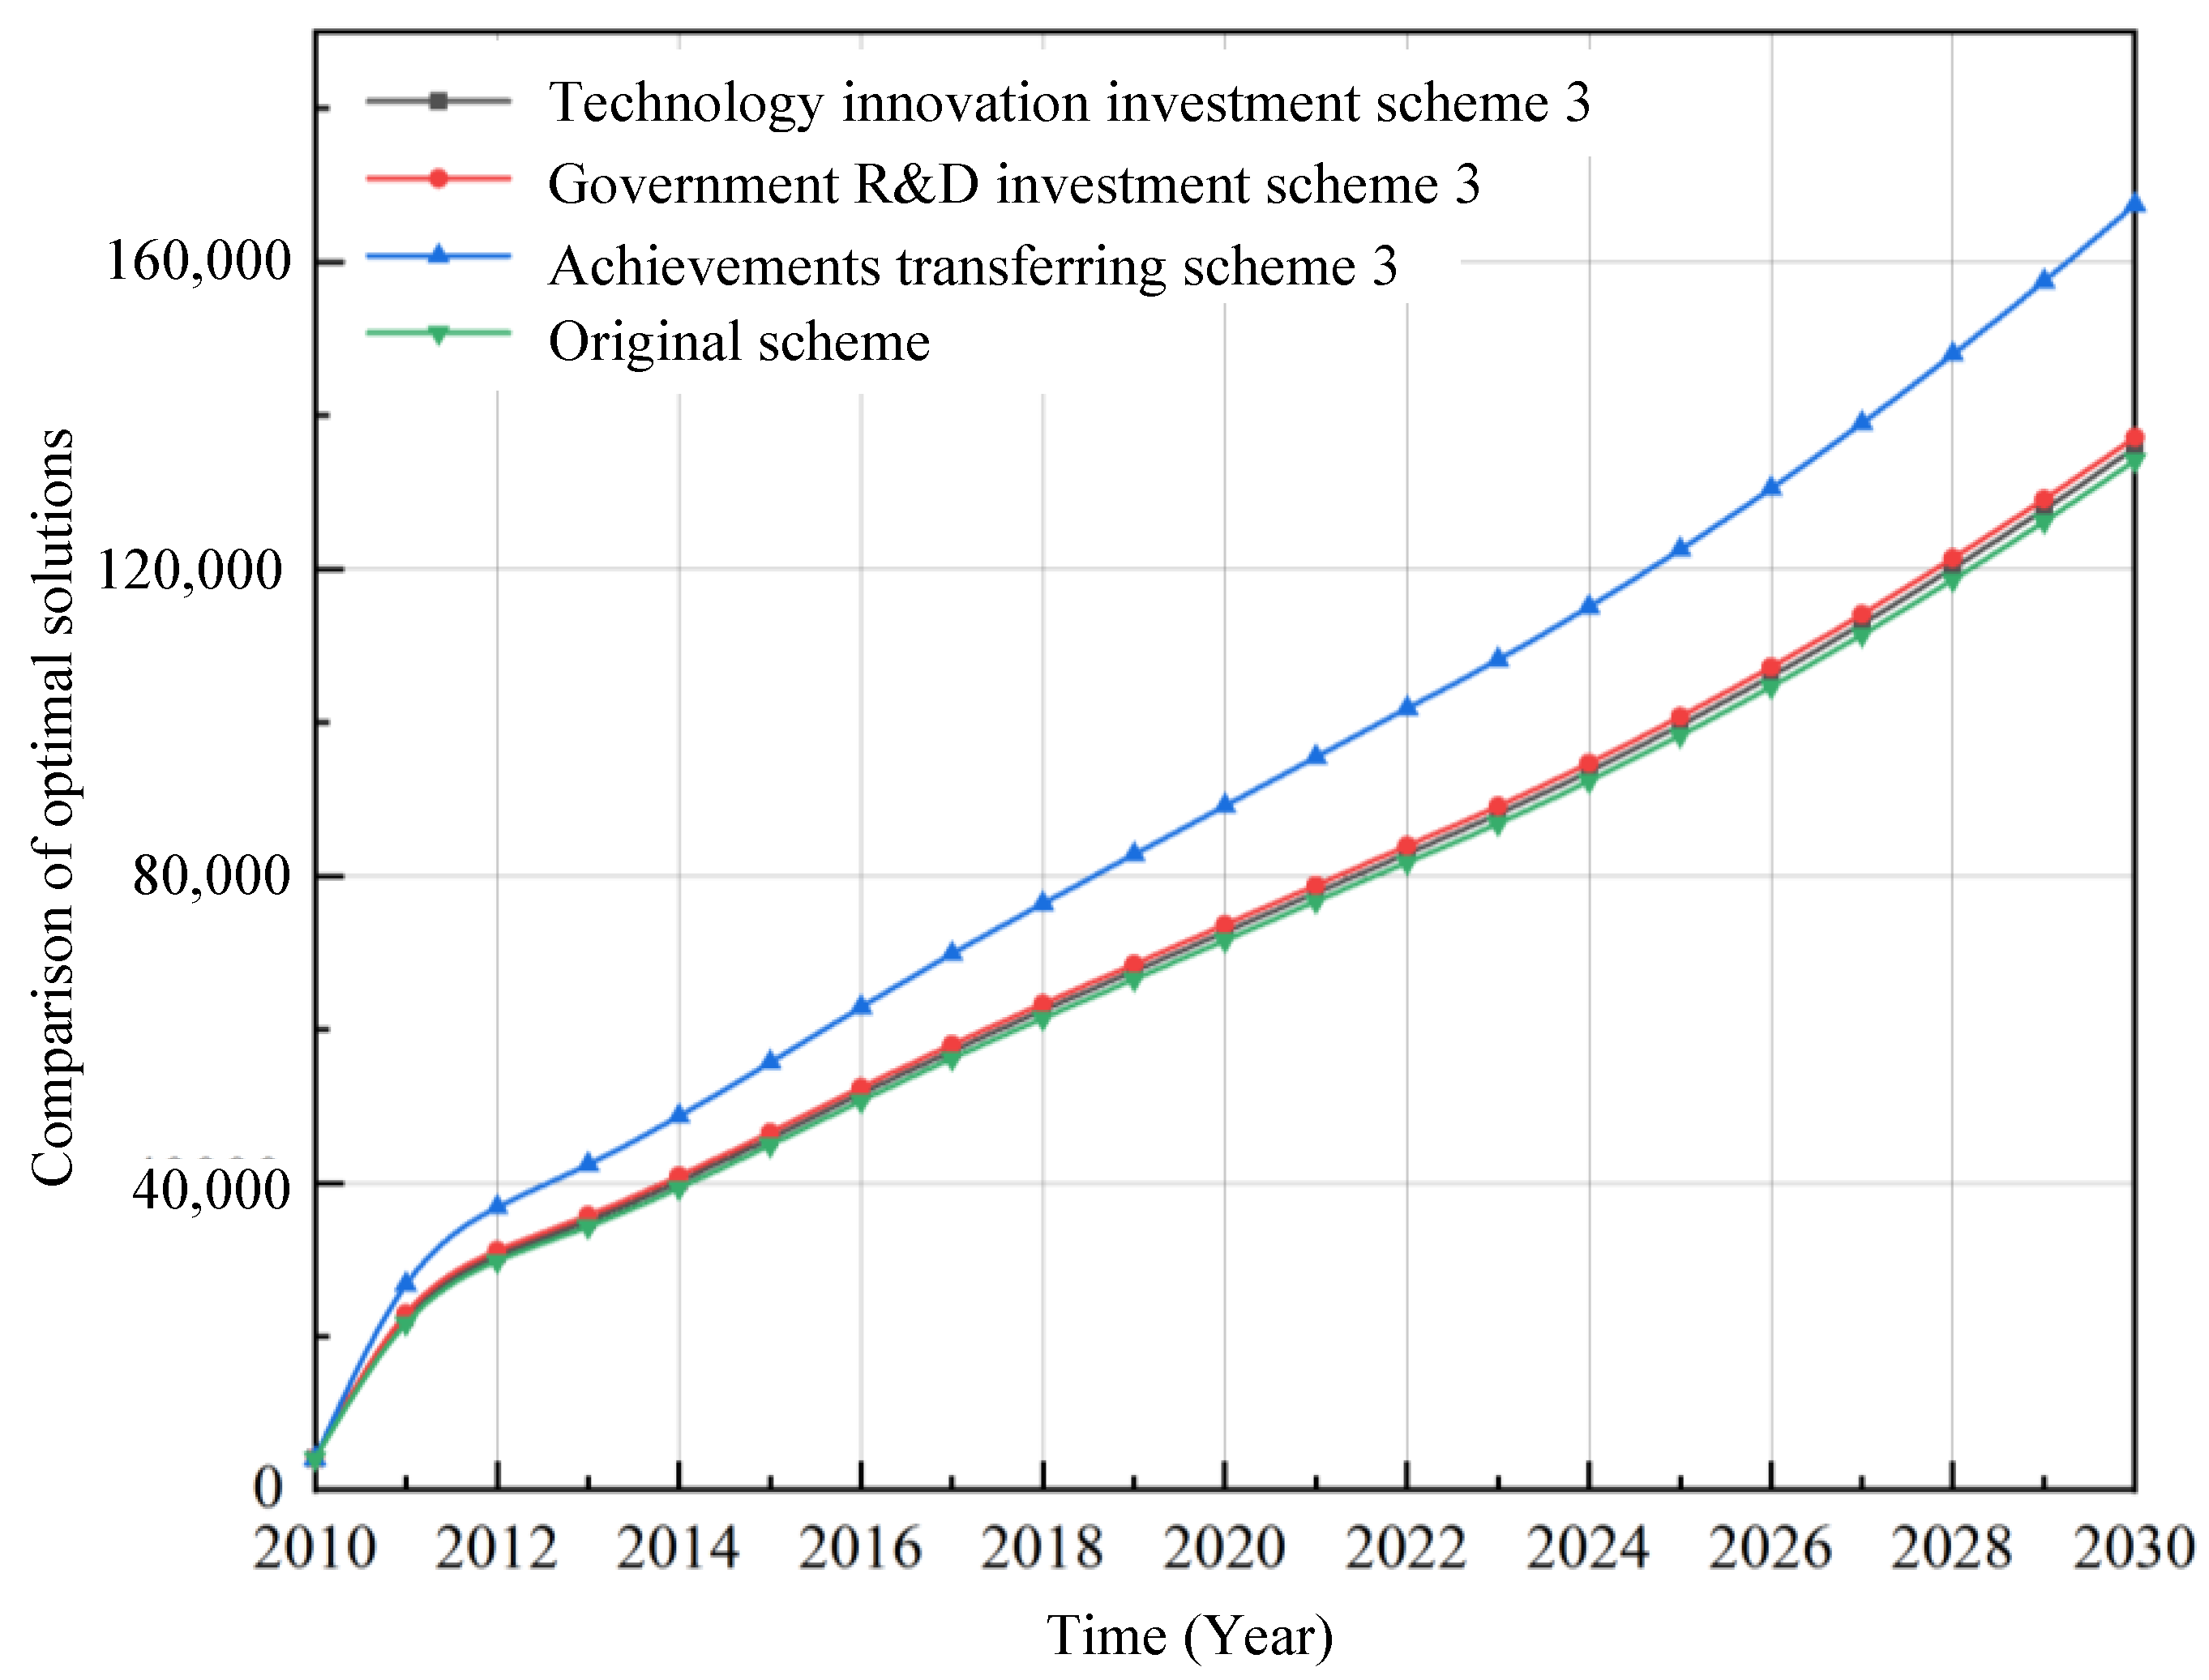
4.4. Comparison of Policies and Schemes

Taking the sales revenue of new products of science and technology enterprises in the Yangtze River Delta as the main output variable, through the above single regulation of a certain dimension parameter, it is found that increasing the government R&D capital investment, increasing the proportion of technological innovation investment, and improving the conversion rate of R&D achievements can all increase the sales revenue of new products of science and technology enterprises in the Yangtze River Delta and strengthens the green innovation ability. Based on scheme 3 of the three dimensions, the parameters of the three dimensions are adjusted in a positive direction one by one and the regulatory variables are combined. A comparative analysis is made with the existing schemes to explore which dimension changes under different policy schemes have the most sensitive impact on enterprises’ green innovation capability, as shown in Figure 9.
It can be seen intuitively from Figure 9 that the improvement of the transformation rate of R&D achievements can greatly increase the sales revenue of new products of the green innovation system of science and technology enterprises in the Yangtze River Delta. The transformation rate of R&D achievements is the most sensitive, following by the government R&D investment dimension, and only increasing technological innovation investment has little impact on the sales revenue of new products. In addition, increasing the government R&D capital investment, increasing the proportion of technological innovation investment and improving the conversion rate of R&D achievements will affect the accumulation speed of green innovation, and this increment has the characteristics of marginal increase with the increase of coefficient.
The causal source of such results should also be found from the causal loop diagram (Figure 3), and the causes of each layer affecting the sales revenue of new products in the green innovation system of science and technology enterprises should be found according to the causes of the results in Figure 3. As shown in Figure 10, the sales revenue of new products is directly affected by users’ demand for innovation and the enterprise’s technological innovation capability, which is determined by the transformation number of R&D achievements and the R&D efficiency of new products. The transformation number of R&D achievements is directly affected by the transformation efficiency of R&D achievements. The R&D efficiency of new products is affected by the ratio of investment in technological innovation, the degree of industry-university-research cooperation and the innovation demand of users. The ratio of enterprise investment in technological innovation is indirectly affected by government investment in R&D through enterprise investment in R&D. Therefore, from the causal tracing diagram, it can be seen intuitively that the government R&D investment is at the front end of the feedback loop, and it takes a long time for the investment to transform into productivity, and the effect is slow. The ratio of investment in technological innovation of enterprises is in the middle, the transformation of R&D results is closest to the sales revenue of new products, and the effect of the transformation of R&D results into enterprise productivity is more obvious.
Scientific research institutions represented by universities and scientific research institutes are the main suppliers of scientific and technological achievements. It is one of the important tasks to implement the innovation-driven development strategy during the 14th Five-Year Plan period, and it is also a key link to strengthen the close integration of science and technology and the mutual promotion of the economy. Therefore, to strengthen the green innovation ability of science and technology enterprises in the Yangtze River Delta, we cannot do without the joint efforts of the government, universities and scientific research institutions, enterprises and third-party service institutions. Science and technology enterprises should adhere to the role of market leadership, government guidance, and the guidance of think tanks in universities and scientific research institutes, eliminate the “island phenomenon” in scientific and technological innovation, further improve the “enterprise problem setting” mechanism, carry out industrial innovation “taking the lead” and technological research and develop “joint research”, strengthen collaborative innovation in government, industry, university, research and application, and promote the innovation of basic scientific theory and advanced and sophisticated R&D technology in continuous and deep integration, effectively solving the “last mile” bottleneck of the transformation of scientific and technological achievements, and accelerating the process of the transformation of scientific and technological achievements.

5. Discussion

This paper applies the SD model to analyze the internal and external influencing factors and their causal relationship of the green innovation driving path of science and technology enterprises in the Yangtze River Delta. By designing different schemes, regulating and controlling the government R&D investment, technological innovation, achievement transformation and other policy dimension indexes, we simulate the action degree of different schemes on the green innovation ability of enterprises. The simulation results show that: first, the system dynamics method can better simulate the actual situation of the change of green innovation capability of science and technology enterprises in the Yangtze River Delta. Second, industry, science and technology and fiscal policies are the source power for the improvement of the green innovation ability of science and technology enterprises. The continuous regulation of R&D investment, technological innovation investment and the conversion rate coefficient of scientific research achievements will affect the accumulation speed of the green innovation of enterprises, and this increment is characterized by marginal increase with the increase of the coefficient in the short term. Third, comparing the effects of different policies, the change of R&D achievement conversion rate can greatly affect the new product sales revenue of green innovation system of science and technology enterprises in the Yangtze River Delta, and the response is the most sensitive. The main policy recommendations are as follows:
(1)
Strengthen policy support for the green innovation of enterprises. According to the causal source chart, the government’s R&D investment has an indirect effect on the green innovation capability of enterprises. In the process of improving the green innovation ability of enterprises, the government plays the role of baton. As a result, government departments should continue to strengthen efforts to actively create an external environment for green innovation, optimize the development environment for green innovation and relevant laws and regulations, pay attention to the joint use of mandatory and incentive regulatory policies, and strengthen policy constraints and incentives.
(2)
Intensify the transfer and transformation of scientific and technological achievements. The transformation of scientific and technological achievements is a systematic project, which needs cross-departmental, cross-field and cross-professional cooperation. The transformation of scientific and technological achievements in universities and research institutes is not only a problem of its own, but also a problem of the construction of the economic chain for the transformation of scientific and technological achievements [52]. This not only requires universities and research institutes to improve the ability to transform scientific and technological achievements, but also needs guidance from the policy and management level, and support from the market management level. The economic environment and economic chain for the transformation of scientific and technological achievements should be activated to enhance the ability and efficiency of the transformation of scientific and technological achievements in universities and research institutes. We will foster a healthy new environment for scientific and technological research, and form an efficient and orderly economic system for transforming scientific and technological achievements. Therefore, relevant departments gradually improve and improve the classification and evaluation system of scientific and technological achievements, step by step across the gap in the transformation of scientific and technological achievements, and effectively display the role of scientific and technological achievements evaluation “baton”, so that the adaptation to industrial development, fresh scientific and technological achievements get the best transformation. In addition, it is necessary to fully and accurately reflect the innovation level of scientific and technological achievements, improve the construction of the ecological system for the transformation of scientific and technological achievements, and explore the high-quality supply of achievements and the transformation and application path.
(3)
Improve the R&D capacity of innovation subjects. Increasing the investment in high-tech talents and R&D investment of scientific research institutions can positively improve the knowledge innovation ability and the efficiency of new product research and development, so as to promote the green innovation ability of science and technology enterprises. As the saying goes, the key to innovation depends on talent. Increasing investment in high-level talents in education, creating a multi-value and demand-oriented classification and evaluation system, stimulating the enthusiasm and the sense of mission of scientific and technological personnel and technology transformation personnel, and improving the social value and sense of honor of technology transfer talents can fully mobilize the enthusiasm of all kinds of innovation subjects [53]. The application of scientific research innovation can be strengthened and the application innovation of scientific research achievements can be promoted through the continuous joining of scientific and technological achievements transformation team. Finally, the transformation efficiency of scientific and technological achievements is greatly improved, and the benefit of green innovation is improved.
(4)
Improve the mechanism of industry, university and research cooperation in the Yangtze River Delta region. It can be seen intuitively from the feedback loop that the improvement of the degree of industry-university-research cooperation can accelerate the efficiency of new product research and development, and then promote the enhancement of the technological innovation ability of enterprises, and finally improve the green innovation ability of science and technology enterprises. Therefore, in the green innovation system, enterprises, universities and scientific research institutions are the direct subjects of green innovation, while governments and financial institutions participate in green innovation as indirect subjects. Through the sharing of ideas, knowledge, technology and opportunities, the main body of the green innovation system can create innovation across the boundaries of enterprises, and then enhance the green innovation power of science and technology enterprises. Therefore, the main body of the green innovation system should avoid and prevent the “island phenomenon” in scientific and technological innovation, promote the efficient cooperation of industry, university and research, and improve the effect of the transformation of scientific and technological achievements. We should encourage all kinds of research institutes to cooperate with schools and enterprises; build independent innovation research and development platforms; build advanced expert teams; consolidate the theoretical basis of scientific and technological innovation and advanced technical support; and actively introduce their scientific and technological achievements into the market.

Author Contributions

Conceptualization, G.H.; methodology, Y.Z.; software, Y.Z.; validation, Y.Z. and K.B.; formal analysis, Y.Z.; investigation, Y.Z.; resources, G.H.; data curation, Y.Z. and K.B.; writing—original draft preparation, Y.Z. All authors have read and agreed to the published version of the manuscript.

Funding

This research was funded by Key Projects of Humanities and Social Sciences in Anhui with the title “Research on the safety and early warning system of underground support deformation monitoring based on laser intrusion detector”, grant number SK2020A0213” and “Research project of the Center for the Study of Socialism with Chinese Characteristics for Xi Jinping New Era, grant number sxzx2021-09”.

Informed Consent Statement

Informed consent was obtained from all subjects involved in the study.

Data Availability Statement

Data used in this manuscript is available from corresponding author.

Conflicts of Interest

The authors declare no conflict of interest.

References

  1. China Economic News Network. Technological Innovation Enabling Enterprises to Build Green Development Model. Available online: https://jjsb.cet.com.cn/show_512318.html (accessed on 27 December 2019).
  2. Cheng, H. Construction of Evaluation Index System for Green Innovation Capability of Resource-based Cities. Sci. Technol. Manag. Res. 2019, 39, 90–97. [Google Scholar]
  3. Zhang, W.Y.; Yu, Q.; Yang, F.X. Evaluation of Green Innovation ability of Regional Manufacturing Industry under Innovation Driven Strategy—Modeling and Analysis of Complex Network Based on 30 Regional Data. J. Ind. Technol. Econ. 2018, 37, 86–94. [Google Scholar]
  4. Xu, J.Z.; Sun, Y.; Sun, X.G. Study of the Environmental Innovation Capability Evaluation Model of Manufacturing Enterprises Based on Entropy Weighted TOPSIS-PSO-ELM and Empirical Research. Oper. Res. Manag. Sci. 2020, 29, 131–140. [Google Scholar]
  5. Sun, Z.Q.; Nie, W.Y. The Impact of Financial Information Transparency under the Carbon Neutrality Target on the Regional Green Innovation Capability: Based on the Dual Perspective of Spatial Spillover Effect and Threshold Effect. Sci. Technol. Prog. Policy 2021, 38, 58–66. [Google Scholar]
  6. Wang, H.R.; Cui, H.R.; Zhao, Q.Z. Effect of Green Technology Innovation on Green Total Factor Productivity in China: Evidence from Spatial Durbin Model Analysis. J. Clean. Prod. 2020, 288, 125624. [Google Scholar] [CrossRef]
  7. Sun, Q.Y.; Zhu, Z.F.; Cao, Y.K. Evaluation and Analysis on China’s Provincial Regional Green Innovation Capability in the Perspective of Low Carbon Economy—A Case Study of Heilongjiang Province. For. Econ. 2019, 41, 34–42. [Google Scholar]
  8. Gupta, H.; Barua, M.K. Supplier selection among SMEs on the basis of their green innovation ability using BWM and fuzzy TOPSIS. J. Clean. Prod. 2017, 152, 242–258. [Google Scholar] [CrossRef]
  9. Musaad, O.A.S.; Zhuo, Z.; Siyal, Z.A.; Shaikh, G.M.; Shah, S.A.A.; Solangi, Y.A.; Musaad, O.A.O. An Integrated Multi-Criteria Decision Support Framework for the Selection of Suppliers in Small and Medium Enterprises based on Green Innovation Ability. Processes 2020, 8, 418. [Google Scholar] [CrossRef] [Green Version]
  10. Joseph, A.S. Theory of Economic Development; The Commercial Press: Beijing, China, 1990. [Google Scholar]
  11. Tura, T.; Harmaakorpi, V. Social Capital in Building Regional Innovative Capability. Reg. Stud. 2005, 39, 1111–1125. [Google Scholar] [CrossRef]
  12. Qi, G.Y.; Shen, L.Y.; Zeng, S.X.; Jorge, O.J. The Drivers for Contractors’ Green Innovation: An Industry Perspective. J. Clean. Prod. 2010, 18, 1358–1365. [Google Scholar] [CrossRef]
  13. Cao, H.; Shi, B.F.; Zhao, K. Evaluation on Provincial Green Innovation Capability: Based on Index Screening Model of Collinearity-Coefficient of Variation. Chin. J. Manag. 2016, 13, 1215–1222. [Google Scholar]
  14. Braun, E.; Wield, D. Regulation as a Means for the Social Control of Technology. Technol. Anal. Strateg. Manag. 1994, 6, 259–272. [Google Scholar] [CrossRef]
  15. Ge, S.S.; Zeng, G.; Hu, H. Evaluation of Green Innovation ability and Analysis of Spatial Characteristics in the Yangtze River Delta Urban Agglomeration. Resour. Environ. Yangtze Basin 2021, 30, 1–10. [Google Scholar]
  16. Lee, K.H.; Min, B. Green R&D for Eco-innovation and its Impact on Carbon Emissions and Firm Performance. J. Clean. Prod. 2015, 108, 534–542. [Google Scholar]
  17. Zhang, Y.Z.; Zhang, T.H. Evaluation Index System of Enterprise Green Innovation Capability and its Improvement Countermeasures. Econ. Res. Guide 2017, 32, 12–14. [Google Scholar]
  18. Yousaf, Z. Go for Green: Green Innovation through Green Dynamic Capabilities: Accessing the Mediating Role of Green Practices and Green Value Co-creation. Environ. Sci. Pollut. Res. 2021, 28, 54863–54875. [Google Scholar] [CrossRef]
  19. Tseng, M.L.; Wang, R.; Chiu, A.S.F.; Yong, G.; Yuan, H.L. Improving Performance of Green Innovation Practices under Uncertainty. J. Clean. Prod. 2013, 40, 71–82. [Google Scholar] [CrossRef]
  20. Singh, S.K.; Del Giudice, M.; Jabbour, C.J.C.; Latan, H.; Sohal, A.S. Stakeholder Pressure, Green Innovation, and Performance in Small and Medium-sized Enterprises: The role of Green Dynamic Capabilities. Bus. Strategy Environ. 2022, 31, 500–514. [Google Scholar] [CrossRef]
  21. Wang, Y.; Liang, Z.L.; Chen, H.C. Influence Mechanism of Technical Innovation Capability on Green Economic Growth. J. Environ. Prot. Ecol. 2020, 21, 1972–1984. [Google Scholar]
  22. Qiu, L.; Jie, X.; Wang, Y. Green Product Innovation, Green Dynamic Capability, and Competitive Advantage: Evidence from Chinese Manufacturing Enterprises. Corp. Soc. Responsib. Environ. Manag. 2020, 27, 146–165. [Google Scholar] [CrossRef]
  23. Huang, S.Z.; Chau, K.Y.; Chien, F. The Impact of Startups’ Dual Learning on Their Green Innovation Capability: The Effects of Business Executives’ Environmental Awareness and Environmental Regulations. Sustainability 2020, 12, 6526. [Google Scholar] [CrossRef]
  24. Ardyan, E.; Nurtantiono, A.; Istiyanto, B.; Rahmawan, G. Green innovation capability as driver of sustainable competitive advantages and smes marketing performance. Int. J. Civ. Eng. Technol. 2017, 8, 1114–1122. [Google Scholar]
  25. Deng, Y.P.; Wang, L.; Zhou, W.J. Research on the Evolution of Manufacturing Green Technology Innovation Capability Based on Industry Heterogenity—Also on the Influence of R&D Investment of Enterprises. Stat. Res. 2021, 38, 76–86. [Google Scholar]
  26. Tan, D.Q.; Shang, L.N. Influence of Environmental Regulation on Regional Green Innovation Capability from the Perspective of Manufacturing Upgrading. Acad. Forum 2018, 41, 86–92. [Google Scholar]
  27. Liu, Z.S.; Song, D.Y.; Gong, Y.Y. Research on Spatial-temporal Difference and Convergence of Green Innovation Capability in China. Chin. J. Manag. 2017, 14, 1475–1483. [Google Scholar]
  28. Xu, J.Z.; Guan, J. Study on the Environmental Innovative Capability Evaluation Model of Manufacturing Enterprises Based on Combination Weight of Two-Tuple Linguistic Method and Empirical Research. Oper. Res. Manag. Sci. 2017, 26, 124–131. [Google Scholar]
  29. Dai, W.L.; Lu, W.L. The Impact of Environmental Public Opinion Pressure on Manufacturing Firms Green Innovation Capability: The Chain Mediating Role of Leader Environmental Awareness and Organizational Green Learning. Sci. Technol. Prog. Policy 2020, 37, 131–137. [Google Scholar]
  30. Sun, Z.Q.; Bian, M.J.; Chen, W.Q. Study on Spillover Effect of Regional Green Innovation Aability in China. Ecol. Econ. 2019, 35, 71–76+93. [Google Scholar]
  31. Han, Y.Q.; Lu, H.; Shi, J.P. Internet Development, Environmental Regulation and Green Innovation Efficiency of High-Tech Industries—Take the Yangtze River Economic Belt as an Example. Resour. Environ. Yangtze Basin 2022, 1–18. Available online: http://kns.cnki.net/kcms/detail/42.1320.X.20220526.2033.002.html (accessed on 27 May 2022).
  32. Jiang, S.Y. Research on Entrepreneur Human Capital Affects the Company’s Green Innovation Capability. J. Tech. Econ. Manag. 2021, 3, 40–44. [Google Scholar]
  33. Zhang, Y.L.; Xu, L.; Wang, J.H. Driving Path of High-quality Development of Technology-based SMEs from Perspective of Green Innovation. Enterp. Econ. 2022, 41, 13–23. [Google Scholar]
  34. Sun, Y.; Xu, J. Evaluation Model and Empirical Research on the Green Innovation Capability of Manufacturing Enterprises from the Perspective of Ecological Niche. Sustainability 2021, 13, 11710. [Google Scholar] [CrossRef]
  35. Zou, H.; Ji, H.M.; Qin, H.; Guo, Y.Q.; Yang, X.H. Research on the Strategy Evolution of Knowledge Innovation in an Enterprise Digital Innovation Ecosystem: Kinetic and Potential Perspectives. IEEE Access 2022, 10, 78764–78779. [Google Scholar] [CrossRef]
  36. Liu, H.Y.; Zhao, S.K.; Xin, O. Analysis on the Evolution Path and Hotspot of Knowledge Innovation Study Based on Knowledge Map. Sustainability 2019, 11, 5528. [Google Scholar] [CrossRef] [Green Version]
  37. Bag, S.; Dhamija, P.; Bryde, D.J.; Singh, R.K. Effect of Eco-innovation on Green Supply Chain Management, Circular Economy Capability, and Performance of Small and Medium Enterprises. J. Bus. Res. 2022, 141, 60–72. [Google Scholar] [CrossRef]
  38. Xin, D.; Sheng, Z.Z.; Sun, J.H. How Technological Innovation Influences Environmental Pollution: Evidence from China. Complexity 2022, 2022, 5535310. [Google Scholar] [CrossRef]
  39. Shi, Z.; Wu, Y.J.; Chiu, Y.H.; Chang, T.H. Research on the Influence of Technological Innovation and Technological Application: Evidence from China. J. Eng. Technol. Manag. 2021, 63, 101670. [Google Scholar] [CrossRef]
  40. Zhu, H.X.; Geng, D.C. Dynamic Simulation Research on Green innovation Competitiveness of Shanghai, Jiangsu, Zhejiang and Anhui: Based on System Dynamics Perspective. Sci. Technol. Manag. Res. 2022, 42, 16–26. [Google Scholar]
  41. Bao, H.; Teng, T.W.; Hu, S.L.; Ding, J. Spatial Differentiation and Influencing Factors of Urban Green Innovation Efficiency in the Yangtze River Delta. Resour. Environ. Yangtze Basin 2022, 31, 273–284. [Google Scholar]
  42. Wang, H.; Khan, M.; Anwar, F.; Shahzad, F.; Adu, D.; Murad, M. Green Innovation Practices and Its Impacts on Environmental and Organizational Performance. Front. Psychol. 2021, 11, 553625. [Google Scholar] [CrossRef] [PubMed]
  43. Lin, W.L.; Ho, J.A.; Sambasivan, M.; Yip, N.; Mohamed, A.B. Influence of Green Innovation Strategy on Brand Value: The Role of Marketing Capability and R&D Intensity. Technol. Forecast. Soc. Change 2021, 171, 120946. [Google Scholar]
  44. Yu, C.H.; Wu, X.; Zhang, D.; Chen, S.; Zhao, J. Demand for green finance: Resolving financing constraints on green innovation in China. Energy Policy 2021, 153, 112255. [Google Scholar] [CrossRef]
  45. Xu, Z.; He, Y.; Wang, H. Factors Affecting Government R&D Funding and Enterprise R&D Behavior Based on System Dynamics. Manag. Rev. 2012, 24, 67–75. [Google Scholar]
  46. Romer, P. Endogenous Technological Change. J. Political Econ. 1990, 98, 71–102. [Google Scholar] [CrossRef]
  47. Park, W.G. A Theoretical Model of Government Research and Growth. J. Econ. Behav. Organ. 1998, 34, 69–85. [Google Scholar] [CrossRef]
  48. Zhang, X.; Wang, Y. Effect of Environmental Regulation and R&D Investment on Green Technological Innovation. Sci. Technol. Prog. Policy 2017, 34, 111–119. [Google Scholar]
  49. Qian, L.; Wang, W.P.; Xiao, R.Q. Research on the Difference of Green Innovation Efficiency of China’s Regional Industrial Enterprises from the Perspective of Shared Input Association. China Popul. Resour. Environ. 2018, 28, 27–39. [Google Scholar]
  50. Wu, Z.; Zhao, C.; Mei, C. Research on Scientific & Technological Achievements Transformation of Sichuan Provincial State-Owned Enterprises of China. Am. J. Ind. Bus. Manag. 2016, 6, 815–821. [Google Scholar]
  51. Guan, X.X.; Deng, K.; Qi, Q.R. Research and Application of Computer Technology in the Transformation Mode of Scientific and Technological Achievements in Chinese Universities. J. Phys. Conf. Ser. 2020, 1648, 032106. [Google Scholar] [CrossRef]
  52. Zhou, L.; Cao, C. The Hybrid Drive Effects of Green Innovation in Chinese Coal Enterprises: An Empirical Study. Kybernetes 2019, 49, 362–383. [Google Scholar] [CrossRef]
  53. Ouyang, L.; You, D. The Green Innovation Effect on Heavy-Polluting Enterprises Under the Environmental Protection Law. Front. Energy Res. 2021, 9, 681334. [Google Scholar] [CrossRef]
Figure 1. Theoretical model of green innovation capability driving path.
Sustainability 14 13031 g001
Figure 2. Division of green innovation subsystem for science and technology enterprises.
Sustainability 14 13031 g002
Figure 3. Causality diagram.
Sustainability 14 13031 g003
Figure 4. Flow stock diagram.
Sustainability 14 13031 g004
Figure 5. Sensitivity test.
Sustainability 14 13031 g005
Figure 6. Simulation of new product sales income and operating income under different government R&D investment schemes.
Sustainability 14 13031 g006
Figure 7. Simulation of different R&D investment proportion scheme.
Sustainability 14 13031 g007
Figure 8. Simulation of different R&D achievement conversion policy schemes.
Sustainability 14 13031 g008
Figure 9. Simulation curves of green innovation capability of enterprises under different policies.
Sustainability 14 13031 g009
Figure 10. Causal tracing diagram. (a) New product sales revenue cause diagram; (b) Technological innovation ability of enterprises cause diagram; (c) Ratio of investment in technological innovation cause diagram.
Sustainability 14 13031 g010
Table 1. Main variable equation design.
OrdinalVariableVariable Equation
1Innovation policy indexInnovation policy index = 0.027
2R&D Investment in universities and research institutionsR&D Investment in universities and research institutions = 0.17 × R&D investment by the government
3Investment of R&D personnel in universities and scientific research institutionsInvestment of R&D personnel in universities and scientific research institutions = 96.01 × Number of universities and scientific research institutions
4Number of scientific research achievementsNumber of scientific research achievements = INTEG (Increased number of R&D achievements, 121,900)
5Increased number of R&D achievementsIncreased number of R&D achievements = 0.187 × Number of research achievements × knowledge innovation ability
6Conversion rate of scientific research achievementsConversion rate of scientific research achievements = 0.14
7Number of enterprisesNumber of enterprises = INTEG (change of enterprises, 9630)
8Investment of R&D personnelInvestment of R&D personnel = 26.92 × Number of enterprises
9Enterprise R&D investmentEnterprise R&D investment = 0.51 × Government R&D investment
10Change in sales revenue of new productsChange in sales revenue of new products = 0.014 × Enterprise technology innovation capability × user demand
11Sales revenue of new productsSales revenue of new products = INTEG (Change in sales revenue of new products, 4066.75)
12Operating Income of technology-based enterprisesOperating Income of technology-based enterprises = 4.36 × Sales revenue of new products
Publisher’s Note: MDPI stays neutral with regard to jurisdictional claims in published maps and institutional affiliations.

