Article

Encouraging the Sustainable Adoption of Autonomous Vehicles for Public Transport in Belgium: Citizen Acceptance, Business Models, and Policy Aspects

imec-SMIT, Vrije Universiteit Brussel (VUB), 1050 Brussels, Belgium
*
Author to whom correspondence should be addressed.
Sustainability 2022, 14(2), 921; https://doi.org/10.3390/su14020921
Submission received: 19 December 2021 / Revised: 11 January 2022 / Accepted: 12 January 2022 / Published: 14 January 2022
(This article belongs to the Special Issue Urban Transport Sustainability)

Abstract

:
Several mobility-related issues persist in and around urban areas. Autonomous vehicles promise substantial environmental, safety, and economic benefits but may also cause unintended adverse effects that stem from single-passenger mobility becoming more affordable and accessible. While using them for public transport (i.e., autonomous shuttles) can help avoid such downsides, there are many challenges to their adoption, particularly ones that are related to citizen acceptance and economic aspects. Based on a novel survey of Brussels’ citizens, we provide insights from user opinions on last-mile autonomous shuttle services and analyze the effect of various attitudinal and socio-demographic factors affecting such acceptance. Our respondents exhibit an overall positive acceptance albeit with a limited willingness to pay for it. In addition, based on expert interviews, we provide a discussion on appropriate business models and policy recommendations to help ensure the timely adoption of AVs in Belgium that adapts to mobility needs and policy goals.

1. Introduction

Autonomous vehicles (AVs) promise to mitigate several major problems our societies are facing. At the environmental level, smoother driving can reduce energy and fuel consumption and optimize traffic flow, thus reducing road congestion. At the economic level, taking over the human responsibility of actively monitoring traffic would allow current drivers to spend their time on (other) work or leisure activities, thereby improving productivity. Less congestion would indirectly decrease idle commuting time and make roads more welcoming to more sustainable travel modes. All else being equal, AVs would also increase road safety since most road accidents involve some level of human error [1].
These problems are a global phenomenon, but particularly stringent in Belgian cities. Recent estimations rank Brussels among the most congested cities worldwide, estimating that the average commuter spent between 119 and 134 h caught in traffic jams around the capital in 2020 [2,3]. According to the OECD, this congestion comes with an economic loss of around 2% of Belgium’s GDP [4]. In addition, congestion is known to increase pollution and therefore has a negative effect on the environment and health.
Similarly, road safety is also a global problem from which Belgium is not exempt. Road traffic accidents claim about 1.35 million human deaths worldwide each year [5]. Moreover, according to data from 2017, Belgium recorded about 330 road accidents and 5.35 derived fatalities per 100,000 inhabitants—considerably higher rates than the EU average [6].
Autonomous vehicles also promise to increase accessibility to mobility services. By removing the major operating cost component which human drivers represent, AVs can increase the affordability and convenience of both ride hailing and public transport (PT). For ride hailing, i.e., the concept of on-demand robotaxis, this means making the service even cheaper and more ubiquitous. As a result, this can induce the demand for individual modes of transportation, in detriment to more sustainable alternatives such as public transport [7]. Incentivizing individual trips could even increase congestion, adding vehicles onto the road and trips during rush hour [8]. Therefore, to optimally reduce congestion and car usage in urban areas, robotaxis should be combined with collective transport [9]. Accordingly, devoting autonomous vehicles to public transport is central to avoiding the potential adverse effects of AVs.
For public transport, the operational cost-efficiency of AVs would allow public budgets to deploy bigger fleets and operate longer schedules, offering more lines at less popular times (e.g., at night). Autonomous shuttles can increase the convenience of PT for the last mile of trips by bringing passengers closer to their destination in an affordable manner. With this particular use in mind, level 4 (i.e., highly but not fully autonomous) shuttles offer an early commercialization prospect for AVs to be deployed in urban areas. Level 4 automation entails highly automated vehicles that are able to move without a human driver and can stop by themselves in case of a sudden rise in the complexity of road or weather conditions that the system is not able to handle [10]. Such a transit service may offer rides in geo-fenced areas consisting of relatively low-complexity roads, possibly relying on dedicated lanes, much like current manual buses do. Therefore, it would allow for the deployment of AVs before further technological advances enable full automation in practice. Several autonomous shuttle test projects have been carried out in Belgium in recent years, albeit with a limited geographical scope and traffic complexity [11].
Notwithstanding these possibilities, for AV-based public transport to be widely adopted, it needs to attract a sufficient number of users, which in turn requires an equivalent perceived utility (given price and convenience) to alternative mobility services such as individual ride hailing. An additional challenge is to convince citizens to change their current mobility behavior. Mobility patterns of Belgians are far from smooth and sustainable: the main mode of transport is the private car, in both number of trips and distance, and the average occupancy rate of cars is reported at just over a single person (1.21 per vehicle) [12]. Furthermore, the higher use of the private car by inhabitants of certain areas correlates negatively with accessibility to public transport and with the degree of urbanization.
Taking these conditions into account, recognition of the benefits of AVs will rely on large-scale public acceptance and adoption. However, the extant literature remains inconclusive regarding the role of socio-demographic and other factors in affecting public acceptance of autonomous vehicles and AV services, thus requiring a better understanding of the possible effects of such factors in Belgium. Similarly, successfully realizing such benefits and avoiding the potential adverse effects of AVs will hinge on whether appropriate regional policies are pursued, as well as on the business models used to exploit this innovation. Therefore, we argue that a multidisciplinary approach with a local perspective is needed to help contribute to the timely deployment and adoption of AVs in practice.
Research on autonomous vehicles is growing and is highly multidisciplinary, with aspects such as business models and consumer acceptance representing some of the trending but still emerging topics in the field [13,14]. Adding to this literature, the present paper focuses on public acceptance and commercial and policy aspects that need to be addressed in order to ensure the wide adoption of AVs in a sustainable manner. With this objective, we provide a multidisciplinary study based on a survey of citizens and a series of expert interviews, with a focus on Belgian stakeholders and their mobility challenges. We report a high intention among Brussels’ inhabitants and commuters to use autonomous shuttle services, although with a limited willingness to pay. Our results add to the inconclusive evidence of previous studies on the role of socio-demographic factors in the acceptability of self-driving vehicles and services, with some exceptions such as the significant positive role of familiarity in the intention to use. We also discuss a business model approach to scale autonomous public transport in Belgium, both geographically and in terms of user reach, which relies on the leading role of public entities. Finally, we propose concrete policy recommendations to build a regional business ecosystem, to ensure the sustainable use of AVs in the region, and to encourage public acceptance by increasing familiarity through testing.
The present study is structured as follows: Section 2 reviews the potential advantages and disadvantages of AVs. Section 3 reviews challenges in adopting AVs from theoretical and empirical perspectives. Section 4 explains the methodology of the study. Section 5 provides the findings of the survey and the expert interviews. Section 6 discusses the implications of these results and extends them with a business model analysis. Finally, Section 7 concludes by summarizing and discussing limitations.

2. Potential Benefits and Adverse Effects of Autonomous Vehicles

Autonomous driving technology is a double-edged sword. On the one hand, AVs promise to bring environmental, safety, and economic benefits, as well as increase convenience for consumers and accessibility to mobility services for people who are not able to drive or who live in remote areas with limited public transport. On the other hand, AVs carry potential adverse effects: at the societal level, these include the non-reduction or even the increase of both fuel consumption and congestion, the substitution of sustainable modes for individual ride-hailing, and the loss of jobs. In this section, we provide a concise literature review on both these potential benefits and downsides.

2.1. Potential Benefits

The widespread deployment of automated vehicles (AVs) would, all else being equal, reduce fuel and energy consumption compared to current vehicles and help decrease carbon dioxide emissions through more efficient driving (i.e., via less idling, smoother breaking and acceleration, platooning, etc.) [15,16,17,18,19]. Smoother driving would also optimize traffic flow, reducing traffic congestion and expanding road capacity [16,17,18]. With large penetration rates, AVs have the potential to increase freeway capacity by 30% [20]. Autonomous taxis can also reduce emissions and congestion by down- or right-sizing, i.e., allocating vehicles according to each trip’s occupancy needs in terms of passenger seats and storage space [18,21].
AVs may also indirectly reduce the amount of vehicles on the road as well as overall distances traveled, consequently reducing congestion and emissions even further. Due to their affordability and convenience, people may choose to use autonomous taxis instead of their private cars [7], thus reducing their dependency on private means of transport [22,23]. Simulation studies show that on-demand shared autonomous vehicles can meet the current mobility demand of cities with fleets of AV taxis whose size is as small as one-third [16] or even a tenth [24] of the current amount of manually driven cars in use. Lastly, AVs can also reduce the number of vehicles used by increasing the convenience of public transport (PT) for the first and last mile of trips, when being used for the linking of PT stations with departure/destination points [18].
Autonomous vehicles are also expected to enhance road safety and save lives by replacing human drivers since the driver is estimated to be the main cause of a car crash in the overwhelming majority of cases [25,26].
Self-driving vehicles will enable current drivers to safely invest their travel time in working or leisure activities. In addition, less congestion will lead to time savings. Besides productivity gains, the high market penetration rate of AVs can lead to monetary savings from fewer traffic accidents; on average, the social and human costs of road accidents in high income countries are estimated to be 2.7% of GDP [27]. Other sources of cost savings relate to parking fees and the construction and maintenance of parking infrastructure [17]. Since AVs do not require the presence of its passengers to find a parking spot, they free up the time drivers must spend searching for parking spots [28] and reduce the need for parking infrastructure close to their destination, including in more expensive urban areas such as city centers [18,29], and in turn decreasing urban housing development costs [23].
Furthermore, AVs could lower the prices of on-demand mobility services such as taxi rides by lowering the main operational expenses of driver income and fuel (from higher vehicle energy efficiency) [21], while fewer crashes would, all else being equal, lower insurance premiums [17].
Lastly, AVs can also increase accessibility to mobility services. They can enable people who were previously unable to drive or hold a driver’s license—such as underage and elderly people and people with visual impairments—to have access to private vehicles or affordable single-occupant mobility services [17,18].

2.2. Potential Adverse Effects

Potential, unintended negative impacts (i.e., rebound effects) may partly offset or even outweigh the described benefits of driving automation [30]. The aforementioned higher accessibility, convenience, and affordability of driverless mobility services compared to current options can change travel patterns and preferences that would indirectly induce an additional demand for less environmentally friendly travel options such as single-occupant autonomous taxi trips, which can then lead to longer distances traveled [15,18].
Moreover, the fact that driving time can be replaced by productive or entertaining tasks could mean that the value attached to savings in travel time would diminish. Together with reduced congestion, this may also make people more willing to undertake longer (commuting) journeys, which in the longer term would cause urban sprawl [17,18]. In turn, urban sprawl and the consequently lower population density would make it less cost efficient to offer time-efficient public transport to locations near people’s homes.
Furthermore, the higher affordability of AV-based, on-demand, ride-hailing services (robotaxis) can incentivize single-occupant trips, thereby generating more vehicle trips and increasing the amount of vehicles on the streets and correspondingly, intensifying road congestion [7,23,31]. This affordability would discourage travelers to share rides or use public transport since the extra cost savings of a shared trip may not compensate for the reduced privacy [7,18,23]. The relative utility of public transport would diminish with lower taxi prices because of the latter’s convenience of being an on-demand, door-to-door service. Empirical studies on conventionally driven ride hailing suggest that in spite of not yet feeling the potential affordability of AVs, current ride hailing mostly consists of single-passenger trips and is already adding vehicles to the streets [31] and increasing the distances traveled [32].
Lastly, the convenience of self-parking can also increase the demand for cars in cities, hence resulting in congestion and pollution [28]. AVs driving around while not occupied and self-parking in the outskirts of a city can result in more kilometers driven [24]. Moreover, automating the driving task also brings about the concern that the reduction in the demand for human drivers will cause job losses among professionals (taxi, truck, delivery, or bus) drivers [18,22].

3. Challenges to the Adoption of Autonomous Vehicles

There exist several challenges to the adoption of autonomous vehicles besides the development and commercial readiness of AV technology. First, regulatory and policy aspects may impede implementation due to the cautiousness of local and national governments, driven by safety concerns. This can be reflected, for instance, in a reluctance to update traffic codes or to allocate permits for the testing of AVs on public roads, which would in turn limit the ability of AI-powered systems to learn from challenging driving conditions.
Second, the lack of adapted infrastructure may cause potentially dangerous conflicts with other road users. Belgian roads are seen as an obstacle compared to other advanced countries; the fact that roads are often shared by cars, buses, cyclists, trams, and pedestrians poses a safety challenge for AVs [33]. Low-speed shuttles could disturb traffic, impairing their acceptance by other road users [34]. In addition, morally hazardous behavior can be adopted by other road users when interacting with AVs: human drivers may drive more aggressively around AVs, knowing that the latter is designed first and foremost to avoid accidents, even if that means driving more cautiously. Likewise, pedestrians may jaywalk more, thus slowing down traffic [35]. This shows the possibility that in order to avoid dangerous conflicts, roads would need to be designed in a way in which both autonomous and manually-driven vehicles avoid much mingling, e.g., by allocating separate lanes on roads.
Third, user acceptability, as with every new technology, can also pose a challenge. In their systematic literature review, Pigeon, Alauzet, and Paire-Ficout [36] identified several categories of factors influencing the acceptability, acceptance, and usage of autonomous shuttles dedicated to PT: (1) characteristics of the service itself such as schedules and fares; (2) safety aspects such as on-road and on-board safety; and (3) individual factors such as socio-demographics, travel habits, and personality traits. Following this classification, we divide our literature review on user acceptance of AVs into three parts, namely Section 3.1, Section 3.2, and Section 3.3.
Lastly, the lack of an active regional business ecosystem can slow down the availability of AV services in the market and make it more challenging to align such services with local policy objectives and mobility needs. We will expand on this topic in Section 3.4.

3.1. Service and Cost Characteristics

Characteristics of the service offered by AVs as public transport or as on-demand vehicles play a central role in the acceptance of this technology as they contribute to the user’s expectancy of performance and perceived utility as well as the convenience of the service. In this respect, short waiting times, a high frequency service, and affordability have been found to positively influence the acceptance and adoption of (shared) AVs as a service [36,37]. Similarly, the results in the studies by Asgari and Jin [38] and Cartenì [39] show that the willingness to change current modes of transport for driverless ones decreases as the relative costs or travel times of AVs increase.
Some surveys even observed that the average user was less willing to spend for a trip on an AV [39,40]. Similarly, older studies found that most people were not willing to pay extra for having automation technology in their vehicles [41]. On the other hand, other studies found that respondents were, on average, willing to pay extra for automation technology and AVs [38,42,43], and that the WTP increased with the level of automation [38,42].
Regarding the willingness to pay for autonomous PT services, lower fares generally improve the attractiveness of AV shuttles compared to other transport modes [44,45,46]. However, in Portouli et al. [47], a majority of the respondents were willing to pay as much or more for AVs than for conventional buses.

3.2. Safety Aspects

Overall, studies indicate that there are concerns regarding the safety of AVs, mainly related to the absence of drivers. These concerns have overall been found to have a negative impact on either the opinion about AVs [48], the perceived usefulness of AVs [45], or the willingness to use AVs [49]. Recent citizen surveys have shown public concern about passenger and pedestrian safety issues with regard to riding autonomous vehicles [39,50]. Other concerns relate to the hacking of the vehicle’s software and data privacy [51,52], assault, terrorism, traffic safety, with a tendency for women to be more concerned than men [41,53]. Lastly, the absence of on-board supervision leaves respondents wondering about the assistance to people with disabilities, the resolution of technical issues, the prevention of incivilities, and disobedience of regulations [49].

3.3. Individual Factors

Several individual factors such as socio-demographic variables, travel behavior, and mobility capacity have been found to influence the acceptance of AVs as a service.
The effect of age is disputed among studies. Although several studies have found no link between the age of the respondents and the feeling of safety [54], the level of trust regarding AVs [55], or the willingness to use an AV [56,57,58], most studies that do find a significant relationship indicate that younger people are more likely to have a positive attitude and an intention to use (shared) AVs [37,59] as well as appear more willing or less reluctant to use AVs and AV services than the older respondents [39,41,53]. Lee et al. [60] found that younger people perceived the technology more positively (e.g., as more useful) and showed a higher intention to use AVs. Likewise, multiple studies have found age to be negatively linked with the willingness to pay (WTP), with younger respondents exhibiting a higher WTP [43].
The effect of gender on the acceptance of AVs is incongruous throughout the literature. While some studies have found no significant influence of gender on the intention to use [53], the willingness to use [57,61], or the willingness to pay for AVs [43], the studies that did find a significant link indicate that men are more trusting toward the technology [54,55] and are more willing to use AVs [49,62] and higher levels of automation [53]. Indeed, men have been found to be less concerned about self-driving technology than females and to perceive higher benefits from it [39,41,43].
The effect of education on acceptability appears as clear in the literature: a high education level seems to be associated with a higher willingness to use [53], intention to use [59], and preference for AVs in comparison with traditional shuttles [44].
The respondents’ income was not found to have an effect on preference for autonomous shuttles over traditional shuttles [63] or on the intention to use an autonomous shuttle [56]. Likewise, income was found to be a significant determinant of the intention to adopt AVs as well as the perception of both benefits and concerns with regard to AVs [50]. In addition, previous studies show that respondents with higher income levels are willing to pay more for self-driving technology [43].
Familiarity with AVs, such as past experiences and level of knowledge regarding AVs, has been found to impact their acceptability. Liu et al. [43] reported a higher willingness to pay for AV technology and services among respondents who were familiar with the concept of AVs before the survey. In the same line, knowledge of AVs increases the willingness to use AVs [49,56]. Likewise, previous experience with AVs positively impacts the intention to use AVs [58], the willingness to pay for the service [64], and increases the probability of the respondents choosing AVs over other means of transport [65]. However, familiarity was not a statistically significant predictor in the study by Bansal and Kockelman [42].
Regarding travel behavior, a general positive attitude regarding public transport was observed to positively influence the willingness to use AVs [56,59]. While passengers of AVs perceived an autonomous car to be riskier than a manual one, pedestrians perceived it as safer [66]. Furthermore, vulnerable road users (pedestrians and cyclists) were found to be optimistic about the potential safety benefits of AVs in [67]. Furthermore, car drivers were less willing to use an AV than users of other modes of transport in [56], while respondents who use public transport frequently have been found more willing to use an AV than a traditional bus as compared to people who use PT less frequently [68].
Finally, the mobility capacity of respondents can also influence their acceptance of AVs. People with reduced mobility have been found more likely to choose AVs over the option of walking or taking a rented bike [65], while the use of AVs appeared to be influenced by temporary disability [69].

3.4. Business Ecosystems

The concept of the business ecosystem is used to reflect the current complexity of commercial solutions and competitive environments in the mobility sector, which is brought about by innovations such as connected and automated driving technology. A business ecosystem can be defined as a set of dynamic relationships involving various types of partners from multiple industries [70,71]. Although similar to value networks, which encompass multiple value chains of different industries and depict collaborations between multiple players to deliver value to end customers through a range of products or services [72,73], the notion of an ecosystem focuses on the broad collaboration between the stakeholders involved.
As biological species do, interdependent companies in a business ecosystem must create cooperative networks—in their case, of suppliers, investors, and other stakeholders—in order to innovate [71]. Another concept from biological ecosystems is that of keystone species, i.e., those whose presence is crucial in maintaining the organization and diversity of the ecosystem [74]. Analogously, keystone companies are seen as an important element for the success of business ecosystems [75]. Similar concepts are those of the “anchor tenant” [76], “ecosystem orchestrator” [77], and “ecosystem leader” [71]. These central entities bring value to the overall ecosystem by governing it, maintaining relationships and fostering new ones, stimulating collaboration and the sharing of knowledge, providing guidance for the future in the form of a strategic vision, or developing a shared infrastructure or platform upon which collaborating entities can develop their own solutions.
We can differentiate between two distinct types of ecosystems according to their objectives. We define as “business ecosystems” those whose main goals are to deliver value to customers through commercial products and services, and their dynamics involve continuous product and business model innovation. Their keystone players are usually large companies that possess key assets and infrastructure. In contrast, “knowledge ecosystems” focus on producing the research output that underlies technological development as well as the testing that pushes innovation. Anchor tenants are usually research organizations, including universities and large firms with established R&D departments [78,79]. Compared to business ecosystems, they are more focused on collaboration than on competition.
An important challenge is successfully transforming a knowledge ecosystem into a business ecosystem. To that end, a solid innovation ecosystem is a valuable cornerstone. The benefits of a strong local knowledge ecosystem include producing applied research that is tailored to local needs and a higher rate of valorization of knowledge creation within the local business ecosystem. Furthermore, internationally reputed research institutions are important for attracting relevant human capital. Flanders and Brussels possess a strong and internationally oriented research community, with several leading research centers. In addition, regarding research on AV technology, the biggest collaborations that define the current relevant AV knowledge ecosystem appear in large-scale, publicly funded European projects that have the objective of developing a common European strategy for the deployment of CAD services in the EU, as well as shuttle tests at the local or city level.
However, a robust knowledge ecosystem does not automatically translate into a successful innovation or business ecosystem. To achieve this goal, Clarysse et al. [78] suggested that policies should, among others, rely more on funding types such as venture capital that could bring about a logic shift, from an academic to a commercial one, and encourage leading industrial incumbents to become anchor tenants that facilitate connections between different types of players and help to develop a joint value proposition with regional startups.
Given that policy objectives are regional, one challenge when transitioning to a mobility business ecosystem is the transformation of knowledge into commercial products that adapt to local needs. Policymakers should incentivize business models that simultaneously push for adoption and lead to a desirable societal impact.

4. Materials and Methods
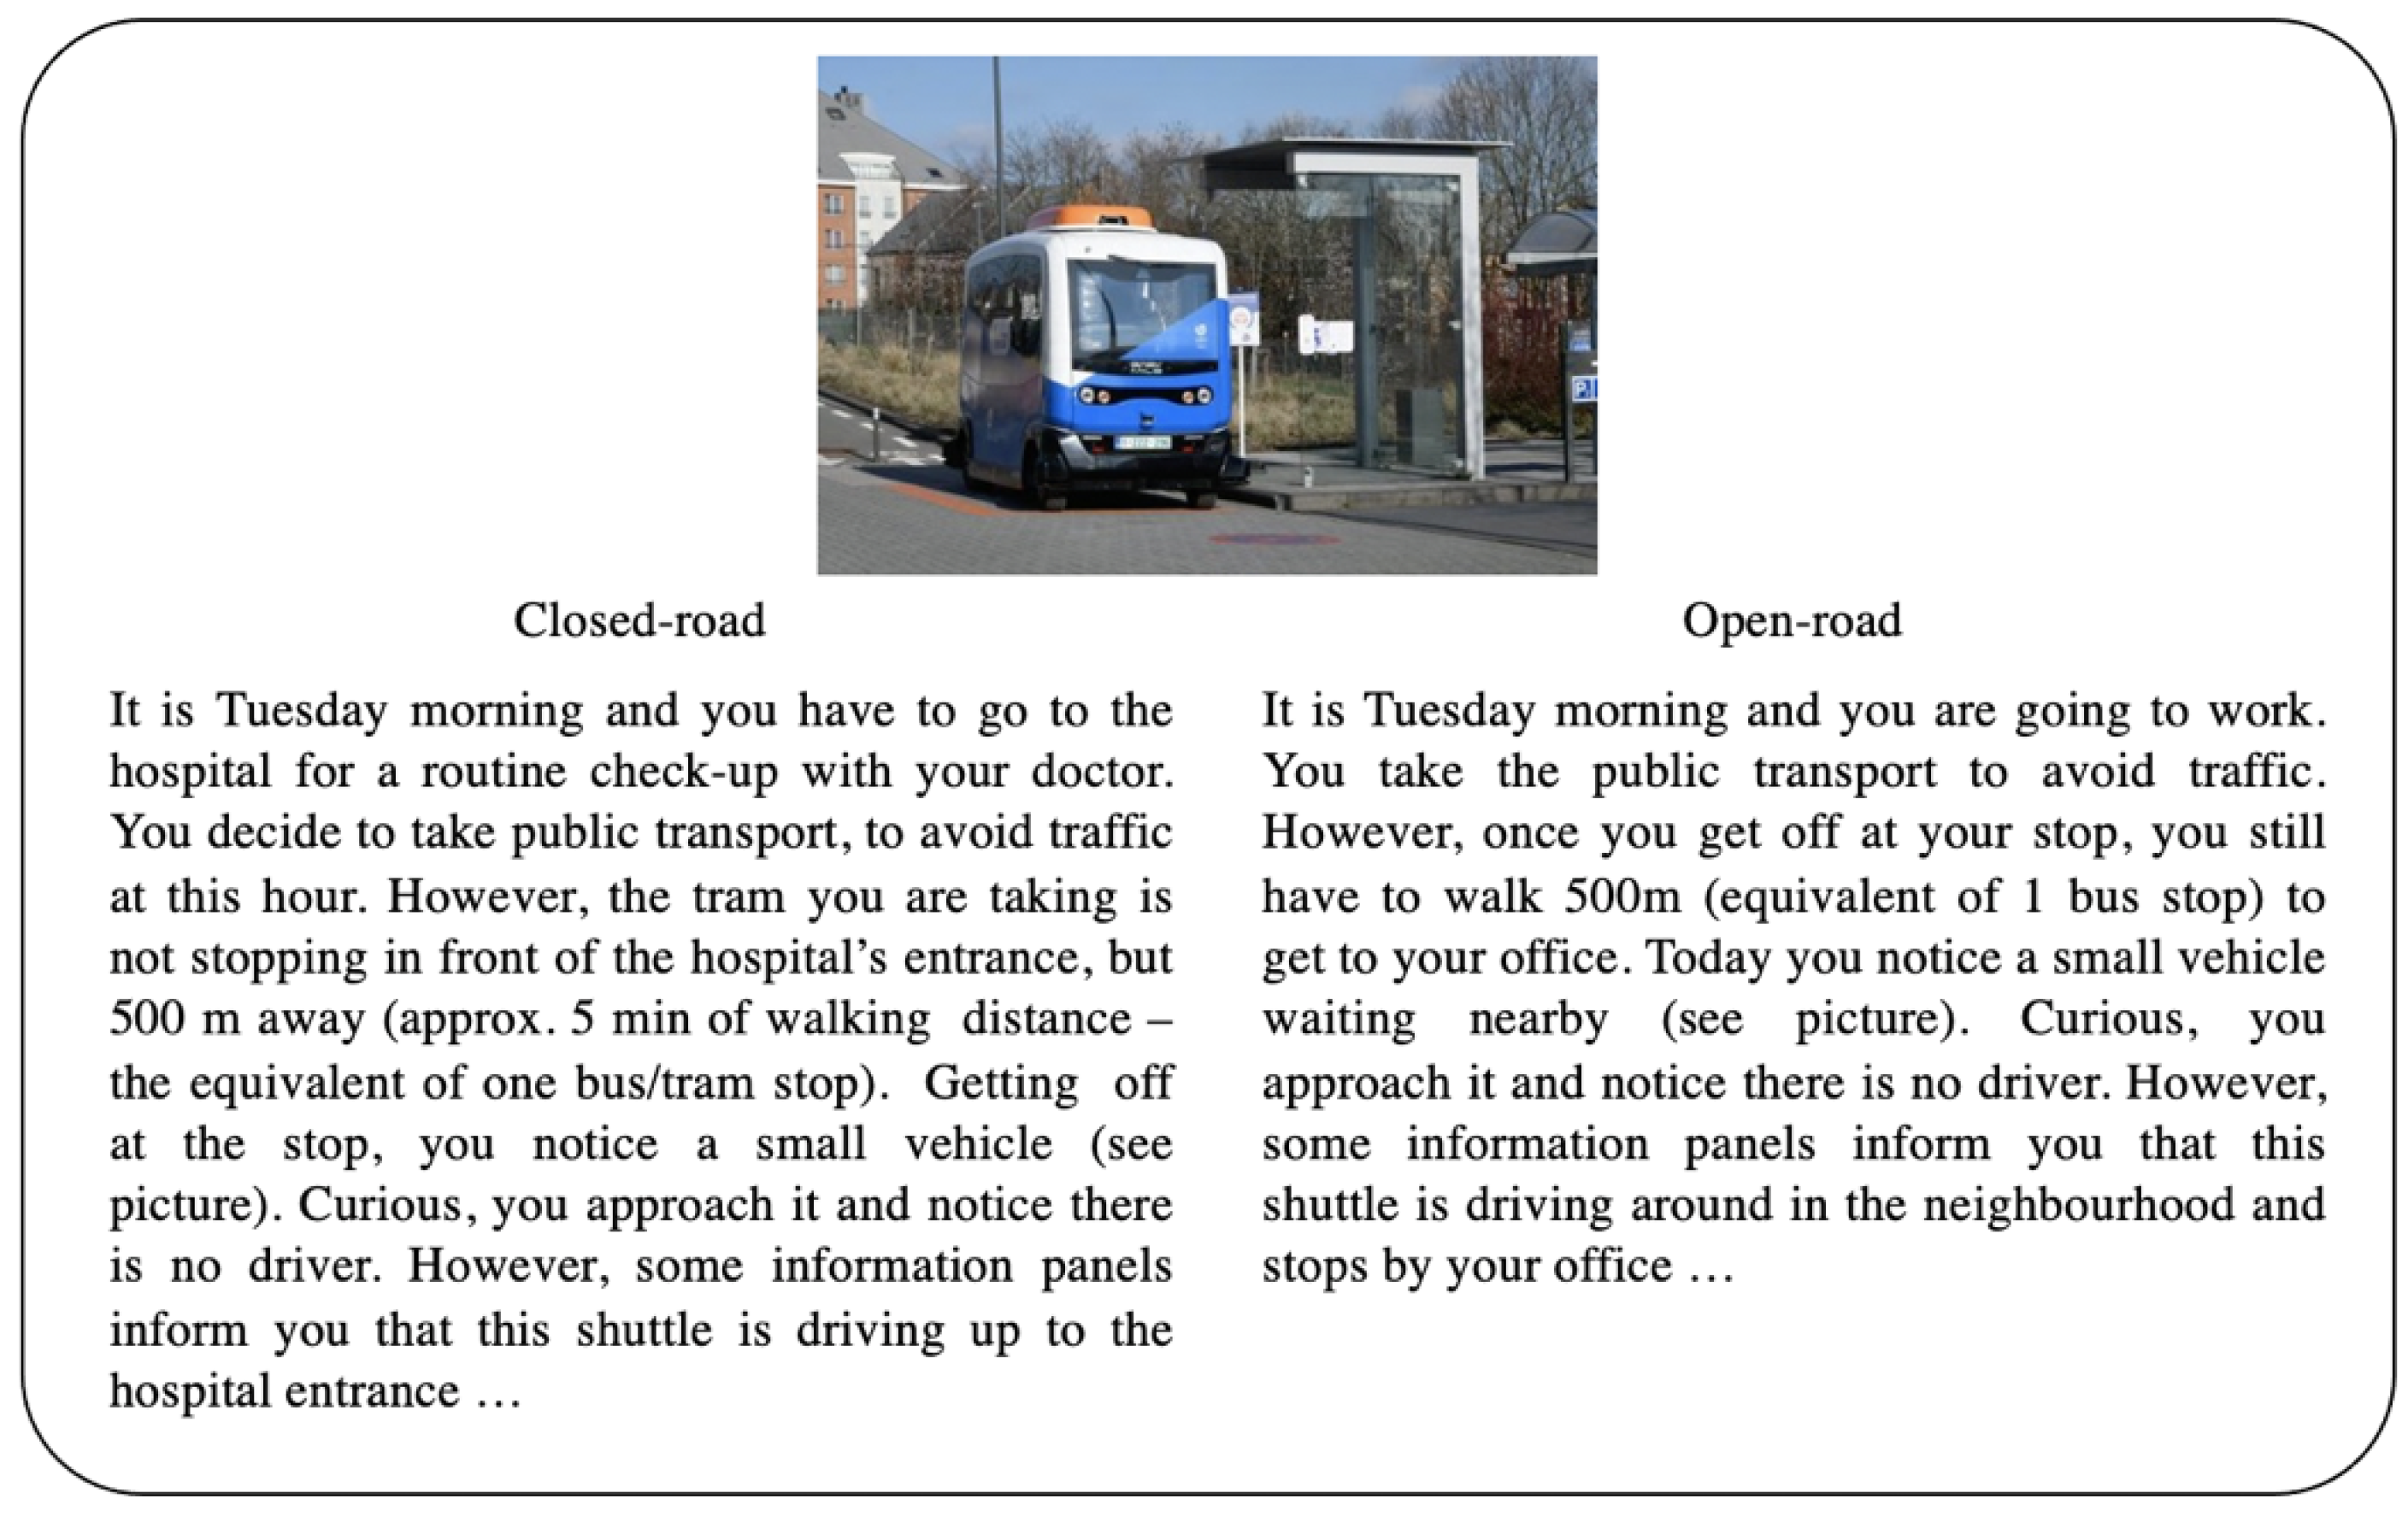
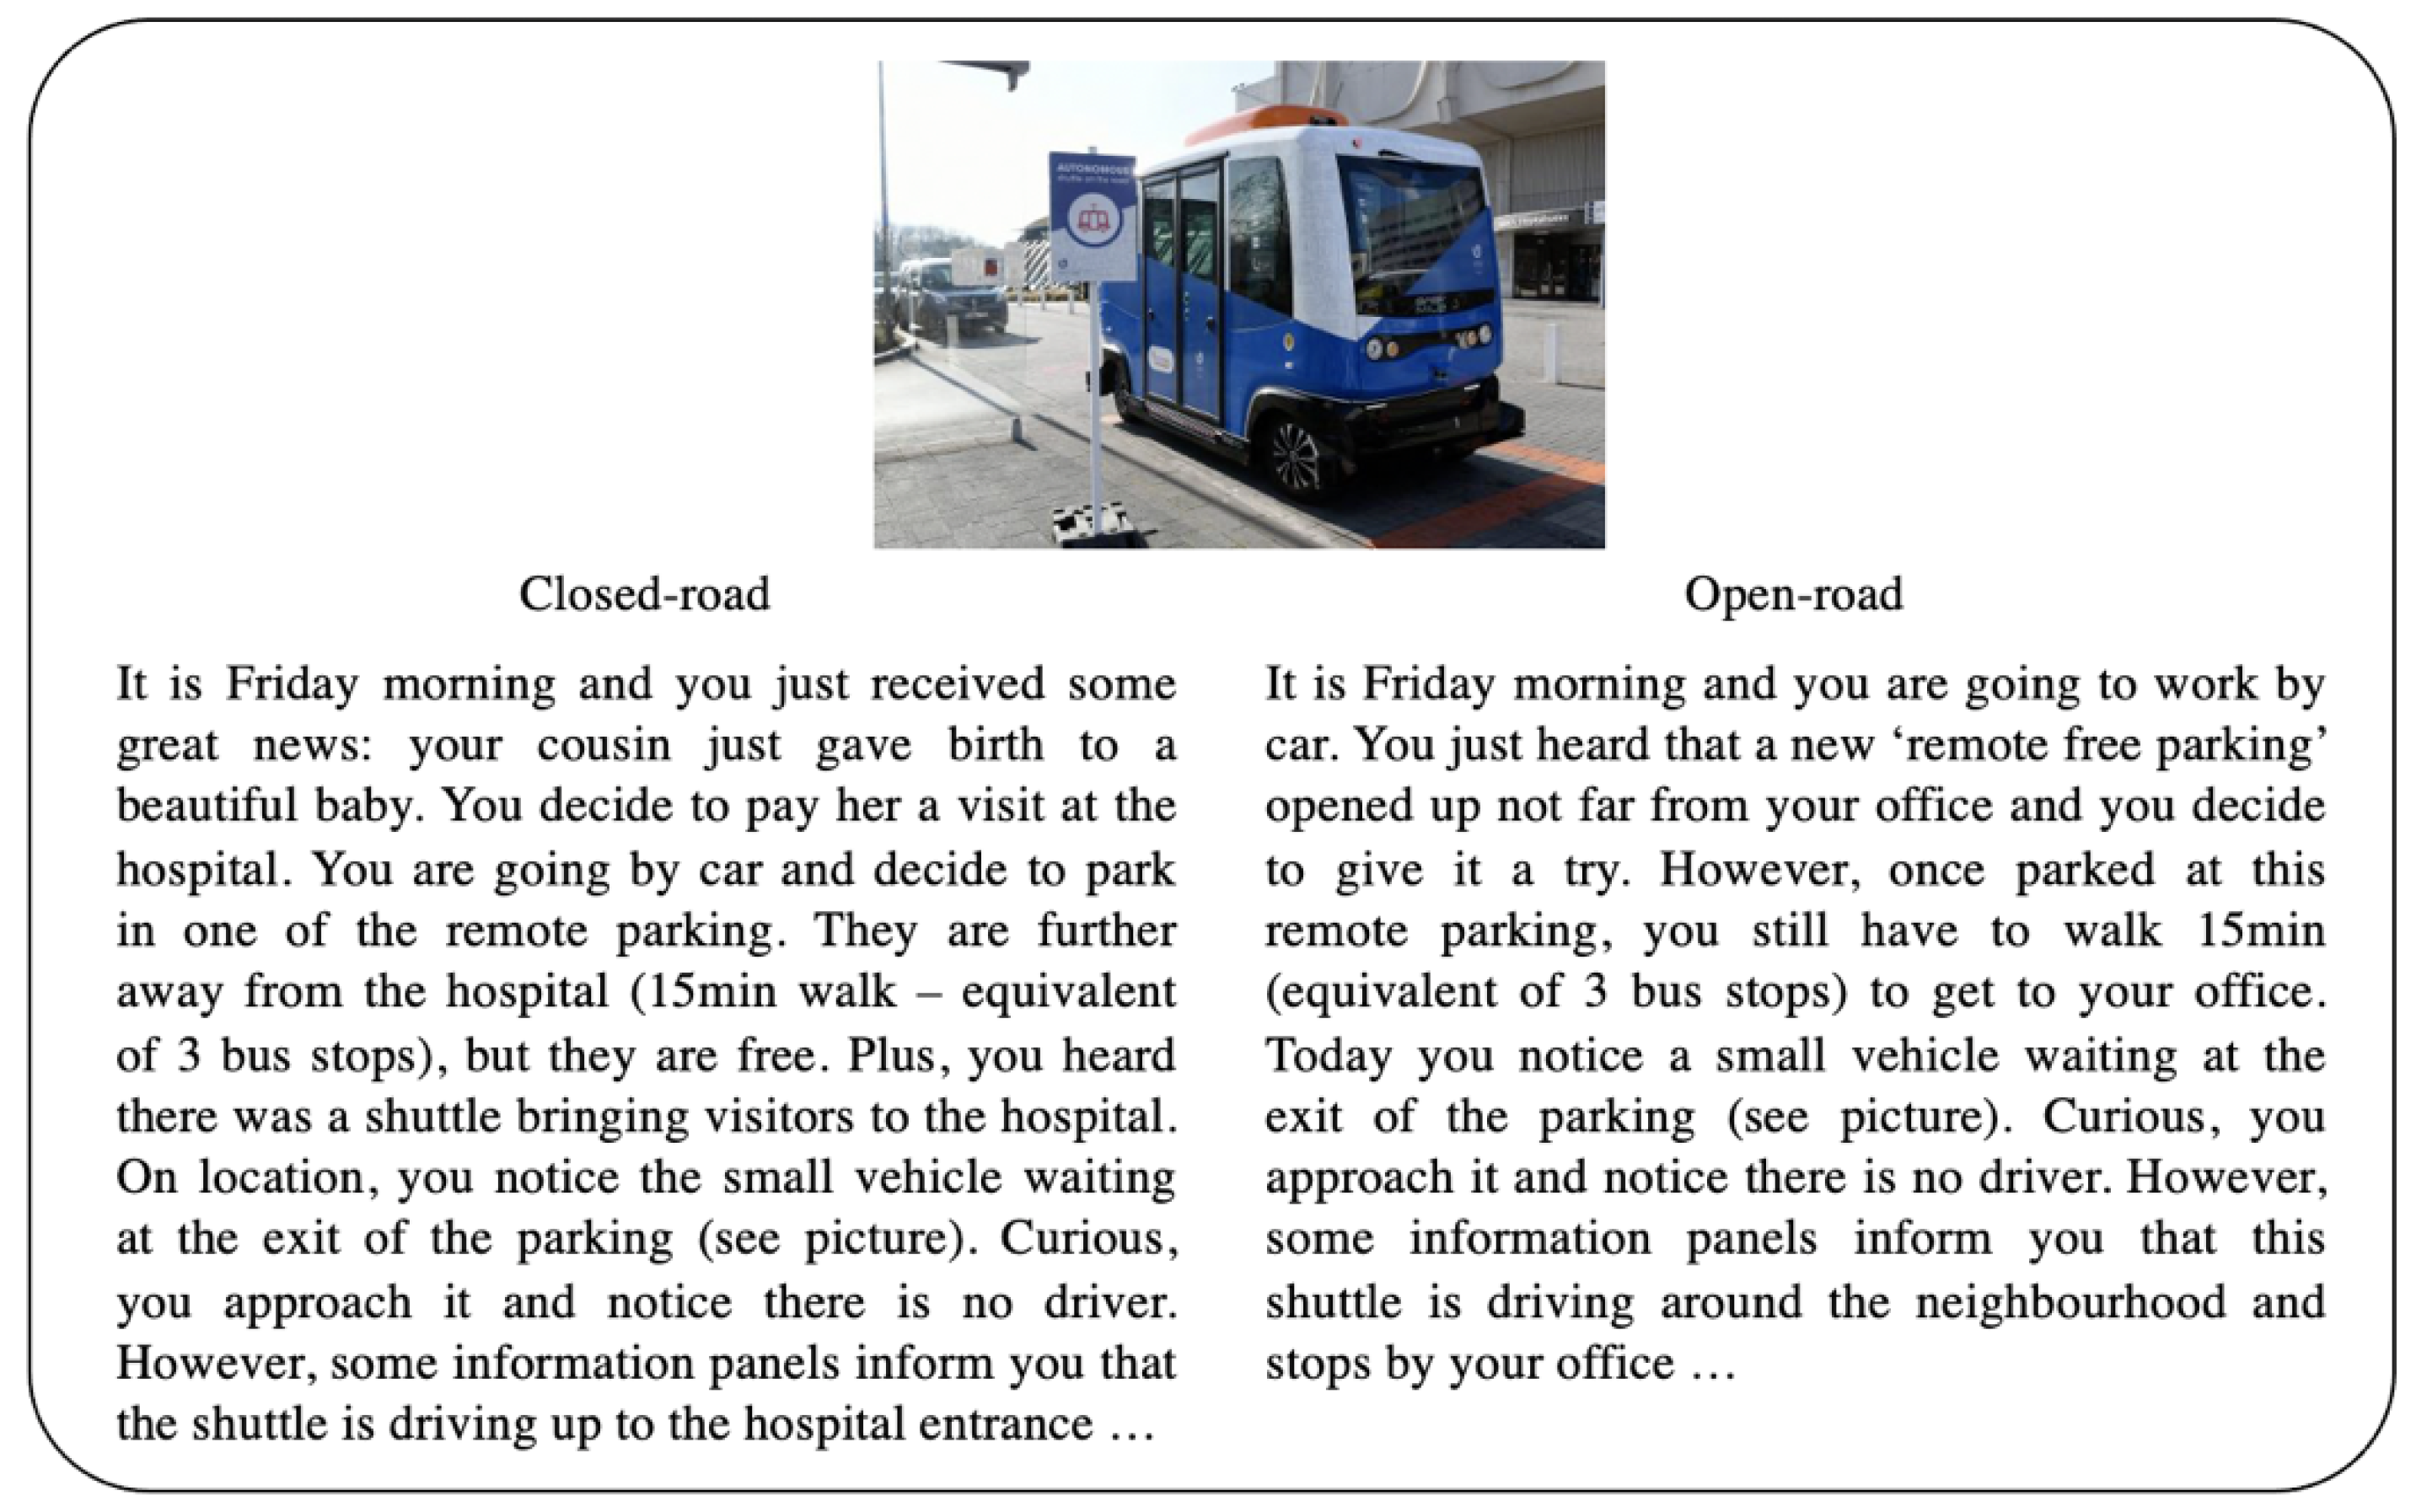
4.1. Survey

In order to better understand the acceptance of AVs as public transport by the population of Brussels (inhabitants and commuters) and to bring clarity to inconclusive results from previous studies, a large-scale survey was conducted in the context of the “Automated Shuttle Service for the Brussels Health Campus (ASSUZB)” project. This project conducted a real-life pilot on the VUB (Vrije Universiteit Brussel) campus. The survey was distributed between November 2020 and January 2021 and built on previous results from this project, which investigated user acceptance among a restricted sample of participants that had experienced the AV in the pilot [34]. Due to the COVID-19 pandemic that cut short the project, the survey was disseminated online through: (i) the project’s network, (ii) a hired recruitment agency, and also (iii) via social media—more specifically, a paid ad campaign on Facebook, using the platform’s capabilities to target the desired citizen profiles. Regarding the inclusion criteria, respondents had to be either “inhabitants” of the Brussels Capital Region or “commuters” to the Brussels Capital Region (i.e., citizens living on the outskirts and commuting to BCR for work).
The study followed a scenario-based research methodology, using scenarios that were co-created together with the different stakeholders of the Living Lab [80]. Scenario-based research is a type of research where participants are presented with hypothetical scenarios and are asked to express how they feel about it [81]. Scenario-based surveys are often conducted due to limitations in resources and access to usable data [82], which was the context of this research as it took place during the first year of the COVID-19 outbreak. Two scenarios were presented to the respondents in a detailed manner, immersing them in the story that described the specific service provided as well as its environment of implementation (see Figure 1 and Figure 2). The first scenario presented the case of a last-mile autonomous shuttle service intended to complement public transport, while the second presented a last-mile service intended to link the hospital’s entrance to a remote parking space. Furthermore, to enhance the specificity of the scenarios, two contextual conditions were added, creating two alternative descriptions that detailed each scenario in an open-road and a closed-road context. Participants were then randomly assigned to either of the conditions.
In order to better understand the acceptance of the services presented in the diverse scenarios, the online survey assessed several components for each scenario. First, the intention to make use of these services was assessed. The intention to undertake a certain behavior (here, to make use of the service presented) translates the motivational factors, which in turn translate the effort that one is ready to make in order to undertake the said behavior: the stronger the intention, the more likely the behavior is to be undertaken by the individual [83]. The intention was measured through one item (“Assuming you are in this situation, would you choose to take the autonomous shuttle?”) on a 5-point Likert scale from “I definitely would not” to “I definitely would”. Second, the (behavioral) attitude regarding the use of the different services was assessed. The attitude is a global evaluation of a said behavior (here: making use of the service) and of its results [84]. The attitude is constituted of “attitudinal beliefs”, which are expectations regarding the behavior and its consequences [83]. These were evaluated through five 5-point bipolar items (useful–useless; pleasant–unpleasant; safe–dangerous; easy–difficult; relaxing–stressful). From these items, a composite score was calculated.
Finally, the willingness to pay (WTP) for the services described was assessed for the subsamples that indicated a positive intention to use the shuttle in the respective scenarios. The WTP corresponds to the maximum amount of money a customer is willing to spend for a service or product. In this sense, WTP represents the measure of the value that a person assigns to an experience in monetary units [85]. The WTP was assessed both per ride (1 = “I would not be willing to pay”; 2 = “less than EUR 0.5”; 3 = “EUR 0.5–1”; 4 = “EUR 1–1.5”; 5 = “EUR 1.5–2”; 6 = “EUR 2–2.5”; 7 = “EUR 2.5–3”; 8 = “more than EUR 3”) and per annual subscription in terms of added fee on top of their current annual subscription—starting at EUR 499 for MIVB/STIB, the main public transport service in Brussels—(1 = “0%—It should be included in the price of the subscription (EUR 499)”; 2 = “5% or EUR 25 (total: EUR 524); 3 = “10% or EUR 50 (total: EUR 549); 4 = “20% or EUR 100 (total: EUR 599)”; 5 = “30% or EUR 150 (total: EUR 648)”; “40% or EUR 200 (total: EUR 699)”; “50% or EUR 250 (total: EUR 749)”; “More than 50% (more than EUR 749)”).

4.2. Expert Interviews

For the business and policy analyses, we interviewed 18 experts from 15 organizations working in mobility. The one-hour interviews were conducted between November and December 2020 and allowed for the validation and extension of the initial analysis of the business models for last-mile public transport with AVs. Table 1 provides a list of participants by entity and stakeholder type. Our sample covered public transport operators (PTOs) and authorities acting in the Brussels and Flemish regions, as well as leading automakers and mobility service providers with a foothold in the region. The job titles of our interviewees included several C-level and senior management positions as well “Project Director” and “Business Developer” roles. However, their opinions were provided as individual experts, therefore not implying an official stance.

5. Results

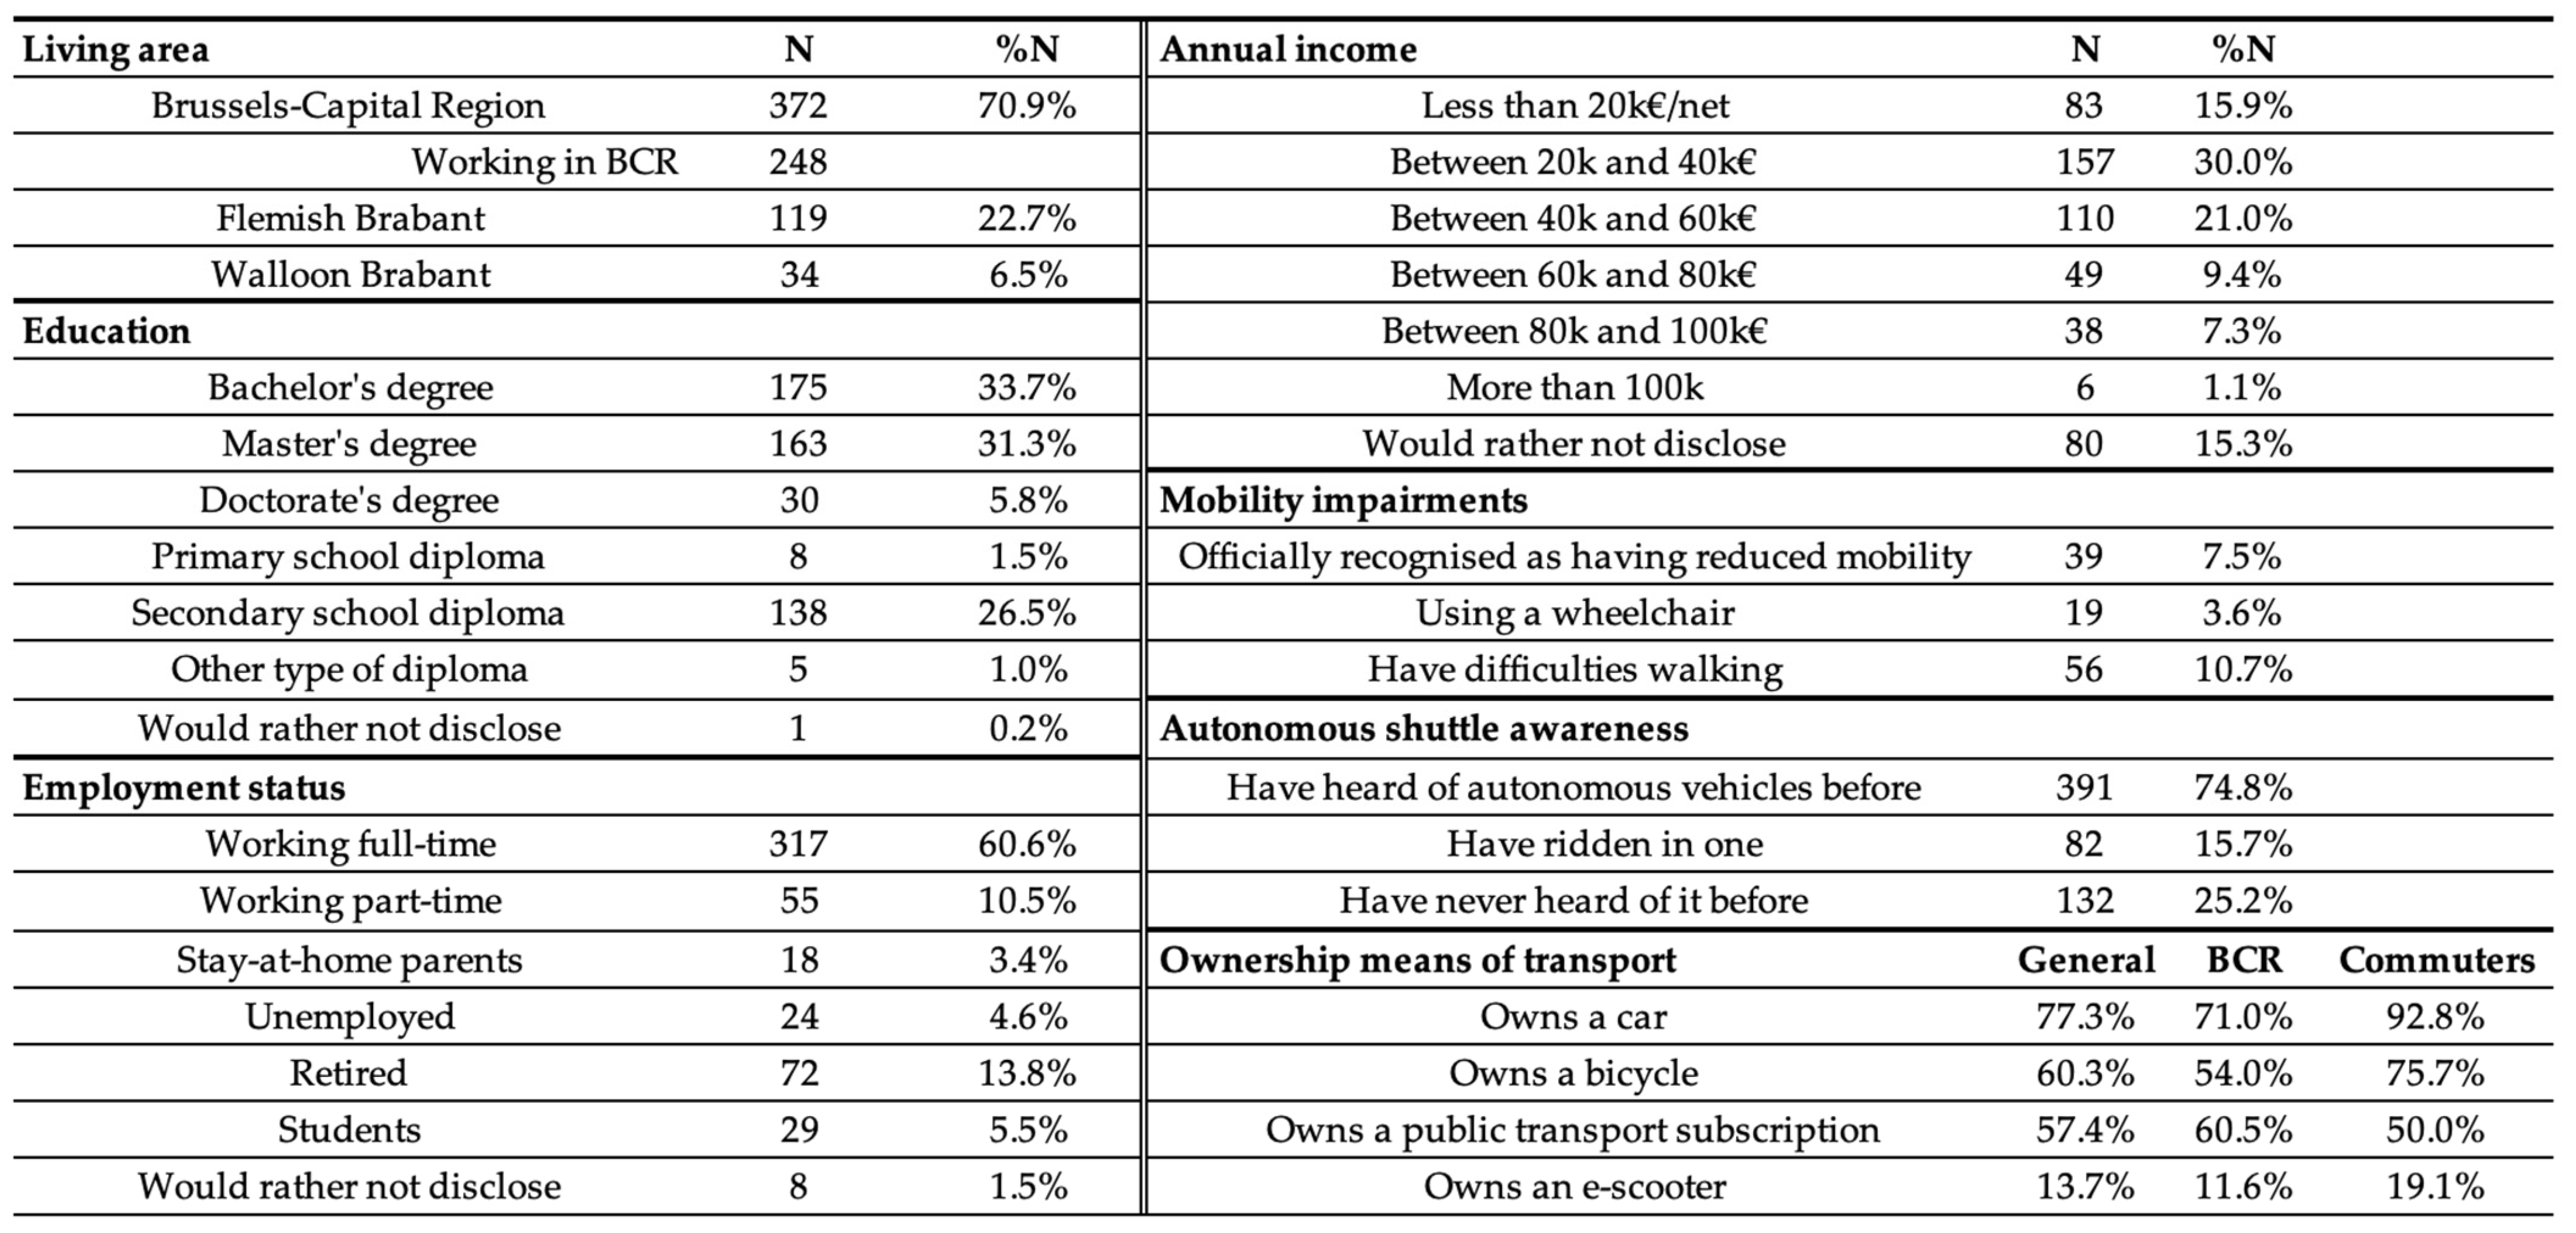
5.1. Survey Findings

A total of 524 respondents completed the survey, of which 71% were inhabitants of the Brussels Capital Region and 29% were commuters. Figure 3 shows the descriptive statistics of our sample. We can observe a good distribution in terms of gender and age, with 48% of the respondents identifying as women, 10% under 25 years old, 54% between 25 and 50 years old, and 36% aged 50 or older. Furthermore, the majority of the respondents in our sample are in possession of a university degree (71%), are employed (71%), and own a car (77%). In terms of income, the majority earns between 20 and 60k net/year (51%). Finally, 13% of our sample indicated having a mobility issue: they were either officially recognized as having reduced mobility, used a wheelchair, or had difficulties walking.
The overall attitude towards AVs among respondents was positive, with the composite factor scoring 3.64 and 3.75 on average for scenarios 1 and 2, respectively. Similarly, over two-thirds of the participants stated they probably or definitely intended to use the shuttle service. However, a considerable proportion of those showing a positive intention were not willing to pay for the service, regardless of the scenario. As shown in Figure 4, about two-thirds of those respondents indicated a willingness to pay (WTP) a maximum of EUR 1 per ride in both scenarios 1 (65%) and 2 (66%). Similarly, most would pay no more than an additional 5% over their current annual public transport subscription (70.7% and 73.9% for scenarios 1 and 2, respectively). In general, we observed no significant differences in sample means for the overall attitude, intention, and WTP scores between the scenarios, indicating that the respondents’ evaluations in these regards are not dependent on the specific service design in which the shuttle was presented. Nevertheless, it is interesting to note that average WTP was higher for the second scenario (remote parking) both per ride ( x ¯ = EUR 0.85 vs. EUR 0.91; t = −0.94) and for an annual subscription ( x ¯ = EUR 34 vs. EUR 41; t = −1.58).
As the first step in the statistical analysis of the survey responses, we report the results of the differences of the means tests for the demographics and context factors, across dependent variables and scenarios.
As shown in Table 2, the inhabitants of Brussels have a significantly more positive attitude towards AVs than commuters. To investigate the source of this difference, we conducted a differential analysis on each attitudinal belief and observed that inhabitants significantly evaluated AVs as more pleasant ( x ¯ = 3.7) and easier to use ( x ¯ = 3.9) than commuters (respectively x ¯ = 3.1; x ¯ = 3.7). We also observed that car owners have a significantly less favorable attitude than non-car owners. More specifically, car owners evaluated AVs as less pleasant ( x ¯ = 3.4) and less safe ( x ¯ = 3.4) than non-car owners (respectively x ¯ = 3.8; x ¯ = 3.8). The biggest difference was found between people who indicated being aware of AVs ( x ¯ = 3.8) and those who were not ( x ¯ = 3.3), with those aware of AVs evaluating the service as more useful, pleasant, safe, easy, and stress-free than those who were not familiar with the concept. Although we did not observe a significant difference between the general attitude of people who indicated having experienced a ride on an AV and of those who did not, we observed a significant difference in the level of perceived safety: respondents who had previously taken an AV evaluated AVs as significantly safer ( x ¯ = 4.0) as compared to respondents who had not ( x ¯ = 3.6).
As in the first scenario, awareness of AVs also significantly affected attitudes towards AVs when participants considered a hypothetical last-mile service with an autonomous shuttle after parking 15′ away from their destination (see Table 3). Again, respondents who had heard of AVs before displayed a higher level of overall attitude regarding the shuttle ( x ¯ = 3.9 vs. 3.5) for all attitudinal beliefs. However, previous experience with a shuttle did not significantly influence attitude, for both overall and across the individual beliefs. Contrary to Scenario 1, car ownership and living area were not observed to be significant factors influencing a respondent’s attitude towards AVs in this second scenario.
Next, we assessed the intention to make use of the AV service presented in the different scenarios. For both scenarios, respondents who had heard of autonomous vehicles before displayed a significantly higher intention to take the autonomous shuttle service than respondents who had never heard of it. The mean scores ( x ¯ ) of the two groups were 3.4 vs. 3.8 and 3.5 vs. 3.8 for scenarios 1 and 2, respectively. In scenario 1, having experienced a ride on an autonomous shuttle significantly amplified this effect on intention ( x ¯ = 3.8 vs. 4.1), while in the remote parking scenario, experience was not a significant factor. A respondent’s gender appears to be a significant influencing factor as well, with males displaying a higher intention to use the AV service ( x ¯ = 3.9) than females ( x ¯ = 3.6).
The WTP for the service appears to be influenced by several factors. Regarding WTP per ride, in both scenarios, we observed that the gender of the respondents and the fact that they had reduced mobility were statistically significant predictors. This was also the case for an annual subscription in the second scenario only (i.e., last-mile AVs from a remote parking lot). Respondents with reduced mobility tended to be willing to pay more for the autonomous shuttle service. More specifically, on average, they were willing to pay between EUR 1 and 1.5 extra per trip, while respondents without reduced mobility would only pay less than EUR 0.5 more in scenario 1 and EUR 0.5–1 more in scenario 2. Likewise, male respondents were willing to spend more (EUR 0.5–1 per ride, on average) than female respondents ( x ¯ ≤ EUR 0.5). Additionally, in scenario 1, car owners were significantly more willing to pay more per ride as compared to non-car owners. Lastly, in scenario 2, respondents who had already taken an AS were willing to pay more both per ride and subscription than people who were aware of AVs but had not experienced a ride on one. As an illustration, their WTP per ride is higher by an equivalent of EUR 0.35 on average ( x ¯ = 3.73 vs. 3.04, equivalent to x ¯ = EUR 1.12 vs. EUR 0.77).
Finally, the traffic condition (hospital vs. open road) did not influence a respondent’s overall evaluation of the service on either of the scenarios or on any of the studied levels (attitude, intention, WTP). Therefore, we performed the regression analysis on the combined sample.
To further investigate the relationships between respondents’ attitude, intention, WTP per ride, and WTP per annual subscription with our predictors, hierarchical multiple linear regressions were performed. However, before further analysis, we performed feature generation for non-scale variables in order to identify potential statistical influences. The variables “awareness of AVs” and “experience with AVs” were computed in a categorical variable named “familiarity” (0 = not aware; 1 = aware; 2 = aware and experienced). The variable “education” was re-coded to measure from no formal education to the highest degree (Doctorate level) in a 7-point scale. The variable “employment” was also re-coded to translate whether respondents were employed (full or part time) or not (students, unemployed, stay-at-home parents, retired).
Prior to evaluating the models, we also checked for multicollinearity and normality of the outcome. Firstly, no correlations were larger than 0.70 for both scenarios, indicating that there was no multicollinearity between the predictor variables. This was confirmed by the collinearity diagnostics, performed on SPSS, where all VIF were between 1.00 and 2.00, indicating that our predictors were only moderately correlated [86]. Secondly, some negative skewness in these sample distributions could not be remedied by any of the common transformations. Although the outcome data were not perfectly normally distributed, we continued with the interpretation of the regression results due to the argued robustness of the parametric statistics, even when working with ordinal Likert scale items [87].
Confirming the findings of the t-tests above, which suggested awareness as an influencing factor, familiarity was found to have a significant positive linear relationship with a respondent’s attitude towards AVs in scenario 1 (see Table 4). The prediction power of familiarity was maintained with regard to intention to use the AV service. In fact, compared to the results above, it was the only demographic variable that remained statistically significant when included in the regression models for attitude and intention to use in scenario 1.
We can see several different results in scenario 2 (see Table 5). While higher familiarity also significantly correlated with higher intention to use, it did not predict a respondent’s attitude towards the AV service. Furthermore, age and income determined attitude towards the AV: among our respondents, older and higher income individuals were more positive about the service. In addition, having reduced mobility was found to be a significant predictor of both attitude and intention in our study.
All attitudinal beliefs had a positive influence on the intention to use the AV shuttle, and this influence was statistically significant in at least one of the two scenarios. In both scenarios, it appears that respondent’s intention to take the shuttle was influenced by the perceived usefulness and safety of riding the AV. Similarly logical is the fact that the ride being pleasant and relaxing were only significant factors in Scenario 2, which involved longer trips. But interestingly, the ease of use only showed a statistically significant coefficient in scenario 1.
Regarding WTP, higher intention to use the AV service positively—and statistically significantly—correlated with the willingness to pay extra for it. In scenario 1, both for single rides and for a PT subscription, this effect remained statistically significant when the demographic variables in the second step of the regression were included. This was not the case, however, in scenario 2, where the intention to use was significantly correlated with WTP but lost part or all of its predictive power when all the other factors were entered into the model.
As suggested by their highly significant coefficients, age and mobility issues are strong predictors of higher willingness to pay within our sample. In both scenarios, having reduced mobility and being younger correlated with a willingness to pay extra for the autonomous shuttle service both via purchasing single rides and when purchasing a PT subscription. Additionally, in both scenarios, younger people were clearly more inclined to pay for the service even though age positively correlated with all attitudinal beliefs. Unsurprisingly, income also seemed to positively influence WTP; however, this significant effect did not hold for WTP for a subscription in scenario 1.
Finally, some significant relationships with WTP could only be observed in one of the scenarios. First, in the scenario where the shuttle covered a short 5 min walking trip, owning a car was found to have a negative (statistically significant) linear relationship with the willingness to pay more for a subscription. Overall, however, car ownership did not seem to influence WTP. Second, in the remote parking scenario, familiarity with AVs was also seen to significantly predict a higher WTP for shuttles both in terms of single trips and a subscription; however, familiarity lost its statistically significant predictive power after extending the regression model to include the rest of the independent variables.

5.2. Insights from Interviews

For the mass market adoption of AVs based on public transport and car sharing, we would need business models that customers find both convenient—in terms of waiting times, flexibility, and proximity—and are willing to pay for. The objective would be to induce a future scenario where the amount of vehicles within urban roads is reduced, replacing single-occupant car usage by more sustainable mobility modes and affordable PT services in underserved areas. In addition, business models should take into account the technological and regulatory transition from the current situation toward full automation, presenting an evolutionary approach.
Autonomous vehicles will change the value proposition and the profitability of public transport. Ride hailing with AVs can disrupt the current bus network because people will not be willing to wait for a bus if an affordable AV can pick them up with similar waiting times and more dynamic trips. Demand–supply matchmaking by AI-based platforms can promise short waiting times for on-demand rides; to avoid being substituted by ride hailing, PTOs must adapt their services to be more flexible in their routing without impairing frequency. One way is to address last-mile mobility with smaller autonomous buses that drive people closer to their doorstep. However, extending the PT network with manually driven vehicles is financially challenging: because a driver represents two-thirds of the operating expenses, improving operating margins requires adding more passengers to each bus, which in turn requires large vehicles and standard routes. Therefore, self-driving shuttles would lower the marginal cost of deploying extra routes and affordably add trips when and where it is not economically efficient at the moment, such as at night or in less densely populated areas.
The large investments involved in the acquisition of AV fleets represent a significant obstacle in a scenario where a driver is still legally required to monitor each vehicle at all times. In such a transition period, automation will bring the opportunity to adapt the nature of the driver’s job. Several tasks can add societal value to citizens, such as assisting the elderly or people with reduced mobility, enforcing that people wear masks, etc. AVs would free drivers from the active driving task so they could spend more time on the social aspect, adding value to the mobility service without the need to recruit more people. In addition, the lack of an operator on board can reduce passenger perception of safety, for instance, due to concerns over harassment [34,88].
The deployment of L4 AVs is more likely to emerge in the short or medium term since it relies on capabilities that are closer to existing ones. Geo-fenced shuttle services could be deployed in specific open road areas with relatively low traffic complexity, e.g., for less chaotic environments in terms of the presence of different road user types. Besides traffic characteristics, the decision to deploy such services would be driven by the opportunity to cover the specific mobility need and demand of each area. The specific obstacles attributed to this service are chiefly of an economic nature, revolving around the difficulty to find a financially sustainable business case. First, it is about scaling up as compared to today’s urban shuttle tests, since this model will only be commercially viable if offered in wider, more dynamic areas. In Belgium, the task of finding areas where it will be realistic to deploy AV shuttles in the coming years and where there is enough demand for the service at the same time is challenging. Nonetheless, respondents were confident that suitable areas exist in most cities, but it may be necessary to adapt infrastructure. Second, it is unclear whether the model will be scalable in rural areas with acceptable waiting times; it will be hard to find many people that want to take the same route at the same time, therefore making it challenging to combine journeys.
Based on our expert interviews, two local areas where AV shuttles could have a substantial positive impact on commuting time and accessibility to public transport were identified: (i) first, in the municipalities in the outskirts of the Brussels Capital Region, which is home to hundreds of thousands of inhabitants but are not as densely populated as the inner ones (which include the city center); (ii) second, urban areas with lower population density in Flanders that are less covered by public transport and have an older population. Similar to most of Europe’s, Flanders’s population is aging [89]. The proportion of senior citizens (>65 years old) is higher in the coastal municipalities, where in many cases the ratio is over 1 for every 4 inhabitants. This is in contrast to the inland, and especially large cities. For example, in Koksijde, Knokke-Heist, and Oostende, the percentage of seniors is 38.5, 35, and 27.8%, respectively, while in Brussels, Antwerp, and Ghent, it is below 17%.
An important practical aspect to consider rests on the design of the vehicle. For example, the models used by public transport companies in their tests from current suppliers and prototypes are small buses that can fit around ten people, including those standing up. On the type of vehicles and their design, PTOs agree: while these shuttles are too small for real-life applications, current buses are too big. The ideal would be something in the middle, with a capacity of about 15–25 people. The reasons are the following: (a) because it makes it easier to pool demand and thus increase their frequency, and (b) because of the relatively small dimension of the areas where they imagine them to be deployed in the early stages.
However, deploying such L4 AVs would not be enough to substantially change current mobility patterns. Autonomous shuttle services should be integrated within a mobility-as-a-service (MaaS) platform that seamlessly integrates multiple modes and mobility services within it, including the coordinated offering of traditional PT, ride hailing, car sharing, micro mobility, and/or last-mile delivery services.
Next, we discussed the topic of a regional business ecosystem. By consensus, the interviewed experts believe there is no active business ecosystem for AVs as of yet in Flanders nor in Belgium. While certain foundation elements are in place, an ecosystem is not yet complete nor active, as extended cooperation and commercially minded initiatives are still lacking. Notable initiatives include ITS.be, which counts around one hundred members, organizes events, and tries to foster cooperation among parties. In contrast, respondents generally believe that there is a regional ecosystem for other aspects of the broader smart mobility sector, e.g., for shared mobility or car-sharing solutions, although often consisting of silo-based developments.
A majority agreed that it is important to have a regional ecosystem, albeit for different reasons. First, because of the perceived benefits of cooperation between the government and private players. This view posits that by sharing knowledge, one can more easily build a transport system that is aligned with policy goals. Second, several experts pointed out the belief that addressing specific mobility needs of the region will be more willingly accomplished by actors with a local footprint, since they are better able to feel the problems that the cities in the region are currently facing. Third, it was argued that international market leaders are more difficult to influence with policy. Relatedly, a balanced ecosystem is believed to encourage collaboration, implying that relying on partners that have globally dominant market positions represents an obstacle for smaller players. Therefore, according to these views, a regional ecosystem would make it easier to have differentiated services that fit the local needs. Another reason was the presence of active actors in the market that generate employment and pay taxes in the region. While it was generally agreed that just reacting to the initiatives of foreign companies would be suboptimal since their local or national context (mobility patterns, culture, infrastructure, etc.) can be completely different, the importance of convincing international market leaders to join the ecosystem was stressed by several interviewees. Finally, it was argued that in order to set up geo-fenced routes for AV shuttles, service providers must work together with local partners and regulators in order to make sure that the infrastructure is in place and the right permits and legislation are obtained.
In order to build a business ecosystem that fits the regional needs of Brussels and Flanders, more involvement by the following stakeholders was deemed necessary:
  • Public authorities. While they are involved in funding, tests, and regulatory initiatives, they recognize the need to design an aligned long-term vision or action plan for CCAM, with a clear idea of the desired future to strive toward. Moreover, being actively involved in the ecosystem from an early stage is seen as important in influencing the transition towards AVs and their outcome, making sure the deployed solutions favor sustainable mobility patterns and avoid adverse consequences. On a general level, it was noted that for autonomous shuttle projects, in Belgium or elsewhere, the involvement of city and regional authorities is key, as well as the support from national or federal governments.
  • (Autonomous) vehicle manufacturers. Leading automakers could integrate the different elements in the value chain since the role of a full integrator is missing. In addition, there is the challenge of convincing international market leaders to collaborate on AV tests in the region.
  • Public transport operators (PTOs). Optimally, they should be involved in further road tests and coordinate more between themselves and with other stakeholders to share the insights from ongoing pilots in a more structured way.
  • Research institutions and users. Universities are seen as responsible for performing the tasks of generating knowledge regarding societal impact, doing or supporting tests, and generating acceptance among users, for example, via living labs where the user participates in the testing.

6. Discussion

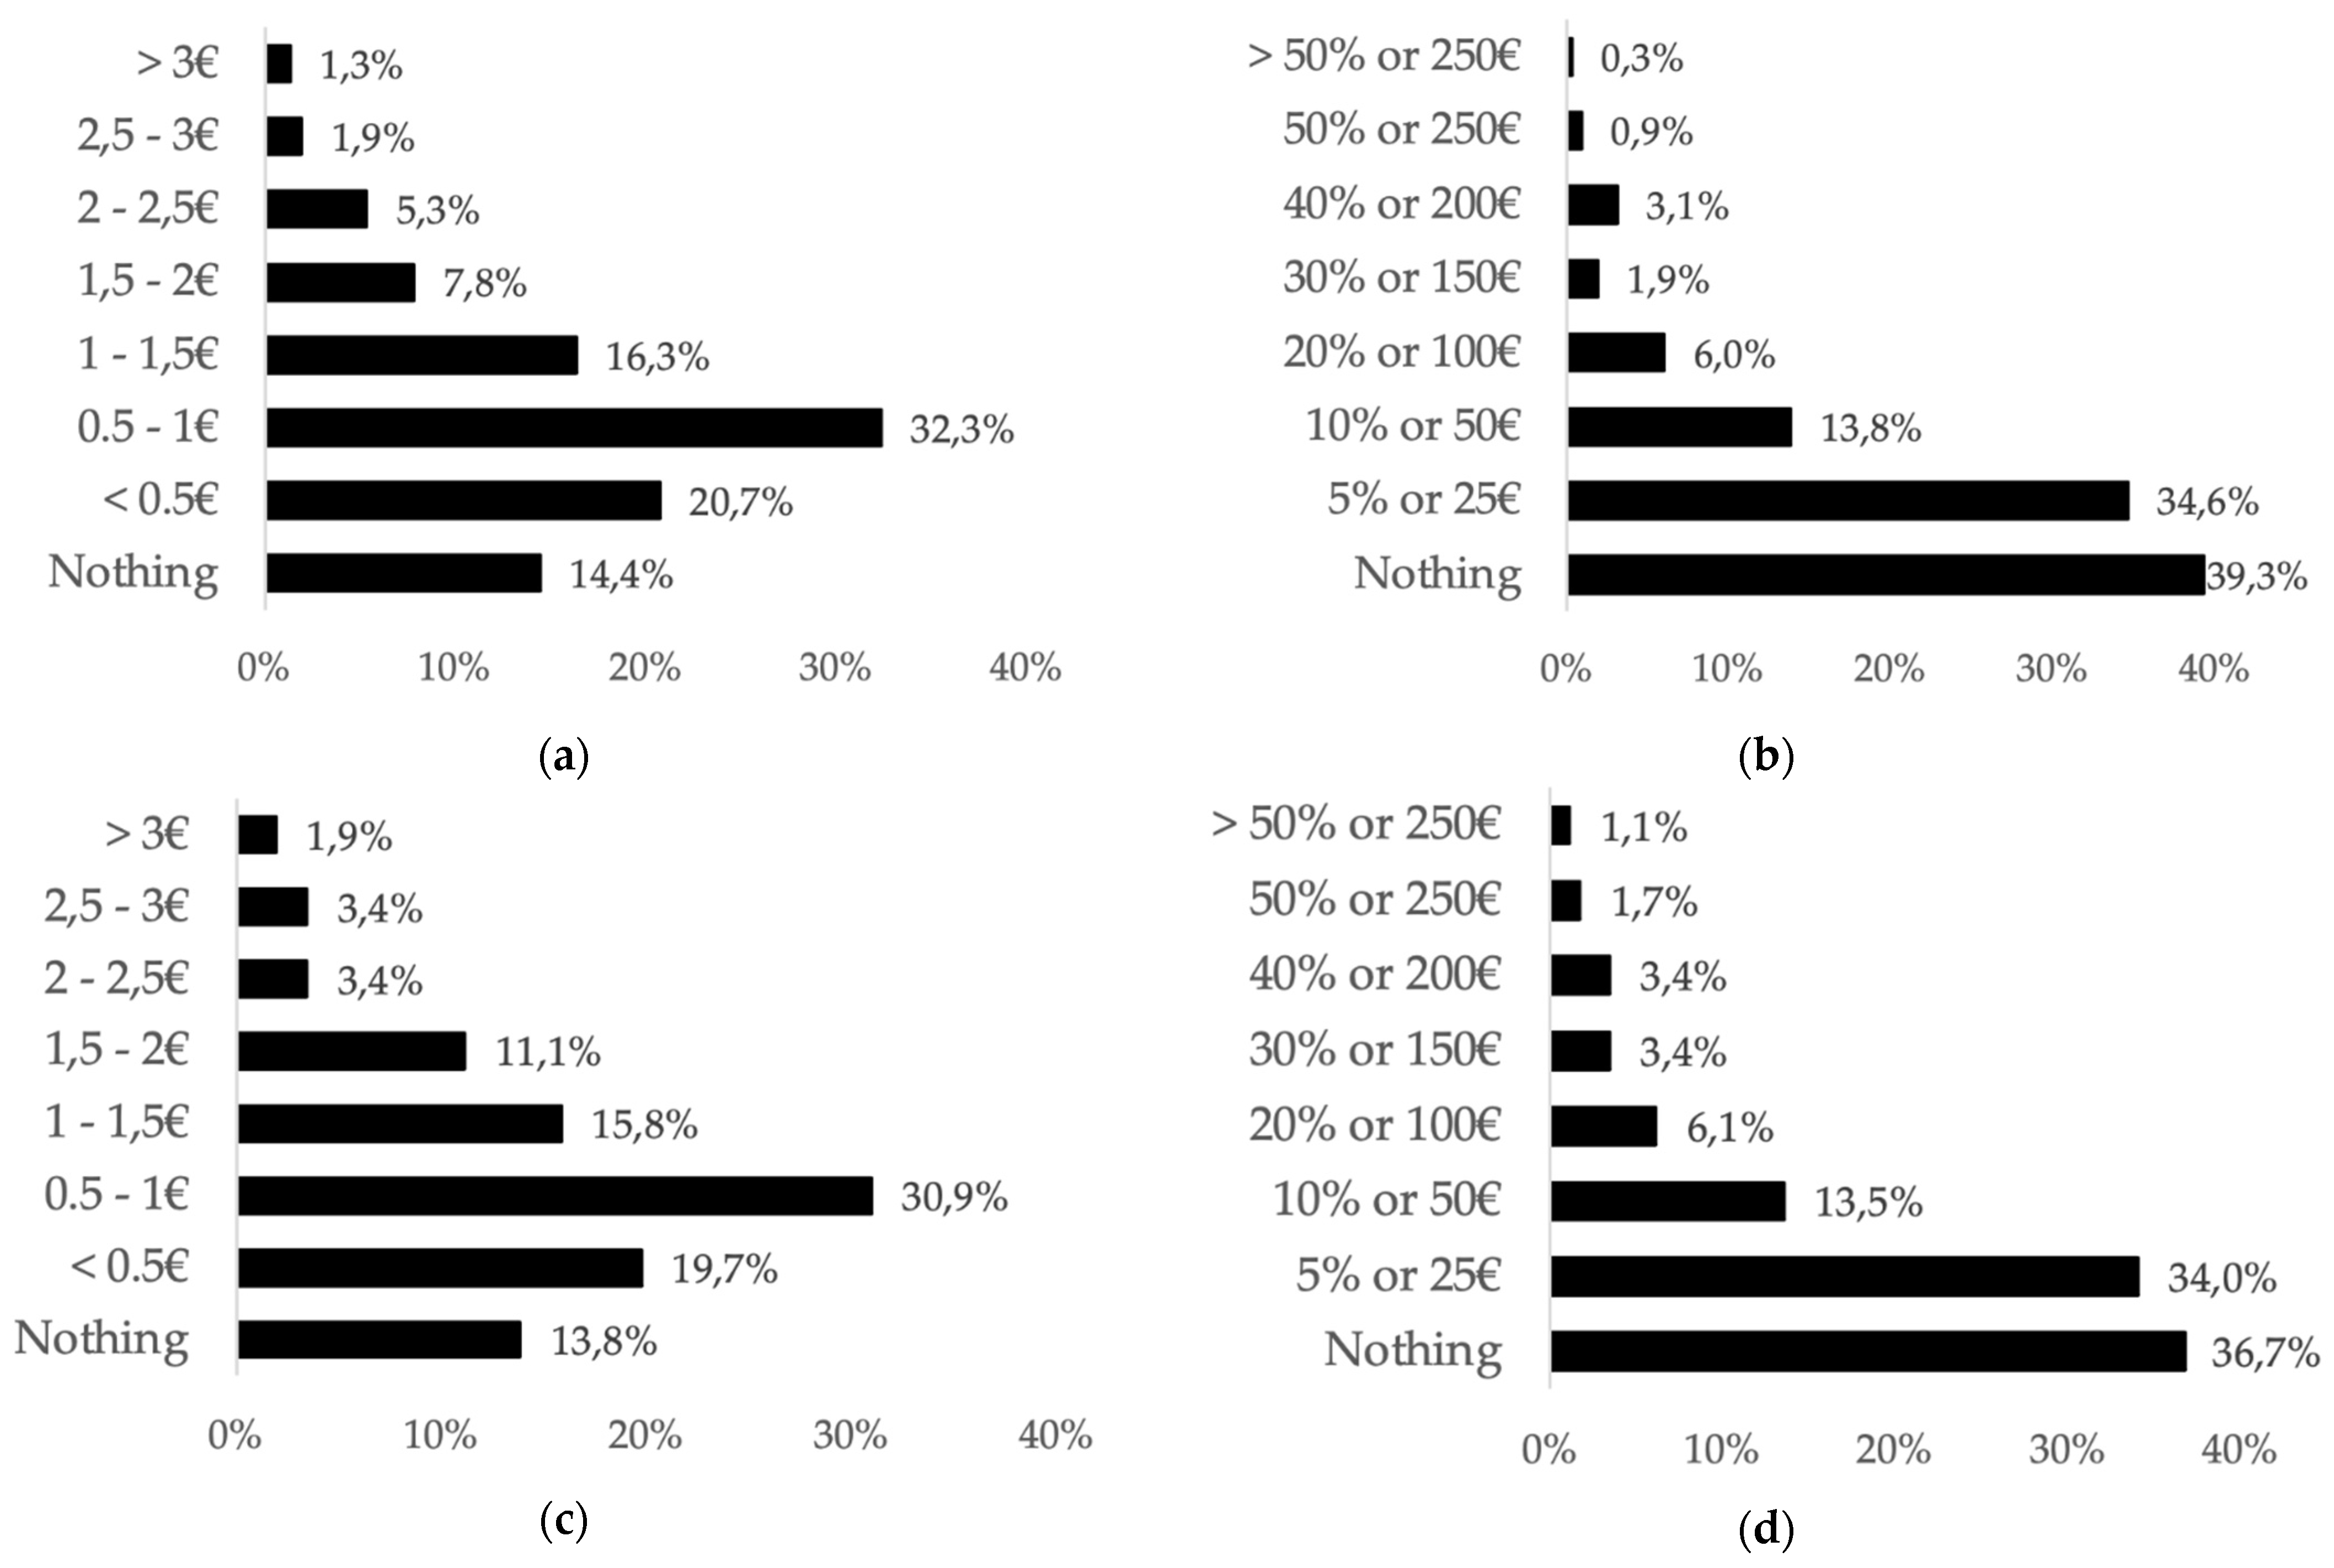
6.1. User Acceptance and Willingness to Pay

We investigate how demographic and behavioral factors affect attitudes towards AVs via a large survey of Brussels’ citizens. Previous citizen surveys have reported inconclusive results regarding the relevance and influence of several socio-demographic and mobility factors on attitude, intention to use, and willingness to pay for AVs, showing either opposite opinions (e.g., on the general willingness to pay for AV services) or discrepancies in terms of statistical significance (e.g., on age, gender, income).
In general, both scenarios were positively evaluated on the level of attitude and intention to use, with respondents perceiving the AV shuttle service as useful, pleasant, safe, easy to use, and stress-free. Similarly, in both scenarios, the majority of our sample was willing to pay extra for the last-mile AV service; however, the price per ride should not exceed EUR 1 or an additional 5% (EUR 25) on top of the annual public transport subscription in order for it to appeal to a majority of respondents.
Contrary to previous studies, perceived safety is not found to have a negative impact on the attitude towards AVs. Nevertheless, higher perceived safety does increase intention to use the AV service. Similarly, while hedonic factors (i.e., the ride being pleasant and relaxing) are found to positively influence the intention to use the AV shuttle service, which is in line with previous studies (e.g., see [34]), this was only the case for the scenario involving longer trips in our study. Overall, perceived usefulness and safety appear to be more important determinants of prospective adoption. However, attitudinal factors were not predictors of higher WTP.
In line with those studies that found age to be a significant predictor of willingness to pay (WTP), we found younger respondents to exhibit a higher WTP for the presented services. Interestingly, however, younger respondents were significantly less likely to have a positive attitude regarding one of the scenarios, and age did not significantly correlate with the intention to use AVs, in contrast to most of the reviewed studies.
Regarding gender, the present results reflect the inconclusive evidence from previous studies. While males show a significantly higher intention to use AVs than females, gender is not seen as a significant predictor of attitude nor intention in the regression models. Furthermore, while in line with those studies that found a significant link between gender and WTP, males in our sample were more willing to pay for the AV service than females, although gender was only significantly correlated with WTP in one scenario.
In line with previous studies, familiarity with AVs, proxied by an awareness of the concept and having experienced a ride in one, was strongly linked to a higher intention to use AVs as well as a positive attitude towards them. These results suggest that the more citizens are acquainted with AVs, the more likely they are to make use of this service in the future. However, familiarity only translated to a higher WTP for an autonomous shuttle service in the scenario involving a longer trip (i.e., a distance equivalent to three bus stops).
In contrast to the reviewed literature, having problems related to reduced mobility did not improve attitude and intention. Nevertheless, reduced mobility was a consistent predictor of higher WTP. To better understand this discrepancy, the subsample of citizens with reduced mobility would deserve closer attention.
Other variables such as employment, education, car ownership, and living area were not found to be robust predictors of attitude towards, WTP for, or the intention to use the AV service. Lastly, income was not found to have an effect on the intention to use an autonomous shuttle, but it did predict a higher WTP more for it.
In sum, while survey results indicate that attitudes towards AV shuttles for public transport are generally positive, average WTP is low among those intending to use the service, confirming that such last-mile services would need to be as affordable and convenient as possible.

6.2. Business Model Analysis

In the Results Section 5.2, we concluded that in order to substantially change current mobility patterns, autonomous shuttle services should be seamlessly integrated into a MaaS platform. Digital platforms are the business model of choice by aspiring leaders in the market of mobility services with AVs (i.e., autonomous system developers that test robotaxi services). However, their value proposition may not adapt to local user or policy needs beyond delivering a convenient and cheap intermediation service. In contrast, a regional MaaS platform owner could orchestrate the transformation from a knowledge ecosystem into a regional business ecosystem that yields innovative solutions adapted to local needs. Therefore, for the longer-term, where AV services can scale in terms of operations and geographical reach, we argue in favor of a MaaS platform led by a public transport operator (PTO) or jointly led by regional PTOs.
A MaaS platform is a digital space where other elements (such as mobility services, applications, etc.) can be built on top of its software. Digital platforms allow for the sale of products by third parties and have the capability to facilitate and govern economic transactions between agents on multiple sides of the market (e.g., the supply and demand sides). By facilitating transactions, platforms minimize transaction costs [90], i.e., frictions that entail costs to overcome. For example, they do so by developing a billing system for small payments [91] or by reducing the effort required to search for and find suppliers. This allows platforms to eliminate intermediaries and subsequently pass the cost savings to customers.
For end users of mobility services, having more providers join a platform will increase the convenience of being able to find a service or nearby vehicle faster. Due to the presence of indirect network effects—i.e., the additional utility that end users derive from a mobility service due to a higher number of suppliers joining the market—a platform’s value increases with its network’s size and gives way to economies of scale. Therefore, platform competition tends to end with one firm completely dominating the market, which is referred to as “tipping” or the winner-takes-all dynamics [90].
However, a market may sustain a stable competition among multiple networks if there is enough room for differentiation in terms of user needs [92]. In the case of mobility services such as ride hailing, local players can have a competitive advantage from their ability to adapt to the distinct transport needs of local users [93]. Due to cultural and environmental aspects, including citizen trust perceptions regarding AVs, the value of local customization can overpower the value of network effects alone.
The main motivation for a PTO to control a MaaS platform would be to influence mobility habits in a way that fits policy goals, such as by encouraging environmentally friendly transportation and improving accessibility to mobility services. Being an input in a third-party MaaS platform runs the risk of the unintended effects taking over, as the demand for one-stop shop digital apps makes multi-platform competition difficult. Moreover, dominant MaaS platforms can be a barrier that keeps new and small players from emerging, with the risk that products for specific niches or mobility modes are integrated into the portfolio of such large platforms. To incentivize the emergence of innovative and sustainable solutions, the PTO-led platform could give them access to the platform and visibility. As such, the PTO(s) would be orchestrating the new ecosystem, acting as a key node in the overall (urban) mobility system.
However, many decisions remain open about the way to build such a platform. Actions may rely more on public or private entities (or in partnerships between the two), depending on the ambition and capabilities of the PTO. We identify the following business model options:
  • Regarding deployment of AV shuttles, manufacturers and local shuttle leasing providers could not only supply the technology to PTOs but also cooperate with them for deployment. In the likely case of PTOs owning the AV fleets, the provision of other value chain services related to fleet management—including the remote driving of vehicles to a depot or the cleaning and overall maintenance of the vehicles—could either be performed by the PTO itself or by a third party service provider.
  • For other services (e.g., car sharing), it could be that the MaaS platform facilitates match-making between the vehicles of third-party owners (e.g., automakers or current mobility service providers) and potential passengers, or that it just enables the discovery of third-party AV services. Similarly, the billing may be performed by a third party such as a financial services provider, enabling payment for a private mobility service through the app via an API.
Our interviews suggest that a big challenge for the PTOs will be the development of capabilities to build a MaaS platform, for which it would have to cooperate with software development firms. The operation of the digital platform means operating the system, controlling the interface with its network of users, setting (surge) prices, etc. The current capabilities and dominant market position of ride-hailing platforms represent a competitive advantage for other AV-based services. However, the large user networks of PTOs, their understanding of the distinct local mobility needs, and their public financial backing would ease user adoption if a competitive platform were developed. In addition, relying on third parties for the aforementioned options would help scale operations more quickly, which would have a reinforcing effect on the overall usage and thus the societal impact of AVs in the region.

6.3. Policy Recommendations

The expert interviews also allowed us to identify specific policy actions to complement business models in order to yield a positive societal impact for AVs. With this goal in mind, we describe a series of recommendations to address the potential adverse effects of AVs and the identified challenges to adoption.
Public entities can foster the development of a regional business ecosystem that helps speed up the adoption of AV technology as well as encourage the involvement of the “missing” key stakeholders. They can do so in several ways. First, by adopting value chain roles that private parties may not undertake at an early stage if they do not see a clear business case. This can be in the form of digital platforms for public data sharing; for instance, the Mobilidata program has the goal of integrating mobility data from multiple sources and making them interoperable and openly accessible, in real time, to mobility solutions providers and road users. Second, by leading or supporting road tests of AV shuttles, which are expected to clarify business opportunities. This is seen as key to incentivizing the leading global tech and automotive players to test and deploy their innovative projects in the region. Such pilot projects can attract lead users, i.e., industry leaders that can become initial customers of local ventures and test and improve their prototypes as well as their own commercial solutions. Third, public agencies can provide tools that help establish networks of partners, encouraging the connection of established mobility providers and early stage investors to young ventures. Lastly, by orchestrating a MaaS platform, PTOs can become anchor tenants and establish public–private partnerships with regional and international ventures, incorporating their services into the platform and offering them a quick exposure to end users; hence, also facilitating the adoption of innovative mobility solutions.
At an initial stage where alternative AV-based mobility services emerge and having safety drivers on board is no longer mandatory, public funding would be important in the promotion of shuttle services with an assistant driver in order to guarantee a smooth transition in the labor market. Otherwise, the social cost of substituting drivers may counterbalance the increase in operating margins. Additionally, assistance tasks would add value to the new shuttle service until citizens are fully familiar with it.
Furthermore, to reduce the amount of cars within cities and roads and to improve traffic efficiency, certain policy decisions can steer the desired change by improving the relative competitiveness of public transport. Using pricing as a tool, for instance, via levying taxes, they can incentivize the adoption of AVs for public transport by making them more affordable vis-à-vis individual ride-hailing services. An example would be a pricing system that charges for the empty kilometers driven by AVs in cities, similar to congestion charges. Another type of measure is to set restrictions for cars in urban environments. However, stricter measures such as banning cars from city centers entail the risk of severely affecting economic activity in these areas so long as there is no convenient alternative.
Another aspect is regulating the artificial intelligence-based systems underlying autonomous vehicles, travel planning apps, and MaaS platforms. There is the risk that the rules incorporated in such algorithms negatively influence the mobility behavior of people through their decisions and suggestions. For instance, if recommending a single ride-hailing service appears more profitable than a more sustainable mode, it is more likely that the app will do so. If the algorithms and recommendation engines are solely based on a rider’s convenience (e.g., on the distance or duration of a trip), they may take or advise suboptimal routes without considering other policy preferences such as traffic flow in certain neighborhoods. In addition, demand-based surge pricing may affect inclusion and accessibility to transport since certain neighborhoods will have a higher willingness to pay and consequently attract a higher supply of mobility solutions than others. Policymakers must influence MaaS algorithms so they incorporate a hierarchy that takes the impact on the local environment into account, thus enforcing mobility management through these algorithms. This hierarchy would need to find a balance between contributing to an efficient transport system and to user experience; if a tool ignores the latter and simply pushes the most socially beneficial option when it may be more convenient for people to take their own car, the platform’s market adoption will suffer.
Finally, authorities must encourage the testing of autonomous vehicles. Citizen political acceptance will also depend on perceived safety. Single, outlier events such as a fatal crash can quickly lead to polarized opinions; on the other hand, as more empirical information becomes available and familiarity with the topic consequently increases, public perceptions can be expected to improve, as suggested by our findings. Survey results provided evidence for the effect of familiarity on potential adoption, suggesting that awareness and experience can increase the willingness to use AV shuttle services by citizens. Therefore, public trials are important in raising awareness among end users, helping to reduce misjudged perceptions on safety and lack of trust.
To support the right testing strategy, authorities should first develop a strategic vision regarding the role of AVs in the region. Second, testing should include various AV-based scenarios (passenger transport and logistics, day and night-time, etc.) in order to inform the long-term planning of AV implementation by identifying their social impacts as well as shedding light on the infrastructure requirements. Third, national-level agreements regarding testing conditions among PTOs across Belgium would ease the process for service providers, who will not need to negotiate with each city separately. Relatedly, making test data open can be even more efficient in fostering relationships and collective learning. Lastly, using a Living Lab approach in the testing process would allow for the design of trajectories with all stakeholders based on the mobility challenges within the area. Paying attention to the reactions of other road users, such as drivers, pedestrians, and cyclists, as they interact with AVs would help authorities to design appropriate traffic rules.

7. Conclusions

The societal and environmental impact of autonomous vehicles will depend on whether they are used for private instead of collective use. While AVs promise to bring environmental, safety, and economic benefits as well as increase accessibility to mobility services, there exist potential adverse effects from mobility becoming more accessible. Since self-driving will make private car rides more productive and entertaining as well as make ride-hailing more affordable, this can result, ceteris paribus, in induced demand for long single-occupant trips and empty self-parking rides, thereby increasing total distances traveled by vehicles, congestion, and energy consumption. In addition, AVs can indirectly lead to job losses among professional drivers.
Addressing these issues does not only hinge on policy decisions that incentivize sustainable mobility behaviors, but also on identifying those factors that represent challenges to adoption in each single region, as well as on adopting appropriate business models. Therefore, this multidisciplinary study provided insights into citizen opinions and a business model analysis together with policy recommendations, with the goal of helping foster a timely adoption of AVs that would also generate a positive societal impact on Belgium. We focused on the use case of autonomous shuttle services complementing public transport for the last mile.
The contribution of the present study is multifold. First, our study extended the extant literature and aimed at bringing clarity to the contended effects of the factors affecting the adoption of AVs through a large survey of respondents from the Brussels region, providing an understanding of the local public attitudes regarding autonomous shuttles among inhabitants and commuters. Second, we took a comprehensive approach: following a review of both the potential advantages and disadvantages of AVs as well as challenges to adoption, the survey considered the shuttle service in two different scenarios, two traffic conditions, and two WTP categories, and was complemented by expert interviews with a diverse set of relevant stakeholders. Third, we aimed to provide applicable, practical recommendations at the local level, with the aim of helping to ensure the adoption of the technology in the specific, studied local context, according to its mobility and policy needs.
On average, our sample of surveyed citizens showed a positive acceptance of the last-mile autonomous shuttle service, albeit with a limited willingness to pay extra for it. Several attitudinal factors affected the intention to use, but overall were not predictors of higher WTP. The effect of most socio-demographic factors, especially when compared with the reviewed literature, remains inconclusive. For instance, younger respondents exhibited a higher WTP, but the same effect was not found for attitude nor intention to use AVs. Similarly, gender was not a robust predictor of attitude, intention, nor WTP across scenarios. Familiarity with AVs was the most consistent predictor of user acceptance, being linked with higher attitude, intention to use, and WTP, although the latter case was only true for the scenario involving a longer trip.
Autonomous shuttles can improve current transit services by making it cost-efficient to increase the frequency and accessibility of PT at night or in less densely populated areas. However, for AVs to improve traffic efficiency around urban areas, it is paramount to avoid the substitution of PT by alternative mobility behaviors relying on single-occupant trips. This requires making public transport more affordable and available, hence more attractive, to end users. In addition, this requires finding areas where traffic complexity will make it technically and economically feasible to deploy AVs in the coming years, which is also challenging in Belgium. To this end, we presented an evolutionary business model approach for the transition period until shuttles could fully move autonomously in dense urban environments. As a next step to the current pilot sites of autonomous shuttles, which often happens in closed roads or separated lanes, two types of areas in Belgium were identified where AVs for PT could have a substantial positive impact on commuting time and accessibility to mobility services: city outskirts and small urban areas with an older population. For the longer term, a PTO-led MaaS platform would be the appropriate business model to (i) sufficiently influence mobility patterns and habits in a way that encourages environmentally friendly transportation and improves accessibility to mobility services; (ii) encourage the emergence and adoption of sustainable, innovative services; and (iii) scale the operations of PT shuttles while increasing their value proposition by allowing for the enhancement of flexibility. While developing a MaaS platform would be challenging for PTOs, their established user networks and a superior understanding of the local needs can provide them with a competitive advantage.
To foster the adoption of AVs and enable the preferred business models, there will also need to be a more mature business ecosystem, both to extend the networks of partners required to scale current shuttle deployments as well as to ensure that the different solutions to be incorporated into the platform become available in the market. While a business ecosystem can help generate and capture value in a region and ensure that the translation from knowledge to product or service innovation is adapted to local needs, there is currently no active business ecosystem for AVs in Belgium. Since the role of policymakers is key in fostering the emergence of a regional business ecosystem, we discussed the strategic options available to them. These include (i) adopting bottleneck value chain roles such as setting up data sharing platforms, (ii) supporting road tests of AV shuttles, and (iii) providing tools to facilitate and encourage cooperation among established mobility providers, investors, and start-ups. Finally, we also provided other policy recommendations to complement business models in order to yield a positive societal impact for AVs in the region.
To conclude, we will now discuss the limitations of the present study and provide suggestions for further research. Online survey results must be taken with precaution when assessing citizens’ acceptance of technology in a real-life situation. Although intention has been proven to be a strong predictor of actual behavior, there still remains a gap between self-reported intention and actual behavior [94]. Given the novelty of the scenario presented, novelty-seeking must also be taken into account as a potential positive influence on the self-reported attitude and intention of participants [95]. Furthermore, positive emotions tend to be over-evaluated by participants in scenario experiments compared to real-life settings, while negative emotions tend to be under-evaluated [81]. In addition, although the present paper considered multiple perspectives, the wide implementation of AVs is truly a multidisciplinary challenge. The presented set of policy recommendations would benefit from being expanded by insights related to traffic modeling and management and infrastructure planning. Such learnings could come from surveys linked to projects that test AVs in more open and complex traffic conditions.

Author Contributions

Conceptualization, P.C.-A.; methodology, P.C and L.T.; validation, P.C.-A. and L.T.; formal analysis, L.T.; investigation, P.C.-A. and L.T.; data curation, L.T.; writing—original draft preparation, P.C.-A. and L.T.; writing—review and editing, P.C.-A., L.T., W.V. and S.D.; visualization, P.C.-A. and L.T.; funding acquisition, P.C.-A., W.V. and S.D. All authors have read and agreed to the published version of the manuscript.

Funding

This research was funded by VLAIO in the context of the Flemish “Smart Highway” project, by the European Commission in the context of the “5G-Blueprint” project, and by Innoviris in the context of the “Automated Shuttle Service for the Brussels Health Campus” project.

Institutional Review Board Statement

Ethical review and approval were exempted for this study due to no foreseeable risk of harm or discomfort to participants.

Informed Consent Statement

Informed consent was obtained from all participants involved in the study.

Data Availability Statement

The data presented in this study are not publicly available in full due to confidentiality restrictions. Those data not subject to privacy restrictions are openly available on Zenodo at https://zenodo.org/record/5834886#.YeFDntozaUk (accessed on 14 December 2021).

Conflicts of Interest

The authors declare no conflict of interest.

References

  1. European Commission. Saving Lives: Boosting car safety in the EU. Report from the Commission to the European Parliament and the Council. 2016. Available online: https://eur-lex.europa.eu/legal-content/EN/TXT/?uri=CELEX%3A52016DC0787 (accessed on 14 December 2021).
  2. INRIX. INRIX 2021 Global Traffic Scorecard, Inrix. Available online: https://inrix.com/scorecard/ (accessed on 17 December 2021).
  3. TomTom. Brussels Traffic Report | TomTom Traffic Index. Available online: https://www.tomtom.com/en_gb/traffic-index/brussels-traffic/ (accessed on 17 December 2021).
  4. MORA. Mobiliteitsverslag 2018. Mobility as a Service: Het Hinterlandvervoer en de Bereikbaarheid van de Economische Poorten. 2018. Available online: https://www.mobiliteitsraad.be/mora/publicatie/mobiliteitsverslag-2018 (accessed on 14 December 2021).
  5. WHO. Global Status Report on Road Safety 2018, France. 2018. Available online: https://www.who.int/publications-detail-redirect/9789241565684 (accessed on 14 December 2021).
  6. UNECE. Statistics of Road Traffic Accidents in Europe and North America; UN: New York, NY, USA, 2019; Volume LV. [Google Scholar] [CrossRef]
  7. Rayle, L.; Dai, D.; Chan, N.; Cervero, R.; Shaheen, S. Just a better taxi? A survey-based comparison of taxis, transit, and ridesourcing services in San Francisco. Transp. Policy 2016, 45, 168–178. [Google Scholar] [CrossRef] [Green Version]
  8. Castiglione, J.; Chang, T.; Cooper, D.; Hobson, J.; Logan, W.; Young, E.; Charlton, B.; Wilson, C.; Mislove, A.; Chen, L.; et al. TNCs today: A profile of San Francisco transportation network company activity. San Franc. Cty. Transp. Auth. June 2016, 2017, 21. [Google Scholar]
  9. OECD. Urban Mobility System Upgrade: How Shared Self-Driving Cars Could Change City Traffic, Paris, France. 2015. Available online: https://doi.org/10.1787/5jlwvzdk29g5-en (accessed on 14 December 2021).
  10. SAE International. Surface Vehicle Recommended Practice J3016: Taxonomy and Definitions for Terms Related to Driving Automation Systems for On-Road Motor Vehicles; SAE International: Warrendale, PA, USA, 2018; Available online: https://www.sae.org/standards/content/j3016_201806/ (accessed on 14 December 2021).
  11. Pol Camps-Aragó and Wim Vanobberghen. Policy Brief #46: Autonomous Vehicles in Urban Settings. Recommendations to Encourage Testing and Societally Beneficial Deployment. SMIT. 6 May 2021. Available online: https://smit.vub.ac.be/policy-brief-46-autonomous-vehicles-in-urban-settings-recommendations-to-encourage-testing-and-societally-beneficial-deployment (accessed on 15 December 2021).
  12. Derauw, S.; Gelaes, S.; Pauwels, C. Enquête Monitor over de mobiliteit van de Belgen; Federale Overheidsdienst Mobiliteit en Vervoer: Brussels, Belgium, 2019.
  13. Gandia, R.M.; Antonialli, F.; Cavazza, B.H.; Neto, A.M.; de Lima, D.A.; Sugano, J.Y.; Nicolai, I.; Zambalde, A.L. Autonomous vehicles: Scientometric and bibliometric review. Transp. Rev. 2019, 39, 9–28. [Google Scholar] [CrossRef]
  14. Faisal, A.; Yigitcanlar, T.; Kamruzzaman, M.; Paz, A. Mapping Two Decades of Autonomous Vehicle Research: A Systematic Scientometric Analysis. J. Urban Technol. 2021, 28, 45–74. [Google Scholar] [CrossRef]
  15. Brown, A.; Gonder, J.; Repac, B. An Analysis of Possible Energy Impacts of Automated Vehicles. In Road Vehicle Automation; Meyer, G., Beiker, S., Eds.; Springer International Publishing: Cham, Switzerland, 2014; pp. 137–153. [Google Scholar] [CrossRef]
  16. Spieser, K.; Treleaven, K.; Zhang, R.; Frazzoli, E.; Morton, D.; Pavone, M. Toward a Systematic Approach to the Design and Evaluation of Automated Mobility-on-Demand Systems: A Case Study in Singapore. In Road Vehicle Automation; Meyer, G., Beiker, S., Eds.; Springer International Publishing: Cham, Switzerland, 2014; pp. 229–245. [Google Scholar] [CrossRef] [Green Version]
  17. Fagnant, D.J.; Kockelman, K. Preparing a nation for autonomous vehicles: Opportunities, barriers and policy recommendations. Transp. Res. Part Policy Pract. 2015, 77, 167–181. [Google Scholar] [CrossRef]
  18. Taiebat, M.; Brown, A.L.; Safford, H.R.; Qu, S.; Xu, M. A Review on Energy, Environmental, and Sustainability Implications of Connected and Automated Vehicles. Environ. Sci. Technol. 2018, 52, 11449–11465. [Google Scholar] [CrossRef] [PubMed]
  19. Kopelias, P.; Demiridi, E.; Vogiatzis, K.; Skabardonis, A.; Zafiropoulou, V. Connected & autonomous vehicles—Environmental impacts—A review. Sci. Total Environ. 2020, 712, 135237. [Google Scholar] [CrossRef]
  20. Hartmann, M.; Motamedidehkordi, N.; Krause, S.; Hoffmann, S.; Vortisch, P.; Busch, F. Impact of Automated Vehicles on Capacity of the German Freeway Network; ERTICO: Montreal, QC, Canada, 2017. [Google Scholar]
  21. Greenblatt, J.B.; Saxena, S. Autonomous taxis could greatly reduce greenhouse-gas emissions of US light-duty vehicles. Nat. Clim. Change 2015, 5, 860–863. [Google Scholar] [CrossRef]
  22. Nunes, A.; Reimer, B.; Coughlin, J.F. People must retain control of autonomous vehicles. Nature 2018, 556, 169–171. [Google Scholar] [CrossRef] [Green Version]
  23. Ainsalu, J.; Arffman, V.; Bellone, M.; Ellner, M.; Haapamäki, T.; Haavisto, N.; Josefson, E.; Ismailogullari, A.; Lee, B.; Madland, O.; et al. State of the Art of Automated Buses. Sustainability 2018, 10, 3118. [Google Scholar] [CrossRef]
  24. Bischoff, J.; Maciejewski, M. Simulation of City-wide Replacement of Private Cars with Autonomous Taxis in Berlin. Procedia Comput. Sci. 2016, 83, 237–244. [Google Scholar] [CrossRef] [Green Version]
  25. Singh, S. Critical Reasons for Crashes Investigated in the National Motor Vehicle Crash Causation Survey. Traffic Saf. Facts Crash Stats 2015, 2, 1–2. [Google Scholar]
  26. Dingus, T.A.; Guo, F.; Lee, S.; Antin, J.F.; Perez, M.; Buchanan-King, M.; Hankey, J. Driver crash risk factors and prevalence evaluation using naturalistic driving data. Proc. Natl. Acad. Sci. USA 2016, 113, 2636–2641. [Google Scholar] [CrossRef] [PubMed] [Green Version]
  27. Wijnen, W.; Stipdonk, H. Social costs of road crashes: An international analysis. Accid. Anal. Prev. 2016, 94, 97–106. [Google Scholar] [CrossRef]
  28. Ostermeijer, F.; Koster, H.R.A.; van Ommeren, J. Residential parking costs and car ownership: Implications for parking policy and automated vehicles. Reg. Sci. Urban Econ. 2019, 77, 276–288. [Google Scholar] [CrossRef] [Green Version]
  29. Andersson, P.; Ivehammar, P. Benefits and costs of autonomous trucks and cars. J. Transp. Technol. 2019, 9, 2. Available online: http://urn.kb.se/resolve?urn=urn:nbn:se:liu:diva-163735 (accessed on 14 December 2021). [CrossRef] [Green Version]
  30. Walnum, H.J.; Aall, C.; Løkke, S. Can Rebound Effects Explain Why Sustainable Mobility Has Not Been Achieved? Sustainability 2014, 6, 9510. [Google Scholar] [CrossRef] [Green Version]
  31. Gehrke, S.R.; Felix, A.; Reardon, T.G. Substitution of Ride-Hailing Services for More Sustainable Travel Options in the Greater Boston Region. Transp. Res. Rec. 2019, 2673, 438–446. [Google Scholar] [CrossRef]
  32. Clewlow, R.R.; Mishra, G.S. Disruptive Transportation: The Adoption, Utilization, and Impacts of Ride-Hailing in the United States. October 2017. Available online: https://escholarship.org/uc/item/82w2z91j (accessed on 14 December 2021).
  33. KPMG International. 2020 Autonomous Vehicles Readiness Index. 2020. Available online: https://assets.kpmg/content/dam/kpmg/xx/pdf/2020/07/2020-autonomous-vehicles-readiness-index.pdf (accessed on 14 December 2021).
  34. Feys, M.; Rombaut, E.; Vanhaverbeke, L. Experience and Acceptance of Autonomous Shuttles in the Brussels Capital Region. Sustainability 2020, 12, 8403. [Google Scholar] [CrossRef]
  35. Taub, E.A. How Jaywalking Could Jam Up the Era of Self-Driving Cars National Center for Statistics and Analysis. New York Times, 7 August 2019. [Google Scholar]
  36. Pigeon, C.; Alauzet, A.; Paire-Ficout, L. Factors of acceptability, acceptance and usage for non-rail autonomous public transport vehicles: A systematic literature review. Transp. Res. Part F Traffic Psychol. Behav. 2021, 81, 251–270. [Google Scholar] [CrossRef]
  37. Krueger, R.; Rashidi, T.H.; Rose, J.M. Preferences for shared autonomous vehicles. Transp. Res. Part C Emerg. Technol. 2016, 69, 343–355. [Google Scholar] [CrossRef]
  38. Asgari, H.; Jin, X. Incorporating Attitudinal Factors to Examine Adoption of and Willingness to Pay for Autonomous Vehicles. Transp. Res. Rec. 2019, 2673, 418–429. [Google Scholar] [CrossRef]
  39. Cartenì, A. The acceptability value of autonomous vehicles: A quantitative analysis of the willingness to pay for shared autonomous vehicles (SAVs) mobility services. Transp. Res. Interdiscip. Perspect. 2020, 8, 100224. [Google Scholar] [CrossRef]
  40. Bansal, P.; Daziano, R.A. Influence of choice experiment designs on eliciting preferences for autonomous vehicles. Transp. Res. Procedia 2018, 32, 474–481. [Google Scholar] [CrossRef]
  41. Schoettle, B.; Sivak, M. A survey of public opinion about autonomous and self-driving vehicles in the U.S., the U.K., and Australia. University of Michigan, Ann Arbor, Transportation Research Institute, Technical Report. July 2014. Available online:http://deepblue.lib.umich.edu/handle/2027.42/108384 (accessed on 14 December 2021).
  42. Bansal, P.; Kockelman, K.M. Are we ready to embrace connected and self-driving vehicles? A case study of Texans. Transportation 2018, 45, 641–675. [Google Scholar] [CrossRef]
  43. Liu, P.; Guo, Q.; Ren, F.; Wang, L.; Xu, Z. Willingness to pay for self-driving vehicles: Influences of demographic and psychological factors. Transp. Res. Part C Emerg. Technol. 2019, 100, 306–317. [Google Scholar] [CrossRef]
  44. Alessandrini, A.; Alfonsi, R.; Site, P.D.; Stam, D. Users’ Preferences towards Automated Road Public Transport: Results from European Surveys. Transp. Res. Procedia 2014, 3, 139–144. [Google Scholar] [CrossRef] [Green Version]
  45. Herrenkind, B.; Brendel, A.B.; Nastjuk, I.; Greve, M.; Kolbe, L.M. Investigating end-user acceptance of autonomous electric buses to accelerate diffusion. Transp. Res. Part Transp. Environ. 2019, 74, 255–276. [Google Scholar] [CrossRef]
  46. Papadima, G.; Genitsaris, E.; Karagiotas, I.; Naniopoulos, A.; Nalmpantis, D. Investigation of acceptance of driverless buses in the city of Trikala and optimization of the service using Conjoint Analysis. Util. Policy 2020, 62, 100994. [Google Scholar] [CrossRef]
  47. Portouli, E.; Karaseitanidis, G.; Lytrivis, P.; Amditis, A.; Raptis, O.; Karaberi, C. Public attitudes towards autonomous mini buses operating in real conditions in a Hellenic city. In Proceedings of the 2017 IEEE Intelligent Vehicles Symposium (IV), Los Angeles, CA, USA, 11–14 June 2017; pp. 571–576. [Google Scholar] [CrossRef]
  48. Medina, K.F.; Jenkins, R. GATEway: Public Perceptions of a Last-Mile Driverless Shuttle. 2017. Available online: https://gateway-project.org.uk/wp-content/uploads/2018/06/D3.7_TRL-Workshop-Findings-Report (accessed on 14 December 2021).
  49. Dong, X.; DiScenna, M.; Guerra, E. Transit user perceptions of driverless buses. Transportation 2019, 46, 35–50. [Google Scholar] [CrossRef]
  50. Lee, Y.-C.; Mirman, J.H. Parents’ perspectives on using autonomous vehicles to enhance children’s mobility. Transp. Res. Part C Emerg. Technol. 2018, 96, 415–431. [Google Scholar] [CrossRef]
  51. Schoettle, B.; Sivak, M. Public opinion about self-driving vehicles in China, India, Japan, the U.S., the U.K., and Australia, University of Michigan, Ann Arbor, Transportation Research Institute, Technical Report. October 2014. Available online: http://deepblue.lib.umich.edu/handle/2027.42/109433 (accessed on 14 December 2021).
  52. Kyriakidis, M.; Happee, R.; de Winter, J.C.F. Public opinion on automated driving: Results of an international questionnaire among 5000 respondents. Transp. Res. Part F Traffic Psychol. Behav. 2015, 32, 127–140. [Google Scholar] [CrossRef]
  53. Roche-Cerasi, I. Public acceptance of driverless shuttles in Norway. Transp. Res. Part F Traffic Psychol. Behav. 2019, 66, 162–183. [Google Scholar] [CrossRef]
  54. Salonen, A.O. Passenger’s subjective traffic safety, in-vehicle security and emergency management in the driverless shuttle bus in Finland. Transp. Policy 2018, 61, 106–110. [Google Scholar] [CrossRef]
  55. Dekker, M.J. Riding a Self-Driving Bus to Work: Investigating How Travellers Perceive ADS-DVs on the Last Mile. 2017. Available online: https://repository.tudelft.nl/islandora/object/uuid%3Ac9773355-d4a3-4063-9799-11343c625c01 (accessed on 14 December 2021).
  56. Kostorz, N.; Hilgert, T.; Kagerbauer, M.; Vortisch, P. What Do People Think About Autonomous Minibuses in Germany? In Proceedings of the 8th Symposium of the European Association for Research in Transportation (hEART), Budapest, Hungary, 4–7 September 2019. [Google Scholar]
  57. Madigan, R.; Louw, T.; Wilbrink, M.; Schieben, A.; Merat, N. What influences the decision to use automated public transport? Using UTAUT to understand public acceptance of automated road transport systems. Transp. Res. Part F Traffic Psychol. Behav. 2017, 50, 55–64. [Google Scholar] [CrossRef]
  58. Moták, L.; Neuville, E.; Chambres, P.; Marmoiton, F.; Monéger, F.; Coutarel, F.; Izaute, M. Antecedent variables of intentions to use an autonomous shuttle: Moving beyond TAM and TPB? Eur. Rev. Appl. Psychol. 2017, 67, 269–278. [Google Scholar] [CrossRef]
  59. Acheampong, R.A.; Cugurullo, F. Capturing the behavioural determinants behind the adoption of autonomous vehicles: Conceptual frameworks and measurement models to predict public transport, sharing and ownership trends of self-driving cars. Transp. Res. Part F Traffic Psychol. Behav. 2019, 62, 349–375. [Google Scholar] [CrossRef] [Green Version]
  60. Lee, C.; Ward, C.; Raue, M.; D’Ambrosio, L.; Coughlin, J.F. Age Differences in Acceptance of Self-driving Cars: A Survey of Perceptions and Attitudes. In Human Aspects of IT for the Aged Population. Aging, Design and User Experience; Springer: Cham, Switzerland, 2017; pp. 3–13. [Google Scholar] [CrossRef]
  61. Nordhoff, S.; de Winter, J.; Madigan, R.; Merat, N.; van Arem, B.; Happee, R. User acceptance of automated shuttles in Berlin-Schöneberg: A questionnaire study. Transp. Res. Part F Traffic Psychol. Behav. 2018, 58, 843–854. [Google Scholar] [CrossRef] [Green Version]
  62. Winter, S.R.; Rice, S.; Mehta, R.; Walters, N.W.; Pierce, M.B.; Anania, E.C.; Milner, M.N.; Rao, N. Do Americans differ in their willingness to ride in a driverless bus? J. Unmanned Veh. Syst. 2018, 6, 267–278. [Google Scholar] [CrossRef]
  63. Alessandrini, A. Investigating users’ attitudes towards conventional and automated buses in twelve European cities. Int. J. Transp. Econ. Riv. Internazionale Econ. Dei Trasp. 2016, XLIII 4, 413–436. [Google Scholar] [CrossRef]
  64. Pakusch, C.; Bossauer, P. User Acceptance of Fully Autonomous Public Transport. In Proceedings of the 14th International Joint Conference on e-Business and Telecommunications (ICETE 2017), Madrid, Spain, 24–26 July 2017; Volume 2, pp. 52–60. [Google Scholar]
  65. Wicki, M.; Guidon, S.; Becker, F.; Axhausen, K.W.; Bernauer, T. How technology commitment affects willingness to use AVs: Results from realistic mode choice experiment for a self-driving shuttle service. In Proceedings of the 19th Swiss Transport Research Conference (STRC 2019), Ascona, Switzerland, 15–17 May 2019. [Google Scholar] [CrossRef]
  66. Hulse, L.M.; Xie, H.; Galea, E.R. Perceptions of autonomous vehicles: Relationships with road users, risk, gender and age. Saf. Sci. 2018, 102, 1–13. [Google Scholar] [CrossRef]
  67. Penmetsa, P.; Adanu, E.K.; Wood, D.; Wang, T.; Jones, S.L. Perceptions and expectations of autonomous vehicles—A snapshot of vulnerable road user opinion. Technol. Forecast. Soc. Chang. 2019, 143, 9–13. [Google Scholar] [CrossRef]
  68. Winter, K.; Wien, J.; Molin, E.; Cats, O.; Morsink, P.; van Arem, B. Taking The Self-Driving Bus: A Passenger Choice Experiment. In Proceedings of the 2019 6th International Conference on Models and Technologies for Intelligent Transportation Systems (MT-ITS), Cracow, Poland, 5–7 June 2019; pp. 1–8. [Google Scholar] [CrossRef]
  69. Nordhoff, S.; de Winter, J.; Payre, W.; van Arem, B.; Happee, R. What impressions do users have after a ride in an automated shuttle? An interview study. Transp. Res. Part F Traffic Psychol. Behav. 2019, 63, 252–269. [Google Scholar] [CrossRef] [Green Version]
  70. Adner, R. Ecosystem as Structure: An Actionable Construct for Strategy. J. Manag. 2017, 43, 39–58. [Google Scholar] [CrossRef]
  71. Moore, J.F. Predators and Prey: A New Ecology of Competition. Harv. Bus. Rev. 1993, 71, 75–86. [Google Scholar]
  72. Christensen, C.M.; Rosenbloom, R.S. Explaining the attacker’s advantage: Technological paradigms, organizational dynamics, and the value network. Res. Policy 1995, 24, 233–257. [Google Scholar] [CrossRef]
  73. Peppard, J.; Rylander, A. From Value Chain to Value Network: Insights for Mobile Operators. Eur. Manag. J. 2006, 24, 128–141. [Google Scholar] [CrossRef] [Green Version]
  74. Mills, L.S.; Doak, D.F. The Keystone-Species Concept in Ecology and Conservation. BioScience 1993, 43, 219–224. [Google Scholar] [CrossRef] [Green Version]
  75. Iansiti, M.; Levien, R. Strategy as ecology. Harv. Bus. Rev. 2004, 82, 68–78. [Google Scholar]
  76. Agrawal, A.; Cockburn, I. The anchor tenant hypothesis: Exploring the role of large, local, R&D-intensive firms in regional innovation systems. Int. J. Ind. Organ. 2003, 21, 1227–1253. [Google Scholar] [CrossRef]
  77. Furr, N.; Shipilov, A. Building the right ecosystem for innovation. MIT Sloan Manag. Rev. 2018, 59, 59–64. [Google Scholar]
  78. Clarysse, B.; Wright, D.; Bruneel, J.; Mahajan, A. Creating value in ecosystems: Crossing the chasm between knowledge and business ecosystems. Res. Policy 2014, 43, 1164–1176. [Google Scholar] [CrossRef]
  79. Komorowski, M. Innovation Ecosystems in Europe: First Outline of an Innovation Ecosystem Index; European Commission: Brussels, Belgium, 2019; Available online: https://ec.europa.eu/futurium/en/digital-transition/study-innovation-ecosystems-europe-0 (accessed on 14 December 2021).
  80. Vanobberghen, W.; Rombaut, E.; Feys, M.; De Cauwer, C.; Vanhaverbeke, L.; Gobbato, F.; Grulois, G.; Temmerman, L.; de Séjournet, A. Piloting an autonomous shuttle in the Brussels Capital Regions: Living lab insights and user reactions and acceptance. In Proceedings of the Digital Living Lab Days Conference 2020: Connecting People and Technologies towards a Citizen-Centered Digital Future, 2–4 September 2020; pp. 193–217. Available online: https://issuu.com/enoll/docs/proceedings_final (accessed on 14 December 2021).
  81. Kim, J.-H.; Jang, S. A scenario-based experiment and a field study: A comparative examination for service failure and recovery. Int. J. Hosp. Manag. 2014, 41, 125–132. [Google Scholar] [CrossRef]
  82. Brazil, W.; Caulfield, B.; O’Connor, A. The role of transport information in extreme weather events: A scenario based experiment. Case Stud. Transp. Policy 2017, 5, 215–223. [Google Scholar] [CrossRef]
  83. Ajzen, I. The Theory of Planned Behavior. Organ. Behav. Hum. Decis. Process. 1991, 50, 179–211. [Google Scholar] [CrossRef]
  84. Armitage, C.J.; Conner, M. Efficacy of the theory of planned behaviour: A meta-analytic review. Br. J. Soc. Psychol. 2001, 40, 471–499. [Google Scholar] [CrossRef] [Green Version]
  85. Homburg, C.; Koschate, N.; Hoyer, W.D. Do Satisfied Customers Really Pay More? A Study of the Relationship between Customer Satisfaction and Willingness to Pay. J. Mark. 2005, 69, 84–96. [Google Scholar] [CrossRef]
  86. Daoud, J.I. Multicollinearity and Regression Analysis. J. Phys. Conf. Ser. 2017, 949, 012009. [Google Scholar] [CrossRef]
  87. Norman, G. Likert scales, levels of measurement and the “laws” of statistics. Adv. Health Sci. Educ. 2010, 15, 625–632. [Google Scholar] [CrossRef]
  88. Rehrl, K.; Zankl, C. Digibus©: Results from the first self-driving shuttle trial on a public road in Austria. Eur. Transp. Res. Rev. 2018, 10, 51. [Google Scholar] [CrossRef]
  89. Statistiek Vlaanderen. Vooruitzichten Bevolking. Available online: https://statistieken.vlaanderen.be/QvAJAXZfc/notoolbar.htm?document=SVR%2FSV-Demografie-ProjectiesBevolking-20180226.qvw&host=QVS%40cwv100154&anonymous=true (accessed on 17 December 2021).
  90. Evans, D.S.; Schmalensee, R. The Industrial Organization of Markets with Two-Sided Platforms; Working Paper 11603; National Bureau of Economic Research: Brussels, Belgium, September 2005. [Google Scholar] [CrossRef]
  91. Rochet, J.-C.; Tirole, J. Platform Competition in Two-Sided Markets. J. Eur. Econ. Assoc. 2003, 1, 990–1029. [Google Scholar] [CrossRef] [Green Version]
  92. Gawer, A.; Cusumano, M.A. How Companies Become Platform Leaders; MIT Sloan Management Review: Cambridge, MA, USA, 2008. [Google Scholar]
  93. Yu, H. For some platforms, network effects are no match for local know-how. Harv. Bus. Rev. 2018, 26. Available online: https://hbr.org/2018/07/for-some-platforms-network-effects-are-no-match-for-local-know-how (accessed on 14 December 2021).
  94. Sheeran, P. Intention—Behavior Relations: A Conceptual and Empirical Review. Eur. Rev. Soc. Psychol. 2002, 12, 1–36. [Google Scholar] [CrossRef]
  95. Borhan, M.N.; Ibrahim, A.N.H.; Miskeen, M.A.A. Extending the theory of planned behaviour to predict the intention to take the new high-speed rail for intercity travel in Libya: Assessment of the influence of novelty seeking, trust and external influence. Transp. Res. Part A Policy Pract. 2019, 130, 373–384. [Google Scholar] [CrossRef]
Figure 1. Vignette of Scenario 1—Last-mile option in combination with public transport.
Sustainability 14 00921 g001
Figure 2. Vignette of Scenario 2—Last-mile option in combination with private/individual car.
Sustainability 14 00921 g002
Figure 3. Sample descriptive statistics: demographics and mobility-related factors.
Sustainability 14 00921 g003
Figure 4. WTP for the shuttle service, in percentage of responses, per ride (left), and per annual subscription (right) for scenarios 1 (a,b) and 2 (c,d), among respondents indicating interest in using the service (n = 320 and 298, respectively).
Sustainability 14 00921 g004
Table 1. List of interviews by organization and stakeholder type 1.
Mobility (Service) ProvidersPublic Authorities and PTOsAssociations and ConsultanciesAV Manufacturers
Be-MobileAWVVIAS InstituteVolvo
TaxistopMOWErticoEasymile
UshFOD MobilityNext Mobility2getthere (ZF Group)
De LijnAutodelen
STIB/MIVB
1 Some entities may warrant some clarification. Be-Mobile is a smart mobility platform. Taxistop offers carpooling and carsharing. Ush leases autonomous shuttles. AWV is the Flemish Agency for Roads and Traffic. FOD (Federal Public Service) Mobility is the federal agency for mobility and transport. MOW is the Flemish Department of Mobility and Public Works. De Lijn is the PTO (bus and tram) in Flanders, but also serves Brussels with numerous lines. STIB/MIVB is the main PTO (bus/tram/metro) of the Brussels Capital Region. VIAS is a knowledge center providing advice on improving road safety and mobility, Next Mobility is a mobility consultancy, and Autodelen is an association promoting car sharing. Easymile and 2getthere are both autonomous shuttle manufacturers.
Table 2. T-test scores for scenario 1 “Last mile with public transport”. Attitude, Intention, WTP per ride, and WTP per annual subscription are the model’s dependent variables.
Independent VariableAttitude tIntention tWTP Ride tWTP Annual t
Context (closed vs. open road)−0.0790.5430.3300.145
Awareness of AVs (yes vs. no)4.929 ***4.025 ***−0.068−0.739
Experience with AVs (yes vs. no)−0.3712.200 *1.5251.678
Living area (inhabitants vs. commuters)2.356 *0.383−0.483−0.238
Car ownership (yes vs. no)−2.097 *−0.5542.119 *1.339
Reduced mobility (yes vs. no)−0.6060.1293.452 **1.508
Gender (female vs. male)−1.197−3.386 ***−2.557 *−0.321
The significance levels of each of the coefficients are indicated as follows: * p < 0.05; ** p < 0.01; *** p < 0.001.
Table 3. T-test scores for the scenario 2 “Last mile with remote parking”.
Independent VariableAttitude tIntention tWTP Ride tWTP Annual t
Context (closed vs. open road)−0.02310.726−0.8820.598
Awareness of Avs (yes vs. no)3.433 **2.598 **0.8250.144
Experience with Avs (yes vs. no)−1.0390.7272.039 *2.855 *
Living area (inhabitants vs. commuters)0.795−1.163−0.656−0.959
Car ownership (yes vs. no)−1.139−0.5540.2011.382
Reduced mobility (yes vs. no)−1.5610.9482.977 **3.489 ***
Gender (female vs. male)−0.929−2.833 *−2.952 *−3.273 ***
The significance levels of each of the coefficients are indicated as follows: * p < 0.05; ** p < 0.01; *** p < 0.001.
Table 4. Hierarchical multiple linear regressions for scenario 1, “Last mile with public transport”. Attitude, Intention, WTP per ride, and WTP per annual subscription are the model’s dependent variables.
Independent VariableAttitudeIntentionWTP RideWTP Annual
Step 1 βStep 1 βStep 2 βStep 1 βStep 2 βStep 1 βStep 2 β
Usefulness-0.392 ***0.392 ***−0.0160.0050.0910.087
Pleasantness-0.0150.024−0.091−0.0830.0410.036
Safety-0.117 *0.108 *0.0540.044−0.081−0.087
Ease of use-0.196 ***0.185 ***−0.104−0.098−0.117−0.117
Relaxing-0.0620.078−0.151 *−0.077−0.0200.016
Intention---0.218 ***0.199 ***0.202 **0.219 **
Familiarity0.167 ***−0.160 ***0.129 ***0.0960.0210.0590.060
Living area−0.059 0.028 −0.011 −0.022
Car ownership0.087 0.010 −0.073 −0.122 *
Reduced mobility−0.091 −0.006 0.209 *** 0.165 **
Gender−0.007 0.071 0.056 −0.026
Age0.097 0.025 −0.204 *** −0.251 ***
Education−0.014 0.067 0.021 −0.032
Employment0.012 0.071 0.007 0.061
Income0.028 0.013 0.146 ** 0.030
F2.786 ** 46.514 *** 21.067 *** 4.169 *** 6.322 *** 2.607 * 4.393 ***
Adjusted R20.0360.3870.3940.0560.1750.0330.134
The significance levels of each of the coefficients are indicated as follows: * p < 0.05; ** p < 0.01; *** p < 0.001.
Table 5. Hierarchical multiple linear regressions for scenario 2, “Last mile with remote parking”.
Independent VariableAttitudeIntentionWTP RideWTP Annual
Step 1 βStep 1 βStep 2 βStep 1 βStep 2 βStep 1 βStep 2 β
Usefulness-0.294 ***0.290 ***−0.157 *−0.140 *−0.125−0.089
Pleasantness-0.175 ***0.182 ***0.0010.0090.0220.040
Safety-0.112 *0.100 *0.0670.064−0.007−0.010
Ease of use-0.0510.033−0.096−0.064−0.073−0.067
Relaxing-0.137 *0.159 **−0.112−0.028−0.075−0.018
Intention---0.238 ***0.163 *0.163 *0.087
Familiarity0.101−0.148 ***0.107 *0.148 **0.0520.131 *0.054
Living area−0.002 0.083 −0.043 0.019
Car ownership0.075 0.038 0.004 −0.066
Reduced mobility−0.131 * 0.100 * 0.157 ** 0.194 ***
Gender−0.010 0.063 0.096 0.104 *
Age0.172 ** 0.046 −0.243 *** −0.204 ***
Education0.017 −0.002 0.028 0.006
Employment−0.021 0.092 0.075 0.003
Income0.137 * 0.077 0.132 * 0.176 **
F3.244 *** 38.062 *** 18.842 *** 4.303 *** 5.837 *** 3.021 * 5.641 ***
Adjusted R20.0510.3710.3990.0680.1870.0360.156
The significance levels of each of the coefficients are indicated as follows: * p < 0.05; ** p < 0.01; *** p < 0.001.
Publisher’s Note: MDPI stays neutral with regard to jurisdictional claims in published maps and institutional affiliations.

