Article

Influence of Residue Type and Method of Placement on Dynamics of Decomposition and Nitrogen Release in Maize-Wheat-Mungbean Cropping on Permanent Raised Beds: A Litterbag Study

by
Opinder Singh Sandhu
1,*,
Mangi L. Jat
2,
Rajeev Kumar Gupta
1,
Harmeet Singh Thind
1,
Harminder Singh Sidhu
3 and
Yadvinder Singh
1
1
Department of Soil Science, Punjab Agricultural University, Ludhiana 141004, India
2
International Maize and Wheat Improvement Centre (CIMMYT), New Delhi 110012, India
3
Borlaug Institute for South Asia (BISA), CIMMYT, Ladhowal 141004, India
*
Author to whom correspondence should be addressed.
Sustainability 2022, 14(2), 864; https://doi.org/10.3390/su14020864
Submission received: 29 October 2021 / Revised: 18 December 2021 / Accepted: 19 December 2021 / Published: 13 January 2022

Abstract

:
Decomposition influences carbon and nutrient cycling from crop residues. The nylon-mesh-bag technique was implied to study the decomposition and N-release dynamics from different crop residues under field conditions. The four types of residues were: maize (lower than 50% below the cob), wheat (lower than 25% of wheat stubbles), a whole mung bean residue, and a mixture of wheat + mung bean residue (1:1 ratio) put on the soil surface and in below the sub-surface. Decomposition and N release from both at-surface- and below-surface-placed residues were accurately described by a single-pool first-order exponential decay function as a function of thermal time (based on the accumulative daily mean temperature). The simple first-order exponential model met the criteria of goodness of fit. Throughout the decomposition cycle (one thermal year), the rate of decomposition as measured by a decrease in residue mass and the release of total N were statistically higher from the sub-surface compared to the surface-placed residue, irrespective of the residue type. At the end of the 150-day decomposition cycle, the release of total N was highest in mung bean (32.0 kg N ha−1), followed by maize (31.5 kg N ha−1) > wheat + mung bean (16.1 kg N ha−1), and the minimum (6.54 kg N ha−1) in wheat residue. Crop residues with a wider C/N ratio such as maize and wheat, when applied on the soil surface in conservation agriculture, caused the decomposition to occur at slower rates, thereby providing long-term beneficial effects on the soil thermal regime, soil moisture conservation, and C sequestration in North-West India.

1. Introduction

Maize-wheat is the dominant cropping system of India [1]. Conventional practices have shown adverse effects on crop production and productivity, efficient use of water and nutrients, long-term sustainability, and economic benefits [2,3]. Such practices release enhanced CO2 emissions into the atmosphere leading to a reduction in the soil organic carbon content [4,5,6]. In contrast, conservation agriculture (CA) practices (zero tillage or permanent raised bed planting and straw retention as mulch) are beneficial in terms of water and soil conservation, reducing operational costs and improving crop yields, soil quality, and environment quality in a maize-based cereal system [7,8,9,10,11,12,13]. Integration of a pulse crop like mung bean (Vigna radiata) in the maize-wheat system is recommended after reaping wheat and prior to seeding of maize during the fallow period to provide protein-rich grains and additional income to farmers in North-West India [13,14].
It is estimated that, in India, every year a variety of crops produce about 686 million tonnes of crop residues [15]. Crop residues provide soil carbon and nutrients for subsequent crops [16,17]. In less-advanced countries where animal husbandry is integrated in the farming systems, a major limitation in implementing CA is the availability of sufficient mass of the crop residue for use as mulch. However, a large amount of crop residues, especially of rice and wheat, produced in north-western India are usually disposed of by on-farm burning [17,18]. The burning of crop residues leads to severe air pollution, loss of plant nutrients and organic matter. The addition of crop residues into the soil releases considerable amounts of plant nutrients on decomposition [19]. Therefore, it is one of the best methods to ensure crop residues recycling onto agricultural land for enhancing soil health and agroecosystem sustainability on a long-term basis [17,20,21,22,23]. In many parts of the world, including India, maize stover is a preferred cattle feed over rice straw. However, complete removal of maize residues has soil fertility implications [24]. The collection of cobs and the part of the stover above-ear may provide high-quality animal fodder with the removal of lesser nutrients leaving a major part of nutrients in the whole stover [24]. Therefore, a lower portion of maize stover (lower 50%, below cob) with less nutrients can be left in the field after taking away the upper 50% portion to be used as animal fodder. This will serve as much in the CA system and help nutrient cycling, to sustain soil quality by redirecting C removal. Similarly, wheat straw is a preferred animal fodder over rice straw, but wheat stubbles constituting about 25% of total residue mass are still burned in north-western India [25]. The wheat stubbles with low N content can be utilized as mulch avoiding their burning in a CA-based maize-wheat system. Similarly, after removing grains at maturity, mung bean residue (narrow C/N ratio) can also be retained as mulch in a CA-based maize-wheat-mung-bean cropping system.
The crop residues’ decomposition is largely influenced by type of residue (biochemical composition), soil and environmental conditions, and the method of placement [14,26,27,28,29]. The most-important biochemical indicators for crop residues have been shown to be the N concentration, the C:N ratio, and the lignin concentration [30,31,32,33]. It was found that when mixtures of crop residues were incorporated into the soil, the decomposition of the plant residue was increased by a low C:N ratio and a high N concentration of the residue [34]. Cereal residues have high C:N ratios, and net N-immobilization is expected to occur over the short-term, particularly when incorporated into the soil [35,36]. The nature and extent of decomposition dynamics and nutrient cycling depends upon soil biological and chemical processes influenced by modified environments, which is quite different in the surface-placed and the incorporated residues as compared to incorporation [37,38,39]. The congenial conditions favouring microbial activity in the soil-incorporated residues results in faster decomposition, as compared to its placement on soil surface [14,40]. However, it was reported that the quality of the residue affects residue decomposition along with the method of placement [12,41].
The impacts of crop-residue management on decomposition and N release are quite challenging to predict. Many empirical equations have been used to describe the decomposition and N-release kinetics of crop residues under field conditions [42,43,44,45,46,47]. The first-order exponential function mathematical model is the most frequently used to describe the decomposition of crop residues, but few have been tested in long-term studies. It was reported that the thermal time (accumulative temperature) instead of the time scale accurately described the kinetics of straw decomposition to quantify the C and N dynamics of crop residues under different management conditions over the long term across the different agricultural regions [48]. A thorough knowledge of the kinetics of straw decomposition and N mineralization from different crop residues incorporated into soil (conventional tillage) and placed on the soil surface as mulch (CA) is crucial and can be useful to promote carbon sequestration in agricultural systems and nutrient cycling and to minimize global warming potential, thereby increasing agricultural sustainability in the region [49,50,51]. Previous research on C and N dynamics from crop residues had many limitations. First, most of the studies were conducted for a period of less than one year under controlled conditions, which may not be long enough to reveal the dynamics of straw decomposition during later phases [12,41,52]. Second, due to different starting times of the various straw-decomposition experiments, seasonal temperature variations cannot be ignored [53]. Therefore, these factors should be taken into account when selecting the optimal equation and using data from field experiments both to accurately describe straw decomposition and to extrapolate to a method of straw management for different cropping systems. The humification coefficient (a fraction of straw C that remains in the soil after one calendar year) is important in measuring the amount of stable organic C and soil C sequestration potential as well as a parameter needed to predict long-term organic matter changes using models [43,54,55]. Therefore, understanding the value of the humification coefficient under different conditions is critical for a better understanding of the cycling of soil C in agro-ecosystems.
Based on the above ideas, the objective of this work was to assess kinetics of the decomposition and N release from different crop residue types and their method of placement for the subsequent maize-wheat mung bean (Vigna radiata) rotation under actual field conditions in the semiarid climate of north-western India. The first hypothesis of this study was that decomposition and N release differ with the residue type due to differences in their chemical composition and method of placement under field conditions due to the differences in soil moisture, temperature, and soil contact experienced by the decomposing residues; the second hypothesis was that the first-order simple exponential model could predict the kinetics of the long-term decomposition and N release from crop residues under field conditions in semiarid soils.

2. Materials and Methods

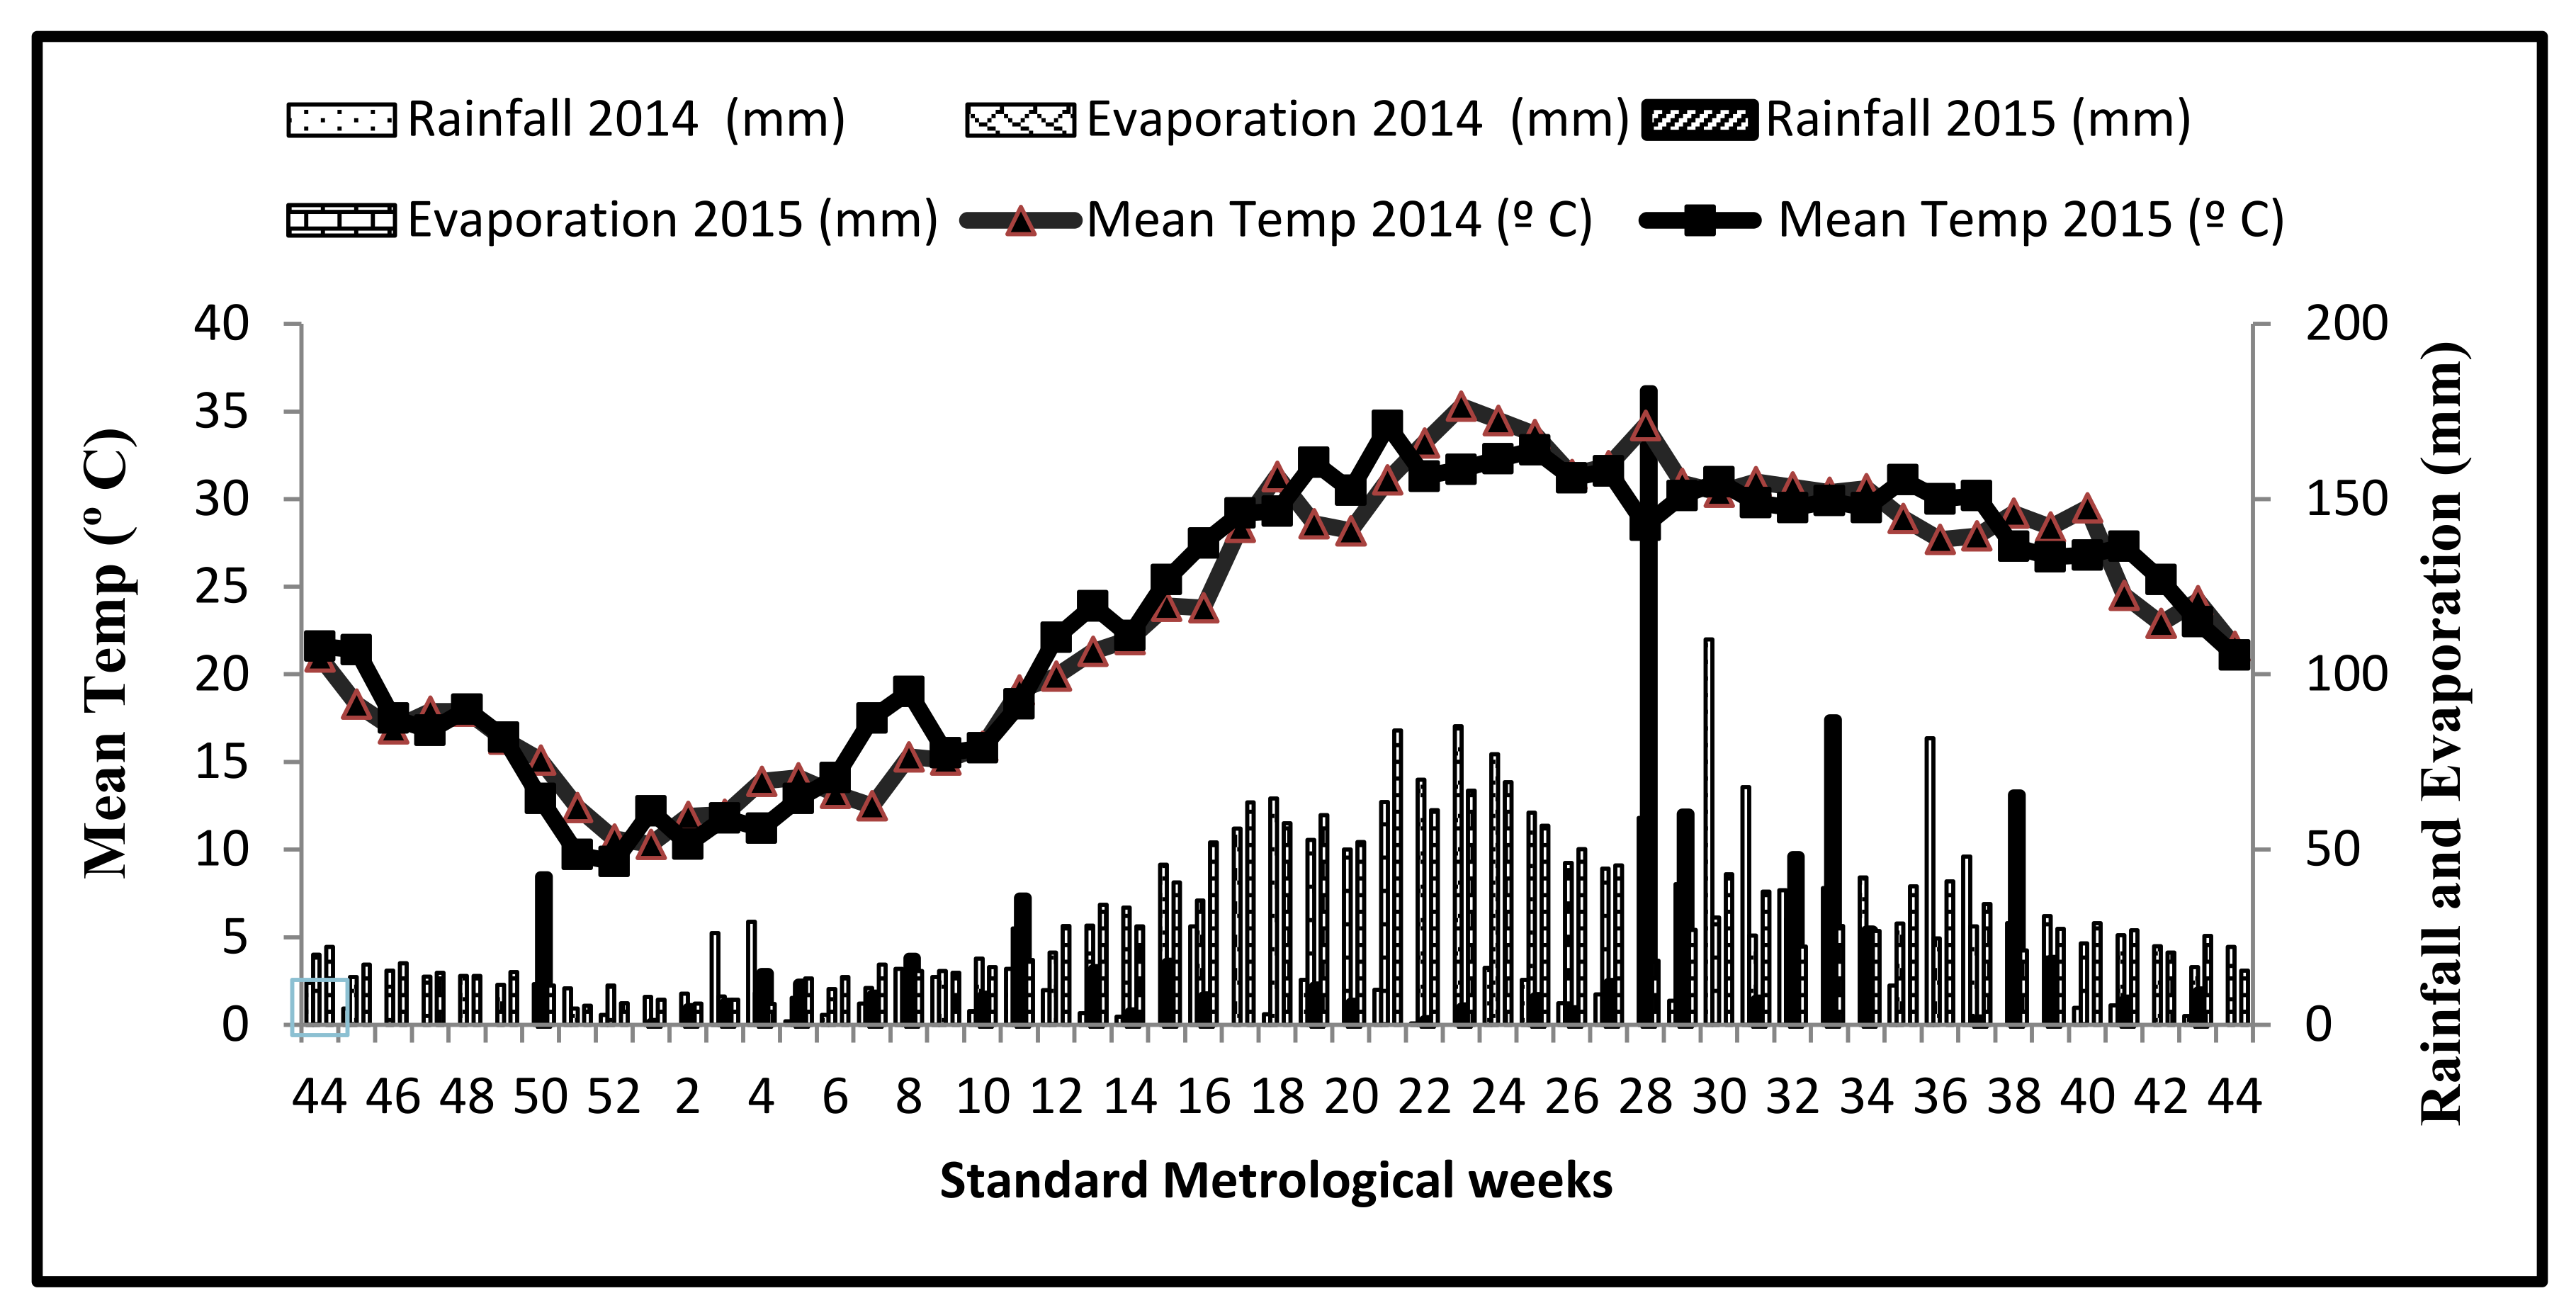
2.1. Study Site and Soil Parameters

An on-farm experiment was conducted at the Borlaug Institute for South Asia (BISA), Ludhiana during 2013–2014 and 2014–2015 on a wheat (Triticum aestivum L.)—maize (Zea mays L.)—mung bean (Vigna radiata) system. The experimental site was in the central plain region of Punjab state under the Trans-Gangetic agro-climatic zone of India, which is geographically located at 30.99° N latitude, 75.44° E longitude. The study location experiences a semi-arid, sub-tropical climate (with cold winters and hot summers) and is positioned at an altitude of about 247 m above mean sea level. The temperature often exceeds 38 °C during summer and sometimes touches 45 °C with dry spells during May and June. A minimum temperature falls below 0.5 °C with some frosty spells during the months of December and January. The experimental site receives a 680 mm average annual rainfall, about 80% of which falls during the maize season. The average annual pan evaporation is about 850 mm. The weekly mean temperature varied from 10.3 °C in the 1st standard meteorological week (SMW, 1–7 January) and 35.3 °C in the 23rd SMW during the crop season of 2013–2014. During 2014–15, the minimum weekly mean temperature of 9.3 °C was recorded in the 52nd SMW (24–31 December) and the maximum weekly mean temperature of 34.0 °C in the 21st SMW (Figure 1). The crop season during 2013–2014 received 592.1 mm of rainfall, and, in the 30th SMW, a maximum rainfall of 110.0 mm was received. During 2014–2015, a total of 754.8 mm of rainfall was recorded during the crop season with a maximum rainfall received in the 28th SMW (181.0 mm). The wheat season of 2013–2014 and 2014–2015 received 171.4 and 219.4 mm of rainfall, respectively, whereas maize received a total rainfall of 420.7 and 535.4 mm during 2014 and 2015, respectively. Rainfall, temperature, and irrigation scheduling data are presented in Figure 1.
Bulk soil samples from the plough layer (up to 15 cm) taken from the field were sandy loam in texture, normal in pH at 8.6, medium in Walkley–Black organic C (5.40 g kg−1), and non-saline (0.18 dS m−1) in reaction. The status of KMnO4 available N, Olsen P (Olsen et al., 1954), and 1N NH4OAc extractable K content was found to be 157 kg ha−1, 12.8 mg kg1, and 77.7 mg kg−1, respectively. The bulk density and mean weight diameter of the soil (plough layer) varied from 1.64 to 1.70 Mg m−3 and 0.20–0.24 mm, respectively. The soils have developed from alluvium under the ustic soil moisture regime and belong to the family of Typic Ustochrepts), which are categorised under the hyperthermic temperature regime.

2.2. Treatments and Experimental Design

Four plant materials, namely, wheat (Triticum aestivum L.), stubbles (lower 25%, 20 cm long; WL25%), maize (Zea mays L.) stover (lower 50%, harvested below the cob, ML50%) and mung bean (Vigna radiata, L.) (after removing the mature pods, MB100%), and a mixture of wheat stubbles and mung bean straw (1:1 dry weight basis) were used in this study. Wheat stubbles, maize stover, and mung bean straw were collected at plant maturity during the harvest in April, October, and June, respectively. The litter-bag method was used to measure decomposition and N release from plant materials used in the study [14]. Plant subsamples were cut using a pair of scissors—the size varied from 1.5–2.0 cm in length—weighted, and transferred in nylon litter bags. Two methods of placement of plant materials in nylon litter bags (20 cm wide × 30 cm long with a 1 mm diameter mesh size) were buried into soil at a 12–15 cm depth and surface-placed on permanent beds to record the dry mass at each sampling time. The amount of added dry mass per litter bag was 50 (±0.1) g. The nylon bags containing residue were placed in each bag and placed on 20 m long permanent beds for 12 months in the on-going field experiment. Within each plot, 12 bags (representing each sampling period) were either placed on the surface of one bed or buried into the soil at about a 12–13 cm depth on the adjoining bed equidistantly distributed (30 cm) within each plot. The maize stover (lower 50%) were put in the soil in the wheat crop cycle after reaping maize crop on 30 November 2013, and wheat and mung bean residues were kept in the field during the maize crop cycle after the harvest of the wheat and mung bean crop on 7 July 2014. There was either wheat or maize or mung bean crop growing in the experimental plots during the entire 12-month incubation period. The litter bags placed on the soil surface were fixed with a small piece of stone, so that it is not moved by the air. The position of each nylon bag buried in the soil was marked with a nylon thread tied to a 40 cm-long wooden stick. The litter bags were recovered periodically (seven times) over a one-year period to determine the percentage of the dry matter and the total N still remaining in the residues. Therefore, the decomposition and the N-release patterns of the crop residues were described from the time of residue placement at the harvest time of each crop in 1 year and transformed to the accumulated thermal time (Table 1). After collection, the plant materials were properly cleaned in distilled water and put in an oven to dry with forced air circulation at 60 °C for 72 h to a constant weight. The samples of each residue were weighed and ground in a Willey mill to pass through a 1 mm sieve prior to determination of total N concentration. Under conventional tillage, the litter bags were carefully removed before, and placed back after, tillage operations before seeding.

2.2.1. Chemical Analysis of Residue Samples and Calculations

The cellulose, hemicellulose, carbon content, and N content in the plant residue samples were determined (Table 2). To estimate the cellulose and hemicelluloses concentration in the residue, samples were analysed by the method of [56]. The total N concentration was determined by the micro-Kjeldahl digestion and distillation method [57] and C by the Walkley–Black wet digestion method [58]. Total N release from the residue was calculated by multiplying the N content by the residue mass remaining at each sampling period. Time was adjusted by an accumulated thermal time (sum of the daily mean temperature in °C recorded from a meteorological station at the experimental site) during each incubation cycle. For one thermal year, the accumulated temperature was 8582 °C for maize residue and 8634 °C for wheat, mung bean, and wheat + mung bean residues. We used the mass of different straw types remaining in the soil after one thermal year, having an accumulated annual temperature of 8608 °C (mean for two seasons) for the humification coefficient.

2.2.2. Modelling Decomposition and N Release from Plant Residues

The simple exponential model (first-order kinetic model) was used to describe decomposition and N release from crop residues. The observed values of the dry mass of the remaining residue (%) over a one-year decomposition period were fitted with a simple exponential model (first-order kinetic model) described as:
Pt = P0e−kt
where Pt is the residue remaining (% of applied) at time t (expressed in accumulated thermal time, ATT °C); P0 is the initial residue mass at ATT = 0; and k is the rate of residue decomposition, which depends on the considered crop residue, and “t” is the accumulated thermal time. Briefly, the thermal time was calculated on the basis of the accumulated daily average of the maximum and minimum temperatures for each decomposition phase of a particular sampling period. The first-order decomposition coefficient, “k,” was determined for each residue treatment and placement method for 150-day and 365-day decomposition cycles. The decrease in mass of the residue at each sampling time was considered as decomposed. The data reported in terms of straw mass decomposition were converted to the percentage of mass remaining by taking the difference between the initial (taken as 100) and the percentage of mass decomposition at time t, and they were used to model the pattern of the residue mass decay and the N release.
Similarly, to calculate percent N release, the N content of the decomposing residue at that point (% nitrogen multiplied by residue mass recovered at time “t”) was taken as the amount that had undergone changes during the study period. The exponential equation used for N release is described as:
Nt−N0 e−kt
where Nt and N0 are the total N content remaining and the initial N content at ATT = 0, respectively; k is the N-release-rate constant after the given ATT. The N release (kg ha−1) was determined considering the amount of nitrogen in the beginning in the residue in kg ha−1 calculated by multiplying N concentration by the residue mass (Mg ha−1), assuming a load of 6.0 Mg ha−1 for maize, 2.5 Mg ha−1 for wheat, and 4.5 Mg ha−1 for mung bean.

2.3. Statistical Analysis and Model Validation

The model was validated by comparing the observed data with the predicted values using the goodness-of-fit test. The mathematical expressions that describe these measures of analysis are the root mean square error (RMSE), the normalized root mean square error (NRMSE), the modelling efficiency (EF), and R2. The statistic index RMSE shows the correspondence between the measured and predicted data and has often been used as a means for evaluating the model accuracy. The RMSE was calculated as a mean squared error between the observed values and the model-predicted values obtained by taking the square root of the mean square error (MSE) obtained from the Proc Nlinear analysis. For a perfect fit between observed and simulated data, the values of RMSE, NRMSE, EF, and R2 should equal 0.0, 0.0, 1.0, and 1.0, respectively.

3. Results

3.1. Model Validation for Residue Decomposition and Nitrogen Release

The decomposition pattern as measured by biomass loss and N release as measured by percent of initial amount were described by the simple exponential model with time as a temporal scale (ATT) for all the residues (Figure 2, Figure 3, Figure 4, Figure 5, Figure 6, Figure 7, Figure 8 and Figure 9). The data indicated a best goodness of fit of the exponential model in predicting the residue decomposition for both surface and sub-surface placement, irrespective of the residue type. The values of R2 were between 0.94 and 0.99 for surface placement and 0.85 to 0.99 for subsurface placement for the two simulation periods (Table 3 and Table 4). Similarly, R2 values for N release were between 0.87 to 0.97 for surface placement and 0.81 and 0.93 for subsurface placement over a decomposition period of one year, while the values for a period of 150 days ranged from 0.73 to 0.97 (Table 5 and Table 6). The values of RMSE were generally lower than eight for the decomposition model and less than or equal to four for the N-release model for all the treatments, with a few exceptions (Table 3, Table 4, Table 5 and Table 6). The decomposition model had generally low values of NRMSE (<0.2 and 0.3 for 150 day- and 365 day-decomposition periods, respectively). Similarly, the values of NRMSE for N release were <0.3 for both of the decomposition cycles (Table 5 and Table 6). The values of model efficiency (EF) ranged from 0.80 to 0.99 for decomposition model for both of the decomposition cycles. For the N-release model, the values of EF ranged between 0.70 and 0.97 for the 150-day decomposition cycle and 0.70 and 0.97 for the 365-day decomposition cycle. The overall simple exponential model accurately described both decomposition and N release from four residue types either placed on the surface or subsurface according to these goodness-of-fit statistics.

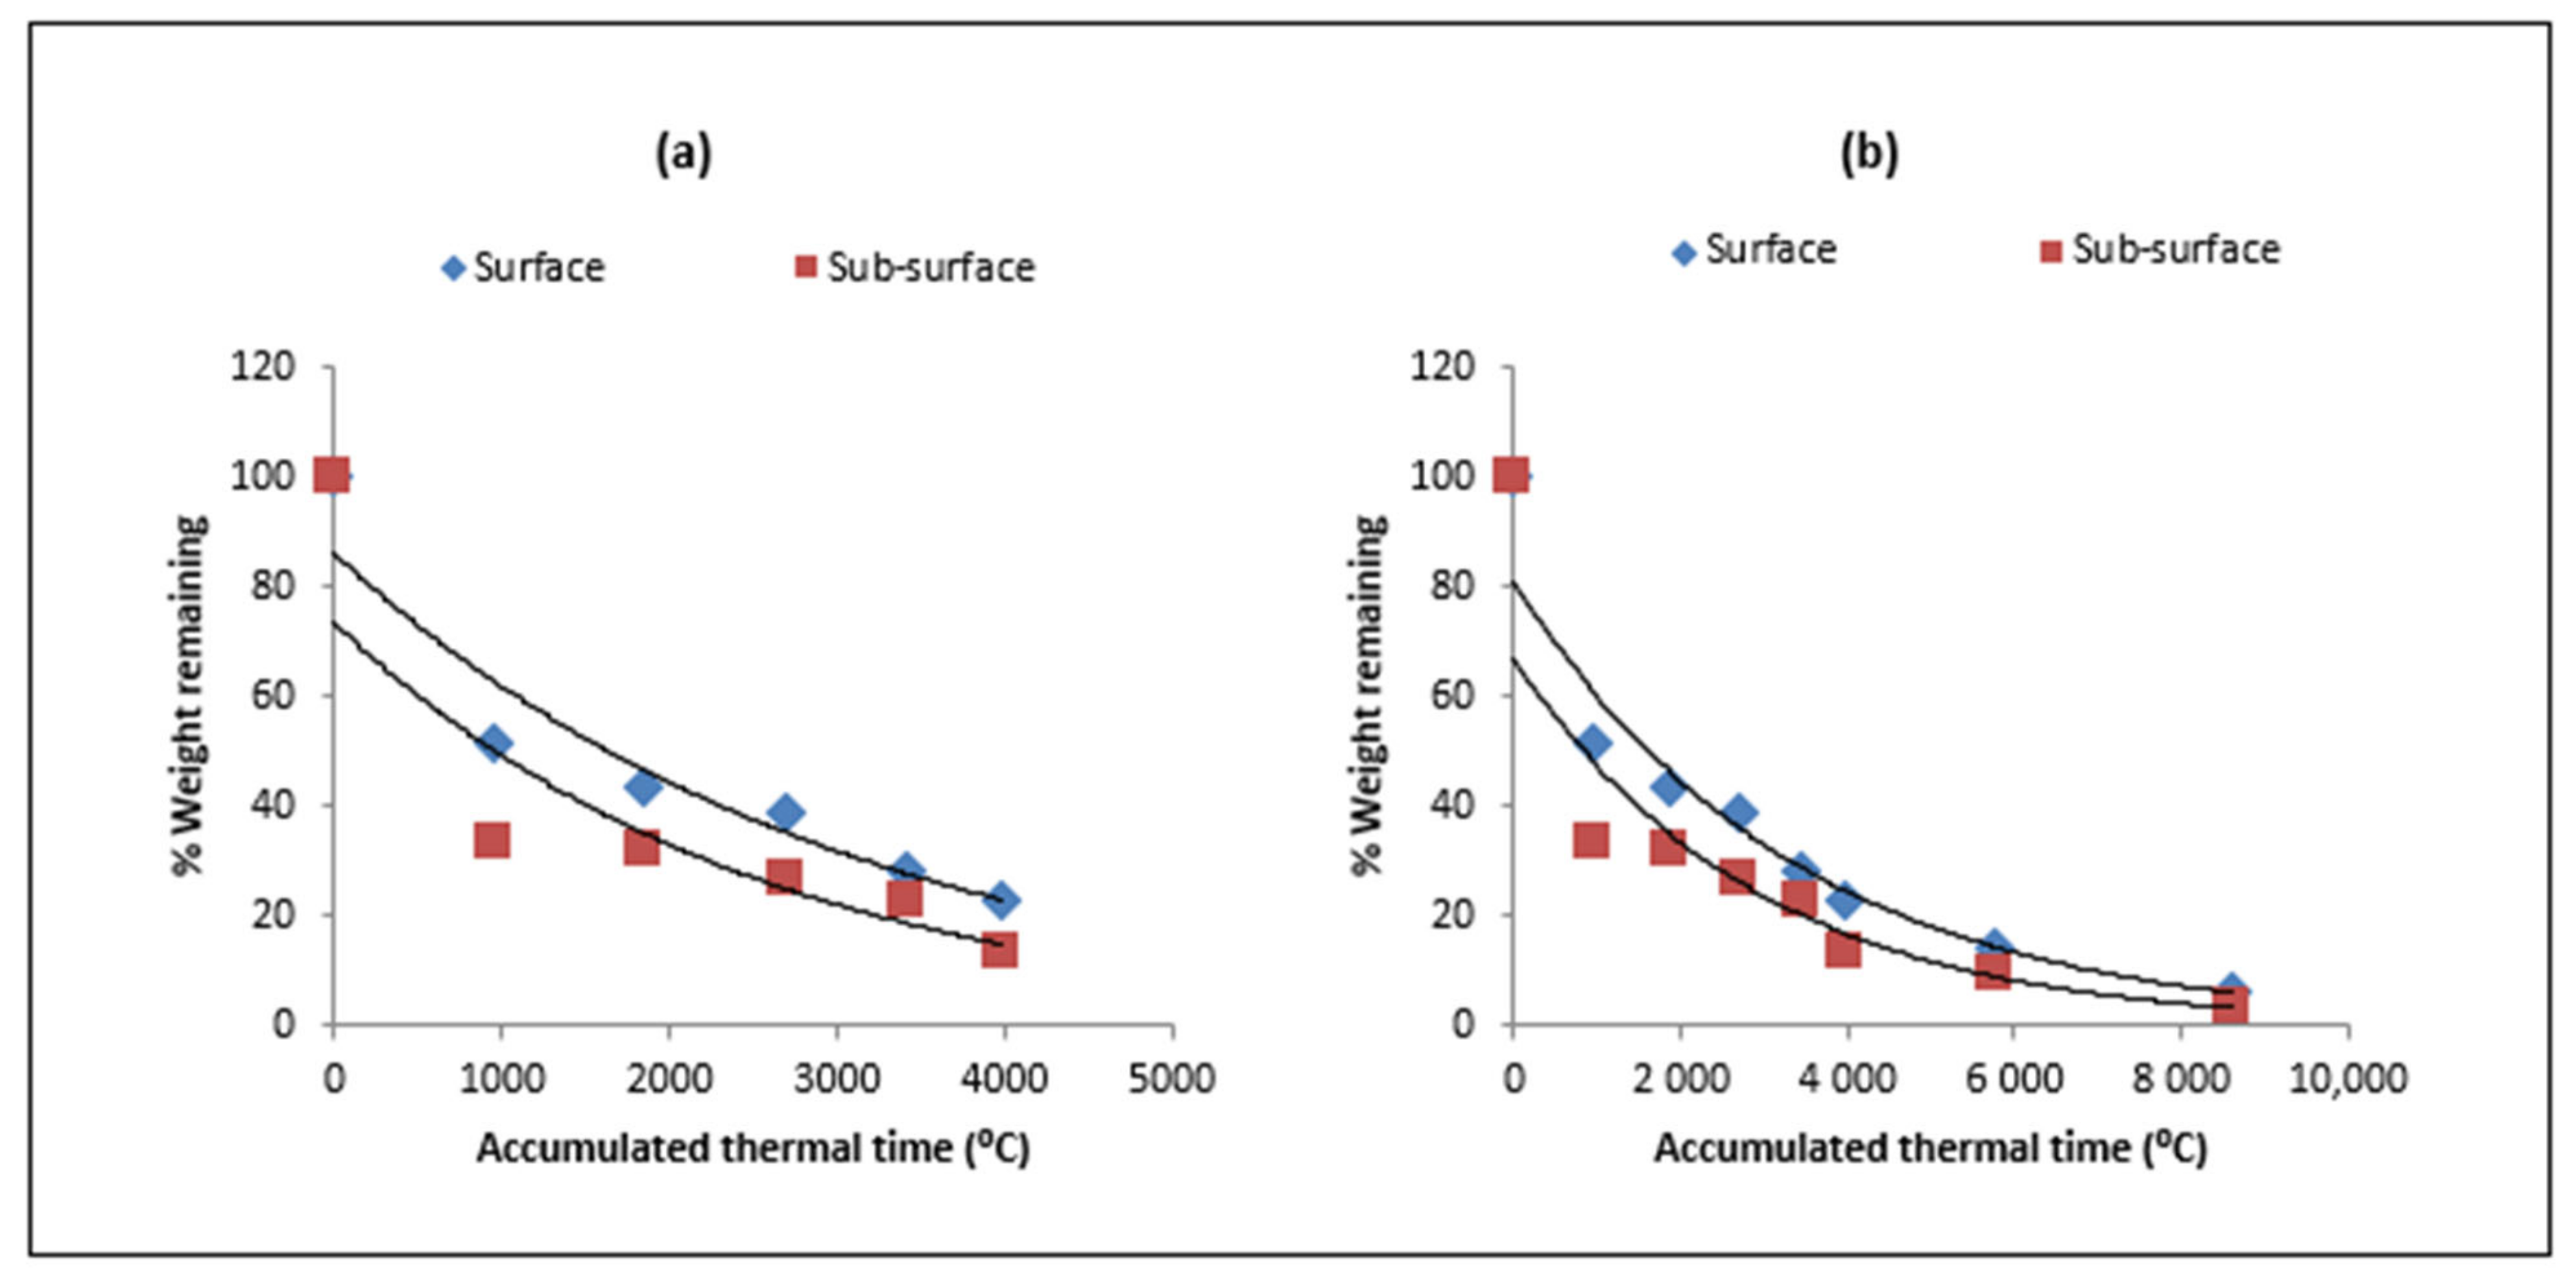
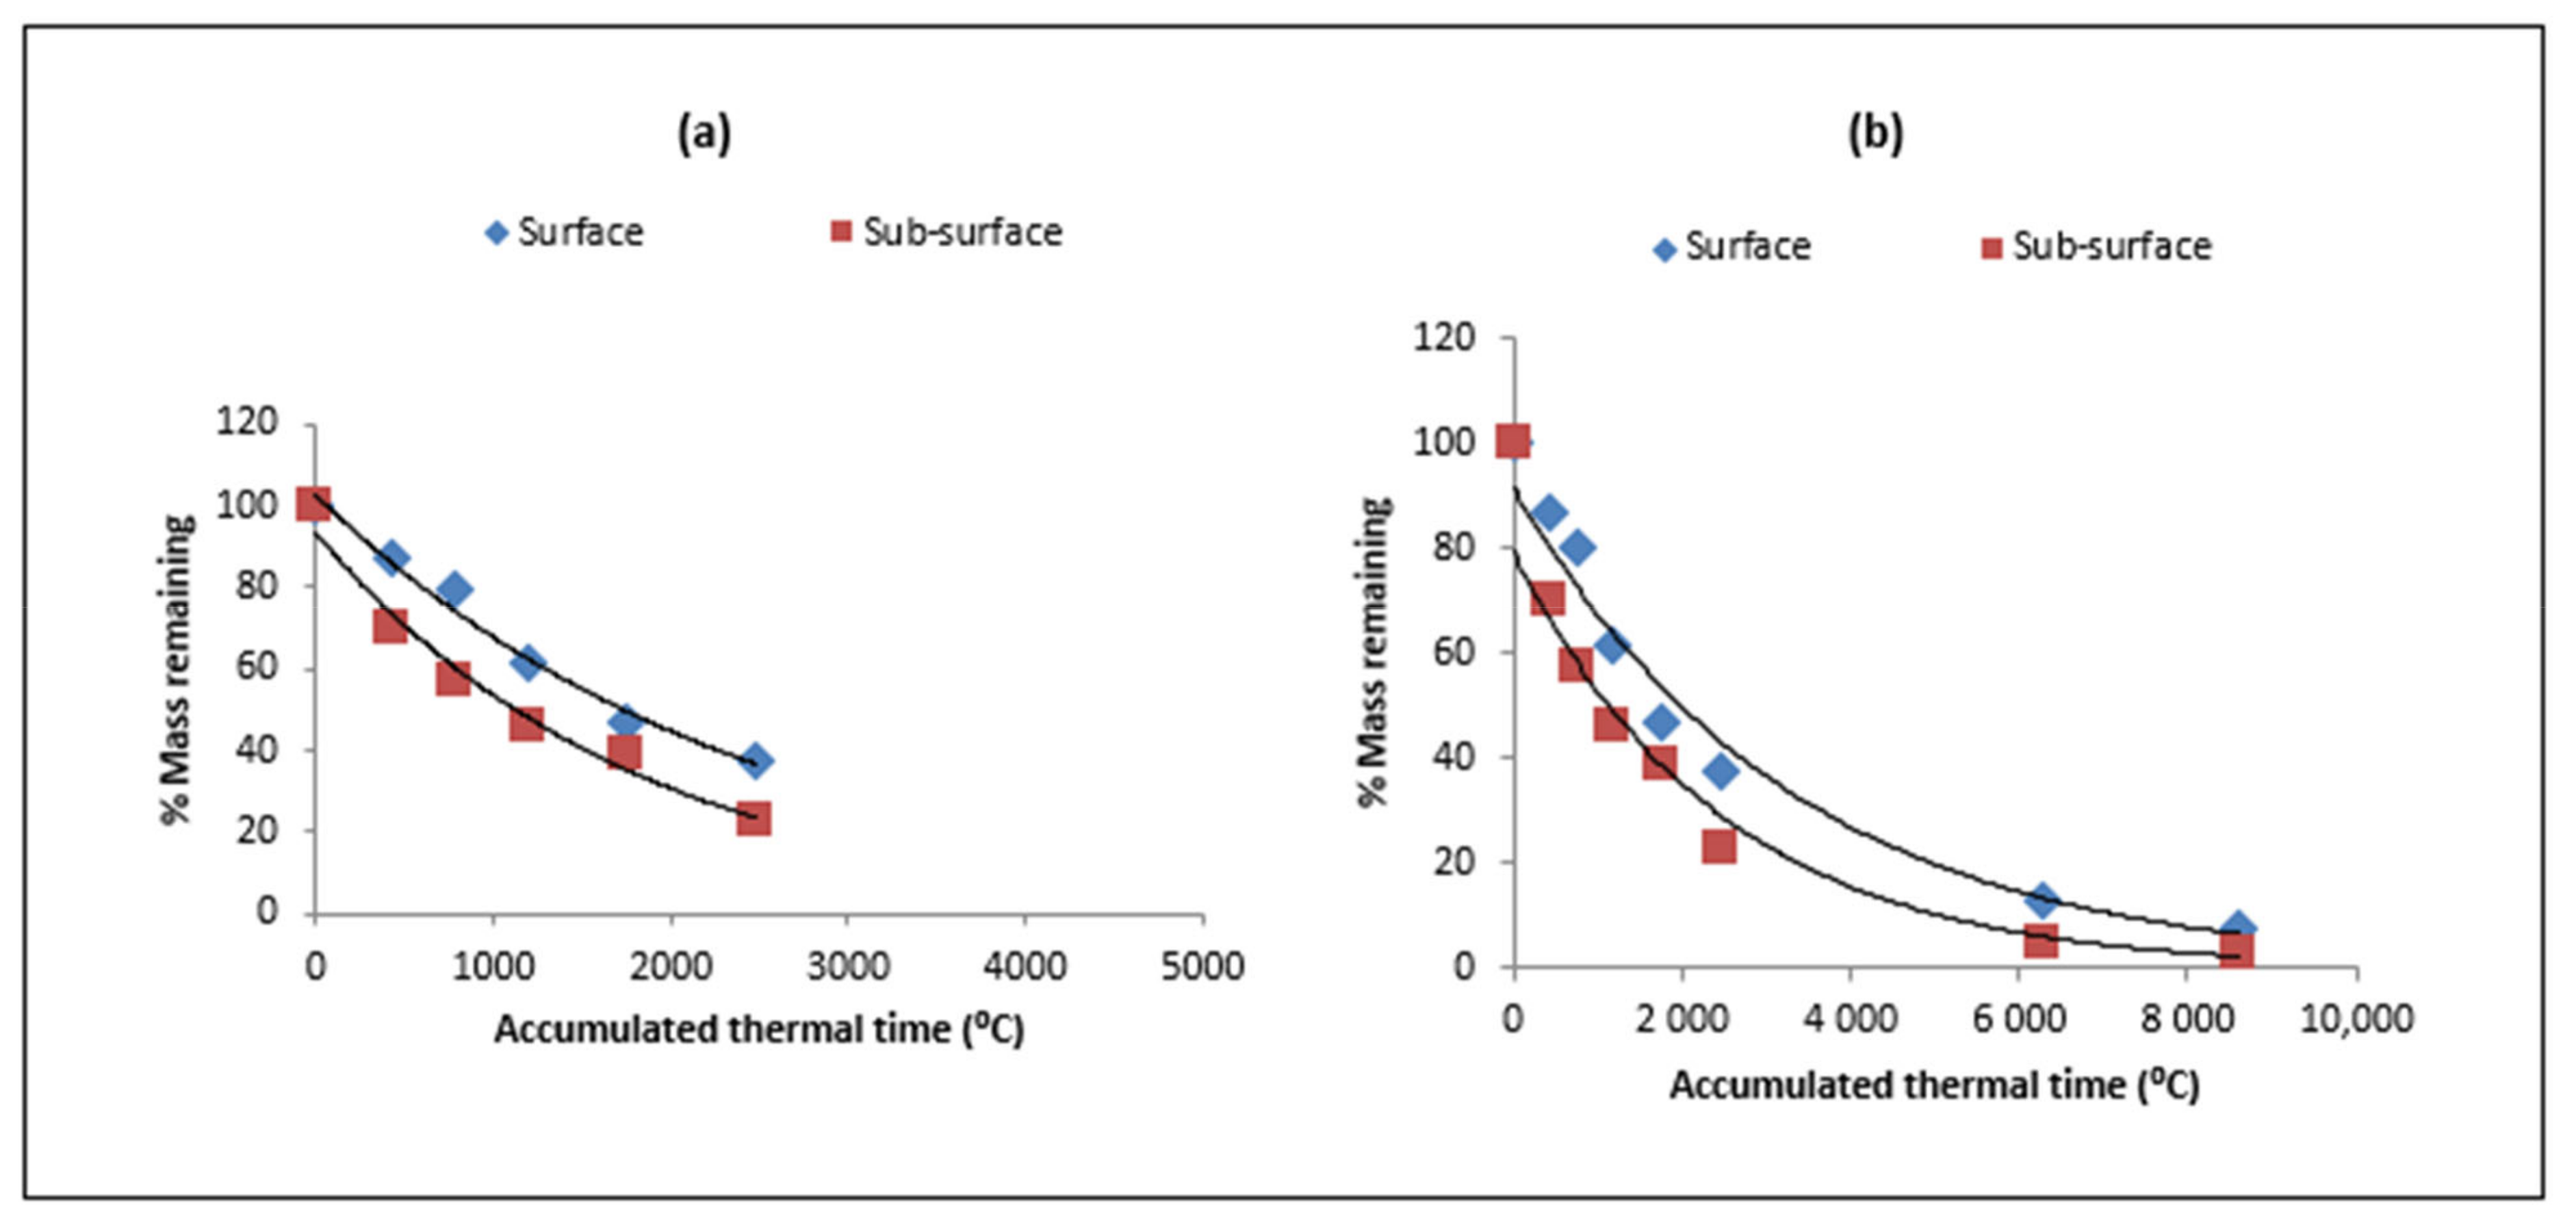
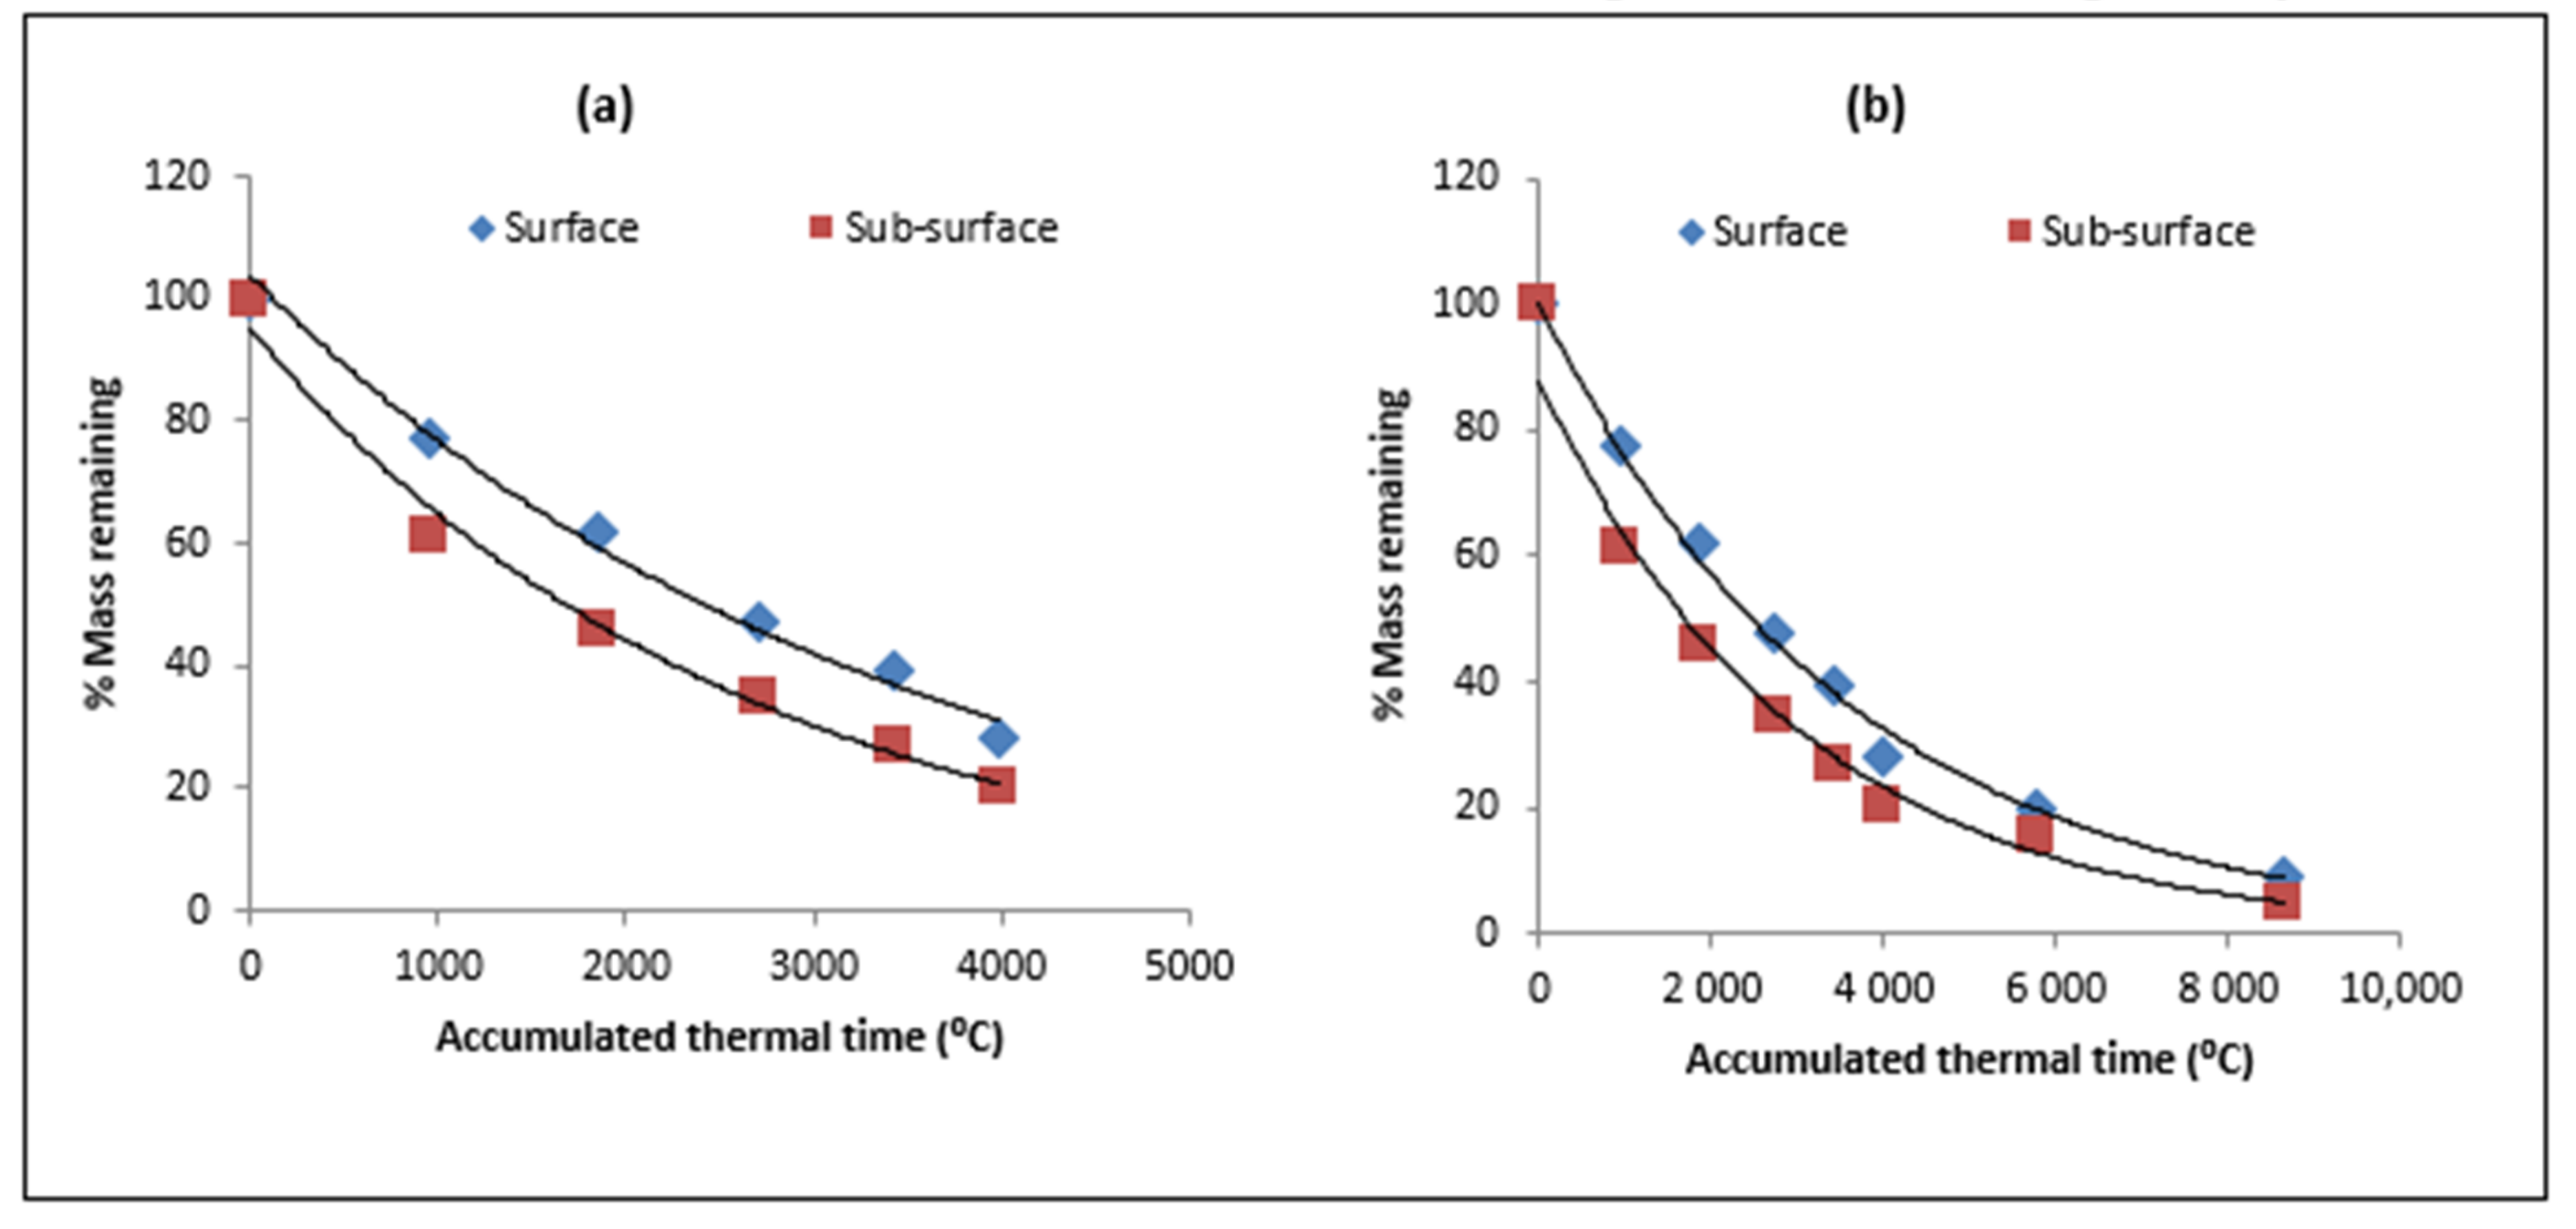
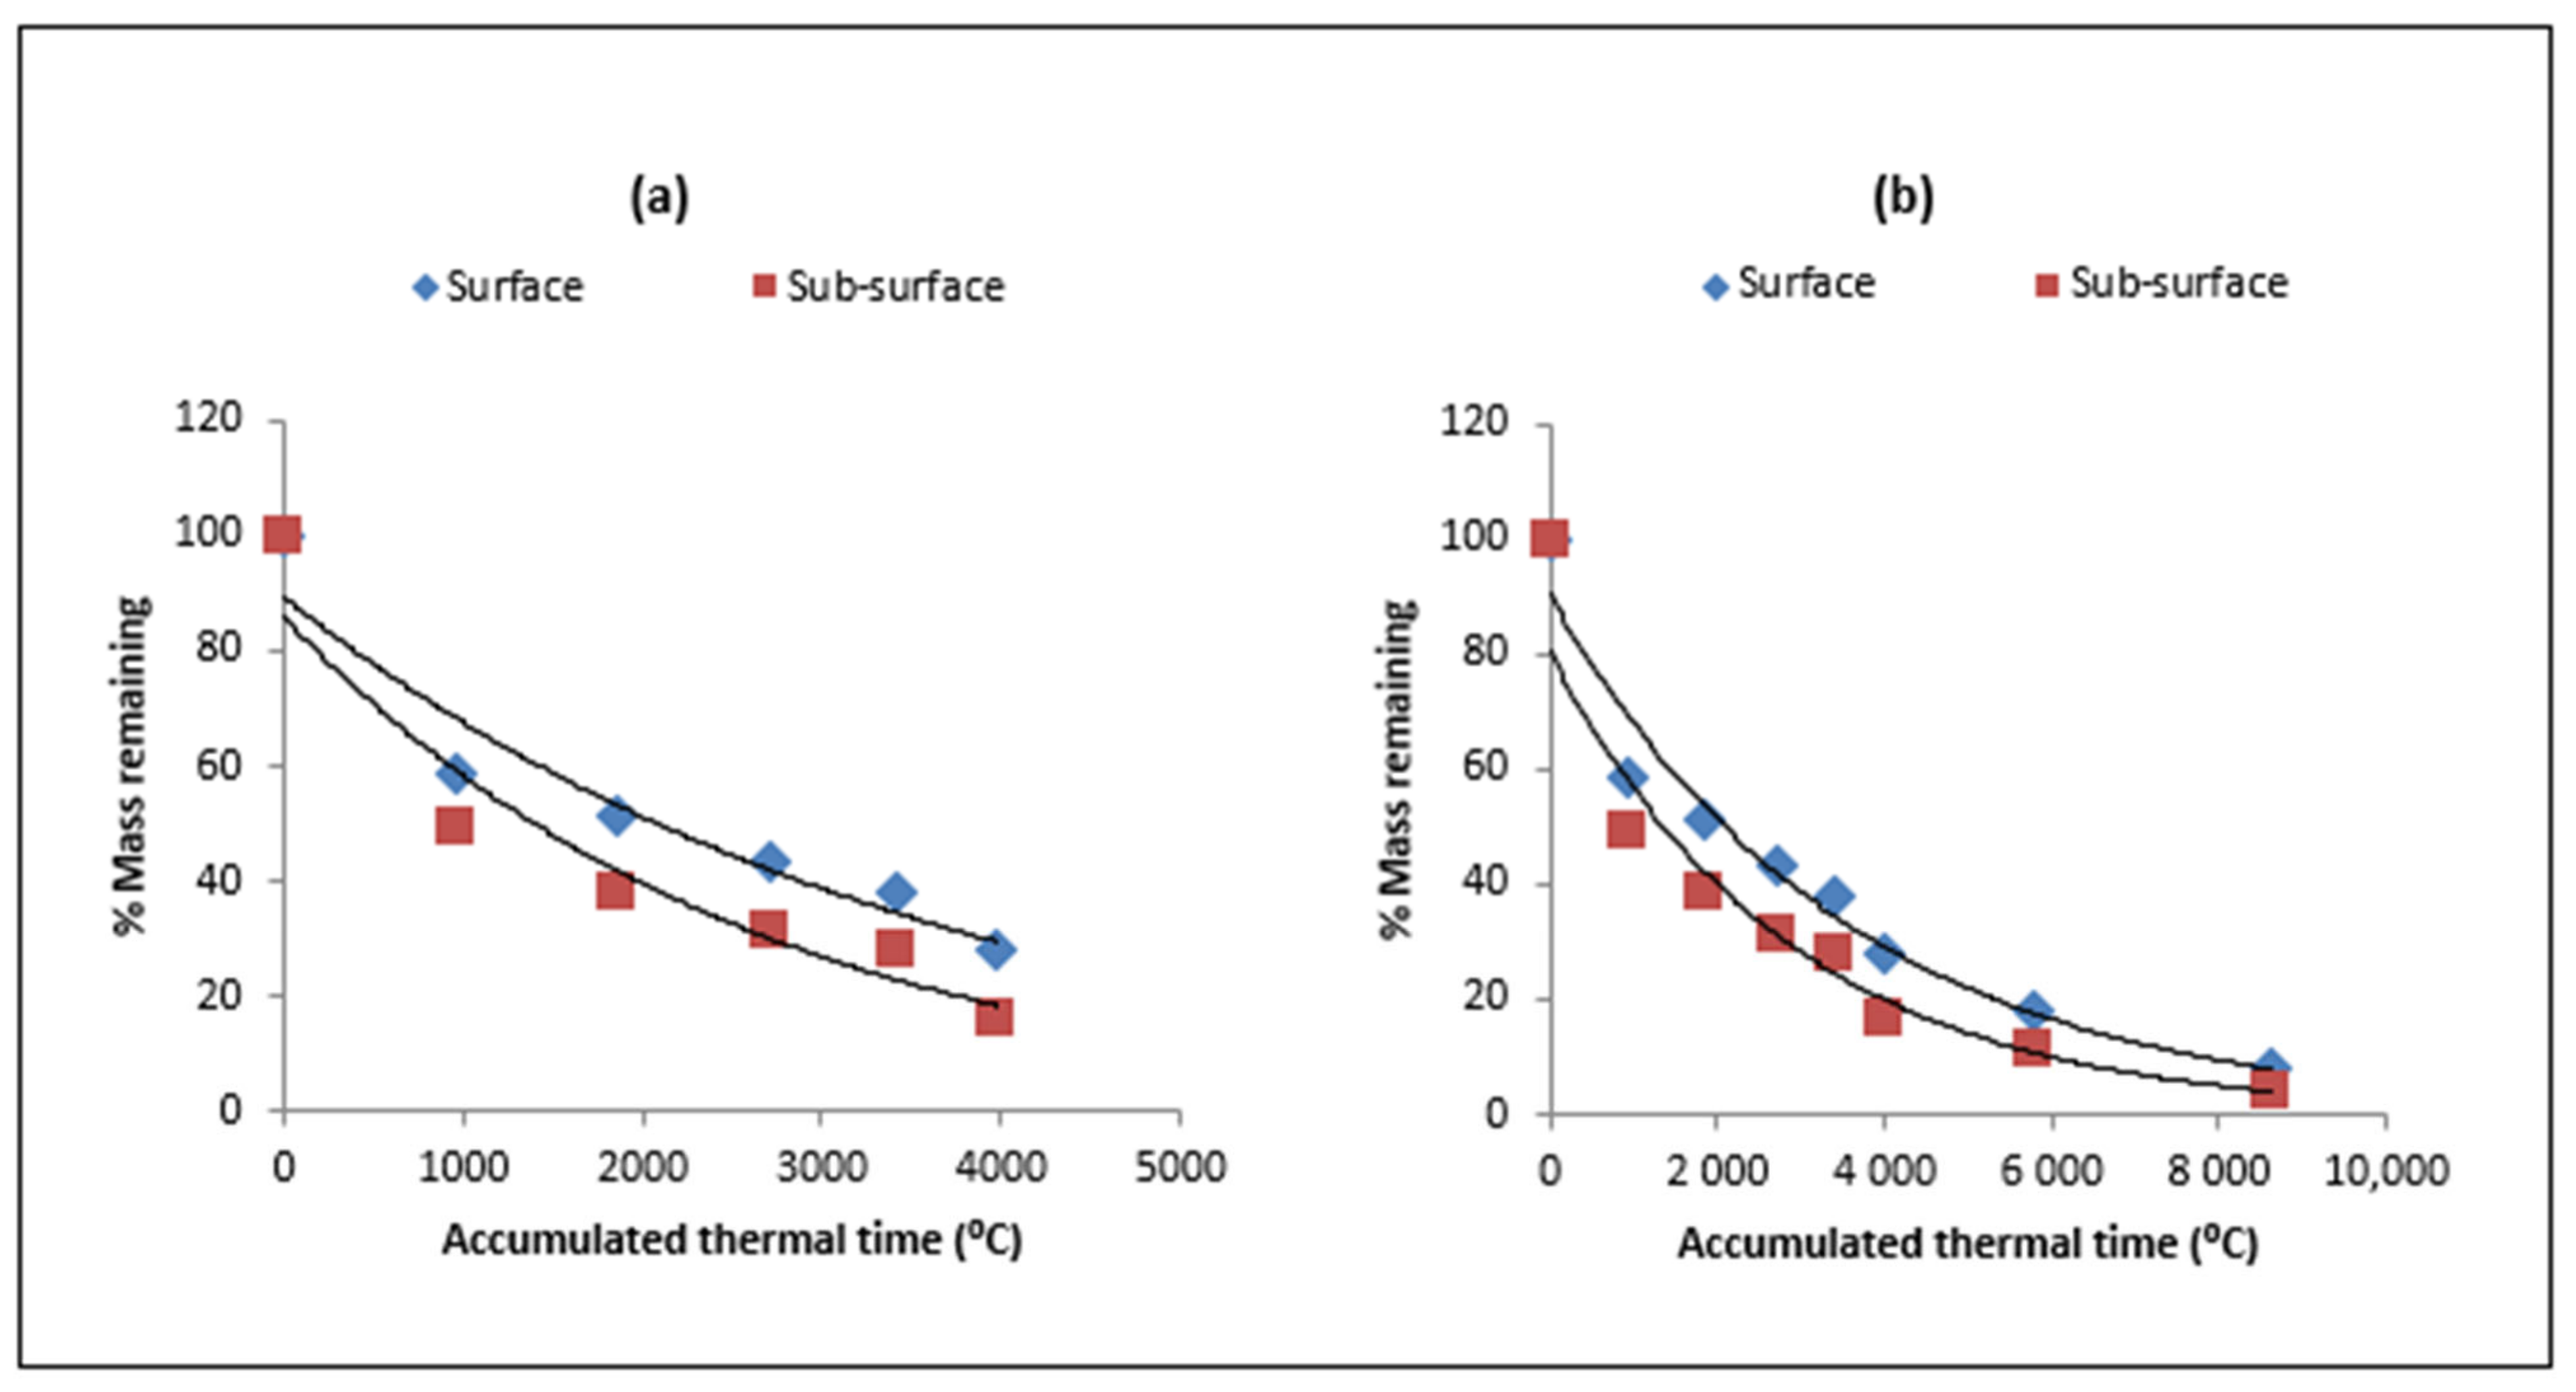
3.2. Residue Decomposition

Residue decomposition as measured by mass loss was influenced by the decomposition cycle, the residue type, and the method of placement. The mass of all the residue decreased rapidly during the initial period of decomposition followed by a slow rate of decline. For example, by 778 ATT (or 60 days after placement), the mass loss for the surface placed and sub-surface (buried) maize residue was 20% and 42%, respectively (Figure 2a). The surface-placed maize stover lost 53% of the initial mass by 1754 ATT (or 120 days), while the residue-placed below-surface was found to be 39% of the initial weight (Figure 2). The corresponding values for 2474 ATT (150 days) for the maize residue were 62% and 77%. At the completion of a one-year decomposition cycle (8582 ATD), the maize residue mass left was 7.4% and 3.0% of the at-surface and below-surface placed residues, respectively (Figure 2b).
Surface-placed wheat, mung bean, and a mix of wheat + mung bean residue had lost 23%, 48%, and 42% of its initial mass by ATT 952 °C (30 days), respectively (Figure 3, Figure 4 and Figure 5). The corresponding values for sub-surface-placed residues were 39%, 67%, and 51%. By 2707 ATT (90 days), wheat residue lost 52% and 65% of the initial mass under the surface-placed and sub-surface placed treatments, respectively (Figure 3), whereas surface-placed mung bean and a mix of wheat + mung bean residue lost 61% and 57% of their initial mass by 2707 ATT, respectively. The corresponding values for sub-surface-placed residues were 73% and 69% (Figure 4 and Figure 5). At the completion of the one-year cycle (8634 ATT), the residue mass of wheat, mung bean, and wheat + mung bean recovered was of the order of 9.1%, 6.6%, and 7.6% in surface placement and 4.9%, 3.5%, and 4.1% for sub-surface-placed residues, respectively.
The first-order rate constants (k × 104) for decomposition of surface-placed maize stover, wheat stubbles, mung bean residue, and wheat + mung bean residue for a 150-day decomposition cycle were 4.1, 3.0, 3.3, and 2.8, respectively (Table 3). The corresponding values for sub-surface-placed residues were higher (except mung bean) compared to surface-placed residues, and the values were 5.6, 4.0, 4.0, and 3.9, respectively. The decomposition-rate constants for surface-placed residues ranged from 2.8 for wheat and mung bean + to 3.1 for maize stover for a 365-day decomposition cycle (Table 3). The values of the rate constant for sub-surface residues ranged from 3.3 × 10⁴ for the wheat residue to 4.1 × 10⁴ for maize stover (Table 4). The decomposition rate for sub-surface placement was 21 to 30% higher compared to surface-placed residues in a 150-day decomposition cycle (Table 5). The relative increase in the rate constant for sub-surface placement was lower by 40% (mean of 4 residues) for a 365-day compared to 150-day decomposition cycle (Table 5 and Table 6).

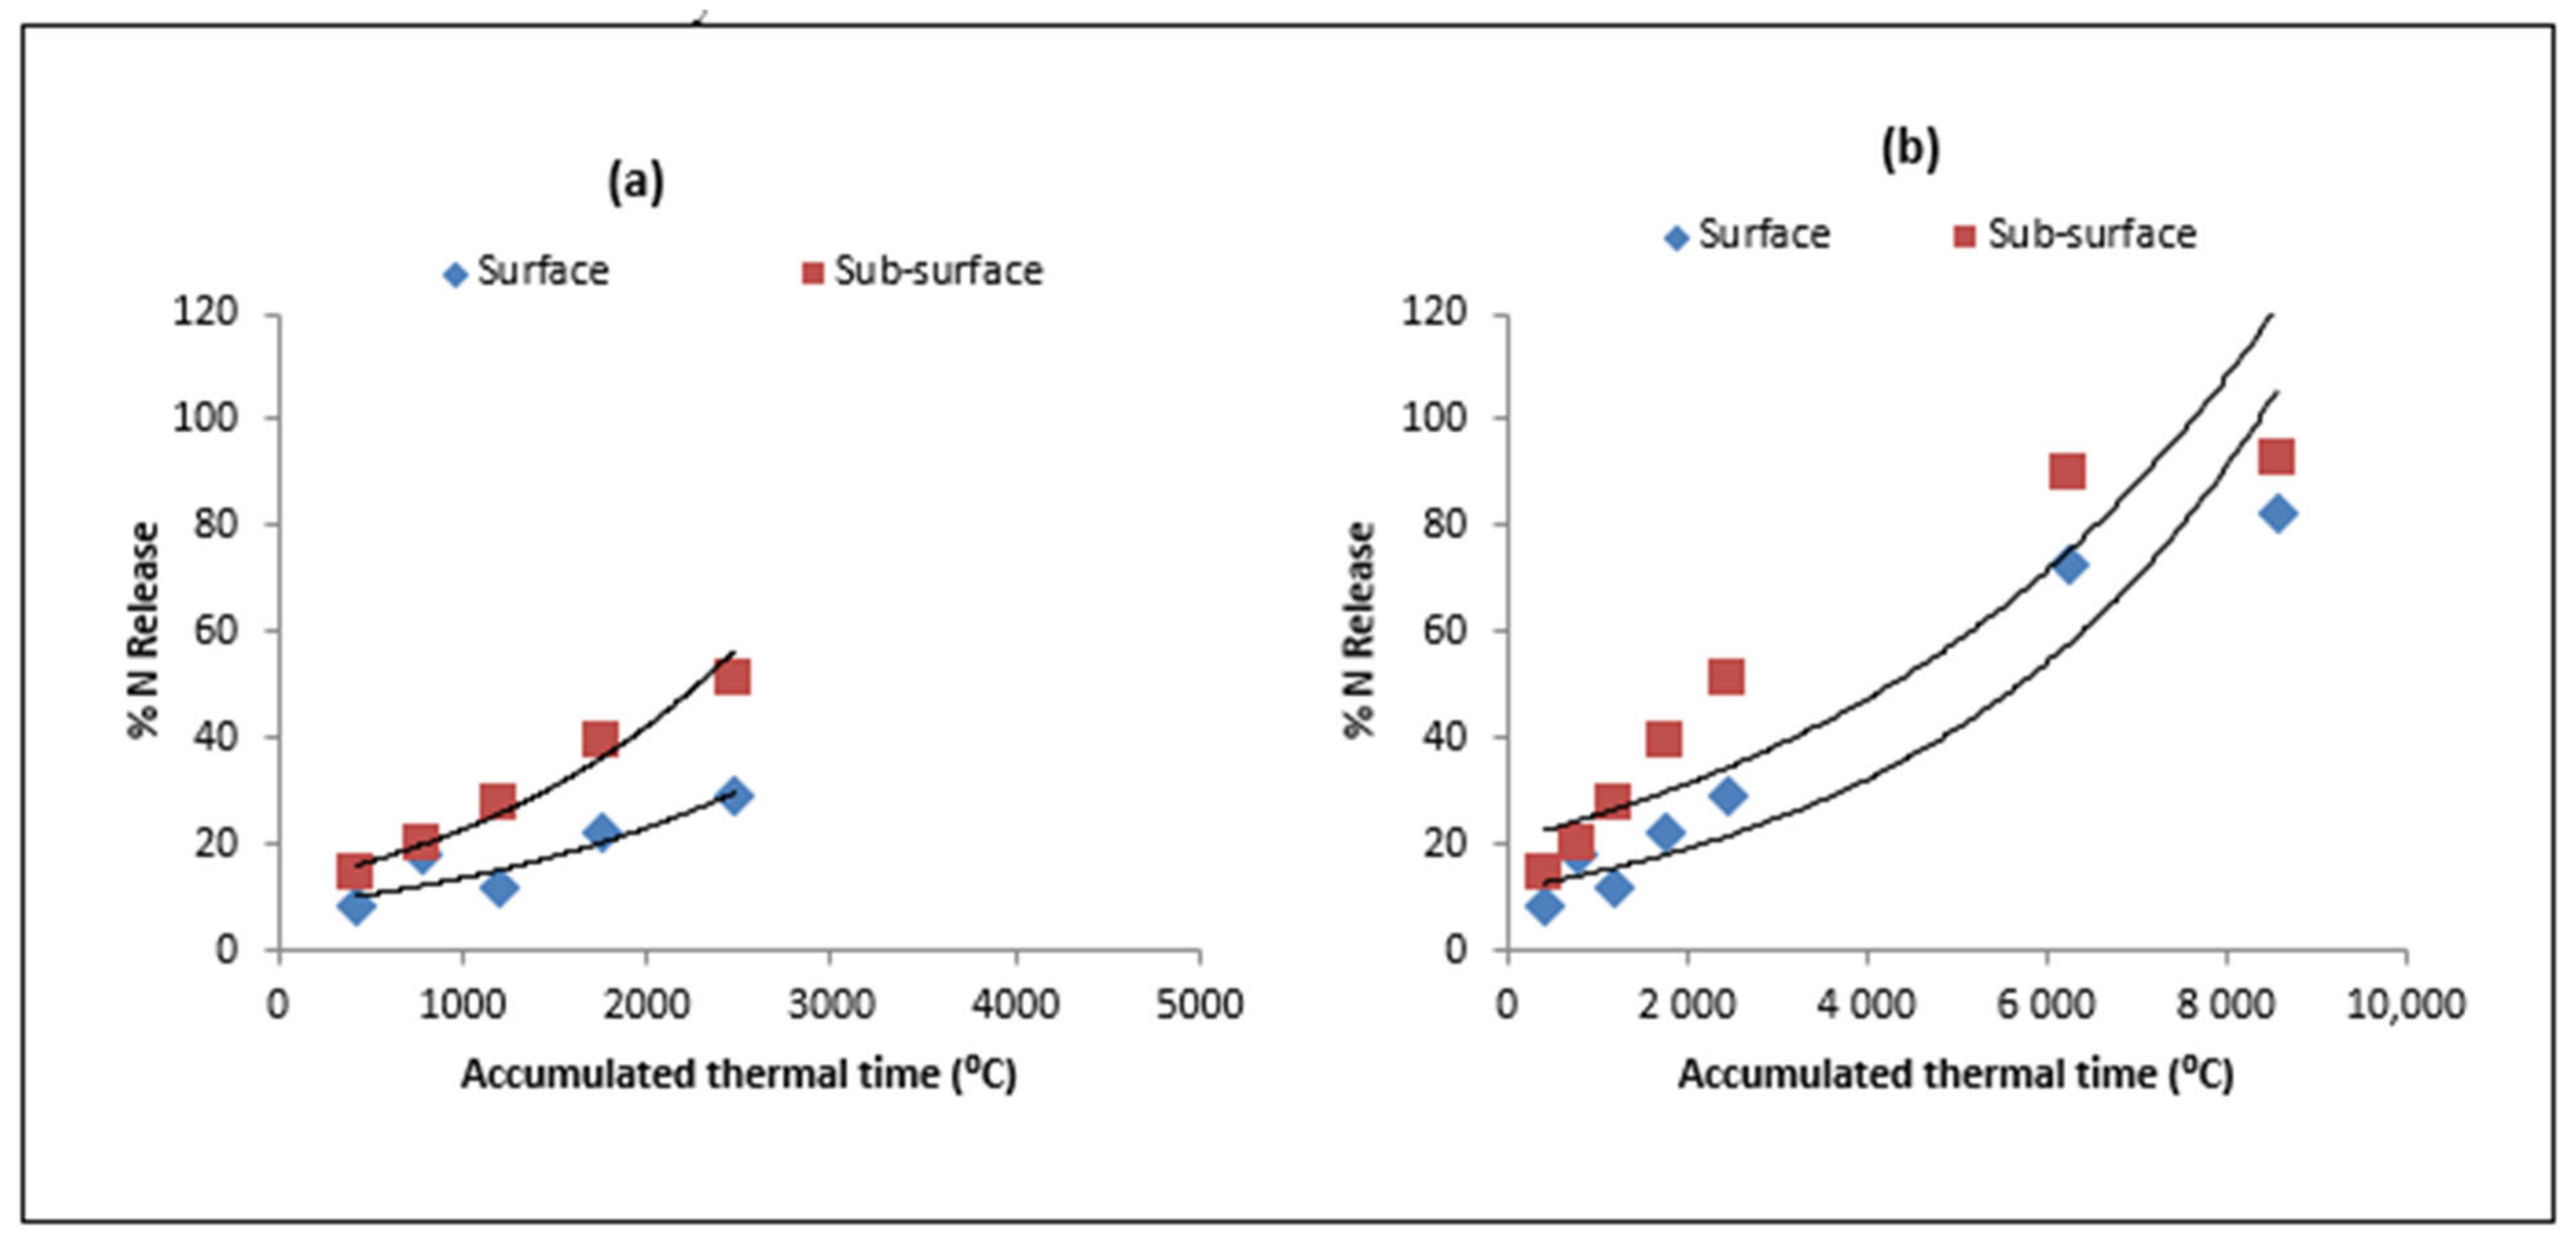
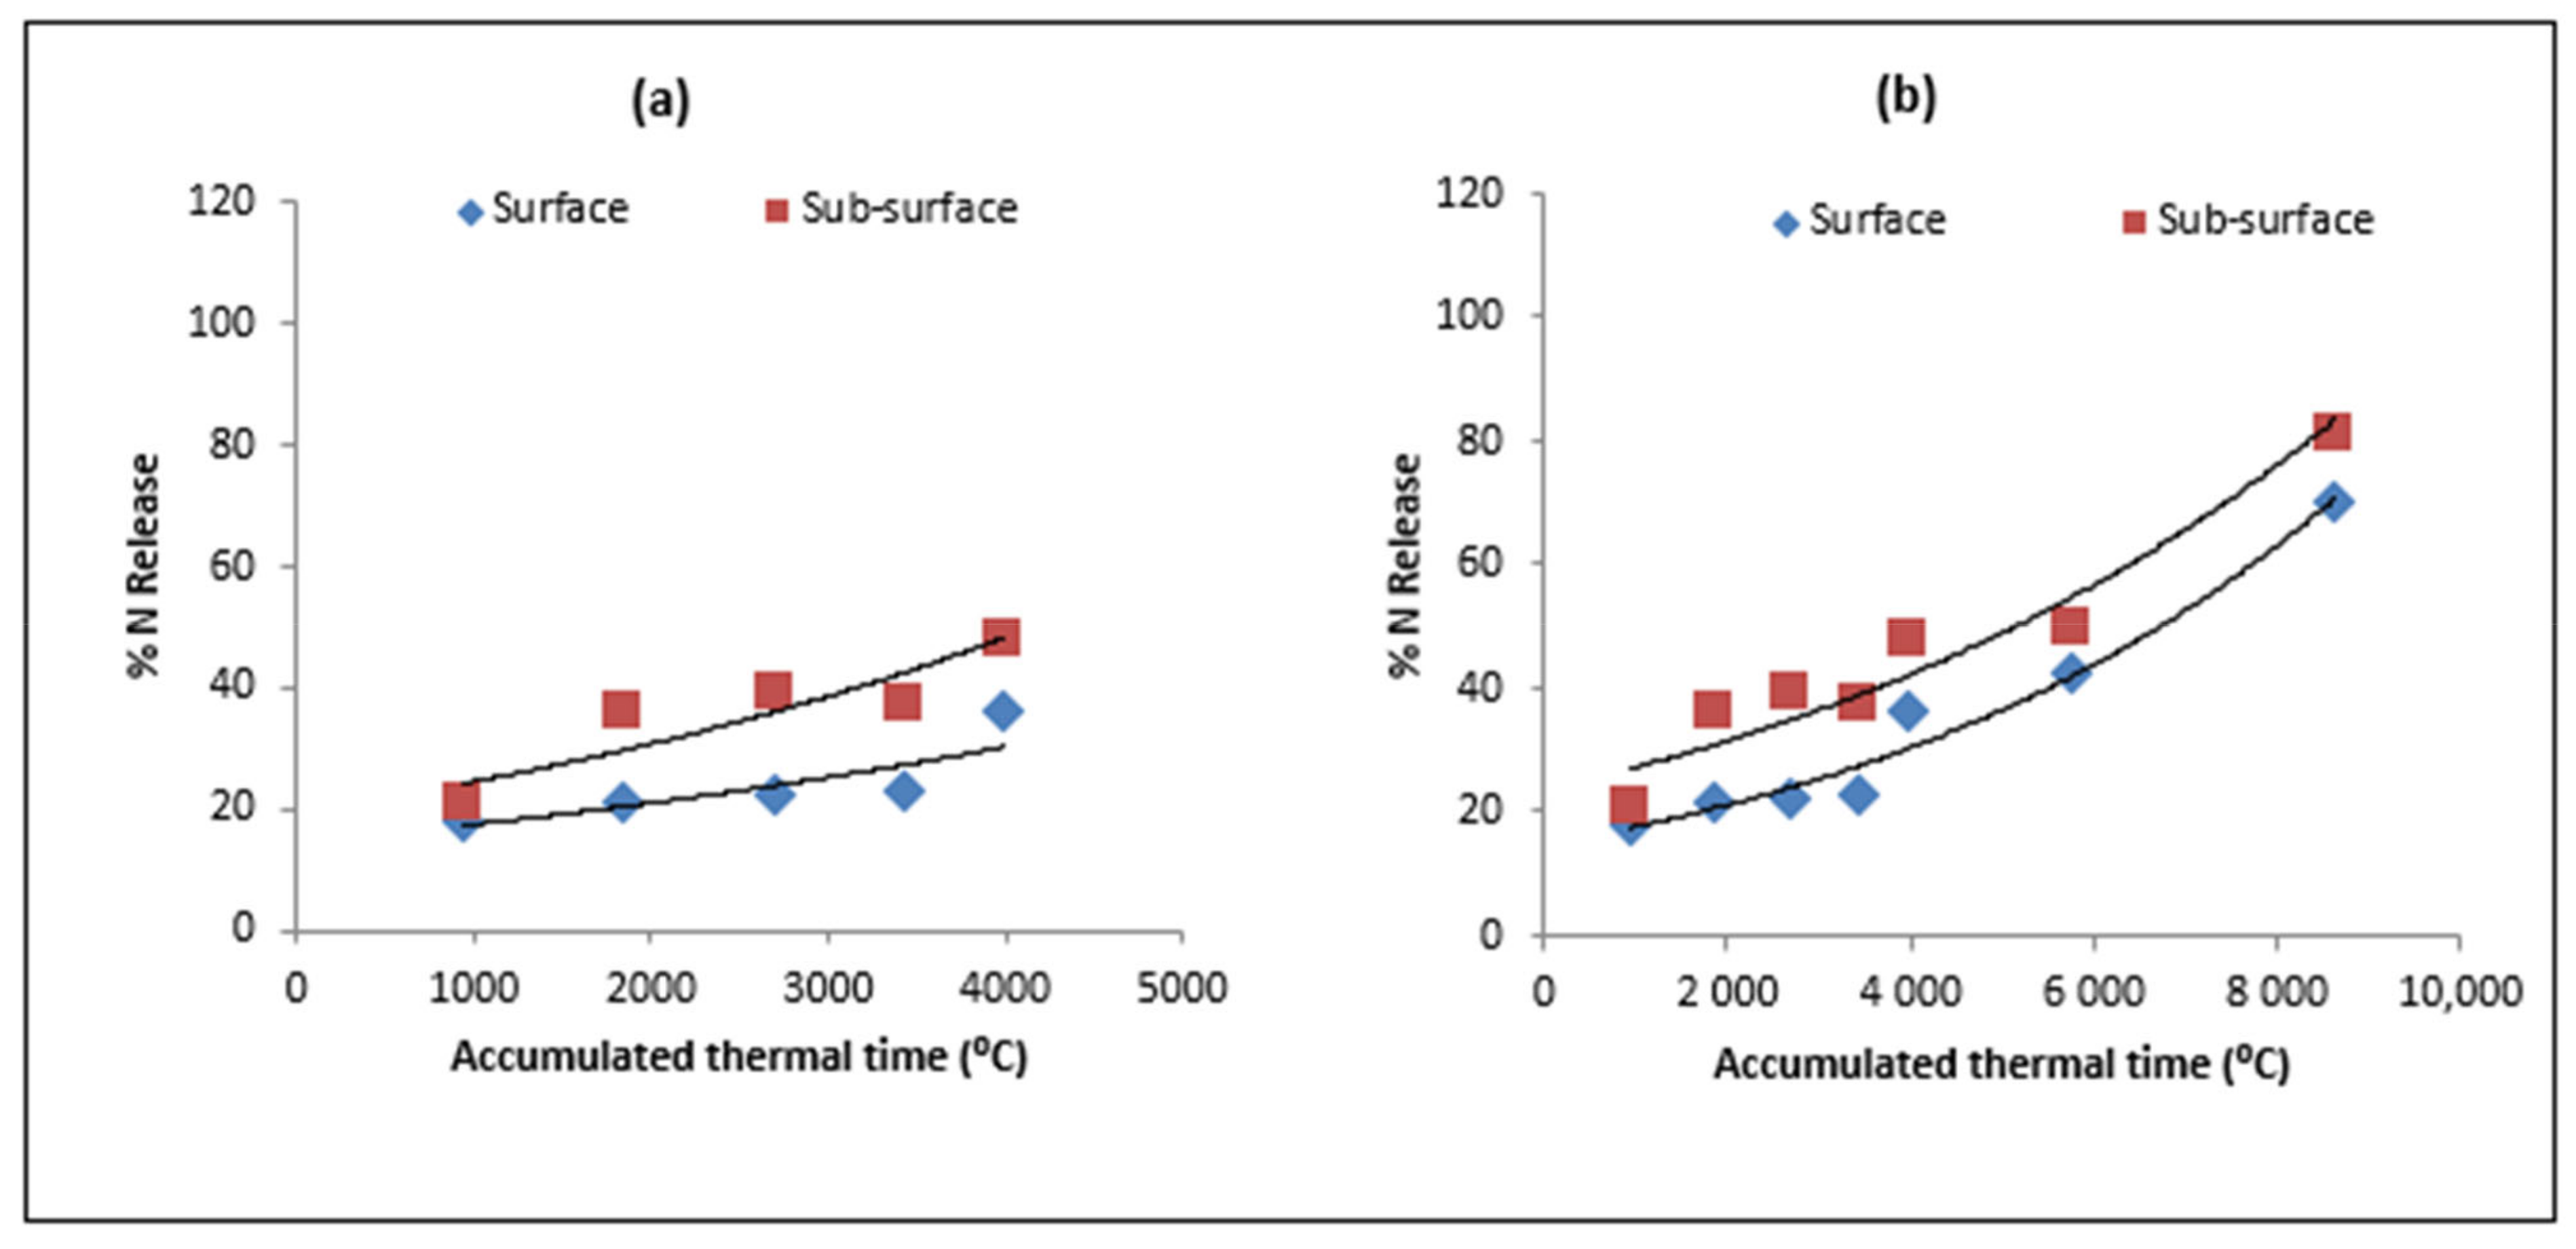
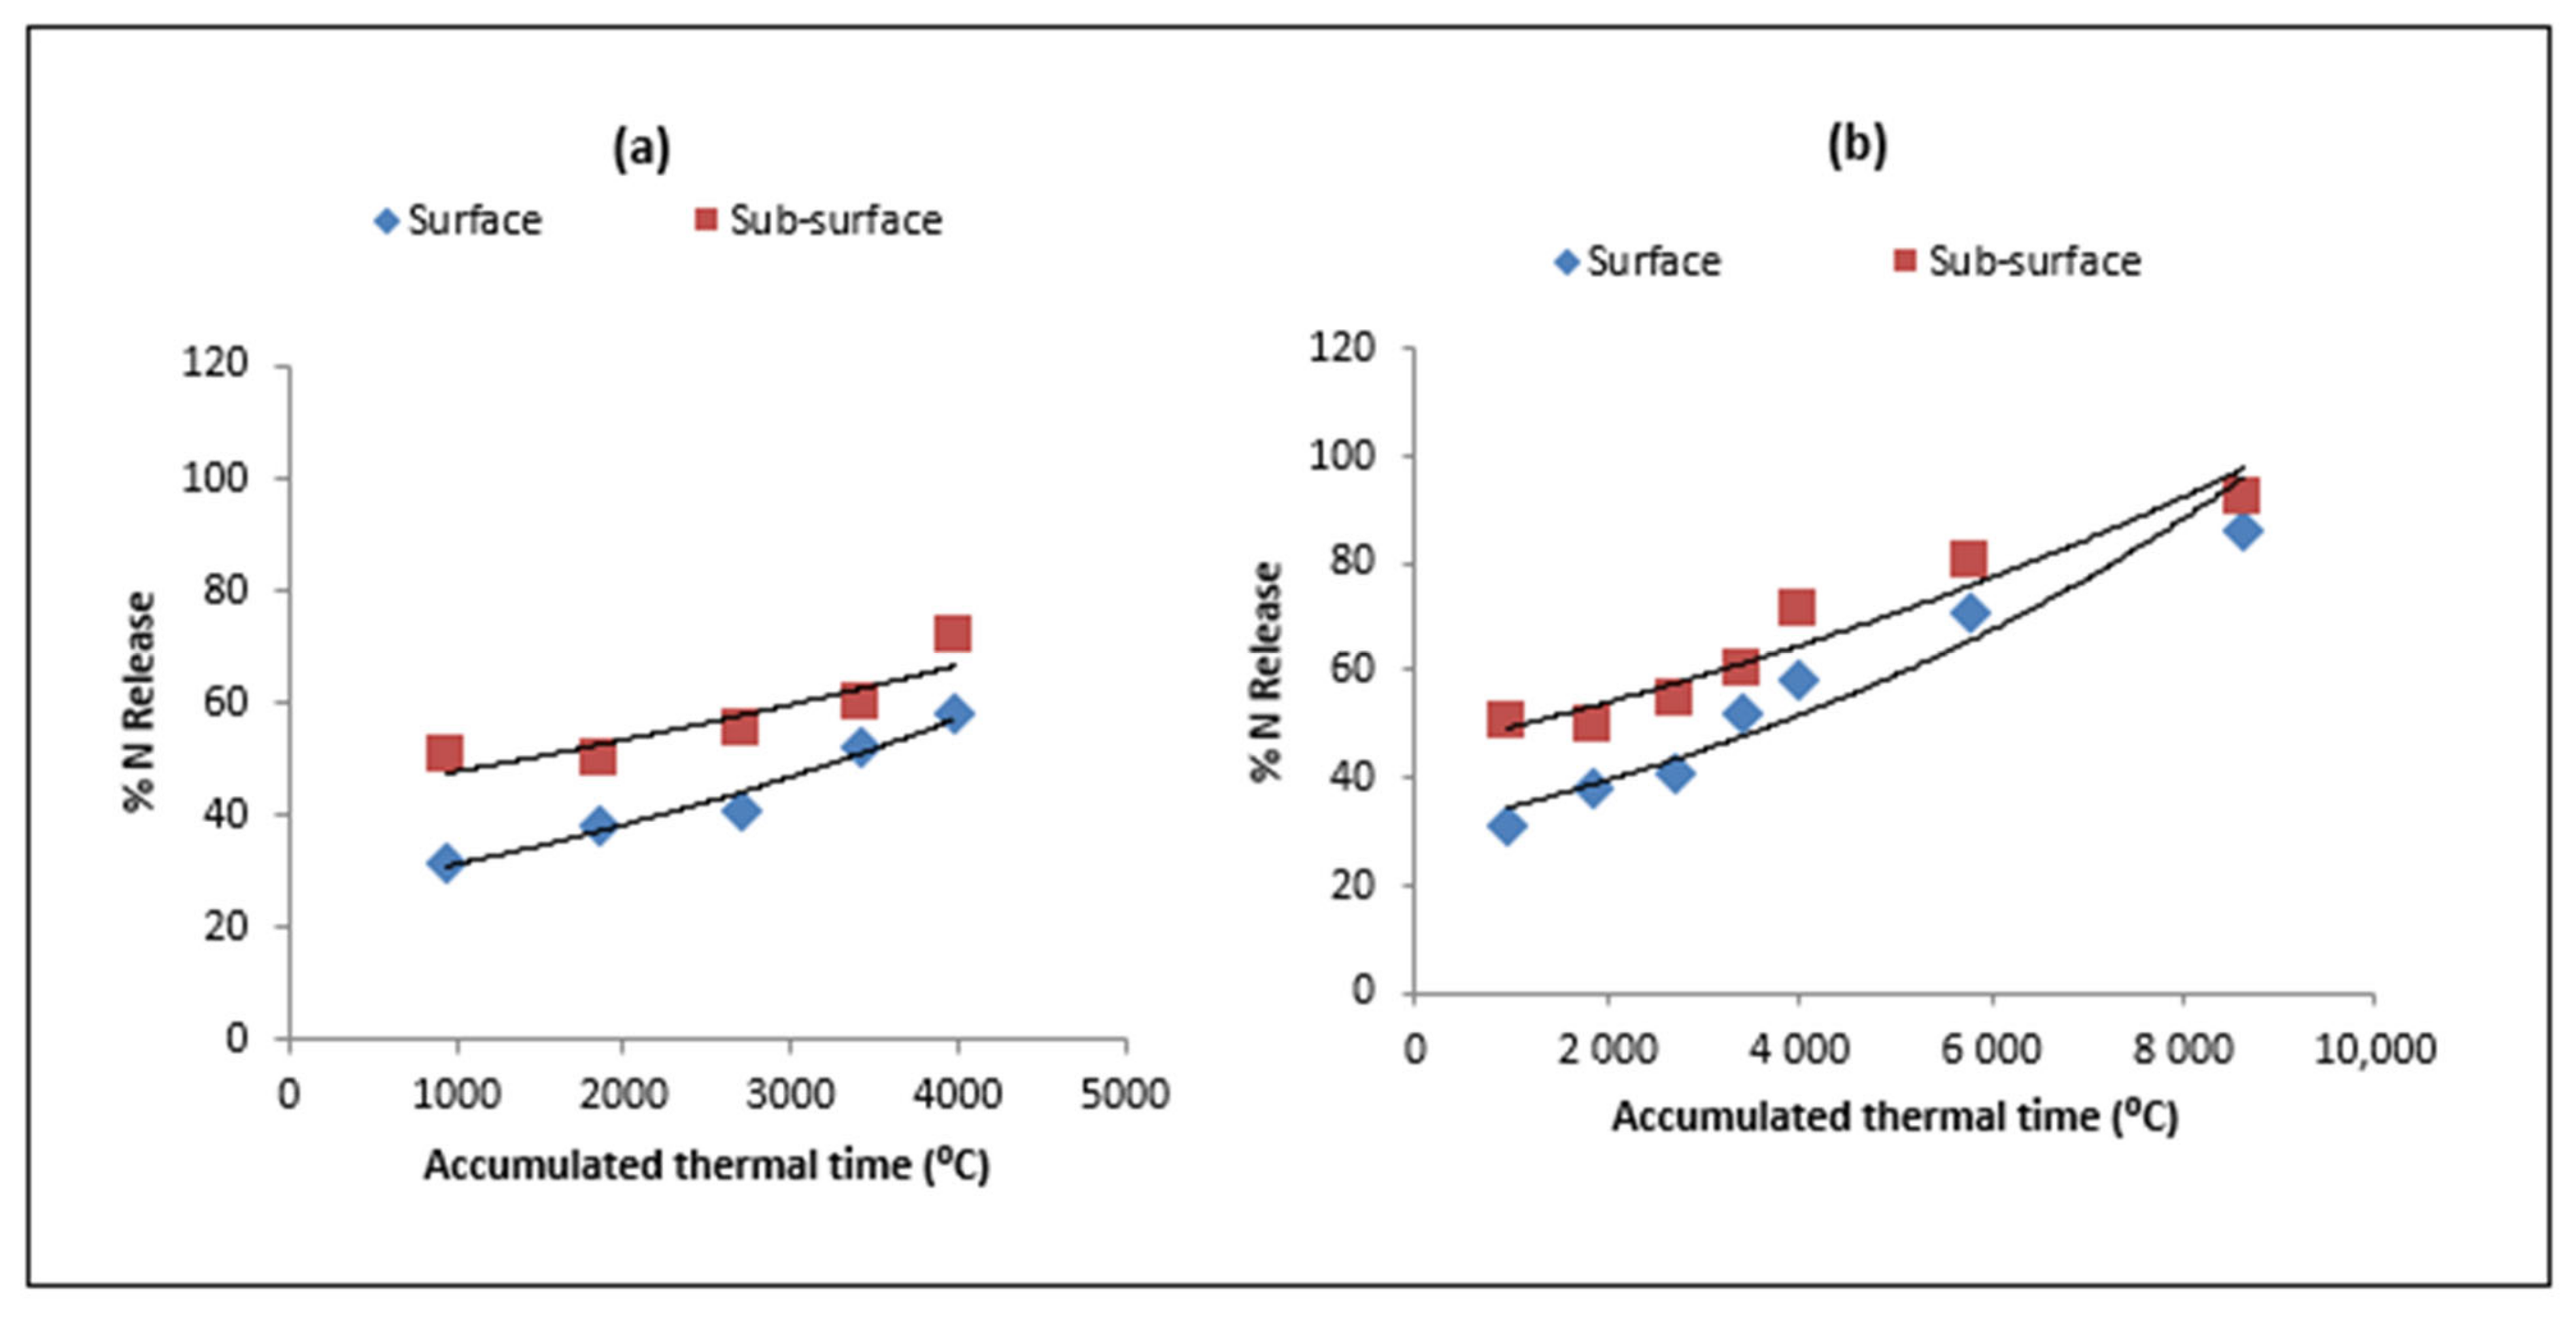
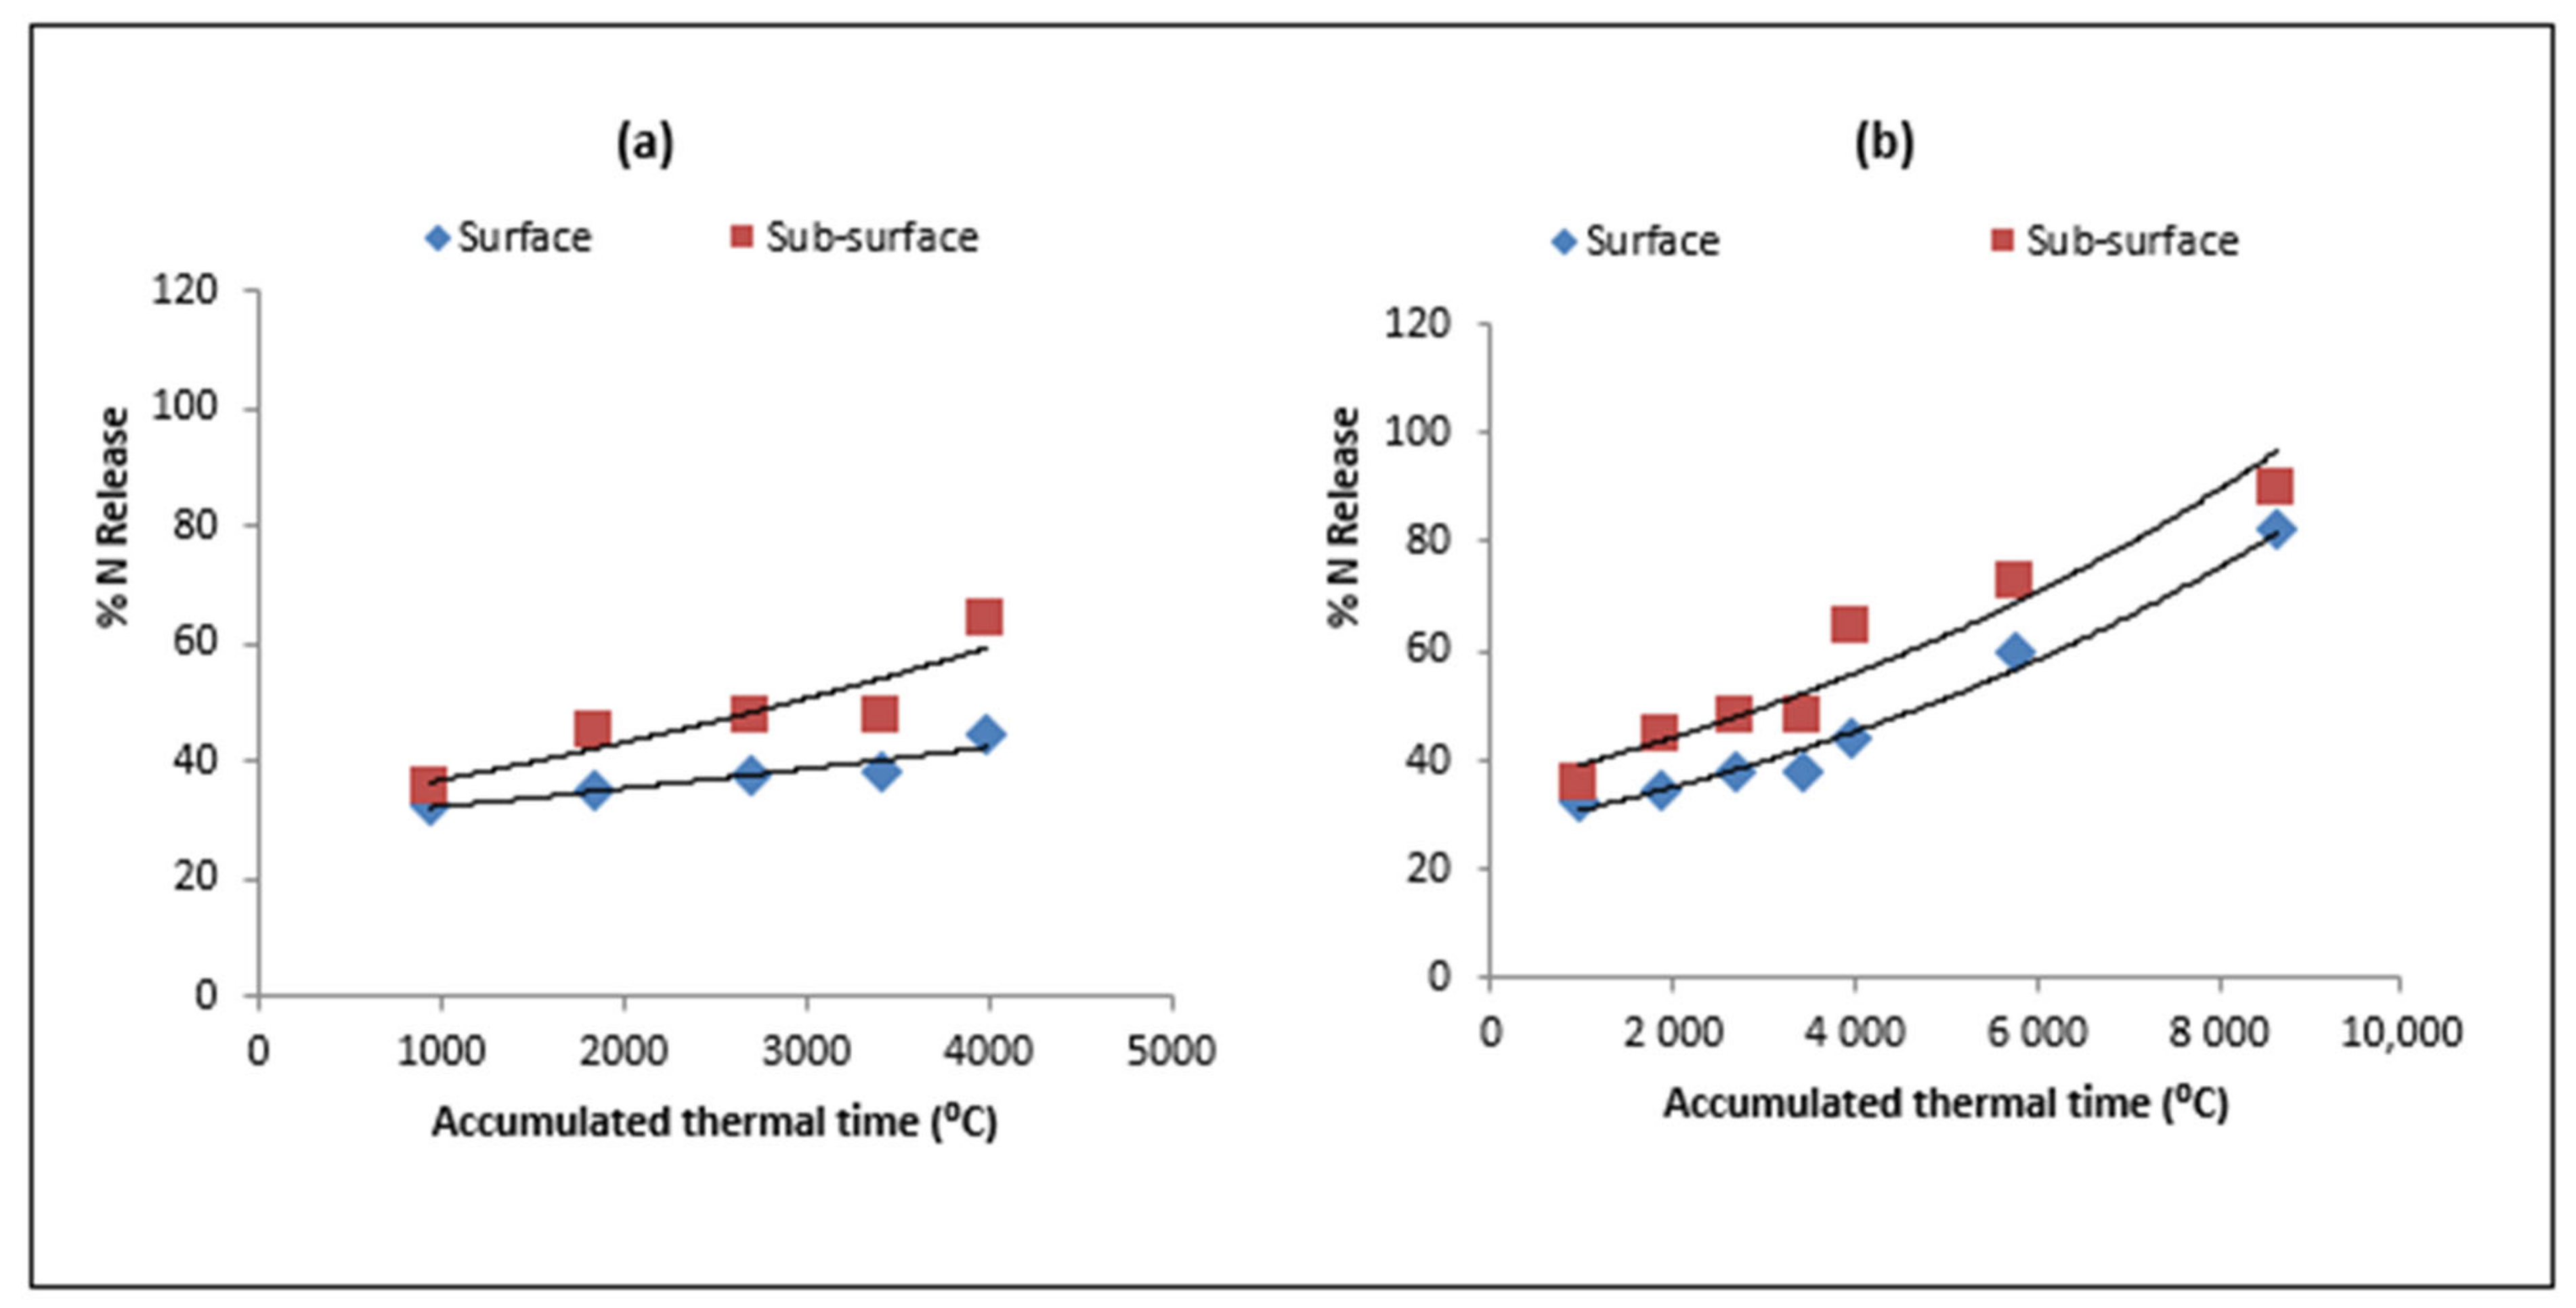
3.3. Nitrogen Release

The residue type and its placement strongly influenced N-release behaviour during all the decomposition cycles (Figure 6, Figure 7, Figure 8 and Figure 9). In surface- and sub-surface-placed maize stover, the total N release by 778 ATT (or 60 days) was 17.9 and 20.2% of the initial value, respectively (Figure 6). By 1754 ATT (120 days), the N release from sub-surface- and surface-placed maize stover increased to 39.3% and 21.9%, respectively (Figure 6). At the end of the 150-day (ATT 2474) and 365-day decomposition cycle (8582 ATT), the total amount of N release from surface-placed maize stover was 29.0 and 82.3%, respectively. The corresponding values for the sub-surface residues were 51.4 and 92.7%, respectively.
Similarly, the N release from the surface-placed wheat, mung bean, and wheat + mung bean residues at 952 ATT (30 days) was 18%, 31.4%, and 32.5%, respectively, while the values for sub-surface residues were 20.9%, 50.4%, and 35.9%, respectively (Figure 7, Figure 8 and Figure 9). The amount of N release by 2707 ATT (90 days) increased to 22.3%, 40.9%, and 48.0% from surface-placed wheat, mung bean, and wheat + mung bean residues, respectively, and 39.3%, 55%, and 48% for sub-surface placed residues, respectively. By 3981 ATT (or the 150-day cycle) residues of wheat, mung bean, and wheat + mung bean released 36.1%, 58.1%, and 44.3% of initial N in surface-placed residues and 47.7%, 71.9%, and 64.5% in sub-surface-placed residues, respectively (Figure 7, Figure 8 and Figure 9). At the end of a 365-day study period (8634 ATT), the quantities of N released from the sub-surface-placed wheat, mung bean, and wheat + mung bean residues were 81.0%, 92.6%, and 90.0%, respectively. The corresponding values for surface-placed residues were 77.3%, 86.3%, and 82.0%, respectively.
The values of N-release-rate constants (k × 104) for surface-placed maize stover, wheat stubbles, mung bean residue and wheat + mung bean residue for a 150-day decomposition cycle were 5.3, 1.8, 2.0, and 0.91, respectively (Table 5). The corresponding values for sub-surface-placed residues were 6.2, 2.3, 1.1, and 1.6 × 10⁴, respectively. The decomposition-rate constants for a 365-day decomposition cycle for surface-placed residues ranged from 1.3 for mung bean and wheat + mung bean to 2.6 for maize stover (Table 6). The values of the rate constant for sub-surface residues ranged from 0.90 for mung bean to 2.1 for maize stover (Table 6). The rate of N release from each residue was lower for surface compared to sub-surface residues, and the values ranged from 17% for maize to 76% wheat + mung bean residue with a mean increase of 42% for a 150-day decomposition cycle. The values for the 365-day decomposition cycle were much lower and ranged from 8% for wheat + mung bean residue to 44% for mung bean residue (mean increase of 24%) (Table 5 and Table 6).

4. Discussion

4.1. Residue Decomposition Kinetics

The understanding of straw-decomposition dynamics is very important for improving the quality of soil and mitigating climate warming [43,49,59]. Our study showed that the decomposition of four crop residues using litter bags under field conditions in North-West India can be well described by a first-order simple exponential function for both 150-day and one-thermal-year decomposition cycles. By using thermal time instead of calendar time, our dataset allowed the measurement of remaining straw mass under diverse and fluctuating temperature conditions observed in the field. it was also reported that compared to the other models, the simple exponential model best described the decomposition of cover crops under field conditions in Nepal [60]. The short-term experimental studies (less than five years) have reported that the single-exponent equation adequately described the remaining straw C dynamics [61,62]. However, for medium-term experiments (≤10 years), the remaining straw C dynamics over time can be described better by a two-exponent equation [48]. Similarly, for long-term experiments (>10 years), the remaining straw C can be described better by a three-exponent equation with thermal time [43].
The weight of all the residues decreased rapidly in the beginning, and these stages of decomposition witnessed an increased loss of water-soluble compounds, a high activity of microbes, greater availability of less-available nutrients such as N and P, and the leaching/release of nutrients (mainly K), whereas, in later phases, carbon loss was related to elements required to decompose recalcitrant components such as lignin that accumulate in the remaining litter [62,63,64]. The remaining mass of different residues ranged from 14% to 23% for sub-surface residues and 23% to 38% for surface placement recorded after a 150-day decomposition cycle. Consistent with the findings of other researchers [14,29,62], decomposition rates were consistently faster in sub-surface-placed than in surface-placed residues as a result of greater soil–residue contact; a more favourable and stable microenvironment, particularly a soil moisture regime; and increased availability of exogenous N for decomposition by microorganisms [65,66]. However, it was reported a higher rate of decomposition of the legume residues when placed on the soil surface, while soil incorporation of residues of wheat and maize resulted in faster decomposition [67]. Our study revealed that 23% and 38% of maize stover was recovered from litter bags over the 150-day wheat-growing cycle in North-West India. Under a similar climate, it was recorded that 20% of sub-surface-placed and 50% of the surface-placed residues undecomposed (remaining) rice straw during the wheat-growing cycle [14]. W of decomposition for both the residues is similar when surface placed, the decomposition rate is lower for the sub-surface maize stover. Apart from differences in chemical properties, the differences in decomposition behaviour of the two residue types may be ascribed to the differences in soil management. it was also reported that irrespective of the placement method, the rice residues decompose at faster rate than residues of wheat and maize [41]. The higher mass loss was observed for the legume mung bean residue, which was mainly due to its high total N content and low C/N ratio compared to the other cereal residues. Residues with greater inherent N decompose more rapidly [62,67,68]. Studies suggested that the availability of nitrogen controls the decomposition of plant residues and particularly cereals with low N content; the soil decomposers are not unable absorb the residue or soil N [69] (Vahdat et al., 2011). Consistent with the results of Datta et al. (2019) [41], we did not observe an additive effect on the decomposition of the wheat + mung bean residue mixture when compared to their separate applications.

4.2. Nitrogen Release Dynamics

Similar to residue-decomposition dynamics, N-release dynamics of four crop residues was well described by a first-order simple exponential function for both 150-day and one-thermal-year decomposition cycles (Table 2, Table 3, Table 4 and Table 5; Figure 6, Figure 7, Figure 8 and Figure 9). As the decomposition progressed, the total N release from the residue increased, irrespective of the type of residue and the method of placement. The greater increase in the N release from the buried residue compared to the surface-placed residue was related to the residue mass loss or decomposition. The increase in litter N release with the increase in the decomposition period in the present study is in line with the observations of various researchers [70,71,72] who used plant residues with different C:N ratios. The greater release of carbon (though not measured directly), which is evident from a greater mass loss, led to an increase in N release from the residue and may also be attributed to microbial immobilization [14]. The N release from surface residues was reduced compared to sub-surface placement [14].
The higher rate of net N mineralization in mung bean (legume) residues containing high N concentration and a low C/N ratio compared to cereal (maize and wheat) residues with low N concentrations confirms the previous findings [31,69,73]. Kumar and Goh (2003) [74] studied net N mineralization from different organic materials and reported that it ranged to the tune of 35% from wheat residues to 81% from white clover (Trifoliumrepens) residues. These authors observed N immobilization throughout the study period for the two different residues. Our data indicate that the residue N concentration and/or the C/N ratio can be considered important plant-quality parameters to predict the N mineralization of added plant residues over a long period of decomposition. Considering residue masses of 6, 2.5, and 4.5 Mg ha−1 for maize, wheat, and mung bean residues, respectively, corresponding values for total N additions will be 32 kg, 8.0 kg, and 49 kg N ha−1 [75]. Our calculations show that the maize residue in wheat (growing cycle of about 150 days) will release 9, 13, and 16 kg N ha−1 by 90, 120, and 150 days from sub-surface residues, respectively. The corresponding values for surface-placed residues (conservation agriculture) were 4, 7, and 9 kg N ha−1. Thus, surface-placed maize residues will be a poor source of N for wheat during its active growth period (0–120 days). Since wheat stubbles supply only 8 kg N ha−1, the total N release during the maize season will be very little (2–3 kg N ha−1 only). The total N supply (release) from the mung bean residue to maize will be substantial (25–30 kg N ha−1 for sub-surface-placed residues and 19–22 kg ha−1 for surface-placed residues). After one thermal year, the total N release from maize and mung bean residues can be 26–30 kg and 42–45 kg N ha−1, respectively, irrespective of placement. The availability of nitrogen from maize residue is not sufficient to reduce the quantity of N fertilizers or its rate to the following crop over a short term. However, when mung bean residue is recycled, N management in the following maize needs to be adjusted in view of the predicted amount and the time of N release. A fraction of N released from crop residues is also prone to losses through leaching and nitrification–denitrification. The amount of N supplied through maize residue is not considerably high to reduce the N fertilizer rate applied to succeeding crops over a short term. However, it will be able to supply a significant amount of N with regular applications on a long-term basis.

4.3. Humification Coefficient

Our study showed that the humification coefficient (HC), an indicator of remaining straw C after one thermal year, depended on the type of straw and the method of its placement (Figure 2b, Figure 3b, Figure 4b, and Figure 5b). The values of HC for surface-placed residues (6.6 to 9.9%) were higher compared to sub-surface-placed residues (3.0 to 4.1%). The HC for surface-placed maize and wheat + mung bean residues were nearly similar, while wheat stubbles had the maximum value of HC (9.9%). The HC for different residues buried into soil was nearly similar and ranged from 3.0 to 4.1%. These findings indicate that the straw properties and the method of placement determined the value of C remaining (temperature was excluded). The HC is not a constant value for identical organic materials under different conditions. Our results are consistent with the data of Wang et al. (2016) [76] who reported that HCs were significantly affected by the type of organic material and the agricultural region. With respect to organic material properties, the lignin content and the C/N ratio determine the HC [43,77,78]. We did not record lignin content in the plant materials used in the study. The HC also depends on the soil nutrient status and climatic conditions [43]. However, Gregorich et al. (2016) [48] reported that soil properties had a minimal discernible influence on the remaining C rates based on 10 sites across agricultural regions. Smith et al. (2008) [79] estimated that the annual sequestration rate (proxy for HC) for ZT and residue management practices in warm-dry regions was about 0.10 Mg C ha−1 yr−1 (range between -0.21 and 0.40 Mg C ha−1 yr−1).In an earlier study, Gregorich et al. (2016) [25] reported that the HC (remaining wheat straw C in one thermal year) (ATT 3652.5 °C) was much higher (35%) than the values obtained from our study. This was obviously due to less than 50% of values for a thermal year (8608 °C) recorded for our region. Similarly, Cai et al. (2018) [43] reported high values of HC values for different plant materials, which ranged from 31% for maize straw to 40% for rice straw.

5. Conclusions

Our study showed that the lower decomposition and N release were observed when the residues were placed on the soil surface as compared to incorporated into the soil. The surface-placed maize residue under conservation agriculture is likely to contribute about 7 kg N ha−1 to the following wheat. Wheat stubbles will supply a small amount of N to the following maize because of low biomass additions. A mung bean residue with a low C/N ratio (either placed at surface or sub-surface) is a potential source of N for succeeding maize by releasing 20–30 kg N ha-1 during the maize season. No additive effects were observed when the mung bean residue was mixed with wheat residue.
Possible management alternatives that need to be evaluated are adjusting N release from the residue and N fertilizer application times to improve the synchronicity between crop-residue decomposition and wheat N uptake.

Author Contributions

Data curation, O.S.S., M.L.J. and Y.S.; formal analysis, O.S.S., R.K.G. and Y.S.; funding acquisition, M.L.J.; methodology, M.L.J., R.K.G., H.S.T., H.S.S. and Y.S.; supervision, M.L.J., R.K.G., H.S.S. and Y.S.; validation, M.L.J.; writing—original draft, O S S. and R.K.G.; writing—review & editing, M.L.J. and Y.S. All authors have read and agreed to the published version of the manuscript.

Funding

This research was funded by International Maize and Wheat Improvement Center, grant number CRP 3.1. And the APC was funded by Bill & Melinda Gates Foundation, grant number OPP1052535.

Institutional Review Board Statement

Not applicable.

Informed Consent Statement

Not applicable.

Data Availability Statement

Not applicable.

Acknowledgments

The authors gratefully acknowledge the International Maize and Wheat Improvement Centre (CIMMYT) for providing the funding support for the conduct of the study under the Cereal System Initiative for South Asia (CSISA) project funded by the Bill and Melinda Gates Foundation (BMGF) and the United States Agency for International Agricultural Research (USAID) and CGIAR Research Programmes Wheat Agri-Food Systems (WHEAT). We would like to thank the Borlaug Institute for South Asia (BISA) Ladhowal, (Punjab), India and the Punjab Agricultural University, Ludhiana, India for providing the facilities to carry out this research.

Conflicts of Interest

The authors declare no conflict of interest.

References

  1. Yadav, M.R.; Parihar, C.M.; Jat, S.L.; Singh, A.K.; Kumar, D.; Pooniya, V.; Parihar, M.D.; Saveipune, D.; Parmar, H.; Jat, M.L. Effectoflong-term till ageand diversified crop rotations on nutrient up-take, profitability and energetics of maize (Zea mays) in north-western India. Indian J. Agric. Sci. 2016, 86, 743–749. [Google Scholar]
  2. Sharma, P.C.; Jat, H.S.; Kumar, V.; Gathala, M.K.; Datta, A.; Yaduvanshi, N.P.S.; Choudhary, M.; Sharma, S.; Singh, L.K.; Saharawat, Y.; et al. Sustainable Intensification Opportunities under Current and Future Cereal Systems of North-West India; TechnicalBulletin: CSSRI/Karnal/2015/4; Central Soil Salinity Research Institute: Karnal, India, 2015; p. 46. [Google Scholar]
  3. Wang, X.; Wang, J.; Xu, M.; Zhang, W.; Fan, T.; Zhang, J. Carbon accumulation in arid croplands of north west China: Pedogenic carbonate exceeding organic carbon. Sci. Rep. 2015, 5, 11439. [Google Scholar] [CrossRef] [PubMed] [Green Version]
  4. Reicosky, D.C.; Archer, D.W. Moldboard plow tillage depth and short-term carbon dioxide release. Soil Tillage Res. 2007, 94, 109–121. [Google Scholar] [CrossRef]
  5. Ruhland, C.T.; Remund, A.J.; Tiry, C.M.; Secott, T.E. Litter decomposition of three lignin-deficient mutants of Sorghum bicolor during spring thaw. Acta Oncol. 2018, 91, 16–21. [Google Scholar] [CrossRef]
  6. Kassam, A.; Friedrich, T.; Derpsch, R. Global spread of conservation agriculture. Int. J. Environ. Stud. 2019, 76, 29–51. [Google Scholar] [CrossRef]
  7. Aulakh, M.S.; Manchanda, J.S.; Garg, A.K.; Kumar, S.; Dercon, G.; Nguyen, M.L. Crop production and nutrient use efficiency of conservation agriculture for soybean–wheat rotation in the Indo-Gangetic plains of Northwestern India. Soil Tillage Res. 2012, 120, 50–60. [Google Scholar] [CrossRef]
  8. Hassan, I.; Hussain, Z.; Akbar, G. Effect of Permanent Raised Beds on Water Productivity for Irrigated Maize-Wheat Cropping System. Australian Centre for International Agriculture Research Proceeding 121, of a Workshop on “Evaluation and Performance of Permanent Raised Bed Cropping Systems in Asia, Australia and Mexico. 2005. Available online: https://www.aciar.gov.au/sites/default/files/legacy/node/703/pr121_pdf_18149.pdf (accessed on 18 December 2021).
  9. Das, T.K.; Bhattacharyya, R.; Sudhishri, S.; Sharma, A.R.; Saharawat, Y.S.; Bandyopadhyay, K.K.; Sepat, S.; Bana, R.S.; Aggarwal, P.; Sharma, R.K.; et al. Conservation agriculture in an irrigated cotton–wheat system of the western In-do-Gangetic Plains: Crop and water productivity and economic profitability. Field Crops Res. 2014, 158, 24–33. [Google Scholar] [CrossRef]
  10. Jat, H.S.; Kumar, P.; Sutaliya, J.M.; Kumar, S.; Choudhary, M.; Yadvinder Singh Jat, M.L. Conservation agriculture based sustainable intensification of basmati rice-wheat system in North-West India. Arch. Agron. Soil Sci. 2019, 65, 1370–1386. [Google Scholar] [CrossRef]
  11. Govaerts, B.; Sayre, K.D.; Goudeseune, B.; DeCorte, P.; Lichter, K.; Dendooven, L.; Deckers, J. Conservation agriculture as a sustainable option for the central Mexican highlands. Soil Till. Res. 2009, 103, 222–230. [Google Scholar] [CrossRef]
  12. Jat, H.S.; Singh, G.; Singh, R.; Choudhary, M.; Jat, M.L.; Gathala, M.K.; Sharma, D.K. Management influence on maize–wheat system performance, water productivity and soil biology. Soil Use Manag. 2015, 31, 534–543. [Google Scholar] [CrossRef]
  13. Gathala, M.K.; Kumar, V.; Sharma, P.C.; Saharawat, Y.S.; Sharma, P.K.; Jat, H.S.; Singh, M.; Kumar, A.; Jat, M.L.; Humphreys, E.; et al. Optimizing intensive cereal-based cropping systems addressing current and future drivers of agricultural change in the north-western Indo-Gangetic plains of India. Agric. Ecosyst. Environ. 2013, 177, 85–97. [Google Scholar] [CrossRef]
  14. Gupta, R.K.; Ladha, J.K. Placement effects on rice residue decomposition and nutrient dynamics on two soil types during wheat cropping in rice–wheat system in north-western India. Nutr. Cycl. Agroecosyst. 2010, 88, 471–480. [Google Scholar]
  15. Hiloidhari, M.; Das, D.; Baruah, D.C. Bioenergy potential from crop residue biomass in India. Renew. Sustain. Energy Rev. 2014, 32, 504–512. [Google Scholar] [CrossRef]
  16. Berg, B.; McClaugherty, C. Plant Litter Decomposition Humus Formation. In Carbon Sequestration; Springer: Berlin/Heidelberg, Germany, 2003; p. 296. [Google Scholar]
  17. Singh, Y.; Sidhu, H.S. Management of cereal crop residues for sustainable rice-wheat production system in the Indo-Gangetic plains of India. Proc. Indian Nat. Sci. Acad. 2014, 80, 95–114. [Google Scholar] [CrossRef]
  18. National Academy of Agricultural Sciences. Innovative Viable Solution to Rice Residue Burning in Rice-Wheat Cropping System through Concurrent Use of Super Straw Management System-fitted Combines and Turbo Happy Seeder; Policy Brief No.2; National Academy of Agricultural Sciences: New Delhi, India, 2017; 16p. [Google Scholar]
  19. Scagnozzi, A.; Saviozzi, A.; Levi-Minzi, R.; Riffaldi, R. Nutrient release from decomposing crop residues in soil: A laboratory experiment. Am. J. Altern. Agric. 1997, 12, 10–13. [Google Scholar] [CrossRef]
  20. Hadas, A.; Kautsky, L.; Goek, M.; Kara, E.E. Rates of decomposition of plant residues and available nitrogen in soil, related to residue composition through simulation of carbon and nitrogen turn-over. Soil Biol. Biochem. 2004, 36, 255–266. [Google Scholar] [CrossRef]
  21. Blanco-Canqui, H.; Lal, R. Crop residue removal impacts on soil productivity and environmental quality. Crit. Rev. Plant Sci. 2009, 28, 139–163. [Google Scholar] [CrossRef]
  22. Carvalho, J.L.N.; Nogueirol, R.C.; Menandro, L.M.S.; Bordonal, R.O.; Borges, C.D.; Cantarella, H.; Franco, H.C.J. Agronomic and environmental implications of sugarcane straw removal: A major review. Glob. Chang. Biol. Bioenergy 2016, 9, 1181–1195. [Google Scholar] [CrossRef]
  23. Stavi, I.; Bel, G.; Zaady, E. Soil functions and ecosystem services in conventional, conservation, and integrated agricultural systems: A review. Agron. Sustain. Dev. 2016, 36, 1–12. [Google Scholar] [CrossRef] [Green Version]
  24. Johnson, J.M.F.; Wilhelm, W.W.; Karlen, D.L.; Archer, D.W.; Wienhold, B.; Lightle, D.T. Nutrient removal as a function of corn stover cutting height and cob harvest. BioEnergy Res. 2010, 3, 342–352. [Google Scholar] [CrossRef] [Green Version]
  25. Yadvinder-Singh; Kukal, S.S.; Jat, M.L.; Sidhu, H.S. Improving water productivity of wheat-based cropping systems in South Asia for sustained productivity. Adv. Agron. 2014, 127, 157–258. [Google Scholar]
  26. Polyakova, O.; Billor, N. Impact of deciduous tree species on litterfall quality, decomposition rates and nutrient circulation in pine stands. For. Ecol. Manag. 2007, 253, 11–18. [Google Scholar] [CrossRef]
  27. Heal, O.W.; Anderson, J.M.; Swift, M.J. Plant residue quality and decomposition: An historical overview. In Driven by Nature: Plant Residue Quality and Decom-Position; Cadisch, G., Giller, K.E., Eds.; CAB Int: Cambridge, UK, 1997; pp. 3–30. [Google Scholar]
  28. Singh, Y.; Singh, B.; Timsina, J. Crop residue management for nutrient cycling and improving soil productivity in rice-based cropping systems in the tropics. Adv. Agron. 2005, 85, 269. [Google Scholar]
  29. Abera, G.; Wolde-Meskel, E.; Bakken, L.R. Carbon and nitrogen mineralization dynamics in different soils of the tropics amended with legume residues and contrasting soil moisture contents. Biol. Fertil. Soils 2012, 48, 51–66. [Google Scholar] [CrossRef]
  30. Kriauciuniene, Z.; Velička, R.; Raudonius, S. The influence of crop residues type on their decomposition rate in the soil: A litterbag study. Zemdirbyste 2012, 99, 227–236. [Google Scholar]
  31. Trinsoutrot, I.; Recous, S.; Mary, B.; Nicolardot, B. C and N flux of decomposing 13C and 15N Brassica napus L.: Effect of residue composition and N content. Soil Biol. Biochem. 2000, 32, 1717–1730. [Google Scholar] [CrossRef]
  32. Redin, M.; Guénon, R.; Recous, S.; Schmatz, R.; de Freitas, L.L.; Aita, C.; Giacomini, S.J. Carbon mineralization in soil of roots from twenty crop species, as affected by their chemical composition and botanical family. Plant Soil 2014, 378, 205–214. [Google Scholar] [CrossRef]
  33. Wang, X.; Sun, B.; Mao, J.; Sui, Y.; Cao, X. Structural convergence of maize and wheat straw during two-year decomposition under different climate conditions. Environ. Sci. Technol. 2012, 46, 7159–7165. [Google Scholar] [CrossRef]
  34. Thippayarugs, S.; Toomsan, B.; Vityakon, P.; Limpinuntana, V.; Patanothai, A.; Cadisch, G.G. Interactions in decomposition and N mineralization between tropical legume residue components. Agric. Forest. Syst. 2008, 72, 137–148. [Google Scholar] [CrossRef]
  35. Salinas-Garcia, J.R.; Báez-González, A.D.; Tiscareño-López, M.; Rosales-Robles, E. Residue removal and tillage interaction effects on soil properties under rain-fed corn production in Central Mexico. Soil Tillage Res. 2001, 59, 67–79. [Google Scholar] [CrossRef]
  36. Yadvinder-Singh; Bijay-Singh; Ladha, J.K.; Khind, C.S.; Khera, T.S.; Bueno, C.S. Effects of residue decomposition on productivity and soil fertility in rice–wheat rotation. Soil Sci. Soc. Am. J. 2004, 68, 854–864. [Google Scholar] [CrossRef]
  37. Ambus, P.; Jensen, E.S. Crop residue management strategies to reduce N-losses-Interaction with crop N supply. Commun. Soil Sci. Plant Anal. 2001, 32, 981–996. [Google Scholar] [CrossRef]
  38. Beare, M.H. Fungal and bacterial pathways of organic matter decomposition and nitrogen mineralization in arable in arable soils. In Soil Ecology in Sustainable Agricultural Systems; Brussard, L., Frrera-Cerrato, R., Eds.; Lewis Publishers: Boca Raton, FL, USA, 1997; pp. 37–70. [Google Scholar]
  39. Cookson, W.R.; Beare, M.H.; Wilson, P.E. Effects of prior crop residue management onmicrobial properties and crop residue decomposition. Appl. Soil Ecol. 1998, 7, 179–188. [Google Scholar] [CrossRef]
  40. Wang, H.; Curtin, D.; Jame, Y.W.; McConkey, B.G.; Zhou, H.F. Simulation of soil carbon dioxide flux during plant residue decomposition. Soil Sci. Soc. Am. J. 2001, 66, 1304–1310. [Google Scholar] [CrossRef]
  41. Datta, A.; Jat, H.S.; Yadav, A.K.; Choudhary, M.; Sharma, P.C.; Rai, M.; Singh, L.K.; Majumder, S.P.; Choudhary, V.; Jat, M.L. Carbon mineralization in soil as influenced by crop residue type and placement in an Alfisols of Northwest India. Carbon Manag. 2019, 10, 37–50. [Google Scholar] [CrossRef] [PubMed]
  42. Thomas, R.J.; Asakawa, N.M. Decomposition of leaf litter from tropical forage grasses and legumes. Soil Biol. Biochem. 1993, 25, 1351–1361. [Google Scholar] [CrossRef]
  43. Cai, A.; Liang, G.; Zhang, X.; Zhang, W.; Li, L.; Rui, Y.; Xu, M.; Luo, Y. Long-term straw decomposition in agroecosystems described by a unified three-exponentiation equation with thermal time. Sci. Total Environ. 2018, 636, 699–708. [Google Scholar] [CrossRef]
  44. Williams, L.K.; Shaw, J.D.; Sindel, B.M.; Wilson, S.C.; Kristiansen, P. Longevity, growth and community ecology of invasive Poaannua across environmental gradients in the subantarctic. Basic Appl. Ecol. 2018, 29, 20–31. [Google Scholar] [CrossRef] [Green Version]
  45. Pinheiro, J.; Bates, D.; DebRoy, S.; Sarkar, D. Core Team R Nlme: Linear and nonlinear mixed effects models. R Package Version 2016, 3, 1–137. [Google Scholar]
  46. Coppens, F.; Garnier, P.; Findeling, A.; Merckx, R.; Recous, S. Decomposition of mulched versus incorporated crop residues: Modelling with PASTIS clarifies interactions between residue quality and location. Soil Biol. Biochem. 2007, 39, 2339–2350. [Google Scholar] [CrossRef]
  47. Da Silva, W.B.; Périco, E.; Dalzochio, M.S.; Santos, M.; Cajaiba, R.L. Are litterfall and litter decomposition processes indicators of forest regeneration in the neotropics? Insights from a case study in the Brazilian Amazon. For. Ecol. Manag. 2018, 429, 189–197. [Google Scholar] [CrossRef] [Green Version]
  48. Gregorich, E.G.; Janzen, H.; Ellert, B.H.; Helgason, B.L.; Qian, B.; Zebarth, B.J.; Angers, D.A.; Beyaert, R.P.; Drury, C.F.; Duguid, S.D.; et al. Litter decay con-trolled by temperature, not soil properties, affecting future soil carbon. Glob. Chang. Biol. 2016, 23, 1725–1735. [Google Scholar] [CrossRef]
  49. Lal, R. Crop residues as soil amendments and feedstock for bioethanol production. Waste Manag. 2008, 28, 747–758. [Google Scholar] [CrossRef]
  50. Liu, C.; Lu, M.; Cui, J.; Li, B.; Fang, C. Effects of straw carbon input on carbon dynamics in agricultural soils: A meta-analysis. Glob. Chang. Biol. 2014, 20, 1366–1381. [Google Scholar] [CrossRef] [PubMed]
  51. Zhang, X.; Sun, N.; Wu, L.; Xu, M.; Bingham, I.J.; Li, Z. Effects of enhancing soil organic carbon sequestration in the topsoil by fertilization on crop productivity and stability: Evidence from long-term experiments with wheat-maize cropping systems in China. Sci. Total Environ. 2016, 562, 247–259. [Google Scholar] [CrossRef] [Green Version]
  52. Amin, B.A.Z.; Chabbert, B.; Moorhead, D.; Bertrand, I. Impact of fine litter chemistry on lignocellu-lolytic enzyme efficiency during decomposition of maize leaf and root in soil. Biogeochemistry 2013, 117, 169–183. [Google Scholar] [CrossRef] [Green Version]
  53. Manzoni, S.; Piñeiro, G.; Jackson, R.B.; Jobbágy, E.G.; Kim, J.H.; Porporato, A. Analytical models of soil and litter decomposition: Solutions for mass loss and timedependent decay rates. Soil Biol. Biochem. 2012, 50, 66–76. [Google Scholar] [CrossRef]
  54. Janssen, B.H. A simple method for calculating decomposition and accumulation of ‘young’ soil organic matter. Plant Soil 1984, 76, 297–304. [Google Scholar] [CrossRef]
  55. Galvez, A.; Sinicco, T.; Cayuela, M.L.; Mingorance, M.D.; Fornasier, F.; Mondini, C. Short term effects of bioenergy by-products on soil C and N dynamics, nutrient availability and biochemical properties. Agric. Ecosyst. Environ. 2012, 160, 3–14. [Google Scholar] [CrossRef]
  56. Goering, H.K.; Van Soest, P.J. Forage Fiber Analyses (Apparatus, Reagents, Procedures, and Some Applications); Agriculture handbook no. 379; Agriculture Research Service USDA: Washington, DC, USA, 1970; p. 20.
  57. Keeny, D.R.; Nelson, D.W. Inorganic forms of nitrogen. In Methods of Soil Analysis, Part 2; Black, C.A., Ed.; American Society of Agronomy: Madison, WI, USA, 1982; pp. 643–698. [Google Scholar]
  58. Walkley, A.; Black, I.A. An examination of the Degtjareff method for determining soil organic matter and a proposed modification of the chromic acid titration method. Soil Sci. 1934, 37, 29–38. [Google Scholar] [CrossRef]
  59. Luo, Y.; Keenan, T.F.; Smith, M. Predictability of the terrestrial carbon cycle. Glob. Chang. Biol. 2015, 21, 1737–1751. [Google Scholar] [CrossRef]
  60. Ghimire, B.; Ghimire, R.; VanLeeuwen, D.; Mesbah, A. Cover Crop Residue Amount and Quality Effects on Soil Organic Carbon Mineralization. Sustainability 2017, 9, 2316. [Google Scholar] [CrossRef] [Green Version]
  61. Wang, C.; Han, G.; Jia, Y.; Feng, X.; Tian, X. Insight into the temperature sensitivity of forest litter decomposition and soil enzymes in subtropical forest in China. J. Plant Ecol. 2011, 5, 279–286. [Google Scholar] [CrossRef] [Green Version]
  62. Hobbie, S.E.; Eddy, W.C.; Buyarski, C.R.; Adair, E.C.; Ogdahl, M.L.; Weisenhorn, P. Response of decomposing litter and its microbial community to multiple forms of nitrogen enrichment. Ecol. Monogr. 2012, 82, 389–405. [Google Scholar] [CrossRef]
  63. Gusewell, S.; Gessner, M.O. N: P ratios influence litter decomposition and colonization by fungi and bacteria in microcosms. Funct. Ecol. 2009, 23, 211–219. [Google Scholar] [CrossRef]
  64. Loranger, G.; Ponge, J.F.; Imbert, D.; Lavelle, P. Leaf decomposition in two semi-evergreen tropical forests: Influence of litter quality. Biol. Fertil. Soils 2002, 35, 247–252. [Google Scholar] [CrossRef] [Green Version]
  65. Schomberg, H.H.; Steiner, J.L.; Unger, P.W. Decomposition and nitrogen dynamics of crop residues: Residue quality and water effects. Soil Sci. Soc. Am. J. 1994, 58, 372–381. [Google Scholar] [CrossRef] [Green Version]
  66. Ghidey, F.; Alberts, E.E. Residue type and placement effects on decomposition: Field study and model evaluation. Trans. Am. Soc. Agric. Eng. 1993, 36, 1611–1617. [Google Scholar] [CrossRef]
  67. Jat, R.L.; Pramod, J.; Dotaniya, M.L.; Lakaria, B.L.; Rashmi, I.; Meena, B.P.; Shirale, A.O.; Meena, A.L. Carbon and nitrogen mineralization in vertisol as mediated by type and placement method of residue. Environ. Monit. Assess. 2018, 190, 439. [Google Scholar] [CrossRef]
  68. Cornwell, W.K.; Cornelissen, J.H.C.; Amatangelo, K.; Dorrepaal, E.; Eviner, V.T.; Godoy, O.; Hobbie, S.E.; Hoorens, B.; Kurokawa, H.; Pe’rez-Harguindeguy, N.; et al. Plant species traits are the predominant control on litter decomposition rates within biomes worldwide. Ecol. Lett. 2008, 11, 1065–1071. [Google Scholar] [CrossRef] [PubMed]
  69. Vahdat, E.; Nourbakhsh, F.; Basiri, M. Lignin content of range plant residues controls N mineralization in soil. Eur. J. Soil Biol. 2011, 47, 243–246. [Google Scholar] [CrossRef]
  70. Dubeux, J.C.B.; Sollenberger, L.E.; Interrante, S.M.; Vendramini, J.M.B.; Stewart, R.L. Litter decomposition and mineralization in Bahia grass pastures managed at different intensities. Crop Sci. 2006, 46, 1305–1310. [Google Scholar] [CrossRef]
  71. Hamadi, Z.; Steinberger, Y.; Kutiel, P.; Lavee, H.; Barness, G. Decomposition of Avenasterilis litter under arid conditions. J. Arid Environ. 2000, 46, 281–293. [Google Scholar] [CrossRef]
  72. Liu, K.; Sollenberger, L.E.; Silveira, M.L.; Vendramini, J.M.B.; Newman, Y.C. Grazing intensity and nitrogen fertilization affect litter responses in ‘Tifton 85% Bermuda grass pastures: II. Decomposition and nitrogen mineralization. Agron. J. 2011, 103, 163–168. [Google Scholar] [CrossRef]
  73. Abbasi, M.K.; Tahir, M.M.; Sabir, N.; Khurshid, M. Impact of the addition of different plant residues on nitrogen mineralization–immobilization turnover and carbon content of a soil incubated under laboratory conditions. Solid Earth 2015, 6, 197–205. [Google Scholar] [CrossRef] [Green Version]
  74. Kumar, K.; Goh, K.M. Nitrogen release from crop residues and organic amendments as affected by biochemical composition. Commun. Soil Sci. Plant Anal. 2003, 34, 2441–2460. [Google Scholar] [CrossRef]
  75. Sandhu, O.S.; Gupta, R.K.; Thind, H.S.; Jat, M.L.; Sidhu, H.S.; Yadvinder-Singh. Drip irrigation and nitrogen management for improving crop yields, nitrogen use efficiency and water productivity of maize-wheat system on permanent beds in north-west India. Agric. Water Manag. 2019, 219, 19–26. [Google Scholar] [CrossRef]
  76. Wang, J.; Lu, C.A.; Zhang, W.; Feng, G.; Wang, X.; Xu, M. Decomposition of organic materials in cropland soils across China: A meta-analysis. Acta Pedol. Sin. 2016, 53, 16–27. [Google Scholar]
  77. Nicolardot, B.; Recous, S.; Mary, B. Simulation of C and N mineralisation during crop residue decomposition: A simple dynamic model based on the C: N ratio of the residues. Plant Soil 2001, 228, 83–103. [Google Scholar] [CrossRef]
  78. Klotzbücher, T.; Kaiser, K.; Guggenberger, G.; Gatzek, C.; Kalbitz, K. A new conceptual model for the fate of lignin in decomposing plant litter. Ecology 2011, 92, 1052–1062. [Google Scholar] [CrossRef]
  79. Smith, P.; Martinio, D.; Cai, Z. Greenhouse gas mitigation in agriculture. Philos. Trans. R. Soc. B 2008, 363, 789–813. [Google Scholar] [CrossRef] [PubMed] [Green Version]
Figure 1. Mean temperature, evaporation, and rainfall during the crop seasons in 2014 and 2015 at Ladhowal (Ludhiana), Punjab, India.
Sustainability 14 00864 g001
Figure 2. Percent mass of maize residue remaining during the decomposition cycle as a function of accumulated thermal time as affected by the method of placement. (a) represents the 150-day decomposition cycle, and (b) represents the 365-day decomposition cycle.
Sustainability 14 00864 g002
Figure 3. Percent mass of wheat residue remaining during the decomposition cycle as a function of accumulated thermal time as affected by the method of placement. (a) represents the 150-day decomposition cycle, and (b) represents the 365-day decomposition cycle.
Sustainability 14 00864 g003
Figure 4. Percent mass of mung bean residue remaining during the decomposition cycle as a function of accumulated thermal time as affected by method of placement. (a) represents the 150-day decomposition cycle, and (b) represents the 365-day decomposition cycle.
Sustainability 14 00864 g004
Figure 5. Percent mass of wheat + mung bean residue remaining during the decomposition cycle as a function of accumulated thermal time as affected by method of placement. (a) represents the 150-day decomposition cycle, and (b) represents the 365-day decomposition cycle.
Sustainability 14 00864 g005
Figure 6. Percent N release (accumulative) from maize stover during the decomposition cycle as a function of accumulated thermal time as affected by the method of placement. (a) represents the 150-day decomposition cycle, and (b) represents the 365-day decomposition cycle.
Sustainability 14 00864 g006
Figure 7. Percent N release (accumulative) from wheat stubbles during the decomposition cycle as a function of the accumulated thermal time as affected by the method of placement. (a) represents the 150-day decomposition cycle, and (b) represents the 365-day decomposition cycle.
Sustainability 14 00864 g007
Figure 8. Percent N release (accumulative) from mung bean residue during the decomposition cycle as a function of accumulated thermal time as affected by the method of placement. (a) represents the 150-day decomposition cycle, and (b) represents the 365-day decomposition cycle.
Sustainability 14 00864 g008
Figure 9. Percent N release (accumulative) from wheat + mung bean residue during the decomposition cycle as a function of accumulated thermal time as affected by the method of placement. (a) represents the 150-day decomposition cycle, and (b) represents 365-day decomposition cycle.
Sustainability 14 00864 g009
Table 1. Decomposition time (days) and equivalent accumulated thermal time (ATT) for the different litter bags’ sampling periods.
Type of ResidueDays/ATT after Residue Placement
Days306090120150270365
MaizeATT (°C)42077811951754247462658582
Wheat, mung bean, and wheat + mung beanATT (°C)952185227073425398157688634
Table 2. Initial biochemical composition of plant residues used in the study.
Type of Residue §Hemicellulose (%)Cellulose
(%)
Total N (%)Total C (%)C:N Ratio
Maize35380.5442.384
Wheat19450.3238.3120
Mung bean (MB)15441.0835.433
Wheat + MB23410.6437.058
§ Maize-lower 50% below the cob, wheat-lower 25% wheat stubbles, mung bean—100% residue, wheat + mung bean-wheat stubbles + mung bean residue (1:1 mass ratio).
Table 3. Regression analysis of mass remaining (%) and accumulated thermal time (°C) for crop residue type and placement method for 150-day decomposition period.
Residue TypeDecomposition Rate (k × 10−4)R2RMSENRMSEEFp-Value
SPSSPSPSSPSPSSPSPSSPSPSSPSPSSP
Maize4.15.60.9850.9822.853.790.0410.0680.980.98<0.001<0.001
Wheat3.04.00.9810.9922.582.960.0440.0610.980.99<0.001<0.001
Mung bean (MB)3.34.00.9410.8497.5813.00.1590.3420.910.790.0010.009
Wheat + MB2.83.90.9460.9326.177.650.1160.1750.930.920.0010.002
RMSE: root mean square error, NRMSE: normalized root mean square error, EF: modelling efficiency, SP: surface placed, SSP: sub-surface placed.
Table 4. Regression analysis of mass remaining (%) and accumulated thermal time (°C) of residue type and placement method for 365-day decomposition cycle.
Residue TypeDecomposition Rate (k × 10−4)R2RMSENRMSEEFp-Value
SPSSPSPSSPSPSSPSPSSPSPSSPSPSSP
Maize3.14.10.9880.9815.567.710.1170.2210.970.94<0.001<0.001
Wheat2.83.30.9940.9871.904.730.0470.1580.990.97<0.001<0.001
Mung bean (MB)3.03.50.9800.9467.6812.90.2600.6350.920.79<0.001<0.001
Wheat + MB2.83.50.9880.9775.247.960.1500.3120.960.92<0.001<0.001
RMSE: root mean square error, NRMSE: normalized root mean square error, EF: modelling efficiency, SP: surface placed, SSP: sub-surface placed.
Table 5. Regression analysis of N release (%) and accumulated thermal time (°C) of residue type and placement method for 150-day decomposition period.
Residue TypeN Release Rate
(k × 10−4)
R2RMSENRMSEEFp-Value
SPSSPSPSSPSPSSPSPSSPSPSSPSPSSP
Maize5.36.20.7350.9663.223.000.1820.0980.810.950.0630.003
Wheat1.82.30.7290.7803.444.190.1430.1150.700.770.0660.047
Mung bean (MB)2.01.10.9720.8231.633.330.0370.0580.970.830.0020.033
Wheat + MB0.911.60.8960.8481.353.860.0360.0800.880.830.0150.026
RMSE: root mean square error, NRMSE: normalized root mean square error, EF: modelling efficiency, SP: surface placed, SSP: sub-surface placed.
Table 6. Regression analysis of N release (%) and accumulated thermal time (°C) of residue type and placement method for 365-day decomposition cycle.
Residue TypeN Release Rate
(k × 10−4)
R2RMSENRMSEEFp-Value
SPSSPSPSSPSPSSPSPSSPSPSSPSPSSP
Maize2.62.10.8730.80711.314.80.3260.3070.830.75<0.01<0.01
Wheat1.81.50.9480.8672.924.610.0880.1030.970.93<0.001<0.01
Mung bean (MB)1.30.90.9310.9275.464.170.1010.0630.910.92<0.001<0.001
Wheat + MB1.31.20.9730.9262.164.870.0460.0840.980.92<0.001<0.001
RMSE: root mean square error, NRMSE: normalized root mean square error, EF: modelling efficiency, SP: surface placed, SSP: sub-surface placed.
Publisher’s Note: MDPI stays neutral with regard to jurisdictional claims in published maps and institutional affiliations.

