Article

Assessment of the Fragility of the Municipal Waste Sector in Serbia Using System Dynamics Modelling

1
Faculty of Engineering, University of Kragujevac, 34000 Kragujevac, Serbia
2
Monitoring Center of Science and Education, Peter the Great St. Petersburg Polytechnic University, 195251 St. Petersburg, Russia
*
Author to whom correspondence should be addressed.
Sustainability 2022, 14(2), 862; https://doi.org/10.3390/su14020862
Submission received: 30 November 2021 / Revised: 28 December 2021 / Accepted: 30 December 2021 / Published: 13 January 2022
(This article belongs to the Collection The Impact of Digitalization on the Quality of Life)

Abstract

:
This research develops a novel methodology for municipal waste management in Serbia, based on system dynamics modelling. The methodology shows how a country and relevant institutions should address complexities in the waste management sector. Waste management is a critical issue globally, which heavily impacts the economic development of a country, including the general quality of life within a society. The designed simulation generates different scenarios of the Serbian municipal waste system for reaching the 2035 recycling rate targets. Methodologies such as the theory of constraints, fragility analysis, and systems dynamics were implemented in the model. The scenarios and fragility modelling were conducted with the system dynamics modelling methodology in the Ventity simulation environment. The designed model has elements of discrete event simulations, system dynamics, and agent-based modelling. Importantly, real-world data for the period of five years (from the year 2016 to 2020) was used in the case study. This research undoubtedly reveals that the informal sector is the key source of fragility to the dynamic system considered. During the considered period, the informal sector contributed 62.3% of all separated waste to the system. Consequently, this research concludes that for the waste sector in Serbia to reach the 2035 EU goals, the existing practice in waste management has to be changed significantly and will benefit from the modelling approach used here. The whole system is highly dependent on the informal sector, which, in its current form, is volatile, unregulated, and fragile to aggressive regulative policies.

1. Introduction

The highest level of urgency for more decentralised municipal waste management is outlined in the first Global Waste Management Outlook report, published by the United Nations Environment Programme (UNEP) [1]. Waste management should be seen from a government policy perspective as a priority for general quality of life in a developing urban environment [2]. Despite the clear global need for more growth on all levels in the waste management industry, a number of barriers prevent sustainable economic growth. Waste management companies typically operate at long-term low profitability in many economically troubled regions, including Eastern Europe [3] and countries in Africa [4]. Poor performance of waste management companies in developing countries can be attributed to relatively inadequate implementation of waste management policies and planning [5], along with the absence of good regulation [6] and a lack of infrastructure.
Additionally, there is a highly neglected risk that troubles the waste sector both in developing and developed countries, which is the complexity of having a potentially large number of stakeholders when operating in the waste sector [7]. Stakeholders naturally have separate incentives and regulatory obligations, and that can bring a multitude of additional risks to the operation. Regardless of all the complexities and risks, the waste authorities have an influential position in shaping the quality of life of the population within the communities [8], and the solutions to all of the above-mentioned problems need to be found.
The paper has examined the municipal waste data from the Republic of Serbia, where multiple stakeholders build a highly complex network. Before this research, there were no publications on the mapping and modelling of such a system. This follows an inherent lack of research that addresses the mapping and model-building of national and regional waste management systems. Importantly the development of such a model requires a significant amount of data, followed by a robust model verification and validation process, all for the developed model to sufficiently simulate the behaviour of the real system. Additionally, the model should simulate dynamic behaviours and scenarios towards well-defined goals. The research addresses the capacity of the municipal waste system to reach the Serbian government’s and European Union (EU)’s set targets for 2035 for the overall national recycling rate. Hence, the model was built in a cooperative effort with the Serbian Environmental Protection Agency (SEPA) after extensive municipal waste data processing for the period 2016–2020. Data on the quantities of generated and treated municipal waste are collected from municipal companies, generators, collectors, and operators of municipal waste from the entire territory of the Republic of Serbia. The collected data on municipal waste is stored in the national database through annual reports submitted by the main actors of the municipal waste management system to the SEPA. For the previous five years, a huge amount of data on municipal waste has been processed systematically to define the main indicators of municipal waste, such as the total amount of waste generated, separately collected waste, treated waste, recycling rate, etc.
Mapping of the complex systems as a whole and its application to a single enterprise [9] as well as to a network of different companies [10], offer great potential. However, industrial mapping tools such as value stream mapping (VSM) [11] are static, and converting these tools into real-time dynamic simulation models can bring greater usage. This is especially true if it is planned to analyse risks within a large network or a single enterprise, the mapping process needs to be developed in a simulation environment. The paper has mapped the complex waste sector of the Republic of Serbia and has converted these static models into an interactive numerical model within a system dynamics simulation environment. This allows the model to analyse different behavioural scenarios of the waste management sector and the different variables that control it. This covers concepts from the theory of constraints and lean manufacturing, as well as fragility within the system. One of the main intended contributions of this paper is to point out that modelling and mapping the operations of the regional or municipal waste industry can bring multiple benefits for stakeholders, regardless of their incentive. With sustainable waste management strategies, economic limitations like the lack of essential building materials can be mitigated in developing countries [11,12]. Key infrastructure for economic development like roads, bridges, and tunnels can be facilitated with eco-friendly construction materials [13]. Most importantly, municipal solid waste (MSW), if efficiently separated, can bring more sustainable energy solutions to different industries and produce a more closed-loop energy-dependent system [14]. Previously applied research, which used system dynamics modelling for MSW, has taken a highly abstract view of the system [15], along with using more economic parameters within the model [16]. The designed model and the applied research in this paper differentiate themselves in focusing more on the operational side of the municipal waste system, particularly where a clear overview of different types of waste and their flow comes as a primary concern. This different approach to MSW modelling provides a tool for a more robust analysis of constraints and operational risks of the system. Importantly, there is a lack of research in using contemporary risk methods and constraints management when analysing MSW, to which the paper also contributes.

2. Literature Review

The waste sector in the Republic of Serbia was chosen to be investigated since the country has a complex developing waste sector that would benefit from a “whole system approach” analysis. During the waste data-gathering process, it was observed that the multiple enterprises and the policymakers within this system do not fully understand how the system operates as far as the flow of material, information, and capital are concerned. This is a quite common phenomenon that is present in multiple industries, mostly due to overspecialisation and focusing on a specific problem or a domain by a company or a policymaker. When a system is observed as a whole, extreme positive outcomes can be gained by identifying and managing the most important bottlenecks and risks. The theory of constraints proposes that it is of utmost importance to observe the system as a whole and to identify the main constraint that is limiting the whole system. This management philosophy, which has gone through a number of development stages [17], has produced some of the most outstanding improvements and turnarounds of large systems by analysing the system as a whole and focusing on the main limiting factor of the system [18]. Avoiding the need to improve every part of the system and focusing on its main bottleneck has generated outstanding results, regardless of managing a single company or a larger network [19].
System dynamics modelling is an approach that studies and simulates complex systems, both natural and manmade [20]. These systems can range from large multinational automotive corporations and the networks of distributors [21], to the systems modelling and simulations approach, to large and complex projects [22]. Many issues and challenges, if analysed as an isolated phenomenon instead of observed as a system of cause and effect, are very difficult to understand. With this being the case, the waste sector needs to be observed as a system, and a clear representation of the whole system must be present, including the boundaries of the system. System dynamics has proven to be a great tool to numerically simulate systems of different abstraction levels. However, one of the key strengths of this methodology lays in its easy-to-understand graphical representation of the system. This allows for groups of people that are not familiar with this type of simulation modelling approach to easily understand the model and participate in the group model-building process.
There is a slow but emerging shift in the broad field of risk management that aims for alternative methods in analysing rare events that have a high impact on industries, healthcare, and ecological systems [23]. Since the beginning of the last two decades of the 20th century, robust research has emerged on the limitations in forecasting [24]. Research pointed out not just low abilities in forecasting large-scale developments, but also a lack of subsequent understanding of the disruptive events, their scale, and consequences [25]. This has been eminently clear in the case of financial recessions, epidemics, and pandemics. The following decades have seen the rise of computation and its use in everyday life and decision-making. Nevertheless, with the rise of big data, machine learning, and the field of data science, there is little proof that countries and institutions are better at forecasting fat-tailed large-scale social events, financial recessions, or global pandemics [26]. This is particularly true in the case of the 2019/2020 COVID-19 pandemic, where in many countries, institutions of economic agents showed little foresight and preparedness. A number of questions have risen about the highly sophisticated data-science methodologies used, along with big-data-driven decision-making that is embedded in many institutions and enterprises [27].
With the publication of the original The Black Swan: The impact of the highly improbable [28], several questions emerged inside and outside academia concerning one’s illusion of control and what should be modelled and analysed. When referring to a Black Swan, a rare event is being defined, with extreme consequences for a particular system or individual [29]. Other terms that are usually used when defining Black Swan events are uncertainty, low probability, lack of knowledge, outlier, etc. The Black Swan concept and the theory behind it found a highly multidisciplinary use and reach, from biological risks [30], to industrial safety management [31], to monetary policy [32], to project management [33], to geriatric surgery [34].
Hubbard [35] outlined many flows of modern risk management tools, methods, and theories, and offered solutions and alternatives. Nevertheless, this spectrum of research does not necessarily propose that risk management tools and theories should be abandoned, but that awareness of the illusion of control should be present, along with continued improvements with the tools that are used.
These methods and other evolving solutions are not a “silver bullet” to many challenges that face contemporary risk management. Nevertheless, many multidisciplinary methods have proven to be useful, and not cause more harm than benefits. That is the intention with the introduction of fragility thinking and modelling as a primarily practical approach to complex problems that steers clear of an illusion of control.
As already expressed, complex systems typically feature volatile and nonlinear behaviour, and most of the time their future is highly uncertain. The majority of the planning and risk approaches are effective in analysing and predicting events that have a small negative impact on a system. This is not the case for events (stressors) that can generate large losses or failure of the system [36]. Perhaps the answer to the question, If we cannot forecast how we can plan? [24], is that the planning process towards certain hazards and rare events should be adjusted for its inherent lack of precision. An efficient way to look at complex systems and their risk exposure is by dividing them into three categories: fragile, robust, and anti-fragile [37]. Robust systems can take large shocks and sustain continuous instability; these systems are predictable to a certain degree. Usually confused with robust, anti-fragile systems function like biological systems, as they benefit from exposure to shocks and stressors due to their ability to adapt, overcompensate, and evolve. Contrary to robust and anti-fragile is fragile, as these systems easily break; they are prone to large losses or risk of ruin. When faced with the risk of ruin, an erroneous course of action is conducting a cost–benefit analysis. Instead, applications of the precautionary principle (PP), formal fragility analysis, and redundancy/back-up systems planning should be considered [38]. The fragility of complex systems can be measured more effectively than risk. The output of this kind of analysis would differ from a classical risk analysis, along with the planning procedure that follows. Fragility is represented as a nonlinear (undesirable) response to a stressor (event). Fragile systems can have large losses or total collapse when faced with events or changes that they are not designed for. This is opposite to biological systems, as their designee is excessive, redundant, and spare, contradictory to a system that is optimised. Optimised systems, like in the case of waste management enterprises, which will be analysed later, are not suited for rare events or discrete event changes. Over-optimised, complex, and fragile have many similarities and quite often describe the same entity.
After a system or part of a system is defined as fragile, the next procedure is to decrease or to eliminate existing fragile structures; coming to a projection of when exactly the system would fail or encounter large losses is unnecessary. Fragile systems react in a nonlinear way when facing volatility, uncertainty, randomness, step changes, delays or continuity of exposure to a stressor. That is, the system can generate nonlinear (convex/concave) losses to a linear increase in the undesired exposure [36].
There is extensive technical work on how fragility should be defined, mapped, and detected [38]. However, there is much flexibility with this concept, which leaves an opportunity for future research and applications. There have been publications to suggest a paradigm shift towards implementing fragility and antifragility to complex systems, ranging from healthcare and medicine [39] to supply chains [40].

3. Materials and Methods

The Republic of Serbia’s waste sector was selected as the system to be modelled and analysed in a previously defined manner. The model was built in a cooperative effort with the SEPA after extensive municipal waste data processing for the period 2016–2020 [41]. As mentioned before, there are no models that outline the whole waste system in Serbia in an integrated way, which would provide a whole system numerical view. This prevents the implementation of effective changes. If the system is not considered as a whole, it is highly unlikely that the most important bottleneck will be identified, and it is difficult to mitigate the effect of the key risk factors. The focus was on precisely defining the logistical and operational role of different private and public entities that exist within the system.
Municipal waste is mainly produced by households and similar wastes from other sources such as commerce, offices, and public institutions. Municipal waste is defined in Article 3(2) of Waste Framework Directive 2008/98/EC [42] as “mixed waste and separately collected waste from households, and mixed waste and separately collected waste from other sources, where such waste is similar in nature and composition to waste from households.” Waste that is similar in nature and composition to waste from households may also be collected from enterprises, as well. In this case, it is a municipal waste unless it originates from production.

3.1. Model for Calculation of Main Municipal Waste Indicators

In the beginning stages of the model-building process, a macro diagram of the entire municipal waste sector was created (Figure 1).
The macro diagram in Figure 1 defines the main sources of municipal waste generation in the territory of Serbia and appropriate waste treatments, including exported waste. They include households and other sources of waste similar to household waste, corporate generators, and waste operators for disposal and waste operators for recovery treatments. The terms GIO1, GIO2, GIO3, GIO6, and KOM1 represent the titles of the national annual report forms on waste, developed by the SEPA [43]. As defined in the macro diagram (Figure 1), the waste flows from inhabitants (households and informal sector) and corporate generators via waste collectors to two different destinations. These can be the waste disposal operators, mainly landfills (data on waste quantities available in the GIO2 report form), and waste recovery operators (recovery pre-treatment and treatment facilities, data available in GIO3 report form). The main entity that links the waste generated by inhabitants and other civil sectors with the waste operators is the state-run public utility company (PUC, data on waste available in the KOM1 report form). It is important to outline that along with the public utility resources that collect and facilitate waste, these operations can be done by private-sector collectors. However, as outlined in the above diagram, officially these agents collect waste exclusively from corporate generators (data on waste available in the GIO1 report form). Collectors can be segmented into two types: informal and registered. Informal collectors are unofficial and unregistered individuals that collect waste and deliver it to registered collectors (data on waste available in the GIO6 report form). Importantly, these individuals account for a substantial percentage of the total separately collected municipal waste.

3.1.1. Municipal Waste Indicators

One of the requirements of the Statistical Office of the European Union—Eurostat—towards member countries as well as towards candidate countries is the submission of annual reports on the state of municipal waste [44]. The submission of annual reports is based on a precise calculation of the main waste indicators.
The main municipal waste indicators are as follows:
The total municipal solid waste generated;
Separately collected municipal waste;
Municipal solid waste treated;
Recycled municipal solid waste;
The recycling rate of municipal solid waste.
In the following, methodologies for calculating the main waste indicators for municipal waste are presented, following the Eurostat requirements based on waste data from the SEPA database and the SEPA annual reporting forms [41,43].

Total Municipal Waste Generated

The indicator total municipal waste generated (GEN) is calculated, using the labels in Figure 1, as follows:
GEN = COL_PUC(KOM1) + COL_SEP(GIO1) + COL_SEP(GIO6),
where:
 
COL_PUC(KOM1)—municipal waste collected by public utility companies on behalf of municipalities;
 
COL_SEP(GIO1)—municipal waste generated by enterprises, delivered to waste collectors outside of the system of utility companies;
 
COL_SEP(GIO6)—the amount of recyclable materials separated from municipal waste by the informal sector delivered to waste collectors.
Municipal waste collected by utility companies can be expressed as the sum of mixed waste collected for disposal (Mix_MSW(KOM1)) and separately collected waste for recovery treatments (COL_SEP(KOM1)):
COL_PUC(KOM1) = Mix_MSW (KOM1) + COL_SEP(KOM1).
The total amount of municipal waste collected by public utility companies (COL_PUC(KOM1)) should be defined by summing the produced quantities of municipal waste in each municipality in the territory of Serbia that are reported in the KOM1 form.

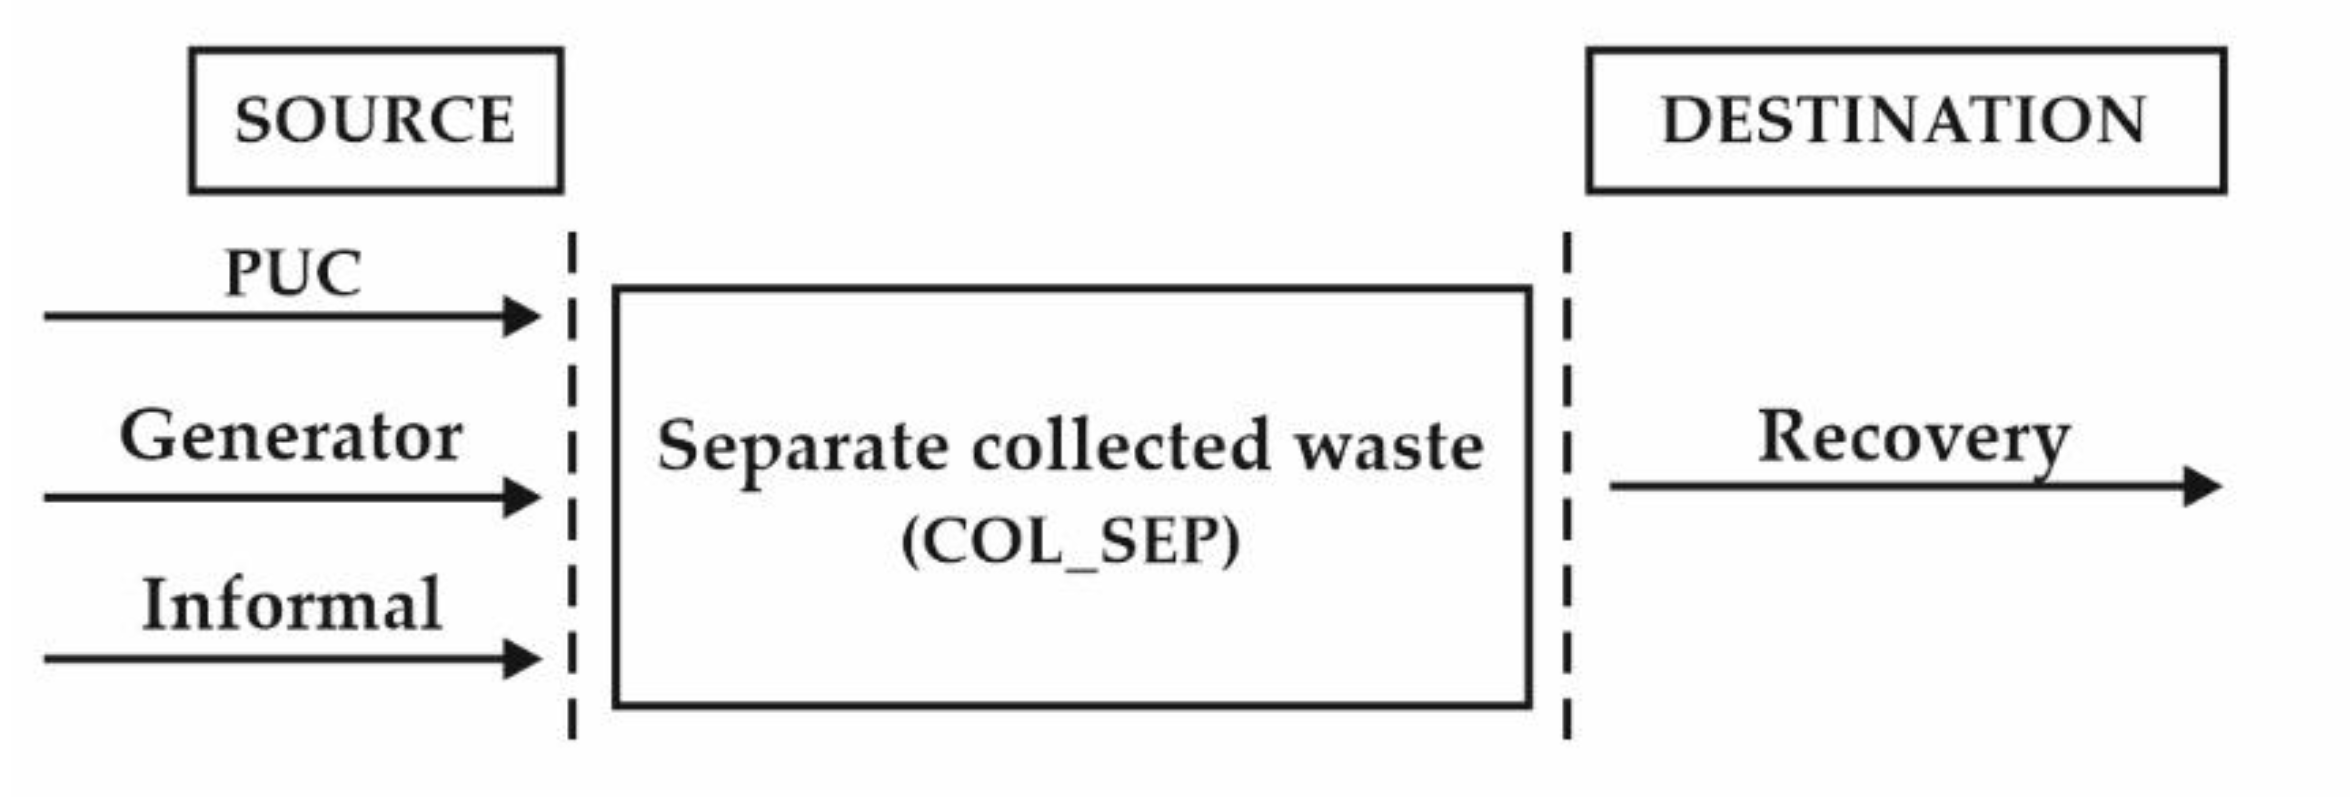
Separately Collected Waste

Separately collected waste (COL_SEP) is defined as the amount at the point where it has been separately collected for recovery/recycling operations in the country or out of the country.
Figure 2 shows the flows (sources and destinations) of separately collected waste in the territory of Serbia. The collection point (source) consists of:
Public utility companies (PUC) that collect recyclable waste using their infrastructure (bins, containers, communal vehicles);
Generators or waste producers (enterprises, trade, small enterprises, office buildings, and public-sector institutions) that generate waste and deliver it directly to collectors for recovery treatments;
The informal sector that separates a significant part of recyclable waste from the mass of municipal waste and delivers it mainly to waste collectors.
Following Figure 1 and Figure 2, separately collected waste can be defined as:
COL_SEP = COL_SEP(KOM1) + COL_SEP(GIO1) + COL_SEP(GIO6).
A significant amount of separately collected waste in the territory of Serbia is exported for recovery treatments to other countries and it is included in the total amount of Serbian recovery waste as defined on the right side of Figure 2 (destination side in the graph). The amount of separately collected municipal waste calculated from the sources or the destinations side should be either the same or different only for the stock status in the warehouse of collectors.

Municipal Waste Treated

Municipal waste treated (TRT) includes recovered (RCV) and disposed waste (DSP):
TRT = RCV + DSP.
Following the labels from Figure 1, the total amount of recovered municipal waste (waste treated by operations R1 ÷ R11) can be defined as:
RCV = COL_SEP − ALR,
Due to fact that the total weight of waste recovered/recycled (recovery operations R) must be equal to the weight of waste at the calculation points (CP). The latter comprises collected waste at the measuring point (MP) reduced by losses (ALR—average loss rate, Figure 1) during pre-treatment of recovery operations (detailed in the Commission Implementing Decision (EU) 2019/1004, [45]).
Until the establishment of the Serbian national register for ALR, to present the calculation methodology of the main waste indicators, that value is taken to be 1% of the total separately collected waste.
Following labels from Figure 1, the total amount of disposed municipal waste (DSP) can be calculated as:
DSP = D(GIO2),
where D(GIO2) is the amount of municipal waste received on the weighbridge at the entrance of disposal operator facilities (data reported in the GIO2 form).

Total Amount of Recycled Municipal Waste

The total amount of recycled municipal waste (RCY) is a subset of total recovered waste. It is the sum of recycled metals and inorganic materials (recovery operations R4 and R5) and recycled organic materials (recovery operation R3), which is:
RCY = RCV (R3, R4, R5),
where RCV (R3, R4, R5) denotes the amount of separately collected waste treated by recovery operations R3, R4, and R5.
Using method 4 for the calculation of targets on municipal waste following Decision 2011/753/EU [46], the recycling rate of municipal waste in % is:
RCY _ R = Municipal   waste   recycled Municipal   waste   generated × 100 .
Following notation from the previous text, the recycling rate of municipal waste ( RCY _ R ) is:
RCY _ R = RCV   ( R 3 ,   R 4 ,   R 5 ) GEN × 100 .

3.1.2. Municipal Waste Indicators

The calculation of the main waste indicators in the presented methodology was conducted using waste data obtained from the SEPA database for the period from 2016 to 2020 [41].
The amount of generated municipal waste per material is based on calculated data on separately collected waste and on estimates for collected mixed waste derived from regular waste composition surveys of mixed municipal waste [47]. The material breakdown for 2020, according to the format defined in Implementing Decision 2019/1004/EC Annex V [45], is shown in Table 1.
Similarly, all relevant parameters of municipal waste for the period 2016–2020 were calculated, and their aggregate values are shown in Table 2. Based on the data shown in Table 2, the main calculated waste indicators are shown in Table 3.
As shown in Table 3, the recycling rate (RCY_R) was calculated through the amounts of separately collected waste from the source side (utility companies, waste generators, and informal sector). From a legal point of view, the approach from the destination side is more correct according to Commission Implementing Decision (EU)-2019/1004 [45]. However, the difference in the considered quantities of waste from the source and destination sides is relatively small compared to the total amount of generated municipal waste, which is typically within a few percentage points of the MSW recycling rate. Given that the main aim of this work was to investigate the scenario for a significant increase in the amount of recycling rate, in the remainder this indicator is analysed and calculated via the source side.
With the implementation of Directive (EU) 2018/851 of the European Parliament and the Council amending Directive 2008/98/EC [42], Member States are required to meet and report on targets regarding household and/or municipal waste:
(a)
by 2025, preparation for re-use and the recycling of municipal waste shall be increased to a minimum of 55% by weight;
(b)
by 2030, preparation for re-use and the recycling of municipal waste shall be increased to a minimum of 60% by weight;
(c)
by 2035, preparation for re-use and the recycling of municipal waste shall be increased to a minimum of 65% by weight.
Serbia, as a candidate country, is in the process of aligning its legislation with EU requirements. Keeping in mind the values from Table 3, it is clear that the current level of recycling of the municipal waste in Serbia is far below the EU requirements. Consequently, the country must create conditions for a significant increase in the recovery/recycling of municipal waste in the forthcoming years.

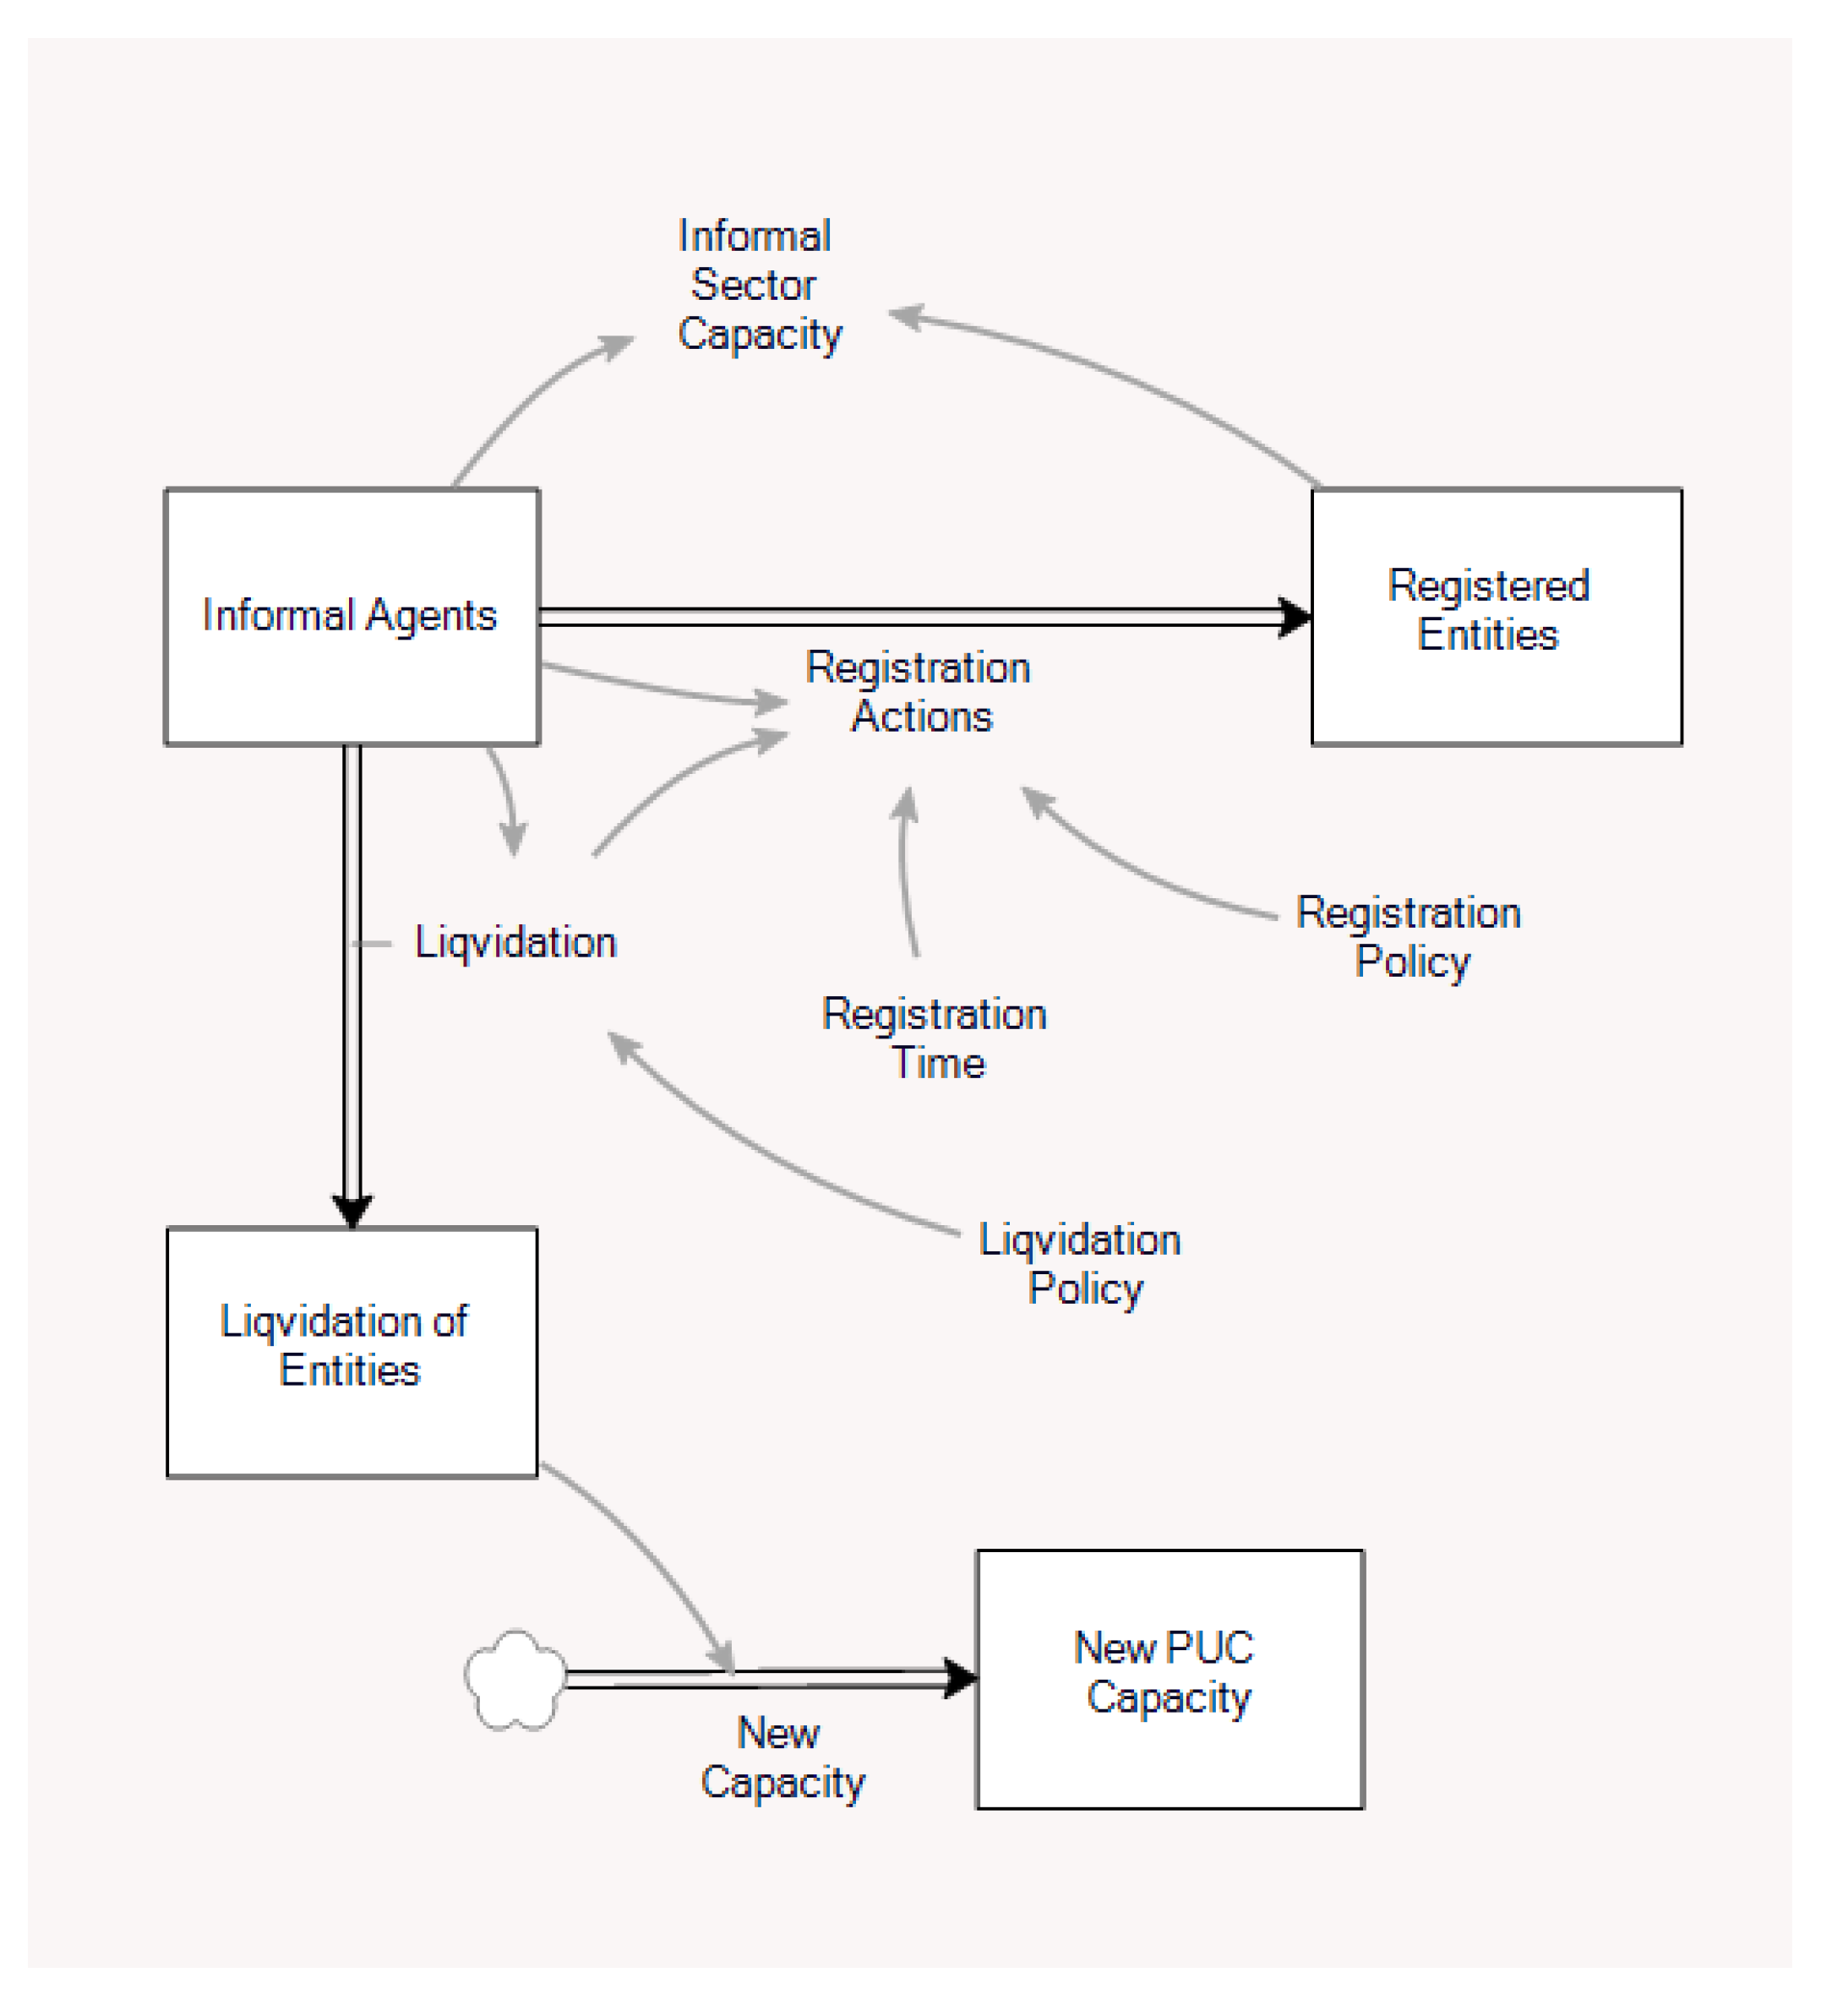
3.2. System Dynamics Model of the Municipal Waste Sector in Serbia

The above-explained macro diagram (Figure 1) of the national municipal waste flows was turned into a functioning system dynamics model, shown in Figure 3. The developed model consists of multiple layers and numerically simulates the flow of waste on the national level.
The macro model that simulates the flow of different waste fractions has a standard system dynamics structure based on stocks, inflows, and outflows. As shown in Table 1, there are 12 fractions of waste analysed, and all of the fractions flow through the model. The developed model has a higher degree of numerical fidelity, as it is defined by two different modelling paradigms: system dynamics and agent-based modelling. The model calculates waste as a cluster of multiple entities, where each waste fraction or entity has different defining factors. As shown in the model, inflows and outflows define the direction of the waste flow over the analysed period. Just as in the real system, the model constrains the waste flow in only one direction.
The system dynamics models allow for uncomplicated visual inspection of the model structure by experts and stakeholders. The model was rigorously validated so that the built structures represent waste flow and waste accumulation of the real system.
In addition, a sub-model for the informal sector was developed (Figure 4), to simulate different policies affecting the informal sector. This sector accounted for 62.3% of all separated waste that was delivered to the collectors in 2020 (Table 2).
The sub-model analyses two pathways for the informal sector: liquidation of all unregistered entities, and a more time- and capital-consuming legalisation of agents. Important variables to be analysed are the informal sector capacity and new public utility companies’ capacity, which would cover the liquidated part of the informal sector. The sub-model (Figure 4) influences the behaviour of the main model (Figure 3), mainly through the dynamics of the COL_SEP(GIO6). The created structure can influence the cumulative flow of the COL_SEP(GIO6), or there can be changes to the flow of a particular waste segment. Additionally, through the sub-model, it is possible to test policies that influence the PUC and their current and future capacity. In the case of liquidation of informal sector entities by the state, public utility companies would need to compensate for the lost capacity swiftly. It is important to point out that the utility companies separately collected only 5.5% of the waste collected by the informal sector in 2020 (Table 2). An alternative policy was analysed where the informal agents are registered and trained to be formally integrated into the municipal waste system, while not losing their contribution. This alternative policy takes longer compared to a liquidation process, and requires capital investments.

4. Results

In the model initialisation phase, the municipal waste indicators calculated for the period 2016–2020 (Table 1, Table 2 and Table 3) were imported as input data for the simulation of different scenarios. The main objective of the simulation was to predict the possibilities of achieving the recycling targets set by Directive (EU) 2018/851 of the European Parliament and the Council [42].

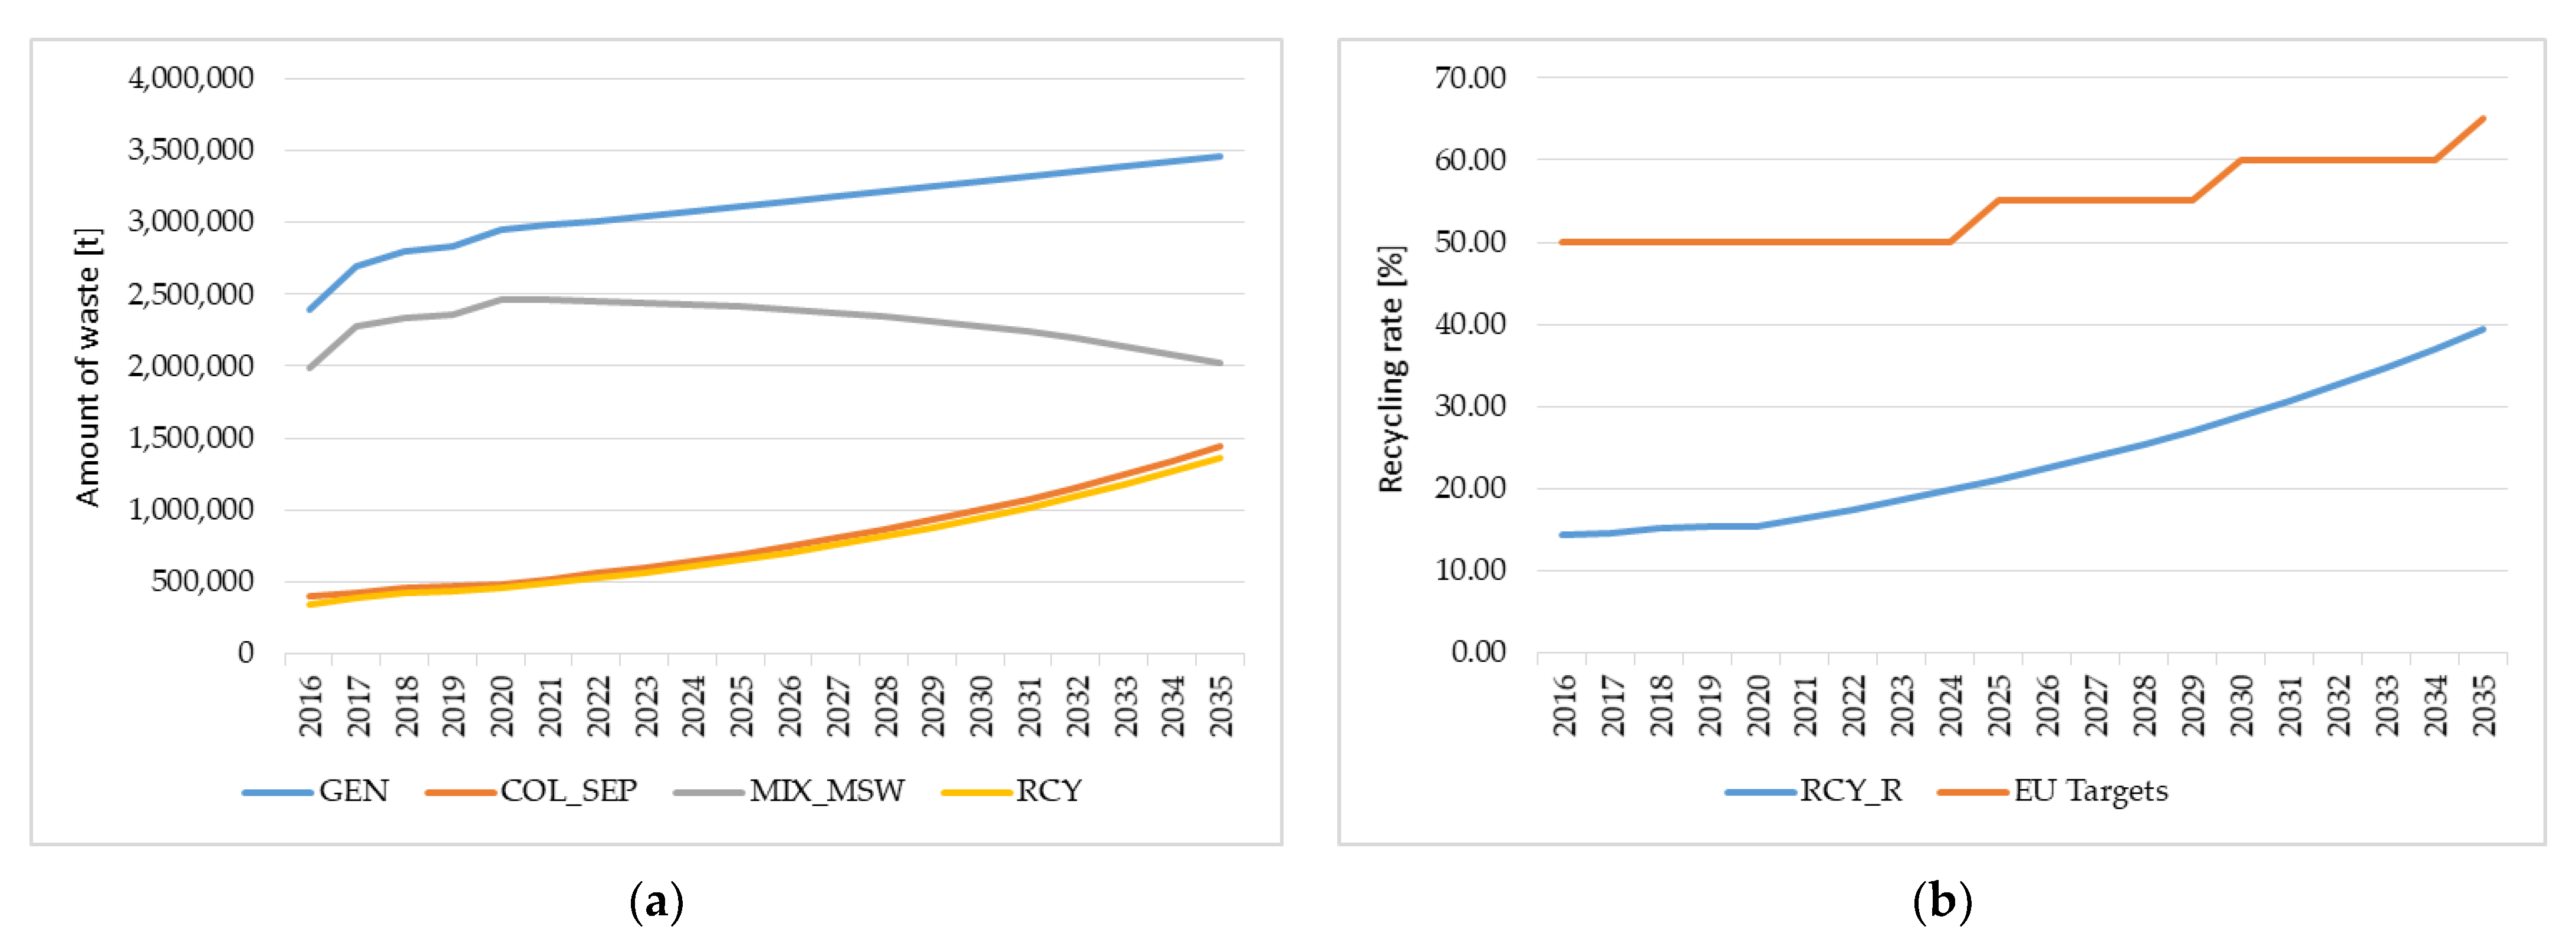
4.1. Baseline Scenario

The baseline scenario simulated a possible future development for the generation and management of municipal solid waste in Serbia based on the waste growth trends according to the data for the period 2016–2020 and the predictions of the economic growth of the Serbian economy. The baseline scenario was used as one of several possible developments to identify a realistic level of non-compliance with EU recycling targets for the period up to 2035.
The growth of municipal waste generated in Serbia in the period 2021–2035 was assumed to be 1.08% annually. This growth corresponds to the amount of annual waste generated per capita in Serbia in 2035 equivalent to the current value in the European Union [48]. The justification for the increase in the amount of generated waste per person from the current 427 kg/cap to 502 kg/cap was based on the estimated GDP growth of 4–7% in Serbia in the next 10 years [49]. It was also assumed that such economic growth will stop the depopulation process, which today is −6.7‰—i.e., keep the Serbian population at the level of 2020 in 2035 (6,899,126) [50].
Following the distribution of the quantities of separately collected waste in the considered five-year period, the adopted annual growth rate of this indicator will remain at the level of 7.5% until 2035.
The adopted growth rates for the total amount of separately collected municipal waste and the total amount of generated municipal waste were entered as the input parameters into the model. Based on these two input parameters, the values of collected mixed municipal waste, total waste recycled, and recycling rates were determined for the period 2021–2035 (Table 4).
Figure 5a shows the distribution of generated municipal waste (GEN), collected mixed waste (Mix_MSW), separately collected waste (COL_SEP), and recycled waste (RCY) in the baseline scenario for the period 2016–2035. Figure 5b shows the distribution of the municipal waste recycling rate (RCY_R) for the period 2016–2035 in the baseline scenario compared with the recycling rate targets (EU Targets) set by Directive (EU) 2018/851 of the European Parliament and the Council [42].
By analysing the municipal waste indicators obtained through the baseline scenario, it is clear that the projected level of recycling of the municipal waste in Serbia in 2035 was 39.45%, which is still far below the EU requirements (65%). The conclusion from this scenario is that the current growth rate of the amount of municipal waste collected in Serbia is not sufficient to meet the recycling targets projected by the European Union. It is also clear that in the years to come, conditions for a significant increase in the separate collection of municipal waste must be implemented in Serbia.

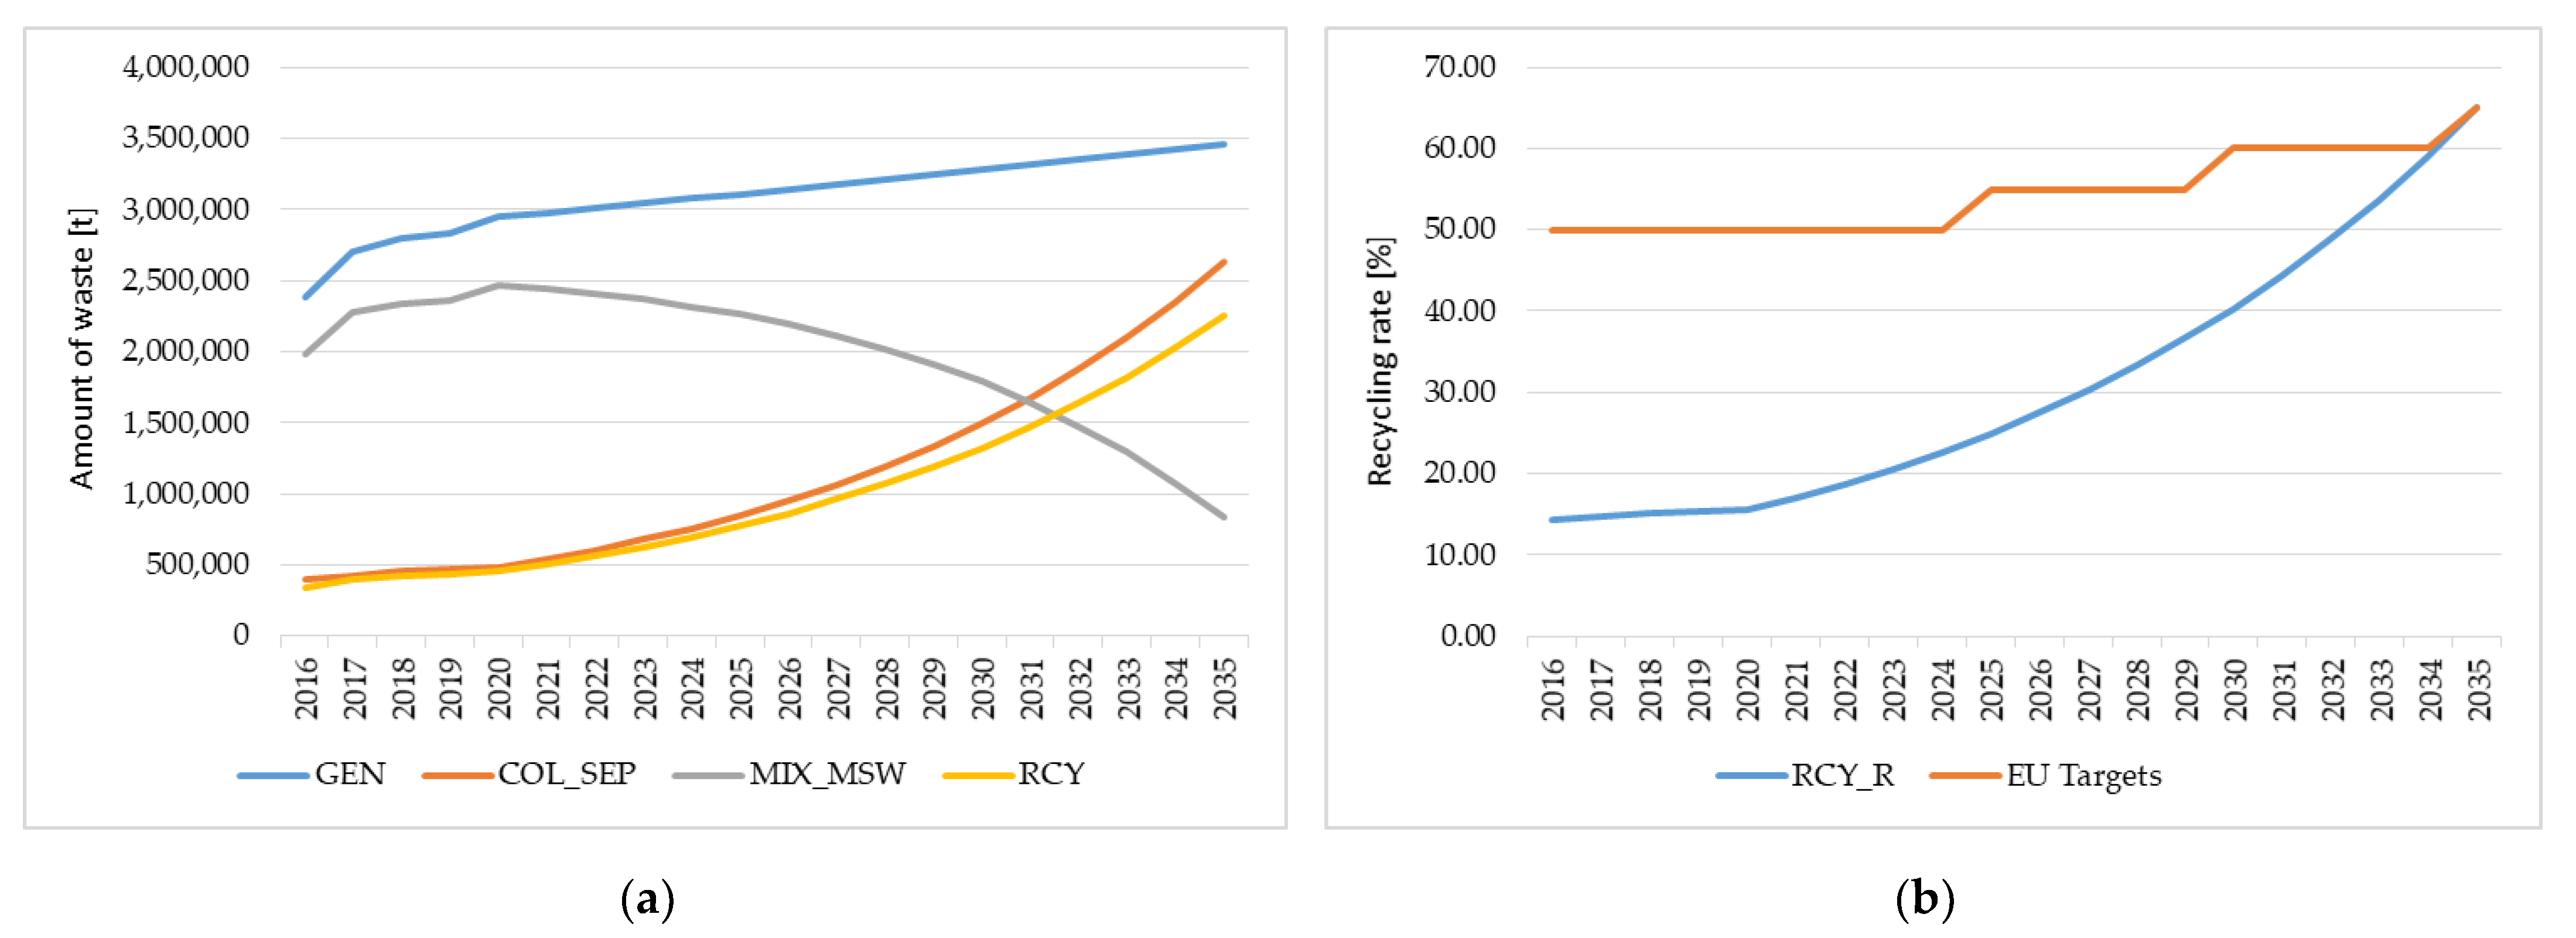
4.2. Scenario for the Optimal Recycling Potential

The objective of this scenario was to estimate the upper bounds of recycling in terms of collection and technical potential for recycling. The maximum recycling potential represents amounts of waste that can be practicably collected for recycling. The definition of recycling potential used in this research denotes the amount of waste that can potentially be collected for recycling, reflecting limitations related to source separation of waste based on available data and literature [51,52].
On the other hand, the technical potential for recycling refers to the ratio between final recycled quantities versus quantities collected for recycling. It is, for example, the reject rates of different waste streams during pre-treatments and the technical limitations of recycling plants. A summary of the reported losses and the recycling flow of various material fractions relevant for this scenario obtained from waste operators in the Member States is provided in the study, supporting the development of the Commission Implementing Decision (EU)-2019/1004 [44].
The bottom-up approach was used to evaluate the maximum recycling potential, i.e., the limits of recycling the municipal waste in Serbia. In the context of this method, the recycling potential of each waste fraction was defined based on reported data in the literature [51] and then combined to assess the maximal recycling potential of municipal waste.
In the first step of this scenario, the expected quantities of separately collected waste for 2035 (COL_SEP 2035) were calculated based on the projected quantities of total generated waste (GEN 2035) as well as the percentages of the maximum separation of each waste fraction (Max_SEP) [51]. In addition to the above parameters, Table 5 also shows the calculated values of the matching growth rates for each municipal waste fraction. The values of growth rates were used as input data in the developed model to simulate the appropriate quantities of recycled waste in the period 2021–2035.
In the next step, parameters defining the limitations of the technical potential for recycling were entered into the developed model. As stated above, the technical potential for recycling relates to the ratio between final recycled quantities versus quantities collected for recycling, which is defined in the model as the average loss rate (ALR). The average loss rate here means the loss of non-target material from particular separated waste material, either into disposal or into other recovery treatments, as a proportion of the total waste fraction input. The percentage values of these losses were adopted from the literature [53] and are shown in Table 6. In addition to the loss rates, Table 6 also shows the calculated values of the amount of recycled waste as well as the expected feasible recycling rate in 2035.
Table 7 shows the calculated values of waste indicators for the characteristic years of the period 2020–2035. The analysis of the data obtained within the scenario of reaching the feasible recycling potential shows that Serbia can reach the EU recycling target only in 2035 when the maximum level of waste separation published in the literature would be provided for each municipal waste fraction.
Figure 6a shows the distribution of generated municipal waste (GEN), collected mixed waste (Mix_MSW), separately collected waste (COL_SEP), and recycled waste (RCY) in the scenario of the optimal recycling potential for the period 2016–2035. Figure 6b shows the distribution of the municipal waste recycling rate (RCY_R) for the period 2016–2035 in the scenario of the optimal recycling potential compared with the recycling rate targets set by Directive (EU) 2018/851 of the European Parliament and the Council [42].

4.3. Constraints and Fragility of the System

To define the main constraints of the system, the system was analysed as a whole, rather than as an assembly of the individual/isolated parts. The municipal waste management system has two constraints: one in the form of physical flow (waste flow) and one in the regulatory and informational form. The first constraint is between public utility companies and the collectors that send the separated waste to be recovered/recycled. The presence of this constraint is significant, as illustrated in the following example. The waste inflow to the public utility companies (COL_PUC(KOM1)) was 1,997,524 tonnes in 2016 and 2,481,712 tonnes in 2020 (Table 2), whereas the outflow (COL_SEP (KOM1)) to recovery operators was only 13,024 tonnes in 2016 and 16,731 tonnes in 2020 (Table 2). The theory of constraints shows that limited gains can be achieved by optimisation of all parts of the system, where the main constraints are typically neglected. Equally, most operational improvements will be gained by focusing on and optimising the constraints [54]. For instance, in the system analysed here, government or private investments into new recycling facilities would yield little improvement while the separate collection of waste is the main constraint.
The second constraint to the system is the informal sector. This constraint can be classified as a policy and information constraint. Firstly, this sector is unregulated and the agents in this sector operate under no guidance by state agencies. Consequently, it is excluded from any data sharing, which is obligatory for the other entities in the waste system. This part of the system accounts for a large portion of the waste flow (COL_SEP(GIO6)). As shown in Table 2, in 2020 this sector contributed 305,000 tonnes of separately collected waste, which is equal to 63.2% of all separated waste to the collectors. As mentioned before, this sector is unregulated, and therefore, this figure could be larger.
A number of approaches exist for defining and measuring the fragility of a complex system, and the system analysed here defines which risk analysis method can be used. The main advantage of this method is its capability to be configured for analysing different types of socio-economic systems. The method originates from the financial risk analysis, and robust heuristics for measuring fragility are outlined in [55]. Naturally, the approach for measuring fragility for a financial institution’s balance sheet or a portfolio [56] will differ from analysing the fragility of an industrial system or a supply chain [40]. A sub-model analyses fragility through heuristics adopted for system dynamics structures [57]. In system dynamics models, nonlinear effects are a common phenomenon due to the use of feedback loops and delays influenced by stocks. The designed model has a high number of feedback loops and delay structures to better simulate the volatility of the real system. However, for fragility modelling, the carrying capacity (CC) structure was utilised. The use of CC structures for system dynamics modelling is a common practice, especially for the robust model design of ecological systems [58]. The dynamic behaviour that is caused by CC structures or the presence of stocks for redundancy resources [57] is a concave decline and a lack of recovery, which will be shown below in the model.
If liquidation of the informal sector is a selected scenario, the results will indicate that this constraint is a source of fragility to the system as well as a source of inefficiency. The blue area in Figure 7 indicates the population of agents in this sector that would be removed, whereas the red area represents the percentage of the population that would move into legal operations. The policy of liquidating the informal sector is a policy of shutting down illegal waste collection and stockpiling activities. However, it would be a clear source of fragility to the whole system if such actions were taken. As shown in Figure 7, a concave response would emerge with the population of agents that would stay out of business indefinitely.
As mentioned before, the informal sector accounted for 63.2% of all separated waste that was sent to the collectors, and disruption in this sector would cause major losses for the recycling facilities. The dynamic behaviour shown in Figure 8 is based on multiple assumptions and available published data for Serbia and the other countries. The characteristics of the informal sector economic agents were studied extensively over the years [59], including their differences and similarities to the formal sector [60]. When modelling this sector, certain generic characteristics emerged, including tax avoidance, unskilled labour force, and large wage gaps compared to the formal sector [61]. The sub-model makes assumptions about the transition capabilities of the informal sector, based on a comprehensive body of research of the informal sector in Serbia [62]. The reason for a concave loss and little recovery, if aggressive regulation is introduced, is due to a number of barriers that the informal sector would face if it functioned like the formal sector, including illiteracy, disintegration from the system [63], a high degree of poverty, and lack of resources [64]. The model assumes that a limited number of agents in this sector required transition capabilities (from informal to formal) to be implemented in a short period. The model accounts for an economic phenomenon of transition barriers, which often emerges after a regulatory shock to a municipal waste system [65] or privatisation of waste companies [66]. The red area in Figure 7 rises for the first couple of years and then stays flat, due to a common phenomenon of creating local monopolies that produce this output. A few agents in the informal sector would be in a position to overcome the regulatory and capital barriers and create economies of scale that might indefinitely prevent others from this sector from following the transition and entering the same market.
In Figure 8, a decrease in informal sector capacity (blue line) is shown together with the predicted contribution from public utility companies (red line) to cover for the lost capacity.
The predicted PUC capacity increase can be viewed as a step function. For the system’s sustainability, a required increase in capacity of public utility companies needs to be at least 40% of the informal sector capacity by 2024, when the collapse in the capacity of the informal sector is projected. It is important to point out that this would require the public utility companies to separately collect and segment approximately 150,000 tonnes of waste, which would be almost a tenfold increase from their 2020 capacity. This would be an uncertain endeavour that would require large capital investments by the government. The model simulates a more conservative increase in capacity, which would take far longer for the capacity to recuperate. This research indicates that public utility companies need to have an idle capacity to take over in the case when other entities are delayed or shut down. The lack of idle capacity or over-optimisation is a universal phenomenon for waste management companies worldwide [67]. Any kind of policy that can generate steep declines in capacity should be avoided.
It is evident that the informal sector plays a crucial role in reaching the EU recycling targets, as shown in Table 8, as the largest volume of separated waste belonged to this sector for the analysed period. It is important to point out that this trend is highly uncertain and unsustainable. As stated before, the informal sector is highly unregulated, with little oversight from government agencies. High risk is constantly present with the operations of the informal sector, despite the fact it co-exists and operates with the formal sector [68].
It is quite common for governments in developing countries to use aggressive policies to address the issue of the informal sector, all in the name of “modernisation programs” [69]. It is assumed that up to 2% of the urban population across developing countries, sees waste-picking activities as the main source of income [70]. It is important to take into consideration that any aggressive policies with the informal sector, along with the effects on the waste sector, would also strip away the main source of income for the most vulnerable and marginalised part of society. There is substantial data on the positive effects that NGO support programmes can bring to the informal sector as far as waste collection efficiency and data sharing is concerned [71]. A more efficient and integrated informal sector can be achieved through initiatives that aim at data sharing and operational integration, instead of just focusing on restrictive policies.

4.4. Simulating a Fragile Policy

One of the common government policies regarding the informal sector is to avoid large-scale interventions that affect the whole sector and focus on one segment of the sector. It is important to point out that the informal sector as presented in the system dynamics model covers 12 waste fractions (Table 1). Certain fractions are specialised, where agents are only committed to that type of waste. Governments in developing countries typically shut down and regulate the informal sector segment, usually focused on a large and profitable waste collection fraction [69]. However, this type of policy, even though it is focused on a particular segment of the waste sector and with mostly an economic goal in mind, usually is a fragile strategy that often backfires [72].
One of the typically targeted segments for regulation of the informal sector is the paper and cardboard waste fraction, as a segment with a high economic impact [73]. System response prediction for the shutdown of paper and cardboard operations would take four years, as shown in Figure 9.
One of the assumptions when implementing these measures is that the part of the informal sector that was regulated would change to another type of waste fraction. Informal sector agents transitioning to less regulated or less labour-intensive types of waste, like e-waste [74], or transitioning to exclusively collecting and segmenting WEEE instead of other municipal solid waste, is a proven phenomenon [74,75]. However, in the developed model, limits to growth were assumed when the growth rates were defined. With that being the case, a general decrease in the recycling rate is the only certain outcome, since no other agent has the carrying capacity to pick up to losses for the informal sector. In the simulation under the baseline scenario, a gradual shutdown of the paper and cardboard fraction would lead to almost one third less collected waste by the informal sector in the period from 2016 to 2035. The informal sector would cumulatively collect 6,184,961 tonnes of waste over this period instead of collecting 9,085,213 tonnes.
Despite the strategy focusing on only one out of 12 fractions of the waste sector, there are clear signs of potentially large losses that will be hard to recover. The informal sector is an obvious source of fragility to the whole system. The sector will generate volatile and unexpected outcomes if it is approached with aggressive regulatory actions. The state of the art offers alternatives for boosting data sharing, micro-enterprise formation, and a higher level of collaboration with the public sector [73].

5. Discussion

The research took a multidisciplinary approach to analysing the municipal waste sector in the Republic of Serbia. The developed model is based on the analysis of the waste system as a whole. Focusing on one part of the system can generate great insight; however, to identify the most influential variables, the system must be analysed as an integrated continuous process. Firstly, the research produced a graphical representation of the waste system of the country, including the model boundaries. Defining the model boundaries and the significant variables of the model plays a key role in the model-building process of complex systems [21]. The graphical representation allows for better data gathering and further development of the numerical model by the Serbian Environmental Protection Agency. The numerical simulations were preceded by the qualitative analysis of the waste system, including multiple iterations, since many interconnected parts are unknown even to industry stakeholders. In a collaborative effort with the agency, the key waste indicators and required recycling targets from the EU were implemented into the numerical model. The numerical model went through verification and validation procedures using the Vensim simulation environment, where the output results were validated against several datasets from government agencies. In addition, the model went through a verification procedure of the selected parameters, including a comprehensive sensitivity analysis. The model boundary was set not to include excess population or economic data, as the model would increase in unnecessary complexity. Once the numerical model was validated, further analysis of the baseline scenario and optimal recycling scenario was carried out. Both scenarios show the limitations of the waste system to achieve the recycling targets set by the EU. The generated scenarios point out the informal sector as the part of the system that carries the largest leverage in achieving the optimal recycling rate. Furthermore, a sub-model was constructed to analyse the complex behaviour of this part of the model. It can be of great insight when analysing the behaviour of complex systems to find the most limiting factor and the most fragile part of the system. Inherent limitations and hazards in forecasting with precision [26], can be suppressed and avoided if the management focus is on the largest constraint and the primary source of fragility. This work was built on the previously published work by the authors on fragility as a viable risk method for the industrial and corporate systems, which was now applied to a large environmental system. In the case of a fragility analysis of an industrial or corporate system, parameters concerning financial data along with human resources or other economic parameters would be paramount to the model. The developed model of the waste system has shown that economic data were not essential in terms of the general feasibility of the set EU targets. Future research concerning the implementation aspects of reaching the set targets or optimising the system should take into consideration more economic factors. The conducted research approached an ecological system for a fragility analysis, whereas past research in the risk management field has focused on using this risk method mostly in the financial sector. Fragility analysis can be highly useful, as it points out the main destabilising or constraining factor of the system.

6. Conclusions

The developed model and the scenarios considered identify the informal sector as the main source of fragility and the limiting factor to the municipal waste management system in Serbia. This implies that little would be gained if a high fidelity numerical model were employed, since small changes in the informal sector can generate significant changes in the overall system. The optimal recycling rate scenario shows how likely it would be to reach the 2035 annual recycling targets set by the EU. This is due to the significance of the informal sector in achieving the required output. The baseline scenario estimates an overall recycling rate of 39.35% in 2035, which relies on the informal sector. The sub-model, analysing the informal sector, has shown that the immediate shutdown of this unregulated sector and corresponding public utility companies taking over was exceedingly fragile. It was observed that public utility companies do not have sufficient idle capacity to quickly pick up larger-scale capacity losses in the system, due to logistics and operational issues. The sub-model observed an alternative option for the informal sector, which is to eliminate the informal waste collection and operations segment. However, this is a fragile policy that would decrease a substantial throughput of separately collected waste and bring in uncertainty related to the lost capacity recuperation. The research concludes that mapping and analysis of the whole system are beneficial since the relevant stakeholders and policymakers do not have an adequate overview or information on the system operation. Fragility analysis can be effectively used for both financial and non-financial systems. System dynamics provides good simulation capability for analysing the fragility of non-financial systems through the effective use of feedback loops and carrying-capacity structures. Stakeholders involved in the research project had no difficulty in understanding the stock and flow structure of the model or the policies that the model is simulating. Future research initiatives should focus more on the management and operations side of the defined fragile entity.

Author Contributions

Conceptualisation, M.J. and N.J.; methodology, M.J. and G.B.B.; software, M.J.; validation, N.J., G.B.B., and I.M.; formal analysis, M.S. (Miladin Stefanović).; investigation, M.J. and M.S. (Marija Savković).; resources, N.J.; data curation, G.B.B.; writing—original draft preparation, M.J.; writing—review and editing, I.M.; visualisation, N.J. and M.S. (Marija Savković).; supervision, Y.K. and G.B.B.; project administration, M.S. (Miladin Stefanović) and Y.K.; funding acquisition, M.S. (Miladin Stefanović). and N.J. All authors have read and agreed to the published version of the manuscript.

Funding

This research was done by Peter the Great St. Petersburg Polytechnic University and supported under the strategic academic leadership programme “Priority 2030” of the Russian Federation (Agreement 075-15-2021-1333 dated 30 September 2021).

Acknowledgments

The authors wish to extend special thanks to the Serbian Environmental Protection Agency (SEPA) for the technical support. The assistance provided by Nebojša Redžić, Head of Department of National Register of Pollution Sources, SEPA, is greatly appreciated.

Conflicts of Interest

The authors declare no conflict of interest.

References

  1. Wilson, D.C. Global waste management outlook. In International Solid Waste Association; UNEP: Nairobi, Kenya, 2015. [Google Scholar]
  2. Baud, I.; Grafakos, S.; Hordijk, M.; Post, J. Quality of Life and Alliances in Solid Waste Management: Contributions to urban sus-tainable development. Cities 2001, 18, 3–12. [Google Scholar] [CrossRef]
  3. Tamosiuniene, R.; Demianchuk, M.; Koval, V. State regulation of bankruptcy relations in the national economy. Econ. Ecol. Socium 2019, 3, 19–27. [Google Scholar] [CrossRef] [Green Version]
  4. Edomah, N. Regional Development in Africa: An Overview; IntechOpen: London, UK, 2020. [Google Scholar]
  5. Nnorom, I.; Osibanjo, O. Overview of electronic waste (e-waste) management practices and legislations, and their poor applications in the developing countries. Resour. Conserv. Recycl. 2008, 52, 843–858. [Google Scholar] [CrossRef]
  6. Yang, H.; Xia, J.; Thompson, J.R.; Flower, R.J. Urban construction and demolition waste and landfill failure in Shenzhen, China. Waste Manag. 2017, 63, 393–396. [Google Scholar] [CrossRef]
  7. Heidrich, O.; Harvey, J.; Tollin, N. Stakeholder analysis for industrial waste management systems. Waste Manag. 2009, 29, 965–973. [Google Scholar] [CrossRef] [PubMed]
  8. Chung, S.S.; Lo, C. Local waste management constraints and waste administrators in China. Waste Manag. 2008, 28, 272–281. [Google Scholar] [CrossRef] [PubMed]
  9. Đekić, I. Lean manufacturing in two Serbian food companies–case studies. Int. J. Qual. Res. 2012, 6, 131–136. [Google Scholar]
  10. Hadžistević, M.; Morača, S. Networks and Quality Improvement. Int. J. Qual. Res. 2009, 3, 353–361. [Google Scholar]
  11. Rother, M.; Shook, J. Learning to See: Value Stream Mapping to Add Value and Eliminate Muda; Lean Enterprise Institute: Cambridge, MA, USA, 2003. [Google Scholar]
  12. Dadzie, D.K.; Kaliluthin, A.K.; Kumar, D.R. Exploration of Waste Plastic Bottles Use in Construction. Civ. Eng. J. 2020, 6, 2262–2272. [Google Scholar] [CrossRef]
  13. Al-Hasan, S.J.A.; Balamuralikrishnan, R.; Altarawneh, M. Eco-Friendly Asphalt Approach for the Development of Sustainable Roads. J. Hum. Earth Future 2020, 1, 97–111. [Google Scholar] [CrossRef]
  14. Rehman, A.; Khan, K.A.; Hamid, T.; Nasir, H.; Ahmad, I.; Alam, M. Effective Utilization of Municipal Solid Waste as Substitute for Natural Resources in Cement Industry. Civ. Eng. J. 2020, 6, 238–257. [Google Scholar] [CrossRef]
  15. Xiao, S.; Dong, H.; Geng, Y.; Tian, X.; Liu, C.; Li, H. Policy impacts on Municipal Solid Waste management in Shanghai: A system dynamics model analysis. J. Clean. Prod. 2020, 262, 121366. [Google Scholar] [CrossRef]
  16. Sukholthaman, P.; Sharp, A. A system dynamics model to evaluate effects of source separation of municipal solid waste management: A case of Bangkok, Thailand. Waste Manag. 2016, 52, 50–61. [Google Scholar] [CrossRef] [PubMed]
  17. Watson, K.J.; Blackstone, J.H.; Gardiner, S.C. The evolution of a management philosophy: The theory of constraints. J. Oper. Manag. 2006, 25, 387–402. [Google Scholar] [CrossRef]
  18. Mabin, V.J.; Balderstone, S.J. The performance of the theory of constraints methodology: Analysis and discussion of successful TOC applications. Int. J. Oper. Prod. Manag. 2003, 23, 568–595. [Google Scholar] [CrossRef]
  19. Mabin, V.J.; Balderstone, S.J. The World of the Theory of Constraints: A Review of the International Literature; CRC Press: Boca Raton, FL, USA, 2020. [Google Scholar] [CrossRef]
  20. Forrester, J.W. System dynamics—The next fifty years. Syst. Dyn. Rev. J. Syst. Dyn. Soc. 2007, 23, 359–370. [Google Scholar] [CrossRef]
  21. Sterman, J. Business Dynamics: Systems thinking and modeling for a complex world. In MIT Sloan School of Management; Working Paper Series; Massachusetts Institute of Technology: Cambridge, MA, USA, 2000. [Google Scholar]
  22. Lyneis, J.M.; Ford, D.N. System dynamics applied to project management: A survey, assessment, and directions for future research. Syst. Dyn. Theory Appl. 2007, 23, 157–189. [Google Scholar] [CrossRef]
  23. Jovičić, M.; Mačuzić, I.; Vukićević, A.; Demichela, M. Stress testing with system dynamics for enterprises: Proposing a new risk approach for the transition to circular economy and sustainable development. Recycl. Sustain. Dev. 2019, 12, 13–23. [Google Scholar] [CrossRef]
  24. Makridakis, S. If we cannot forecast how can we plan? Long Range Plan. 1981, 14, 10–20. [Google Scholar] [CrossRef]
  25. Makridakis, S. Chronology of the last six recessions. Omega 1982, 10, 43–50. [Google Scholar] [CrossRef]
  26. Makridakis, S.; Taleb, N. Living in a world of low levels of predictability. Int. J. Forecast. 2009, 25, 840–844. [Google Scholar] [CrossRef]
  27. Veeramachaneni, K. Why you’re not getting value from your data science. Harv. Bus. Rev. 2016, 7. Available online: https://hbr.org/2016/12/why-youre-not-getting-value-from-your-data-science (accessed on 30 October 2021).
  28. Nicholas Taleb, N. The black swan: The impact of the highly improbable. Victoria 2015, 250, 595–7955. [Google Scholar]
  29. Aven, T. On the meaning of a black swan in a risk context. Saf. Sci. 2013, 57, 44–51. [Google Scholar] [CrossRef]
  30. Anderson, S.C.; Branch, T.A.; Cooper, A.B.; Dulvy, N.K. Black-swan events in animal populations. Proc. Natl. Acad. Sci. USA 2017, 114, 3252–3257. [Google Scholar] [CrossRef] [PubMed] [Green Version]
  31. Murphy, J.F.; Conner, J. Beware of the black swan: The limitations of risk analysis for predicting the extreme impact of rare process safety incidents. Process. Saf. Prog. 2012, 31, 330–333. [Google Scholar] [CrossRef]
  32. Taylor, J.B.; Williams, J.C. A Black Swan in the Money Market. Am. Econ. J. Macroecon. 2009, 1, 58–83. [Google Scholar] [CrossRef]
  33. Hajikazemi, S.; Ekambaram, A.; Andersen, B.; Zidane, Y.J. A Black Swan–Knowing the unknown in projects. Procedia-Soc. Behav. Sci. 2016, 226, 184–192. [Google Scholar] [CrossRef] [Green Version]
  34. Vacante, M.; D’Agata, V.; Motta, M.; Malaguarnera, G.; Biondi, A.; Basile, F.; Malaguarnera, M.; Gagliano, C.; Drago, F.; Salamone, S. Centenarians and supercentenarians: A black swan. Emerging social, medical and surgical problems. BMC Surg. 2012, 12, S36–S36. [Google Scholar] [CrossRef] [Green Version]
  35. Hubbard, G. Measuring organizational performance: Beyond the triple bottom line. Bus. Strat. Environ. 2006, 18, 177–191. [Google Scholar] [CrossRef]
  36. Jovičić, M.; Mačužić, I.; Vukićević, A.; Demichela, M. Enterprise stress testing with system dynamics: A state of research and challenges. Proc. Eng. Sci. 2019, 1, 65–72. [Google Scholar] [CrossRef]
  37. Taleb, N.N. Antifragile: Things That Gain from Disorder; Random House Incorporated: New York, NY, USA, 2012; Volume 3. [Google Scholar]
  38. Taleb, N.N.; Read, R.; Douady, R.; Norman, J.; Bar-Yam, Y. The precautionary principle (with application to the genetic modification of organisms). arXiv 2014, arXiv:1410.5787. [Google Scholar]
  39. Clancy, T.R. Control: What we can learn from complex systems science. JONA J. Nurs. Adm. 2008, 38, 272–274. [Google Scholar] [CrossRef]
  40. Größler, A. A managerial operationalization of antifragility and its consequences in supply chains. Syst. Res. Behav. Sci. 2020, 37, 896–905. [Google Scholar] [CrossRef]
  41. Jovicic, N.; Boskovic, G. Indicators for Municipal and Packaging Waste for 2018–2020 according to Eurostat Requirements. Report-ENVAP 3, Environmental Accession Project; WP-Further Development of waste Indicators for Reporting on Waste Framework and Packaging and Packaging Waste DSIP Targets; 2021; in press. [Google Scholar]
  42. Directive 2008/98/EC of the European Parliament and of the Council of 19 November 2008 on Waste and Repealing Certain Directives; Amended by Directive (EU) 2018/851 of the European Parliament and of the Council of 30 May 2018. Available online: https://eur-lex.europa.eu/legal-content/EN/TXT/?uri=uriserv:OJ.L_.2018.150.01.0109.01.ENG (accessed on 10 October 2021).
  43. Rulebook on Daily Records and Annual Report on Waste with Guidance on Filing in; Official Gazette of Republic of RS: Beograd, Serbia, 2021; p. 79. (In Serbian)
  44. Guidance for the Compilation and Reporting of Data on Municipal Waste according to Commission Implementing Decisions 2019/1004/EC and 2019/1885/EC, and the Joint Questionnaire of Eurostat and OECD. Directorate E: Sectoral and Regional Statistics Unit E-2: Environmental Statistics and Accounts; Sustainable Development; 2021. Available online: https://ec.europa.eu/eurostat/documents/342366/351811/Guidance+on+municipal+waste+data+collection/ (accessed on 12 October 2021).
  45. Commission Implementing Decision (EU) 2019/1004 of 7 June 2019 Laying down Rules for the Calculation, Verification and Reporting of Data on Waste in Accordance with Directive 2008/98/EC of the European Parliament and of the Council and re-pealing Commission Implementing Decision C (2012) 2384; 2019. Available online: https://eur-lex.europa.eu/eli/dec_impl/2019/1004/oj (accessed on 12 October 2021).
  46. Commission Decision2011/753/EU of 18 November 2011 Establishing Rules and Calculation Methods for Verifying Compliance with the Targets set in Article 11(2) of Directive 2008/98/EC of the European Parliament and of the Council; 2011. Available online: https://eur-lex.europa.eu/legal-content/EN/TXT/?uri=CELEX%3A32011D0753 (accessed on 12 October 2021).
  47. Annual Report on the State of the Environment in the Republic of Serbia for 2020; Serbian Environmental Protection Agency: Beograd, Serbia, 2020. (In Serbian)
  48. Eurostat. Municipal Waste Statistics—Statistics Explained. Available online: https://ec.europa.eu/eurostat/statistics-explained/index.php?title=Municipal_waste_statistics (accessed on 10 November 2019).
  49. World Bank. Serbia’s New Growth Agenda; World Bank: Washington, DC, USA, 2019. [Google Scholar]
  50. Statistical Office of the Republic of Serbia. Estimated Number of Population in the Republic of Serbia. 2020. Available online: https://www.stat.gov.rs/en-US/vesti/20210701-procenjen-broj-stanovnika-2020/?s=1801 (accessed on 2 November 2021).
  51. Williams, R.; Irati, A.; Andreea, B.; Graeme, N. Emerging Challenges of Waste Management in Europe-Limits of Recycling [Internet]; European Environment Agency (EEA): København, Denmark, 2020. [Google Scholar]
  52. Van der Linden, A. Scenarios for Municipal Waste Recycling Based on the European Reference Model on Municipal Waste—A Contribution to the First Early Warning Report [Internet]; The European Environment Agency: København, Denmark, 2018. [Google Scholar]
  53. Study to Support the Implementation of Reporting Obligations Resulting from the New Waste Legislation Adopted in 2018. Eunomia Research & Consulting. 2018. Available online: https://op.europa.eu/en/publication-detail/-/publication/3d72ef00-bcac-11e9-9d01-01aa75ed71a1 (accessed on 12 October 2021).
  54. Gupta, M.C.; Boyd, L.H. Theory of constraints: A theory for operations management. Int. J. Oper. Prod. Manag. 2008, 28, 991–1012. [Google Scholar] [CrossRef]
  55. Taleb, N.N.; Douady, R. A Map and Simple Heuristic to Detect Fragility, Antifragility, and Model Error; NYU-Poly Working Paper; SSRN: Amsterdam, The Netherlands, 2011. [Google Scholar] [CrossRef] [Green Version]
  56. Taleb, M.N.; Canetti, M.E.; Kinda, M.T.; Loukoianova, M.E.; Schmieder, M.C. A New Heuristic Measure of Fragility and Tail Risks: Application to Stress Testing; International Monetary Fund: Washington, DC, USA, 2012. [Google Scholar] [CrossRef]
  57. De Bruijn, H.; Größler, A.; Videira, N. Antifragility as a design criterion for modelling dynamic systems. Syst. Res. Behav. Sci. 2019, 37, 23–37. [Google Scholar] [CrossRef] [Green Version]
  58. Feng, L.-H.; Zhang, X.-C.; Luo, G.-Y. Application of system dynamics in analyzing the carrying capacity of water resources in Yiwu City, China. Math. Comput. Simul. 2008, 79, 269–278. [Google Scholar] [CrossRef]
  59. De Paula, A.; Scheinkman, J.A. The Informal Sector; National Bureau of Economic Research Cambridge: Cambridge, MA, USA, 2007. [Google Scholar]
  60. Rauch, J.E. Modelling the informal sector formally. J. Dev. Econ. 1991, 35, 33–47. [Google Scholar] [CrossRef]
  61. Amaral, P.S.; Quintin, E. A competitive model of the informal sector. J. Monetary Econ. 2006, 53, 1541–1553. [Google Scholar] [CrossRef]
  62. Krstić, G.; Schneider, F. Formalizing the Shadow Economy in Serbia: Policy Measures and Growth Effects; Springer: Berlin/Heidelberg, Germany, 2015. [Google Scholar]
  63. Kogan, I. When informal is normal. On the role of credentials and contacts for the job entry in Serbia. Res. Soc. Strat. Mobil. 2011, 29, 445–458. [Google Scholar] [CrossRef]
  64. Blunch, N.-H. Bound to lose, bound to win? The financial crisis and the informal-formal sector earnings gap in Serbia. IZA J. Labor Dev. 2015, 4, 317. [Google Scholar] [CrossRef] [Green Version]
  65. Massarutto, A. Municipal waste management as a local utility: Options for competition in an environmentally-regulated industry. Util. Policy 2007, 15, 9–19. [Google Scholar] [CrossRef]
  66. Bel, G.; Warner, M. Does privatization of solid waste and water services reduce costs? A review of empirical studies. Resour. Conserv. Recycl. 2008, 52, 1337–1348. [Google Scholar] [CrossRef]
  67. Minakova, I.; Bukreeva, B.T.; Timofeeva, O. Improvement of solid waste management: Organizational and technological aspects. J. Appl. Eng. Sci. 2018, 16, 99–103. [Google Scholar] [CrossRef] [Green Version]
  68. Katusiimeh, M.W.; Burger, K.; Mol, A.P. Informal waste collection and its co-existence with the formal waste sector: The case of Kampala, Uganda. Habitat Int. 2012, 38, 1–9. [Google Scholar] [CrossRef]
  69. Ezeah, C.; Fazakerley, J.A.; Roberts, C.L. Emerging trends in informal sector recycling in developing and transition countries. Waste Manag. 2013, 33, 2509–2519. [Google Scholar] [CrossRef]
  70. Medina, M. The world’s scavengers: Salvaging for sustainable consumption and production. In Globalization and the Environment; AltaMira Press: Lanham, MD, USA, 2007. [Google Scholar]
  71. Zia, H.; Devadas, V.; Shukla, S. Assessing informal waste recycling in Kanpur City, India. Manag. Environ. Qual. Int. J. 2008, 19, 597–612. [Google Scholar] [CrossRef]
  72. Goldstein, J. A Pyrrhic Victory? The Limits to the Successful Crackdown on Informal-Sector Plastics Recycling in Wenan County, China. Mod. China 2016, 43, 3–35. [Google Scholar] [CrossRef]
  73. Medina, M. The informal recycling sector in developing countries: Organizing waste pickers to enhance their impact. In Gridlines; No. 44; World Bank: Washington, DC, USA, 2008. [Google Scholar]
  74. Chi, X.; Wang, M.; Reuter, M. E-waste collection channels and household recycling behaviors in Taizhou of China. J. Clean. Prod. 2014, 80, 87–95. [Google Scholar] [CrossRef]
  75. Prasad, K.D.; Murthy, P.K.; Gireesh, C.H.; Prasad, M.; Sravani, K. Prioritization of e-waste management strategies towards green computing using AHP-QFD approach. Proc. Eng. 2021, 3, 33–40. [Google Scholar] [CrossRef]
Figure 1. Macro diagram of waste flows within the municipal waste sector in Serbia.
Sustainability 14 00862 g001
Figure 2. Sources and destinations of separately collected municipal waste.
Sustainability 14 00862 g002
Figure 3. System dynamics model of the national municipal waste flows.
Sustainability 14 00862 g003
Figure 4. Sub-model for analysis of the informal sector.
Sustainability 14 00862 g004
Figure 5. Distribution of waste indicators for the baseline scenario for the period 2016–2035: (a) total municipal waste generated (GEN), collected mixed municipal waste (Mix_MSW), separately collected waste (COL_SEP), and recycled municipal waste (RCY); (b) municipal waste recycling rate (RCY_R) and recycling rate targets (EU Targets) set by Directive (EU) 2018/851 [42].
Sustainability 14 00862 g005
Figure 6. Distribution of waste indicators for the scenario of the optimal recycling potential for the period 2016–2035: (a) total municipal waste generated (GEN), collected mixed municipal waste (Mix_MSW), separately collected waste (COL_SEP), and recycled municipal waste (RCY); (b) municipal waste recycling rate (RCY_R) and recycling rate targets (EU Targets) set by Directive (EU) 2018/851 [42].
Sustainability 14 00862 g006
Figure 7. Liquidation of the informal sector.
Sustainability 14 00862 g007
Figure 8. Decrease in informal sector capacity and public utility companies catching up.
Sustainability 14 00862 g008
Figure 9. The shutdown of the informal sector for paper and cardboard in the baseline scenario.
Sustainability 14 00862 g009
Table 1. Municipal waste material breakdown for 2020.
Waste FractionShare
(%)
Mix_MSW
(t)
COL_SEP
(t)
GEN
(t)
Metals4.3105,99447,853153,848
Glass498,59922,238120,838
Plastic12.2300,72855,293356,021
Paper and cardboard6.2152,829229,973382,802
Bio-waste47.41,168,40111,4691,179,870
Wood2.971,48427,94599,429
Textiles3.381,3446181,405
WEEE4.3105,99460,704166,698
Batteries 0.002492170
Bulky waste0.0389374221359
Mixed waste14.4354,9570354,957
Other0.9623,66426,53650,199
Total1002,464,981482,5152,947,496
Table 2. Quantities for municipal solid waste calculated from the SEPA database.
Variable Name20162017201820192020
MSW_MIX(KOM1)1,984,5002,275,0002,340,9092,361,7482,464,981
COL_SEP(KOM1)13,02417,0925989580816,731
COL_SEP(GIO1)133,813140,708160,459168,569160,785
COL_SEP(GIO6)224,834265,057287,940291,784305,000
Table 3. Calculated municipal waste indicators for 2016–2020.
Waste Indicator20162017201820192020
Municipal waste generated (t)GEN = COL_PUC(KOM1) + COL_SEP(GIO1) + COL_SEP(GIO6)
2,356,1712,697,8572,795,2962,827,9102,947,497
Separately collected waste (t) COL_SEP = COL_SEP(KOM1) + COL_SEP(GIO1) + COL_SEP(GIO6)
371,671422,857454,387466,162482,515
Recycled waste (t) RCY = RCV (R3, R4, R5)
341,345394,863421,826435,233455,457
Energy recovery (t) RCV_E = RCV (R1)
29113224386166895860
Other treatments (t) RCV_OTH = RCV (Other)
23,54620,46524,42519,81816,580
Recycling rate (%) RCY_R = RCV (R3, R4, R5)/GEN
14.4914.6415.0915.3915.45
Table 4. Municipal waste indicators calculated for the baseline scenario.
Waste Indicator2020202520302035
Municipal waste generated (t)2,947,4963,110,1363,281,7513,462,835
Municipal waste generated per capita (kg/cap)427451476502
Separately collected waste (t) 482,515695,2941,001,9051,443,724
Collected mixed municipal waste (t)2,464,9812,414,8422,279,8462,019,111
Recycled waste (t)455,457656,304945,7201,362,764
Recycling rate (%) 15.4521.1028.8239.35
Table 5. Maximal separation rates and growth rates for separately collected municipal waste fractions for the period 2020–2035.
Waste FractionGEN 2035
(t)
Max_SEP
(%)
COL_SEP 2035
(t)
Growth Rate
(% per Year)
Metals180,74696173,5168.97
Glass141,96577109,31311.20
Plastic418,26870292,78711.75
Paper and cardboard449,73196431,7424.29
Bio-waste1,386,157951,316,84937.20
Wood116,8144350,2303.99
Textiles 95,6387470,77260.15
WEEE195,84475146,8836.07
Batteries 82100829.68
Bulky waste15977511977.20
Mixed waste417,018000.00
Other58,9766035,3861.94
Total3,462,835 2,628,758
Table 6. The optimal recycling rate for 2035 based on average loss rates from maximum waste separation.
Waste FractionGEN 2035
(t)
COL_SEP2035
(t)
ALR
(%)
RCY 2035
(t)
RCY_R 2035
(%)
Metals180,746173,5162170,04694.08
Glass141,965109,3136102,75472.38
Plastic418,268292,78725219,59152.5
Paper and cardboard449,731431,74215366,98081.6
Bio-waste1,386,1571,316,849151,119,32280.75
Wood116,81450,230746,71439.99
Textiles 95,63870,772964,40267.34
WEEE195,844146,88312129,25766
Batteries 8282157085
Bulky waste159711977111469.75
Mixed waste417,0180000
Other58,97635,386732,90955.8
Total3,462,8352,628,758 2,253,15865.07
Table 7. Municipal waste indicators calculated for the scenario of the optimal recycling potential.
Waste Indicator2020202520302035
Municipal waste generated (t)2,947,4963,110,1363,281,7513,462,835
Municipal waste generated per capita (kg/cap)427451476502
Separately collected waste (t)482,515849,0701,494,0892,628,758
Collected mixed municipal waste (t)2,464,9812,261,0661,787,662834,077
Recycled waste (t)455,457775,0901,319,0362,253,158
Recycling rate (%) 15.4524.9240.1965.07
Table 8. Overview of separately collected waste in the scenario for optimal recycling potential.
Waste Indicator2020202520302035
Separately collected waste (t) 482,515849,0321,493,9542,628,758
   -Public/private utility companies (t)16,73129,44051,80291,151
   -Informal sector (t)305,000536,676944,3341,661,647
   -Generators (t)160,784282,917497,819875,961
Publisher’s Note: MDPI stays neutral with regard to jurisdictional claims in published maps and institutional affiliations.

