Article

Evolution of Overall Cotton Production and Its Determinants: Implications for Developing Countries Using Pakistan Case

1
Pakistan Research Center, Inner Mongolia Honder College of Arts and Sciences, Hohhot 010010, China
2
College of Economics and Management, Inner Mongolia Agriculture University, Hohhot 010010, China
3
School of Business and Tourism, Southern Cross University, East Lismore, NSW 2480, Australia
4
Department of Botany, University of Agriculture, Faisalabad 38000, Punjab, Pakistan
*
Authors to whom correspondence should be addressed.
Sustainability 2022, 14(2), 840; https://doi.org/10.3390/su14020840
Submission received: 19 October 2021 / Revised: 8 January 2022 / Accepted: 9 January 2022 / Published: 12 January 2022
(This article belongs to the Special Issue Sustainable Textile Marketing)

Abstract

:
Managing the declining yield of non-food crops has opened new strategic challenges amidst global uncertainties. The COVID-19 scenario has increased awareness of natural lifestyle and eco-friendly products, largely dependent on non-food crop material. This strategic shift requires moving beyond traditional farm practices to improve agricultural production efficiency, and developing countries in particular have shown a consistent loss in their self-sufficiency of industrial crops despite being major exporters of non-food crop materials. However, existing studies analyze production efficiencies of non-food crops from general or theoretical aspects often by virtual estimates from breaking down the multiple factors of crop productivity. This study examined multiple factors of crop production to identify “which crop inputs have been inefficiently used overtime” by tracking efficiency changes and various input issues in overall cotton production from practical aspects, i.e., scaling non-constant returns of those multiple factors would allow for the violation of various situations. Accordingly, a stochastic frontier approach was employed to measure the production frontier and efficiency relationship using time-series data of Pakistan’s cotton production from 1971–2018—a specific non-food crop perspective from a top-ranked cotton-producing country that has recently been shifted towards being a non-exporter of cotton due to low yield. The coefficient of area, seed, and labor indicates the positive relationship with cotton production, while fertilizer, irrigation, electricity, and machinery are statistically negative. This implies that policymakers need priority-based strategies for the judicial use of synthetic fertilizers, irrigation, a subsidy policy, and technology adoption, which could significantly improve the efficiencies of cotton productivity from the same land resources. Being adaptable to other developing economies, the analysis would strategically facilitate designing and developing affordable technology-driven solutions and their customized extensions towards sustainable non-food crop production practices and Agri-Resources efficiencies.

1. Introduction

Recent global uncertainties and life-threatening concerns have increased awareness of a healthier and natural lifestyle. Subsequently, it has increased the consumption of eco-friendly products and natural fibers, which demand the management of the declining cotton yield in developing countries to look beyond traditional farming practices [1,2]. Managing the constant declining productivity of non-food crops remains a challenge for developing countries [1]. To handle this challenge, producers in these countries mainly follow traditional practices either by bringing new lands into production (extensification) or increasing the use of crop inputs (intensification) to increase the yield [3]. This way of raising agricultural productivity in traditional economies makes up a shortage of resources due to a large population base with relatively little arable land and water, as well as the low acceleration of agricultural technological modernization [4]. Accordingly, the traditional farming model has become more and more unsustainable because of its reliance on the increased use of agricultural factor inputs and land resources [3], forcing producers in those countries to prefer growing food crops or shifting to other business practices to worsen the situation further. Consequently, some developing countries, which also top producers of non-food crops, have started importing these crops (USDA cotton outlook 2019). Since a significant global portion of global industrial crop produce relies on farmers’ technological expertise from developing countries [5], this trend would gradually increase the demand for non-food crops at the global level. In addition, these practices, coupled with global crises-driven uncertainties, hint at an upcoming alarming increasing demand for agricultural raw materials such as cotton, natural fiber, and jatropha in coming years, which could shift a typical global crisis into more intense and prolonged consequences [6]. For instance, since COVID-19, global consumption patterns have shifted towards natural lifestyle and eco-friendly products that significantly depend on industrial crops like cotton and its byproducts [7]. In this context, most researchers agree that developing countries would have to anticipate the upcoming industrial crop demand within the scarce financial and technological resources for sustainable non-food crop production practices [8], which is impractical without introducing affordable technology-driven solutions and their extensions [9].
Debates over the affordable technology-driven solutions continue to heavily focus on doing “more with less” in developing economies [3,10]. Subsequently, most researchers believe that a sustainable rise in agricultural output is possible with judicial use of agricultural inputs, i.e., an overall crop yield could proportionally be expanded without altering the input quantities used, or in other words, the crop input quantities could be reduced without changing the total crop production [11]. This assumption draws on a socio-ecological trade-off along the pathways of extensification or intensification in achieving sustainable crop growth, which demands us to identify favorable combinations of various factors of productivity growth, such as labor, land, capital, and inputs—the total factor productivity (TFP) in agriculture [3]. Accordingly, the functional scope of such a hypothesis is well exhibited through farming practices of modern economies that have remained the main engine of production growth and the increase in income as a way to modernize their economies and, rather than depending upon intensification or extensification, these systems concentrate on identifying the positive synergies between agriculture inputs [3]. Therefore, the critical element of crop productivity growth is estimating the technical inefficiency changes of various factors of crop production, which could facilitate the understanding of those factors of production involved in increasing production cost or low yield of non-food crops over the years [12]. However, understanding crop inputs inefficiencies over time from an empirical perspective is sensitive against agricultural-crop diversity and regions [13,14,15]; this hints to a need for a much closer production growth perspective to track technical efficiency change and technological factors of non-food crop production.
Given the proximity of perspective, cotton production becomes a typical case of the non-food crop for four reasons. First, cotton, also known as white gold, is the world’s most demanding non-food crop as a source of natural fiber for eco-friendly products, byproducts, lint, and edible oil [1]. It is the most wide-spreading profitable industrial crop for its role with more than 20% of the global share in all fiber use and is the global income to more than 250 million people worldwide [16]. Even with such a broad global reach, the current cotton production methods are environmentally unsustainable—ultimately undermining the industry’s ability to maintain future demands [17]. Moreover, various coalitions of international partners promote the sustainable production and use of cotton in multiple ways [18]. Second, developing countries are among world’s largest cotton producers with a 7% contribution to overall labor employment opportunities [16]; accordingly, their priorities in bringing cotton production in line with even minimally acceptable environmental standards are significantly challenged despite owning a huge tract of fertile agriculture land [1]. Third, the main challenge of these developing countries is lower cotton productivity than the rest of the world [19]. Even the irrigated area of these countries are underperformers for a given yield per unit from the rain-fed cotton-growing regions of the world (World textile information report 2019, USDA annual gain report 2017). Subsequently, farmers in these areas get comparatively less profit when harvesting cotton crops than other food crops, leading to a decrease in cotton crop area. Unfortunately, this situation has been worsening since 2010 in some developing countries and continues to decrease in more than 10 percent of the cropping area. Its reflection is observable because some of the world’s top cotton-producing developing countries have started to import cotton in recent years—an alarming sign of the upcoming increase in demand for raw cotton. Fourth, the low crop productivity of developing countries has a range of contributing socio-ecological factors, and knowing “which factors or their combinations are the main contributors” becomes more critical in identifying the positive integration of these factors for improving crop productivity [19]. In contrast, very few studies have examined the detailed resources of the productivity and technical efficiency of cotton over time [1,19,20], besides some mentioned limitations. For instance, this feature accommodates the accurate estimation of productivity measures breakdowns when multiple inputs lead to a single output [19], rather than concentrating on multiple-output and multiple-input technology [20] and failing to account for multiple input leads to single output technology when analyzing the productivity trend [12]. Some researchers have attempted a more specific perspective, yet productivity remains a secondary objective in those studies [1,21], or they did not account for multifactor analysis [20]. More importantly, these studies take the theoretical assumption of the accurate estimation of cotton productivity measures’ breakdowns even when accounting for multiple input technology [21]. This theoretical objective believes in obtaining the maximum output from inputs [1], which contrasts to the reality where not all inputs can achieve it; consequently, inefficiency may arise. From an implication perspective, scaling the non-constant returns is necessary when considering the overall impact on productivity, and violation of the various situations is one of the required conditions for long-run competitive equilibrium [22]. To summarize the points mentioned earlier, the situation reveals a significant knowledge gap that demands an implication-oriented multifactor analysis to track which factors of production drive the low crop productivity of cotton, particularly for developing countries. In the long term, such empirical analysis is critical in knowing whether a developing country’s farmers are progressive concerning technical efficiency change, technological change, and speed of knowledge-based learning skills to counter with the existing raw cottons’ supply and demand gap effectively.
Given this background, the study adopts a more specific case using a top-ranked cotton-producing country that has recently started importing raw cotton and struggling to manage the declining cotton yield, i.e., Pakistan’s cotton production represents the non-food crop perspective for developing countries. Accordingly, the main objective of this study is to estimate the production frontier and efficiency relationship of various factors from the implication aspect to identify those factors of production that influence overall cotton production over the years. Accordingly, a stochastic frontier approach was employed to measure the efficiency of the changes by using Pakistan’s cotton production time-series data from a much larger period, 1971–2018. This framework contributed to the existing literature in the following three ways. First, it estimates the indices of crop-wise technical efficiency changes, covering a longer time period using SFA, a parametric procedure for non-food crops. As the main benefit, the parametric approach is capable of accounting for composed error, thereby separating the noise from inefficiencies. This way, it tracks efficiency changes and technological changes in the overall productivity from practical aspects, i.e., scaling non-constant returns of those multiple factors that allow violation of various situations. Second, the SFA allows the functional specific need to accommodate (a) single output from multiple inputs, (b) it can test the hypothesis, and (c) it presents the availability of the maximum likelihood econometric estimates. This crop-specific imperial finding would identify the main drivers of inefficient crop production that might be influencing Pakistan’s self-sufficiency in cotton. Moreover, the study would also estimate the hypothesis of whether subsidies affect cotton crop production. Third, the study puts forward corresponding policy recommendations, specifically for improving cotton production efficiencies. Furthermore, in general, applying such analysis to other developing countries could realize the potential of affordable technology-driven solutions and Agri-Resource efficiencies for sustainable non-food crop production.

Cotton Production and Pakistan Case

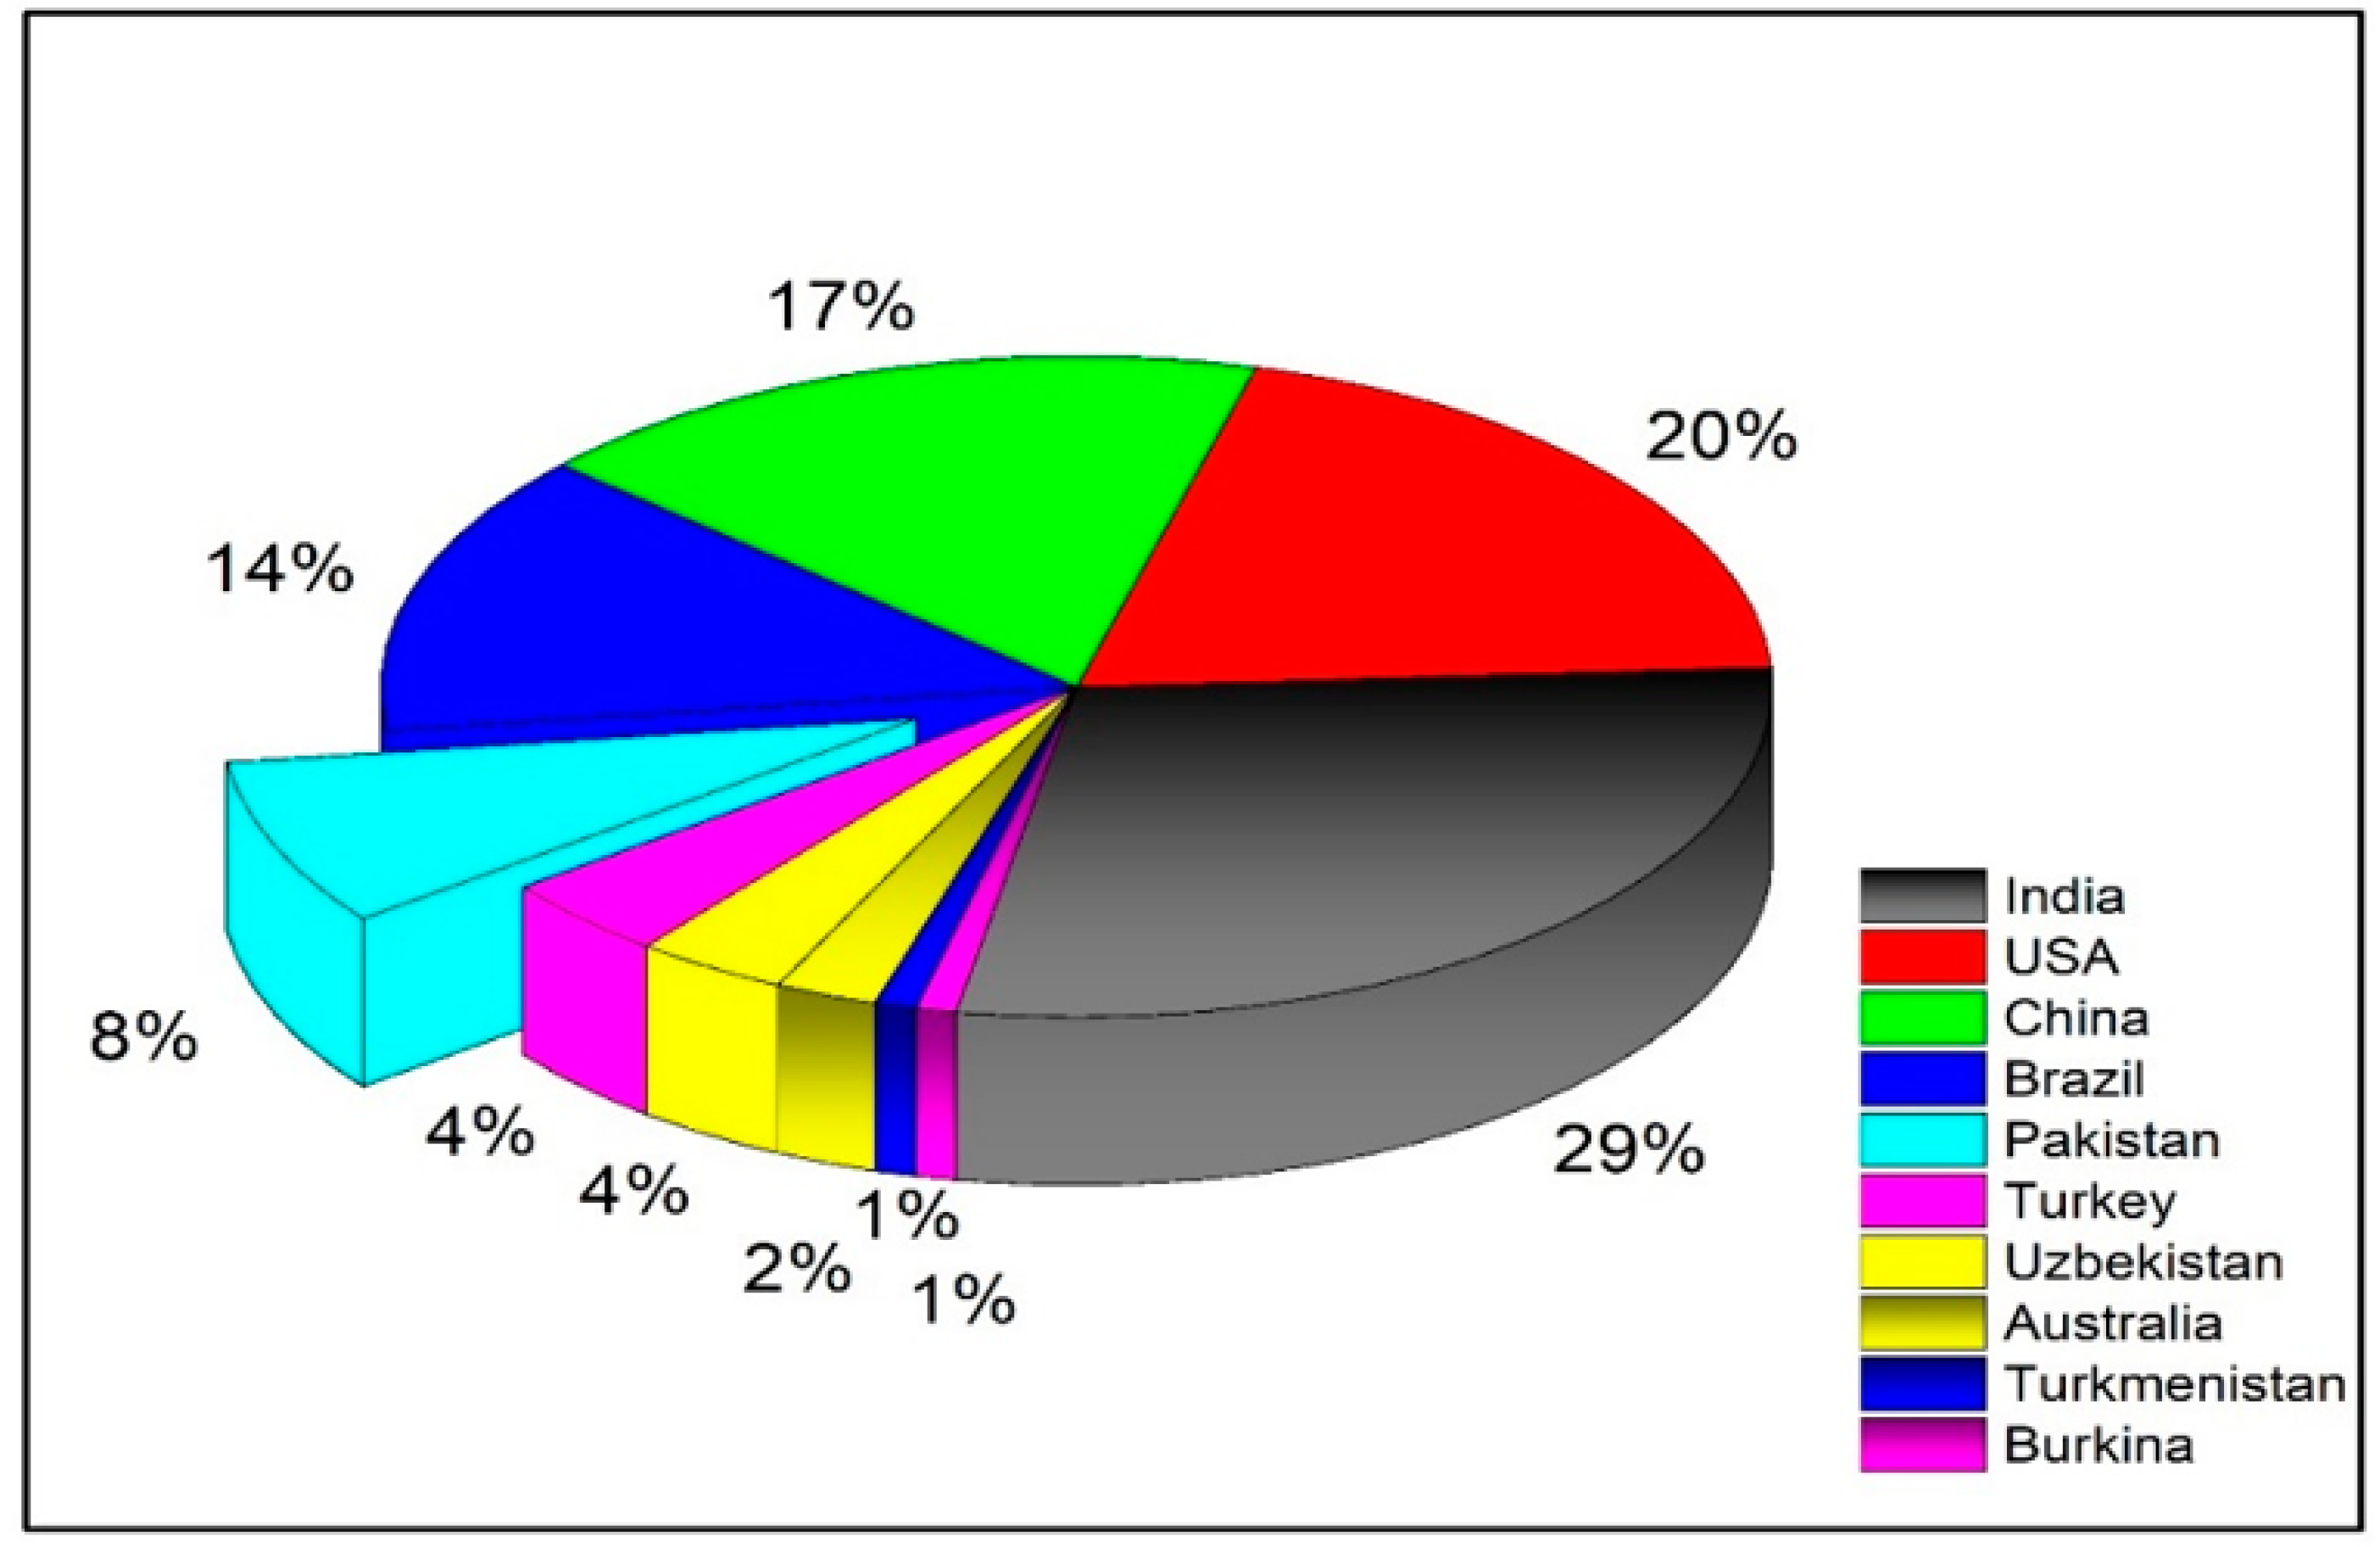
The study uses Pakistan’s cotton production as a typical case to analyze production factors from a much closer input issues and efficiency relationship perspective to represent the non-food crop in a developing country perspective for the following reasons. First, Pakistan is ranked among the top five largest cotton producers (Figure 1), is the 7th largest cloth producer worldwide, and cotton contributes 10% to the national GDP compared to the overall agriculture sector GDP share of 18.9% [22]. This sector also contributes to 42.3% of the labor force with employment and provides the raw materials for many value-added sectors [23], with 55% of the foreign earnings contribution, a share majorly dominated by cotton-based finished products [24]. Since Pakistan is a developing country, these states apparently favor the export; in contrast, Pakistan has been importing raw cotton for many years. Actually, Pakistan has not been exporting raw cotton since 2010, and it is the fourth country that ends up ending stalk (USDA cotton outlook 2019). Second, the main reason for increasing the import of raw cotton is that Pakistan’s cotton yield per hectare has had a gradually decreasing trend over the years, and the numbers are among the lowest in the world; even the countries that have a much smaller geographic area have a higher yield per hectare than Pakistan [
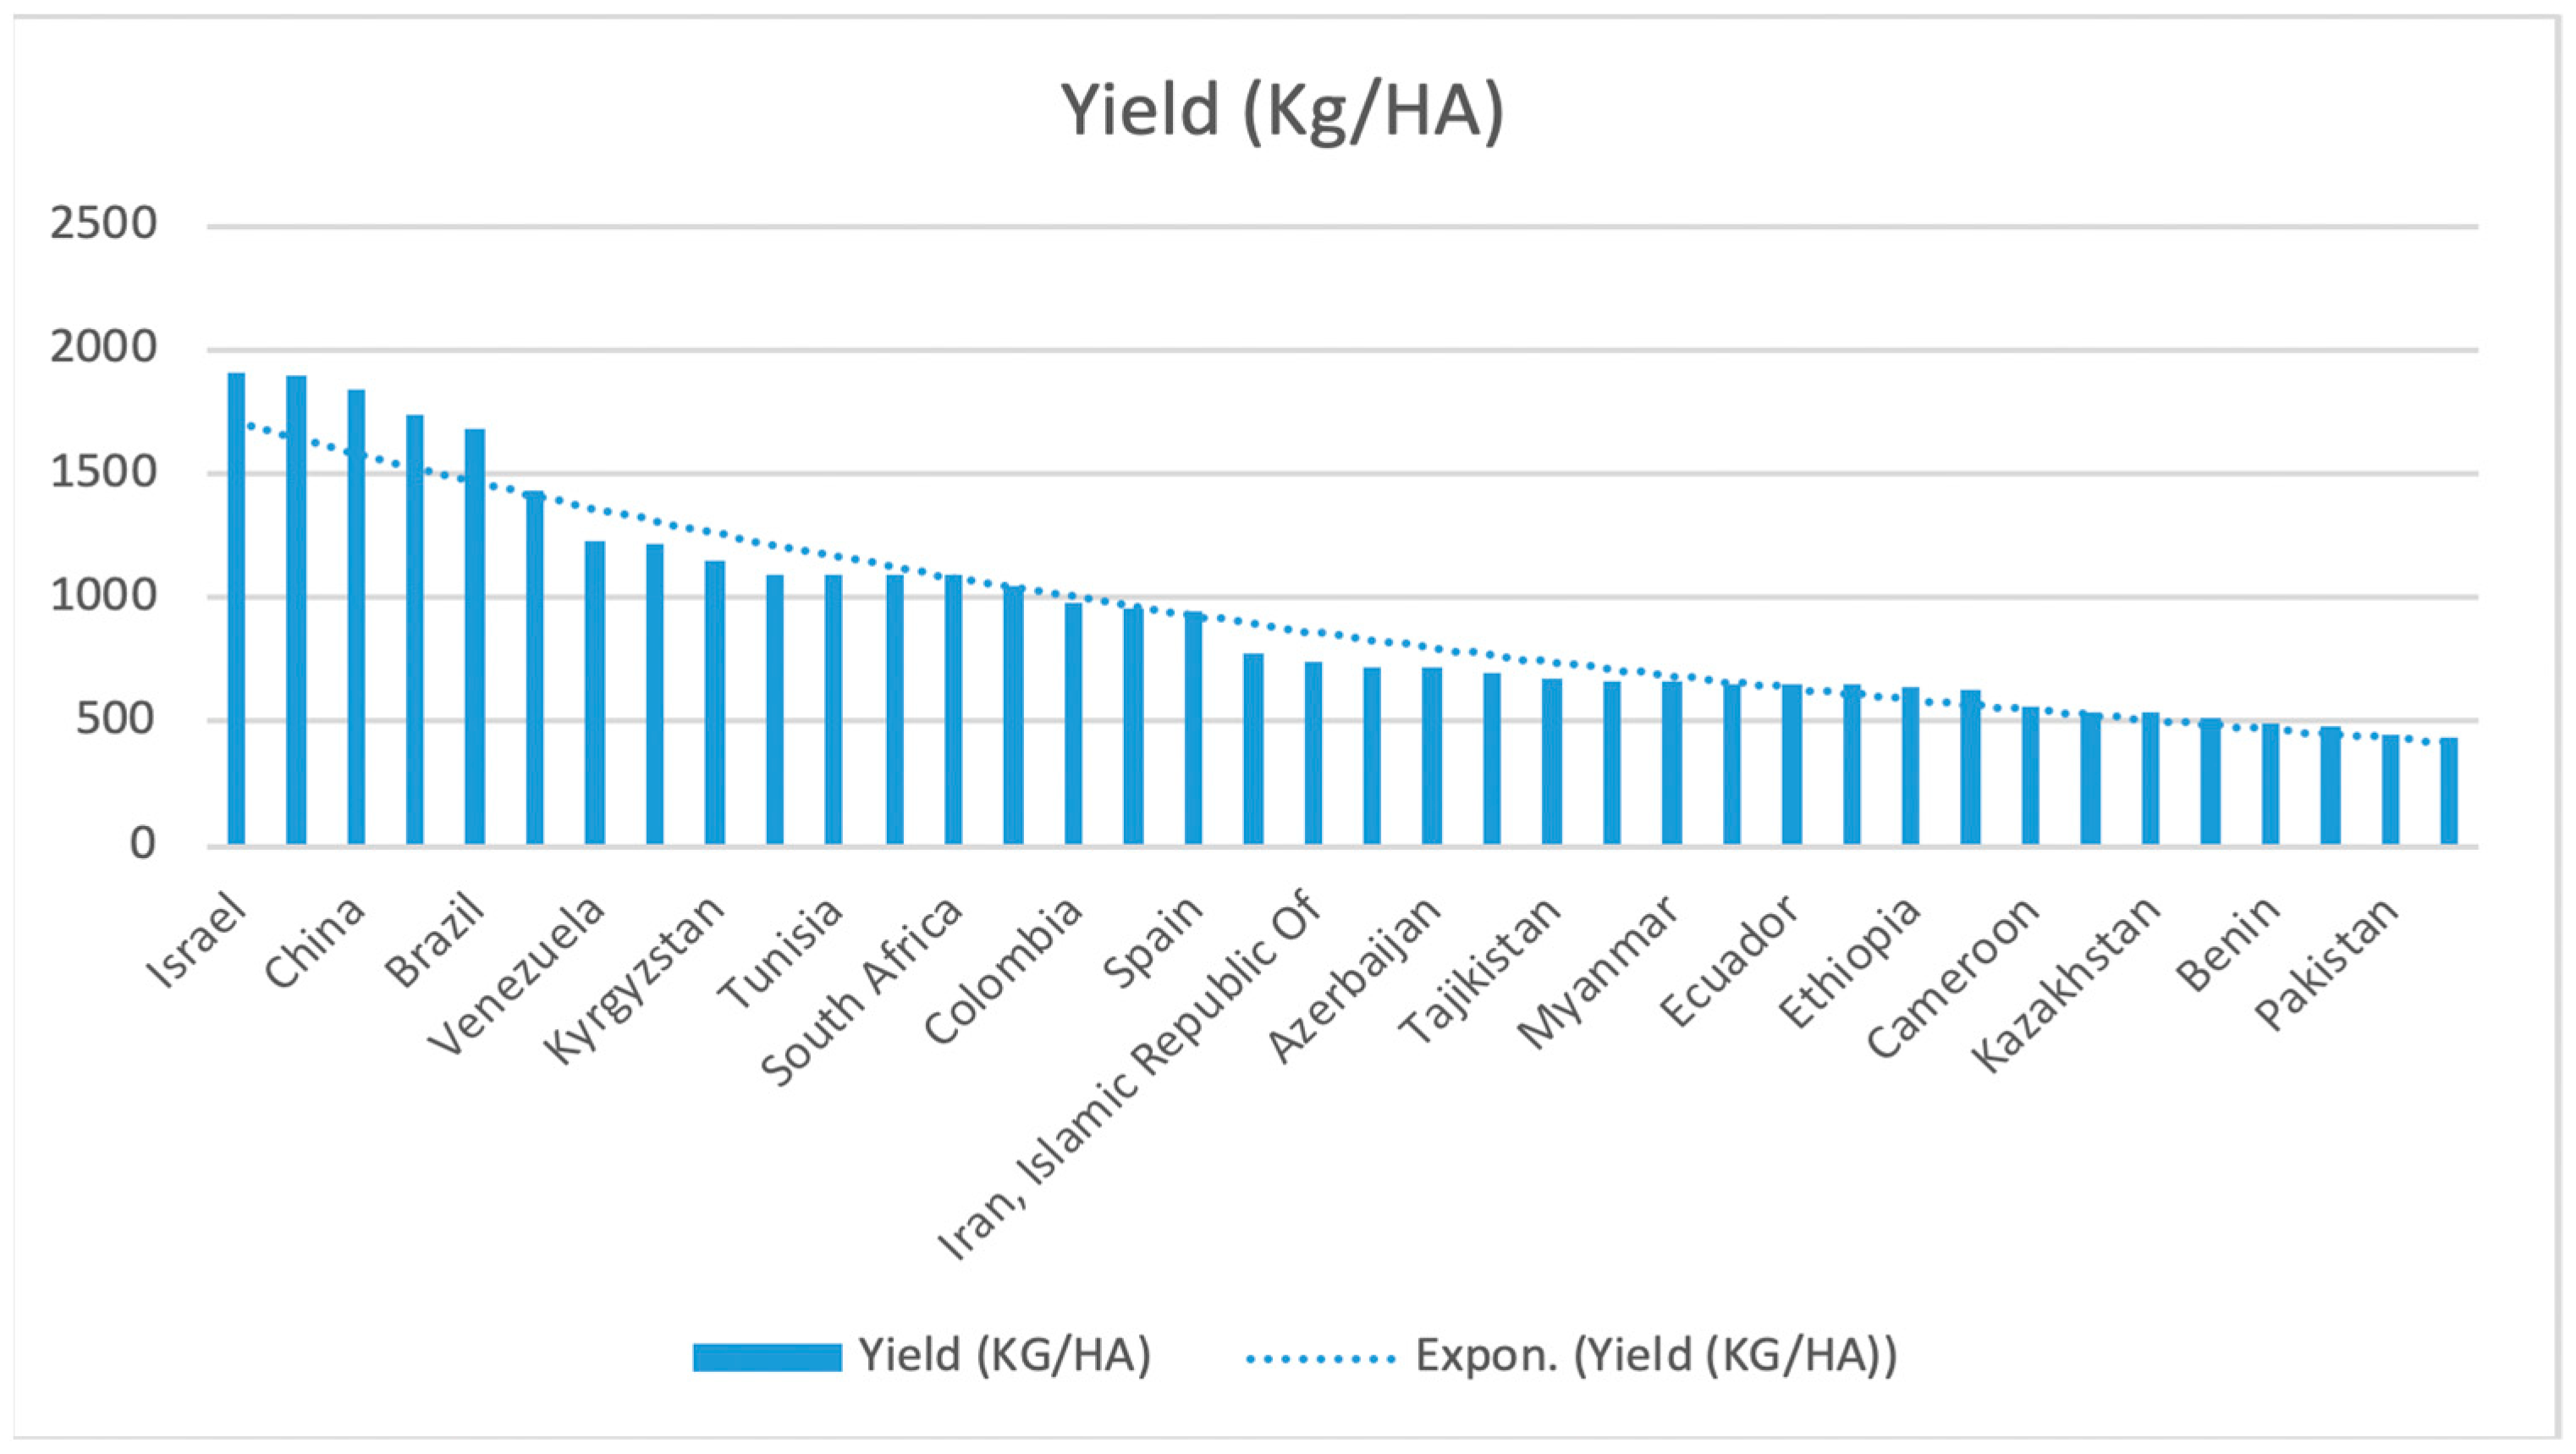
25]. On average, the yield of cotton in Pakistan is 730 kg/ha with 10,671 million bales, which is 1.5–2% lower than to rest of the world, and even irrigated areas of the countries are lagging in terms of lint per hectare from the rain-fed cotton-growing areas of the world (Figure 2). As a result, cotton cultivation has become less attractive than growing other crops, which leads to the minimizing the area of cotton crops (World textile information report 2017, USDA economic survey of Pakistan (2019–2020)). It is true that the area of cotton crops has been declining in Pakistan since 2004–2005; unfortunately, this situation has been aggravated since 2013–2014, and by the ongoing year, 14.2 percent sowing area of the crop had decreased [26]. Before 2014–2015, it was 2.902 million hectares, while currently 2.489 million hectares of cotton are being cultivated in Pakistan. Third, this low productivity of Pakistan’s cotton crop mainly results from inefficient use of multiple factors related to irrigation water, plant population, disease protection, plant nutrition, resource management skills, and insufficient technology, resulting in a gap between potential production and actual production (agriculture statistics of Pakistan (2019)). However, as a general trend, Pakistan farmers seek to remedy this low yield per hectare through traditional practices, such as increasing the use of crop inputs (intensification) or bringing new lands into production (extensification), which leads to constantly deteriorating the agricultural ecological environment. Such practices reduce the economic effect of agriculture and destroy the resources and environment on which agriculture depends on for survival and development [27]. Besides, the scarcity of resources coupled with a large population and lagging agricultural infrastructure is keeping Pakistan’s cotton input and output in a bad state; hence, affordable agricultural technology and its extension become an urgent need to identify the positive balance between the cotton input and output. Fourth, most studies use Pakistan’s agriculture sector to analyze TFP growth in the sector at the national or provincial level. Accordingly, very few studies have analyzed the Pakistan cotton productivity, and efficiency [1], particularly when “multiple inputs leads to a single output” are involved. Such studies either measure the total factor productivity for multi-crops [28] or the sub-sector of Pakistan [26] to analyze the relationship between productivity and agricultural research expenditures or conduct research on the basis of comparative analysis [1]. As agriculture productivity is expected to be influenced by different factors unique for each crop, a crop-wise analysis at the national level would be more useful [19]. Moreover, these studies take the theoretical assumption of the accurate estimation of cotton productivity measures’ breakdowns even when accounting for multiple input/output technology [1]; however, violation of the various crop productivity factors is one of the required conditions for long-run competitive equilibrium. Therefore, this study is being conducted because no prior multifactor analysis is available from an implication perspective that not only scales the non-constant returns when considering the overall impact on cotton production, but also takes a much closer perspective on non-food crops of developing countries like Pakistan concerning the various input and efficiency relationships.
The rest of the paper is arranged as follows: Section 2 describes the research methods, and Section 3 represents the results and discussion step-by-step in support of the methodology. Finally, Section 4 concludes the paper with some recommendations.

2. Research Methods

2.1. Theoretical Concept

This study draws a great deal from a stochastic frontier production function, proposed by Battese and Coelli, which is assumed to be distributed as truncated standard random variables that permit the data to vary systematically with time [29]. The SFA can obtain the maximum likelihood estimates of a subset of the production, the cost function. Besides, this study applies time-series data. The time series data offer to remove a few rigidities because each observation is observed at several different points. In time series data, introducing the ai (time-invariant and individual-specific) enables us to take some heterogenicity that otherwise would be unable to control in cross-section data. Moreover, time-series data also allow us to examine whether the inefficiency is varying or persistent over time. Likewise, the time series data can be simply treated as cross-section data, which implies that the data of the same units, observed at different points of time, are treated as a separate unit; however, the inefficiency and noise at this component point should be heteroscedastic. One of the main advantages of SFA is the possibility of offering the decomposition of productivity change into parts that have straightforward interpretation [30]. As the most important faction, the stochastic frontier approach (SFA) can separate data noise from variations inefficiency. Given the inherent crop diversity in agricultural production, it is assumed that all deviations from the frontier are associated with inefficiency (as assumed in the data envelopment analysis approach), which is challenging to accept in this sector. Based on the following previous literature in the agriculture field [12,31,32], this study narrows down the focus to cotton output and digs into the possibility of realizing similar production frontier and efficiency relationships with the SFA method. Following Battese and Coelli, this paper applies the one stage modeling approach to more comprehensive data representing various factor included in the production frontier and efficiency analysis.

2.2. Measurment of Technical Inefficieny

We employed the stochastic production function, which was proposed by Ainger, Lovell, and Schmidt in 1977 [33], as well as Meeusen and Broeck [34]. The model can be expressed in the format, as shown in Equation (1).
Y i = X i β + ( V i U i )
where Y i is total crop output from agriculture input X i ( i = 1 , N , and X i is vector of N inputs). The β is the vector of the technology parameters and V i represent the two-sided random error accounting for input measurement and statistical errors. The inefficiencies variable is U i > 0 ; it is measured as the difference between actual crop yield Y i and the maximum agricultural output X i β . Later on, in 1995 Battese and Coelli formulated a model with the exception that the allocative efficiency is imposed and this model permits panel data [35]; it was equivalent to the model proposed by Kumbhakar, Ghosh, and McGukin [36]. In this model, the issue of the two-stage estimation procedure, which was unlikely to provide estimates, was addressed as expressed in Equation (2).
Y i t = X i t   β + ( V i t U i t )
i = 1 . N , 1 T
The V i t is random variables and represents the total crop output in the t-th time period from agriculture input X i t and it is assumed to be independent and identically distributed distribution ~  N(0, σv2), as well as being independent of the U i t , which is also a random variable, assumed to account for technical inefficiency in production, and assumed to be distributed as truncations at 0 of the N(mit, σu2) distribution, as shown in Equation (3).
m i t = Z i t δ
where m i t represents technical inefficiency effects and Z i t is a p × 1 vector of a variable, which may influence the efficiency in the time period t-th, while δ is a 1 × p vector of the parameters to be estimated.
This study used the stochastic frontier approach with time-series data considering a stochastic production frontier model specified as follows:
ln ( Y i t ) = β 0 + β 1 ln ( X 1 ) + β 2 ln ( X 2 ) + β 3 ln ( X 3 ) + β 4 ln ( X 4 ) + β 5 ln ( X 5 ) + β 6 ln ( X 6 ) + β 7 ln ( X 7 ) + V i t + U i t  
where
Y i t is the logarithm of the production in the t-th time period.
X i t is a k × 1 vector of input quantities of the t-th time period.
β is a vector of unknown parameters.
η is a parameter to be estimated.
Vitis a non-negative random variable that is assumed to be iid  ( N ( 0 , σ v 2 ) and it is independent and identical to the U it , distributed normal random errors, with a mean of zero and variance σ v 2 , and distributed independently of U i N ( μ ,   σ v 2 ) .
U it is a non-negative technical inefficiency effect representing management factors, and it is assumed to be independently distributed with mean U it and variance σ v 2 [32].
The t-th time exploits the full technological production potential when the value of U it comes out to be equal to zero, and at that time, the production is produced further than the production frontier, beyond which it cannot be produced [33]. The greater the magnitude of U it , and the farther away the product from the production frontier, the more inefficiently it will be operating [9]. In this study, we utilized the parameterization and replaced σ v 2 and σ u 2 with the σ 2 = σ v 2 + σ u 2 and γ = σ u 2 / ( σ u 2 + σ u 2 ) [37]. The above model specification also encompasses several other model specifications; if T = 1 and zit contains the value 1 and only a constant term, then the model can reduce to the truncated normal specification, where δ0 would have the same interpretation as the µ parameter. Besides, specifications mentioned in Equations (2) and (3) are non-nested and no set of restrictions are defined to permit a test of one specification versus the other.

2.3. Data and Source

This section of the paper presents the Stochastic Frontier approach corresponding index numbers useful in efficiency analysis. Accordingly, seven observations were taken for the Stochastic production analysis, and the time series data were taken from 1971 to 2018. The data were collected from agriculture statistics, Pakistan Bureau of Statistics, Ministry of Labor and Employment, Fertilizer use by Crop-FAO [38]. Seven different production variables, defined to encompass the function’s variables, were used in cotton production: [ Y 1 ] represents the total production of cotton in one thousand bales; [ X 1 ] cultivated area for cotton crop in one thousand hectares; [ X 2 ] human labor in the agriculture sector, which is taken as the proxy of cotton labor; [ X 3 ] the available number of tractors in the country and available agriculture machinery, which is taken as the proxy variable of infrastructure, such as roads and the improvement in marketing facilities; [ X 4 ] consumption of cotton seed; [ X 5 ] electricity consumption in the agriculture sector taken as an explanatory variable; [ X 6 ] fertilizer consumption for the cotton crop taken as a major determinate of the production; and [ X 7 ] availability of irrigated water for monsoon crops, which is taken as an essential variable. The next section briefly explains the model specification.

2.4. Method

2.4.1. Statement of Hypothesis

The Maximum likelihood estimates of the parameters of the inefficiency model and stochastic production frontier. For the estimation parameters of the production frontier and the influencing factor of the cotton productivity, this study investigates the model validation for the analysis.
H 0 = γ = δ 0 = δ 1 = δ 2 = 02 H 1 = γ = δ 0 = δ 1 = δ 2 = 02 = 0
H 0 : Null hypothesis to be tested that there is no inefficiency in the model.
H 1 = Technical Inefficiency variables are not affected by the independent variables included in the model.
For the estimation parameters of the production frontier and the influencing factor of the cotton productivity, this study investigates the model validation for the analysis. Because the parametric SFA requires a particular functional form, the hypotheses considered for investigation are (A): H 0 : and H 1 , where H 0 is restricted model and H 1 is an unrestricted model; with the assumption that the unrestricted model is better than a restricted model, as estimated by likelihood ratio LR, defined as, L R = 2 [ L ( H 0 ) / L ( H 1 ) ; and L1 is the value of the log likelihood function ration under the specification of the null and alternate hypotheses. The likelihood test statistics have an asymptotic Chi-square.

2.4.2. Dependent Variable

ln ( Y i t ) is the natural log of cotton production output in bales.
Y i t is the only variable that represents the total production during the time period.

2.4.3. Independent Variable

ln ( X 1 ) is the natural log of the area under cotton in acres.
ln ( X 2 ) is the natural log of the consumption of fertilizer nutrients for the cotton crop (i.e., nitrogen (N), phosphorus (P) and potash).
ln ( X 3 ) natural log of cotton seed consumption.
ln ( X 4 ) natural log of the source of irrigation for the monsoon crops: canal, tube, well, in million-acre feet.
ln ( X 5 ) natural log of the consumption of electricity access to the farm/rural area taken as the dummy variable of electricity consumption of cotton crops because there is unavailability of electricity consumption specific to cotton crops.
ln ( X 6 ) natural log of the labor force employed in the agriculture sector.
ln ( X 7 ) natural log of no of available tractors and agriculture machinery.

2.4.4. Method Determination the Return Scale with a Trans Log Function Diagnostic Tests on Data

The current study adopted the computer program Frontier 4.1 to estimate the inefficiency model and maximum likelihood ratio of the stochastic production frontier parameters. Since checking the model’s validity is necessary before evaluating the production function parameter and the factor affecting the cotton crop inefficiency, the model assumed two hypotheses. The hypotheses were tested using the generalized likelihood-ratio LR, which is defined as L R = 2 l n [ L ( H 0 ) / L ( H 1 ) . The results of these estimation’s likelihood function values are under the specification of the null and alternate hypotheses, respectively. The Chi-square value is asymptotically distributed with a degree of freedom equal to the difference between the restricted and unrestricted model parameters.

3. Results and Discussion

3.1. Descriptive Statistic of Production Factors

The production function model is used to determine production efficiency. At the first stage, we run a descriptive test to measure the sample’s tendency and dispersion to decide whether it is normally distributed or not and to find the data’s outlier. The summary of the descriptive statistics for the input and output variables included in the stochastic frontier model are presented in Table 1. The result showed that the mean cotton production in the study area was 8264 tons (in thousands) bales during the period. The mean number of cultivated areas to producers’ cotton was 2564 (in thousand) hectares, with a minimum value of 1733.3 and a maximum of 3192.6. The available data show that, from small-scale farms to large scale farms, the minimum and maximum used fertilizer were 46 tons and 1259.75 tons during the period, respectively. The farmers’ average labor force (wage and family labor) to produce all types of crops in the agriculture sector, including cotton, were 37,693 labors (in thousands) for the production cycle. The mean of the machinery use was 376,628 Nos., while the mean of irrigation water was 71 MAF. Similarly, the average seed cost was 4541 tons (in thousands).
This descriptive analysis shows that, in sample data, Y 1 , X 1 , X 3 , are negatively skewed, which means the tail lies on the left side on the central value, while X 2 , X 4 , X 5 , X 6 has the long right tail. All the variables in the model are in platykurtic form except Machinery (X7), which is in a leptokurtic form that means that it has positive kurtosis (peak curve). Jarque–Bera statistic results also show that the data are normally distributed. Probability statistics show that the Jarque–Bera statistic exceeds the observed value under the null hypotheses, while the small values lead to the acceptance of the null-hypotheses, which means the curve is a normal distribution. These results of the descriptive analyses do not permit us to evaluate the contribution of each factor of production to the achievement of the production objectives nor the productive performance of the cotton production during the study period. Hence, only an econometric estimation of the production frontier was used to assess efficiency status of the cotton production inputs and to isolate the probable sources of its growth.

3.2. Unit Root Test

It is a standard procedure to check the stationarity of the time series data, as time series data usually demonstrate the unit root problem. Therefore, before performing the proper analysis, the selected variables were subjected to a standard unit root test to examine the stationarity level of the variables, and results were verified by two tests: Kwiatkowski-Phillips-Schmidt-Shinand and Augmented Dickey-Fuller (ADF). The estimated results of the unit root test are presented in the Table 2 and show that labor is not stationary at the first difference, and it becomes stationary at the trend and intercept. The result of the Augmented Dickey-Fuller (ADF) Test and its significance level at 1 and 5 percent level indicated that all the variables are stationary at I(0) and I(I). However, none of the variables are stationary at I(2). The result of the Kwiatkowski-Phillips-Schmidt-Shin test also validates the results revealed by the ADF test.

3.3. Testing of Hypothesis

The first null hypothesis that we tested was H 0 = γ = δ 0 = δ 1 = δ 2 = 02 , presented in Table 3, and it indicated that the technical inefficiency effects were not present in the selected model. It also suggests that the stochastic frontier production function was the same as the traditional average production function estimated using the OLS procedure. This null hypothesis was rejected. The second null hypothesis was tested as H0: δ1 = δ2 = 0, indicating that the government’s subsidies on cotton and fertilizer were not affected by the input variables included in the model; thus, this hypothesis was again rejected. The second LR result revealed that the variables included in the inefficiency showed technical inefficiency effects for cotton production. Subsequently, it was appropriate to have those input variables in the model.

3.4. Analysis of Econometric Model

The stochastic frontier production model results that estimate the cotton production are presented in Table 4, where 11 parameters were evaluated, including 7 in a stochastic frontier model, 2 in the efficiency model, and the remaining 2 parameters relate to the variance of the random variables. In the frontier function, out of 11 parameters, 9 parameters were significant. The test results of the likelihood ratio showed that the model was significant at the 1% level. Most of the coefficients of the variables were significant at the 1% level and 5% levels.
The random term σv2 perceived the variables that incorporated technical efficiency in the analysis of the production frontier model. The estimation result showed that σv2 was 0.21, and it was significant at the 1% level, indicating goodness of fit, which means the presence of technical inefficiency related to the technical errors in the cotton production. Likewise, the estimation result of γ was 0.999, indicating 99% of the deviation from the production frontier. It was statistically significant with positive elasticity, which indicated that cotton productivity differentials predominantly related to the variance in management. Thus, the specification was much more appropriate in terms of the stochastic production frontier in order to represent cotton production technology.

3.5. Elasticity of Production

The contribution of each factor of production to the productivity of cotton production is demonstrated with production elasticity. The estimation results are shown in Table 4. The result of the estimation shows that the coefficient of all inputs is statistically significant, and the results consist of previous findings [1,39,40]. The output of cotton production is statistically significant, but elasticity is negative. The coefficient of the cultivated area under the cotton crop is statistically significant. It shows a positive relationship at the 1% level, revealing that the cultivated area under the cotton crop remains as an important contributor to improving the technical efficiency in cotton production. This implies that an increase in the amount of one percent induces an increase of 1.76% technical efficiency in the cotton production, indicating that the area is the first factor that would cause the rise in cotton production. The fertilizer coefficient shows a negative relation at a 5% level, which implies that one percent increase in fertilizer would decrease the 0.13% technical efficiency in cotton production. The probable cause of the negative relation between cotton crop and fertilizer could be the farmer’s access to the low quality of fertilizer [41,42]. Another reason could be that the farmers are applying higher doses of chemical fertilizer on the cotton crop, due to a lack of technical knowledge of fertilizer combination [43]. Seed consumption has a positive significant relation with cotton production, which implies that a 1% increase of seed consumption would increase technical efficiency of the cotton crop by 0.52%. Irrigation shows an inverse relationship with cotton production. Empirical results reveal that a 1% increase in irrigation could decrease the technical efficiency of cotton production by −1.97%. The possible cause of this negative relation could be the outdated and least efficient irrigation and water storage system, which does not correspond to the water storage requirement as it is operated on historic canal diversion patterns. Therefore, combined with the high seasonal pattern of the river flow and insufficient reservoir capacity—which provides 85% of water during monsoon crop season (cotton) [44]—the increase in water supply will affect the growth of the cotton plant, which would reduce the cotton yield [45]. The cotton crop is resilient to the drought due to its vertical root, and much more sensitive to the availability of water at flowering and boll formation stage, which need adequate quantities of water [46,47]. The availability of a high quantity of water in canals could be a reason for the inverse relationship between cotton production and irrigation. Furthermore, access to poor irrigation water also affects crop yield, quantity, and production. In addition, the excessive accumulation of salt affects the root zone of plant [42], which could be another reason for the negative relationship between crop production and irrigation variable. The coefficients of electricity and agriculture machinery are also statistically negative with cotton production, which implies that the 1% increase in these inputs would reduce cotton production by 0.19 and 0.10, respectively. A possible cause for these inverse relationships could be due to outdated and unmaintained machinery, the lack of the adoption new agriculture technologies [48], unwillingness to use due to lack of credit facilities [49], shortage of electricity [50], and high prices of electricity and agriculture machinery. The labor force was the second affecting factor that increased the cotton production. The coefficient of labor was positively associated with the cotton production, implying that a 1% increase in labor force would improve the technical efficiency by 1.3% in cotton production. The results are similar to the previous studies, indicating that the cultivated area, labor, and seed variables under the cotton crop remain significant contributors, leading to improved technical efficiency in cotton production in Pakistan [1,28,39,40,51].
The estimated parameters of variables used in the inefficiency model are provided in Table 4. Both variables assessed in the inefficiency effect are statistically significant; however, the cotton crop’s subsidy shows a positive relationship with cotton production. Additionally, in the inefficiency model (U), the seed subsidy has negative elasticity, but it is not significant. The subsidy provided by the government for cotton is statistically not substantial, but its elasticity is positive, indicating an essential factor in decision making to have a positive effect on cotton production. A prospective reason for such a relationship may be linked with government organizations’ slow processing in providing those subsidies after cultivating crops. The seed subsidy’s elasticity carries a negative sign, demonstrating that the overall per hectare yield would be lower after the policy is implemented, indicating a similar trend to the previous research [21].

3.6. Technical Efficiencies of Cotton Production

The presence of technical inefficiency, tested using LR test, was 0.31, which is lesser than the critical chi-square value of 21.66 [52]. Therefore, the null hypothesis of the production inefficiency is rejected.
The production efficiency score ranges between 0.36 and 0.99, with the distribution seeming to be skewed toward the frontier. The production efficiency index is in the 99 percentage. The average efficiency score is 85% for the data taken from the last 48 years where 43% of the year production scores are in the range of 0.36–0.85, while 56% of year scores range are above average. These findings of the production efficiency score shows in Table 5, indicate the need to reduce 13% input to attain the status of most economical efficiency.

4. Implications and Concluding Remarks

The study adopts a more specific case of cotton production to represent the non-food crop perspective for developing countries like Pakistan, a top-ranked cotton-producing country that has recently started importing raw cotton and struggling to manage the declining cotton yield. This study examined the evolution of the overall cotton production and its determinants that have been inefficiently used over time in developing countries based on the stochastic frontier approach that was employed to measure the production frontier and efficiency relationship by tracking the efficiency changes and technological factors concerning those multiple input factors. Accordingly, the analysis is exampled on Pakistan’s cotton production data from 1971–2018 in view of the specific non-food crop perspective of a developing country that has been a top-ranked cotton-producing country and has recently been shifting towards a non-exporter of cotton due to low yield. Accordingly, the study offers the following contribution with concluding remarks.

4.1. Theoretical Contribution

The study offers some theoretical contribution to the few studies related to cotton technical efficiency literature. First, the study estimates the indices of crop-specific technical efficiency changes and total factor of production, covering a longer time period using SFA for the non-food crops perspective. As the main benefit, since this approach can account for composed-error by separating the noise from inefficiencies, it tracks efficiency changes and technological changes in overall productivity from practical aspects [53]. Hence, scaling non-constant returns of those multiple factors is possible to allow for the violation of various situations, which is one of the necessary conditions for the long-run completive equilibrium in productivity measurement [12]. The other benefit of using such an approach is the ability to authorize systematic variation with time [54]. Moreover, using time-series data enable us to account for some heterogenicity that we cannot control in cross-section data. It is the way the current research prefers for SFA to estimate efficiency and cotton growth data considering its efficiency over other approaches in the agricultural economic literature [54]. Second, parametric procedures also allow the functional specific need to accommodate (a) calculating single output from multiple inputs, (b) testing the hypothesis, and (c) the availability of maximum likelihood econometric estimates. These features could well accommodate a more specific crop perspective of a developing country [16], as in the case of cotton production in Pakistan, a top-ranked cotton-producing country that has stopped exporting cotton since 2010 [25]. For instance, such features accommodate accurate estimation of productivity measures breakdowns when multiple inputs lead to a single output [19], rather than concentrating more on multiple-output and multiple-input technology that many previous studies have assumed [20,55]. Moreover, the study would also estimate the hypothesis “whether subsidies affect cotton crop production.” Third, the study puts forward corresponding policy recommendations specifically for improving cotton production efficiencies under practical scenarios, unlike previous studies that assume cotton production under ideal/efficient condition and treat it as a residual, using index numbers such as Törnqvist [1]. Thus, this narrow focus of cotton output could dig into the possibility of realizing similar productivity and productivity growth analysis for other developing countries

4.2. Implications

The study revealed various findings. First, the study finds a positive relationship between cotton productivity and the using cultivated area, particularly cotton growth, which was significantly higher in those years when the government provided subsidy on the cotton crop as a farmer had more to spend on other productions factors. Second, those findings also indicate that cotton productivity has a strong inverse relationship with the fertilizer to the cotton crop. Given the importance of balance fertilizer management practices [56], an inverse relationship may be associated with low quality of fertilizer or farmers applying higher doses of chemical fertilizer on cotton crop, less knowledge of fertilizer combinations [57]. Third, the technical efficiency is negatively associated with irrigation; as a result of efficiency analysis, average technical efficiency is about 85 percent over the period. But it was at 36 percent level during the period. This negative trend in cotton productivity could be due to the prevalence of leaf curl virus disease in the cotton crop [58], which appears in the 1990s, and symptoms were seen in 2002 or ineffective use of irrigation strategy. Moreover, the apparent reason for this could be the waterlogging, salinity, and high usages of the brackish underground; results endorse observations of the previous study [59]. Forth, the subsidy remains a vital policy carried on crop production; however, most literature shows that subsidy could reduce the per hectare yield, our results are parallel to the other research results [21]. In contrast, the seed subsidy policy has failed to increase Pakistan production of cotton crop effectively.
The findings mentioned above suggest few implications in Pakistan’s perspective that could provide initial guidelines for policy makers in improve cotton productivity due to its contribution to the country’s economy and poverty alleviation [60]. First, the findings suggest a negative impact of technical progress on cotton production growth. It seems like either implementation of new technological solutions on production input (better seed quality, better fertilizer, better infrastructure, and land leveling) or generation of new technological solutions [60], has some issue that needs to invest in Agriculture research and development. Accordingly, government, agriculture union, NGOs should develop policies to improve technical efficiency by providing advisory support to production factors and better use of inputs. Moreover, considering the strong combined impact of fertilizer and irrigation [59], the government should increase awareness regarding the irrigation system’s efficiency, fertilizer use, and strict regulation regarding low-grade fertilizers to fully exploit the existing economies of scale in the sector. Such policies should be included within the agriculture development framework for small and big-level farmers that help increase efficiency, transfer, and generation of technology, implement the best practices, and provide access to credit, market opportunities, and production inputs. These policies must be accompanied by strategies to limit imports of clothes and expand the export of cotton and yarn to encourage the cotton crop’s local production and improve agriculture farmers’ living conditions.
Moreover, few practical implications considering developing countries’ perspective could also be drawn. First, this study contributes to the literature of crop-wise efficiency or technical efficiency, an understudied research area (considering the agriculture crop diversity [60]) having great potential of relevant multifactor information that might facilitate detailed options to navigate between various factors of production for a single crop. Second, the study also offers policy guidelines for cotton crop multi-source productivity, particularly from the developing country perspective, a predominant exporter of raw cotton [1]. Such multifactor productivity information can also be applied to farm practices indirectly associated with cotton to choose between socio-ecological factors [3]. Third, the study analyzed the focus of cropping preference regarding intensification or extensification in developing countries like Pakistan. It would facilitate forming strategic guidelines for policy making institutions and other stakeholders associated with sustainable non-food crop production practices.

4.3. Conclusions

Recent global uncertainties have increased the awareness of affordable technology-driven agricultural solutions, which are contemporary demands of developing economies, mainly supported by agriculture practices and scarce resources. In seeking those solutions, the TFP remains a significant indicator. Accordingly, the crop-specific technology is viewed for the cotton production inefficiencies and its role in developing economies taking Pakistan’s case study.
This study analyzes the efficiency changes and technological factors of various sources of cotton growth from practical aspects, i.e., scaling non-constant returns of those multiple factors that allow violation of various situations. The study adopted Pakistan’s cotton production case to represent a typical non-food crop perspective of developing countries, i.e., a country that has recently not been involved in exporting the cotton crop despite being a top-ranked cotton-producing country. Therefore, the study’s findings revealed various insights in connection with cotton production inefficiencies. Accordingly, the study finds a positive relationship between cotton productivity and the using cultivated area; however, a strong inverse relationship was observed with the chemical fertilizer to the cotton crop productivity. Moreover, technical efficiency was observed to be negatively associated with irrigation, while subsidy could reduce the over yield per hectare, particularly the seed subsidy policy. These findings need to be prioritized by policymakers in Pakistan. As the model adopts Pakistan’s context, the overall statistical analysis is generalizable to other developing economies, particularly concerning the issue of the constant declining yield of non-food crops. Given the scarce financial and technological resources of developing countries, these results would facilitate their strategy workers in designing and developing affordable technology-driven solutions and Agri-resource efficiencies for sustainable non-food crop production.
This study also offers some limitations. Since the present study evaluated efficiency analysis based on tracking efficiency and technological change in overall productivity over the past five decades, this does not imply that the crop management practices were ideal in those years. There was almost certainly room for improvement for considering other factors of production that are not being considered due to limited data availability. Further studies are encouraged for management reviews.

Author Contributions

Conceptualization, M.U.A. and Y.Z.; methodology, M.U.A.; software, M.U.A.; validation, M.U.A. and Y.Z.; formal analysis, M.U.A. and F.F.; investigation, O.H.; resources, M.U.A.; writing—original draft preparation, M.U.A.; writing—review and editing, O.H.; supervision, O.H., Y.Z. All authors have read and agreed to the published version of the manuscript.

Funding

This research work was supported by the Major social science projects of Inner Mongolia Autonomous Region China (Grant No.: 2018ZGH006 and 2018ZDA004).

Institutional Review Board Statement

Not applicable.

Informed Consent Statement

Not applicable.

Data Availability Statement

The data presented in this study are available on request from the corresponding author.

Acknowledgments

The first author is very grateful to the Chinese Government Scholarship Council (C.S.C.) for their support during this research tenure. We also acknowledge the support of, Pakistan Meteorology Department, Pakistan Bureau of Statistics.

Conflicts of Interest

The authors declare no conflict of interest.

References

  1. Shabbir, M.S.; Yaqoob, N. The impact of technological advancement on total factor productivity of cotton: A comparative analysis between Pakistan and India. J. Econ. Struct. 2019, 8, 27. [Google Scholar] [CrossRef] [Green Version]
  2. An, J.; Mikhaylov, A.; Richter, U.H. Trade war effects: Evidence from sectors of energy and resources in Africa. Heliyon 2020, 6, e05693. [Google Scholar] [CrossRef] [PubMed]
  3. Coomes, O.T.; Barham, B.L.; MacDonald, G.K.; Ramankutty, N.; Chavas, J.-P. Leveraging total factor productivity growth for sustainable and resilient farming. Nat. Sustain. 2019, 2, 22–28. [Google Scholar] [CrossRef] [Green Version]
  4. Liu, J.; Dong, C.; Liu, S.; Rahman, S.; Sriboonchitta, S. Sources of Total-Factor Productivity and Efficiency Changes in China’s Agriculture. Agriculture 2020, 10, 279. [Google Scholar] [CrossRef]
  5. Statista. Leading Cotton Producing Countries Worldwide in 2019/2020. 2021. Available online: https://worldpopulationreview.com/country-rankings/cotton-production-by-country (accessed on 21 August 2020).
  6. Siche, R. What is the impact of COVID-19 disease on agriculture? Sci. Agropecu. 2020, 11, 3–6. [Google Scholar] [CrossRef] [Green Version]
  7. Pan, D.; Yang, J.; Zhou, G.; Kong, F. The influence of COVID-19 on agricultural economy and emergency mitigation measures in China: A text mining analysis. PLoS ONE 2020, 15, e0241167. [Google Scholar] [CrossRef]
  8. Calicioglu, O.; Flammini, A.; Bracco, S.; Bellù, L.; Sims, R. The future challenges of food and agriculture: An integrated analysis of trends and solutions. Sustainability 2019, 11, 222. [Google Scholar] [CrossRef] [Green Version]
  9. An, J.; Mikhaylov, A.; Jung, S.-U. A Linear Programming approach for robust network revenue management in the airline industry. J. Air Transp. Manag. 2021, 91, 101979. [Google Scholar] [CrossRef]
  10. Morkovkin, D.; Gibadullin, A.; Kolosova, E.; Semkina, N.; Fasehzoda, I. Modern transformation of the production base in the conditions of Industry 4.0: Problems and prospects. J. Phys. Conf. Ser. 2020, 1515, 032014. [Google Scholar] [CrossRef]
  11. Zhang, J.; Chen, Y.; Li, Z. Assessment of efficiency and potentiality of agricultural resources in Central Asia. J. Geogr. Sci. 2018, 28, 1329–1340. [Google Scholar] [CrossRef] [Green Version]
  12. Benedetti, I.; Branca, G.; Zucaro, R. Evaluating input use efficiency in agriculture through a stochastic frontier production: An application on a case study in Apulia (Italy). J. Clean. Prod. 2019, 236, 117609. [Google Scholar] [CrossRef]
  13. Saliou, I.O.; Zannou, A.; Aoudji, A.K.N.; Honlonkou, A.N. Drivers of Mechanization in Cotton Production in Benin, West Africa. Agriculture 2020, 10, 549. [Google Scholar] [CrossRef]
  14. Arshad, A.; Raza, M.A.; Zhang, Y.; Zhang, L.; Wang, X.; Ahmed, M.; Habib-ur-Rehman, M. Impact of Climate Warming on Cotton Growth and Yields in China and Pakistan: A Regional Perspective. Agriculture 2021, 11, 97. [Google Scholar] [CrossRef]
  15. Giang, M.H.; Xuan, T.D.; Trung, B.H.; Que, M.T. Total factor productivity of agricultural firms in Vietnam and its relevant determinants. Economies 2019, 7, 4. [Google Scholar] [CrossRef] [Green Version]
  16. Statista. Distribution of Fiber Consumption Worldwide in 2019, by Type of Fiber. 2021. Available online: https://www.statista.com/statistics/741296/world-fiber-consumption-distribution-by-fiber-type/ (accessed on 6 June 2021).
  17. Ali, M.A.; Farooq, J.; Batool, A.; Zahoor, A.; Azeem, F.; Mahmood, A.; Jabran, K. Cotton production in Pakistan. In Cotton Production; John Wiley & Sons Ltd.: Hoboken, NJ, USA, 2019; Volume 249. [Google Scholar]
  18. Ting, W. Bridge Interview of Karin Malmstrom, Director of Cotton Council International China. China Text. 2014, 2, 38–40. [Google Scholar]
  19. Rodríguez, X.A.; Elasraag, Y.H. Assessing the total factor productivity of cotton production in Egypt. PLoS ONE 2015, 10, e0116085. [Google Scholar] [CrossRef]
  20. Mitchell, C.; Traxler, G.; Novak, J. Measuring sustainable cotton production using total factor productivity. J. Prod. Agric. 1996, 9, 289–297. [Google Scholar] [CrossRef]
  21. Tan, Y.; Guan, J.; Karimi, H.R. The Impact of the subsidy policy on total factor productivity: An empirical analysis of China’s cotton production. Math. Probl. Eng. 2013, 2013, 248537. [Google Scholar] [CrossRef] [Green Version]
  22. Azumah, S.B.; Donkoh, S.A.; Awuni, J.A. Correcting for sample selection in stochastic frontier analysis: Insights from rice farmers in Northern Ghana. Agric. Food Econ. 2019, 7, 9. [Google Scholar] [CrossRef]
  23. Sohaib, M.; Jamil, F. An insight of meat industry in Pakistan with special reference to halal meat: A comprehensive review. Korean J. Food Sci. Anim. Resour. 2017, 37, 329. [Google Scholar] [CrossRef]
  24. Arshad, M.U.; Zhao, Y.; Gong, Y.; Guo, X.; Hanif, S.; Ge, Y.; Jun, T. The effect of climate change on cotton productivity—An empirical investigation in Pakistan. Pak. J. Agric. Sci. 2021, 58, 8. [Google Scholar] [CrossRef]
  25. Pakistan, G.O. Economic Surrvey of Pakistan 2019–2020; Government of Pakistan, Finance Division: Islamabad, Pakistan, 2021. [Google Scholar]
  26. Nadeem, A.H.; Nazim, M.; Hashim, M.; Javed, M.K. Factors which affect the sustainable production of cotton in Pakistan: A detailed case study from Bahawalpur district. In Proceedings of the Seventh International Conference on Management Science and Engineering Management, Philadelphia, PA, USA, 7–9 November 2013; Xu, J., Fry, J., Lev, B., Hajiyev, A., Eds.; Springer: Berlin/Heidelberg, Germany, 2014; pp. 745–753. [Google Scholar]
  27. Chen, G.; Breedlove, J. The effect of innovation-driven policy on innovation efficiency: Based on the listed sports firms on Chinese new Third Board. Int. J. Sports Mark. Spons. 2020, 21, 735–755. [Google Scholar] [CrossRef]
  28. Zulfiqar, F.; Shang, J.; Nasrullah, M.; Rizwanullah, M. Allocative efficiency analysis of wheat and cotton in district Khanewal, Punjab, Pakistan. GeoJournal 2020, 86, 2777–2786. [Google Scholar] [CrossRef]
  29. Banker, R.; Natarajan, R.; Zhang, D. Two-stage estimation of the impact of contextual variables in stochastic frontier production function models using data envelopment anlysis: Second stage OLS versus bootstrap approaches. Eur. J. Oper. Res. 2019, 278, 368–384. [Google Scholar] [CrossRef]
  30. Yang, Z.; Roth, J.; Jain, R.K. DUE-B: Data-driven urban energy benchmarking of buildings using recursive partitioning and stochastic frontier analysis. Energy Build. 2018, 163, 58–69. [Google Scholar] [CrossRef]
  31. Zewdie, M.C.; Moretti, M.; Tenessa, D.B.; Ayele, Z.A.; Nyssen, J.; Tsegaye, E.A.; Minale, A.S.; Van Passel, S. Agricultural Technical Efficiency of Smallholder Farmers in Ethiopia: A Stochastic Frontier Approach. Land 2021, 10, 246. [Google Scholar] [CrossRef]
  32. Yin, Z.; Wu, J. Spatial Dependence Evaluation of Agricultural Technical Efficiency—Based on the Stochastic Frontier and Spatial Econometric Model. Sustainability 2021, 13, 2708. [Google Scholar] [CrossRef]
  33. Aigner, D.; Lovell, C.K.; Schmidt, P. Formulation and estimation of stochastic frontier production function models. J. Econom. 1977, 6, 21–37. [Google Scholar] [CrossRef]
  34. Meeusen, W.; van Den Broeck, J. Efficiency estimation from Cobb-Douglas production functions with composed error. Int. Econ. Rev. 1977, 435–444. [Google Scholar] [CrossRef]
  35. Battese, G.E.; Coelli, T.J. A model for technical inefficiency effects in a stochastic frontier production function for panel data. Empir. Econ. 1995, 20, 325–332. [Google Scholar] [CrossRef] [Green Version]
  36. Kumbhakar, S.C.; Ghosh, S.; McGuckin, J.T. A generalized production frontier approach for estimating determinants of inefficiency in US dairy farms. J. Bus. Econ. Stat. 1991, 9, 279–286. [Google Scholar]
  37. Battese, G.E.; Corra, G.S. Estimation of a production frontier model: With application to the pastoral zone of Eastern Australia. Aust. J. Agric. Econ. 1977, 21, 169–179. [Google Scholar] [CrossRef] [Green Version]
  38. Chang, S.-H. A pilot study on the connection between scientific fields and patent classification systems. Scientometrics 2018, 114, 951–970. [Google Scholar] [CrossRef]
  39. Raza, A.; Ahmad, M. Analysing the Impact of Climate Change on Cotton Productivity in Punjab and Sindh, Pakistan; Pakistan Institute of Development Economics (PIDE): Islamabad, Pakistan, 2015. [Google Scholar]
  40. Bakhsh, K.; Hassan, I.; Maqbool, A. Factors affecting cotton yield: A case study of Sargodha (Pakistan). J. Agric. Soc. Sci. 2005, 1, 332–334. [Google Scholar]
  41. Khaliq, A.; Abbasi, M.K.; Hussain, T. Effects of integrated use of organic and inorganic nutrient sources with effective microorganisms (EM) on seed cotton yield in Pakistan. Bioresour. Technol. 2006, 97, 967–972. [Google Scholar] [CrossRef] [PubMed]
  42. Khan, M.; Mahmood, H.Z.; Damalas, C.A. Pesticide use and risk perceptions among farmers in the cotton belt of Punjab, Pakistan. Crop Prot. 2015, 67, 184–190. [Google Scholar] [CrossRef]
  43. Han, H.-Y.; Zhao, L.-G. Farmers’ character and behavior of fertilizer application-evidence from a survey of Xinxiang County, Henan Province, China. Agric. Sci. China 2009, 8, 1238–1245. [Google Scholar] [CrossRef]
  44. Faruqee, R.; Hussain, Z. Future of Irrigation and Drainage in Pakistan [with Comments]. Pak. Dev. Rev. 1997, 565–591. [Google Scholar] [CrossRef] [Green Version]
  45. Karl, T.R.; Melillo, J.M.; Peterson, T.C.; Hassol, S.J. Global Climate Change Impacts in the United States; Cambridge University Press: New York, NY, USA, 2009. [Google Scholar]
  46. Ton, P. Cotton and climate change: Impacts and options to mitigate and adapt. ITC 2011. Available online: https://www.intracen.org/Cotton-and-Climate-Change-Impacts-and-options-to-mitigate-and-adapt/ (accessed on 6 June 2021).
  47. Meyer, W.S.; Ritchie, J.T. Water Status of Cotton as Related to Taproot Length 1. Agron. J. 1980, 72, 577–580. [Google Scholar] [CrossRef]
  48. Mottaleb, K.A.; Krupnik, T.J.; Erenstein, O. Factors associated with small-scale agricultural machinery adoption in Bangladesh: Census findings. J. Rural. Stud. 2016, 46, 155–168. [Google Scholar] [CrossRef] [PubMed] [Green Version]
  49. Cavallo, E.; Ferrari, E.; Bollani, L.; Coccia, M. Attitudes and behaviour of adopters of technological innovations in agricultural tractors: A case study in Italian agricultural system. Agric. Syst. 2014, 130, 44–54. [Google Scholar] [CrossRef]
  50. Shahbaz, M. Measuring Economic Cost of Electricity Shortage: Current Challenges and Future Prospects in Pakistan. MPRA Paper. 2015. Available online: https://mpra.ub.uni-muenchen.de/67164/1/MPRA_paper_67164.pdf (accessed on 6 June 2021).
  51. Anwar, M.; Chaudhry, I.S.; Khan, M.B. Factors affecting cotton production in Pakistan: Empirical evidence from Multan district. J. Qual. Technol. Manag. 2009, 5, 91–100. [Google Scholar]
  52. Kodde, D.A.; Palm, F.C. Wald criteria for jointly testing equality and inequality restrictions. Econometric Soc. 1986, 54, 1243–1248. [Google Scholar] [CrossRef]
  53. Liu, J.; Li, H.; Sriboonchitta, S.; Rahman, S. Technical Efficiency Analysis of Top Agriculture Producing Countries in Asia: Zero Inefficiency Meta-Frontier Approach. In Proceedings of the International Conference of the Thailand Econometrics Society, Chiang Mai, Thailand, 9–11 January 2019; Volume 808, pp. 702–723. [Google Scholar]
  54. Lai, H.-p.; Kumbhakar, S.C. Endogeneity in panel data stochastic frontier model with determinants of persistent and transient inefficiency. Econ. Lett. 2018, 162, 5–9. [Google Scholar] [CrossRef]
  55. Işgın, T.; Özel, R.; Bilgiç, A.; Florkowski, W.J.; Sevinç, M.R. DEA Performance Measurements in Cotton Production of Harran Plain, Turkey: A Single and Double Bootstrap Truncated Regression Approaches. Agriculture 2020, 10, 108. [Google Scholar] [CrossRef] [Green Version]
  56. Pan, X.; Lv, J.; Dyck, M.; He, H. Bibliometric Analysis of Soil Nutrient Research between 1992 and 2020. Agriculture 2021, 11, 223. [Google Scholar] [CrossRef]
  57. Omer, M.; Idowu, O.J.; Ulery, A.L.; VanLeeuwen, D.; Guldan, S.J. Seasonal changes of soil quality indicators in selected arid cropping systems. Agriculture 2018, 8, 124. [Google Scholar] [CrossRef] [Green Version]
  58. Zubair, M.; Zaidi, S.S.-e.-A.; Shakir, S.; Farooq, M.; Amin, I.; Scheffler, J.A.; Scheffler, B.E.; Mansoor, S. Multiple begomoviruses found associated with cotton leaf curl disease in Pakistan in early 1990 are back in cultivated cotton. Sci. Rep. 2017, 7, 680. [Google Scholar] [CrossRef] [PubMed] [Green Version]
  59. Masasi, B.; Taghvaeian, S.; Boman, R.; Datta, S. Impacts of irrigation termination date on cotton yield and irrigation requirement. Agriculture 2019, 9, 39. [Google Scholar] [CrossRef] [Green Version]
  60. Nicolay, G.L. Understanding and Changing Farming, Food & Fiber Systems. The Organic Cotton Case in Mali and West Africa. Open Agric. 2019, 4, 86–97. [Google Scholar]
Figure 1. Cotton Production by country Worldwide in 2018/2019 (Source: world bank, Graph 2).
Sustainability 14 00840 g001
Figure 2. Cotton yield by country in 2019 (Source: Author own computation).
Sustainability 14 00840 g002
Table 1. Descriptive statistics of the variable vectors used in the SFA under seven different combinations of distributional assumptions.
VariableUnitMeanSDMinimumMaximumSkewnessKurtosis
( Y i ) Production (000)Bales8264.4483770.0312557.814,265.2−0.14281.617904
( X 1 ) Area (000)Hectares2564.706453.48951733.33192.6−0.451231.799832
( X 2 ) FertilizerTones500.1513359.958461259.750.3461481.768292
( X 3 ) Seed (000)Tons4302.5031801.1361304.17779.4−0.266661.848038
( X 4 ) IrrigationMAF71.268759.0124956.3386.930.0298491.737987
( X 5 ) ElectricityGWH5463.5453311.117876.68812,525.940.1563741.901286
( X 6 ) Labor force (000) Nos.37,693.6515,976.4217,281.5170,602.090.5316482.094445
( X 7 ) MachineryNos.376,628.1331,078.220,0001,211,8981.0209783.006516
Note: summary statistics of input and output variables.
Table 2. Result of Unit root analysis.
Augmented Dickey-Fuller (ADF) TestKwiatkowski-Phillips-Schmidt-Shin Test
I(0)I(I)I(0)I(I)
CC & TCC & TCC & TCC & T
Production−1.75−3.13 *−8.87 *−8.83 *0.79 *0.14 *0.18 0.13
Area−1.950.08−9.17 *−6.44 *0.74 *0.21 *0.230.09 **
Seed−1.84−3.49 **−9.37 *−5.13 *0.79 *0.16 *0.500.50
Irrigation−1.52−3.14 **−7.58 *−7.51 *0.75 *0.10 *0.120.11
Electricity0.100−3.61 *−3.84 *−3.82 *0.88 *0.050.20 *0.09
Labour8.440.26−1.29−7.63 *0.88 *0.23 *0.80 *0.08 **
Machinery 8.432.87−2.52 **4.27 *0.83 *0.21 *0.68 *0.17
Present significance: at * 1% and ** 5% level.
Table 3. Hypothesis test for model specification.
Null Hypothesis (H0)LogLH1 (Unrestricted Model)LogLH0 (Restricted Model)Statistiques LRCritical ValueDecision
H 1 : OLS model is adequate35.7620.0631.385.991465Reject
H 0 : Lack of inefficiency22.9995435.7625.5215.50731Reject
Table 4. Estimated parameters of variables used in the inefficiency model.
VariablesParametersOLSFrontier Function
Coefficientt-RatioCoefficientt-Ratio
Constant β 0 −13.0221−2.9189−10.6543 ***−9.7047
Ln (Area) β 1 1.8955 ***4.22321.7678 ***15.6427
Ln (Fertilizer) β 2 −0.0930−0.3652−0.1312 **−2.3619
Ln (Seed) β 3 0.27641.55620.5225 ***9.10470
Ln(irrigation) β 4 −0.4926−0.9554−1.9720 **−18.0470
Ln (Electricity) β 5 0.02140.0773−0.1923 ***−3.0839
Ln (Labor force) β 6 0.9268 ***2.85681.3046 ***25.8351
Ln (Machinery) β 7 −0.1974−1.1191−0.1061 **−2.4034
Inefficiency Effect
Constant −0.8003−1.8158
Cotton Subsidyδ1 0.18980.7696
Seed Subsidyδ2 −0.34625−1.0515
Variance Parameters
σv2 0.2155 ***4.1027
Γ 0.9999 ***8604.7
Likelihood log 35.7622
LR test 0.31
Number of observations 48
*** 1% significant; ** 5% significant.
Table 5. Frequency Distribution of production efficiency estimates.
Efficiency LevelCotton Production Efficiency in Pakistan
No.Parentage
0.36–0.852143
0.85–0.992756
Total48100
Mean Efficiency0.85
Minimum0.36
Maximum0.99
Publisher’s Note: MDPI stays neutral with regard to jurisdictional claims in published maps and institutional affiliations.

