Abstract
Condensers are an integral part of air conditioning systems. The thermal efficiency of condensers solely depends on the rate of heat transfer from the cooling medium. Fin tubes are extensively used for heat transfer applications due to their enhanced heat transfer capabilities. Fins provide appreciable drainage because surface tension produces pressure gradients. Much research, contributed by several scientists, has focused on adjusting parameters, such as fin design, flow rates and retention angles. In this study, a setup with an observing hole was used to inspect the influence on retention angle of adjusting the flow rates of the fluid. The increase in retention angle was examined using several velocities and concentration mixtures. Pin-fin tubes were used to obtain coherent results using a photographic method. The experimental setup was designed to monitor the movement of fluid through the apparatus. The velocity was varied using dampers and visibility was enhanced using dyes. Photographs were taken at 20 m/s velocities after every 20 s. and 0.1% concentration and the flooding point observed. The experimental results were verified by standard observation which showed little variation at lower velocity. For water/water-propanol mixtures, a vapor velocity of 12 m/s and concentration ratio of 0.04% was the optimal combination to achieve useful improvement in retention angle. With increase of propanol from 0% to 0.04%, the increase in retention angle was greater compared to 0.04% to 0.1%. For velocities ranging from 0 to 12 m/s, the increase in retention angle was significant. A sharp change was observed for concentration ratios ranging from 0.01% to 0.05% compared to 0.05% to 0.1%.
1. Introduction
Heat transfer phenomena refer to “the movement of heat from one medium to some other medium due to a temperature gradient”. Fins are the extruded surfaces of an object. They help in extracting heat to or from the surrounding environment by supporting convection. Increasing the surface area of an object is an inexpensive solution for heat transfer problems. Condensers are used in many industrial applications, such as refrigeration plants. Fins can be used in heat exchangers to minimize the cost of heat transfer. Vapor condensation can be achieved on wetting and non-wetting surfaces. The high heat transfer rate achieved on a non-wetting surface is normally termed drop-wise condensation. Film-wise condensation is achieved using wetted surfaces and is practiced on an industrial scale due to its low cost.
Many investigations [1] have been performed on retention angle for pin tubes for different fluids with different techniques, such as the pin counting and image inspection methods. Water, ethylene glycol and R-141 have been investigated by researchers to achieve a range of vapor velocities using pin-fin tubes. Previous researches like Honda et al. [2] demonstrated that when water is used as a test fluid at a velocity of 20 m/s using pin-fin tubes with variation of circumferential pin thickness, the maximum retention angle is 45°. The value of the retention angle obtained is different for other fluids, such as ethylene glycol and R-141, at different velocities. Water is inexpensive to use as a test fluid so, instead of using ethylene glycol or R-141, water is used as a test fluid with propanol. It gives high values of retention angles when suitable combinations of velocities and concentration ratio are used. Several previous investigations have been performed for pin-fin tubes employing mono-component test fluids. This experimental study was carried out using an experimental rig, with four pin-fin tubes having the same circumferential pin spacing and pin height, but different pin circumferential thickness, at different velocities ranging from 0 to 20 m/s, to assess the effect on retention angle of using water-propanol mixtures with concentration ratios ranging from 0 to 0.1% by mass.
Research concerning condensation on the horizontal tube is of immense importance in the industry. To increase the heat transfer rate through these tubes, integrated fins are used on the outer surface. As a result of use of these fins, condensation flooding occurs on the bottom side of the tube. This type of condensation flooding is mostly observed in substances possessing relatively high surface tension to density ratios. Katz et al. [3] were the first to work on this subject. They extensively studied condensation flooding on the bottom side of integral fin tubes. Subsequently many scholars have contributed to this [4]. Other scholars have proposed methods for finding the convective condensation heat transfer on tubes integrated with fins [5].
Several methods for investigating heat transfer condensation on cross-sections have been described by researchers [6]. As condensate releases and drips from the profile of fins, the condensate film thins out and the convective heat transfer coefficient increases. For fluids used as refrigerants, the maximum enhancement ratio is found to be 10.2 [2]. The process of vapor diffusion requires attention to this type of condensation because it reduces heat and mass transfer. An up to eight-fold enhancement of the vapor side heat transfer coefficient can be obtained with the addition of ethanol into the feed water [7].
Sharp volatile ingredients may undergo a pseudo-dropwise condensation [8] process with lower surface tension. Fuji [9] found that the appearance of condensate film changed according to changes in parameters, such as composition and pressure, etc. Utaka and Nishikawa developed a technique to estimate the change over time in film thickness of mixtures on the surface of the tube during the condensation of ethanol-water mixtures [10]. A theoretical expression [11] of a semi-empirical nature was proposed for calculating retention angles for free convection within a mean deviation of 0.15. The relation can be used to evaluate condensation flooding for free convection using horizontal tubes with pin-fin tubes [12]. The rate of heat transfer increases by enhancing the surface area when using pin-fin tubes or horizontal integral pin-fin tubes [13].
Briggs [14] observed condensate retention using three integral pin-fin horizontal tubes with water, ethylene glycol and R-113 as tube fluids. Briggs et al. [15] found a high value of condensate retention. Much research is being performed on condensation retention and the volatile evaporation of liquids inside capillary tubes. Dhawaleswarapu [16] et al., replicated the data presented by Buffon and Sefiane [17,18,19] by experimenting on five capillary tubes ranging in size from 75 to 1575 μm. They estimated the temperature profiles for sessile water droplets using infrared techniques [20].
Yau et al. [21] used R-113, ethylene glycol and water as fluid in fin tubes which were integrally horizontal and evaluated with and without the use of drainage strips. These strips were the porous frame on the top of tube for initiation of flooding. To charge the fluid onto the tube, cotton cloth was used. Little increase in retention angle was observed without drainage strips. Researchers have performed various experiments on these tubes and condensers to improve their efficiency [22,23] and to develop models of condensation by free convection [24,25]. Through use of these models, researchers [26,27] have concluded that heat transfer depends on retention angle [28]. The relation is given as,
The experimental data showed that the condensation by free convection was very efficient in 3-dimensional tubes compared to 2-dimensional tubes with fins [1,29,30]. In addition, condensation by forced and free convection was studied on tubes [31] and data obtained for many different types of tubes with different pressures and geometries. The transfer of heat was found to be significantly enhanced when the velocity was increased [32,33,34,35]. The coefficient of heat transfer relating to this kind of condensation was derived by Rose and Briggs. Data related to non-steam is more reliable than that of steam data [36,37,38].
The phenomenon of the Marangoni effect explains mass transfer in two liquids as a result of surface tension. It is defined as, “the condensation carried out by a two-liquid mixture with low boiling temperatures”. A considerable increase in the heat transfer rate can be seen dropwise in the condensation region for Marangoni condensation [38,39] on water-loving substances. This kind of increment in heat transfer rate has been tested on various tubes [40] and flat plates, with flow velocity of up to 0.4 m/s, a heat transfer rate increment for parallel tubes has been observed between four times and eight times for plates in Marangoni condensation [38]. It is understood that the nearby area affects warm exchange. So, by increasing the area of the surface, the warmth exchange rate can be increased. As the warmth exchange rate depends substantially on the surface zone, improvement was made to the two-dimensional tubes of vital blades. The rate of warmth exchange is controlled by eliminating condensate film in the middle part of balances on the top of the tube. The surface pressure shows an opposite effect beneath the balance tube because the activity is small.
For a thick liquid, warmth exchange is difficult to achieve by enlargement of exposed surface on the top of the fin tube. A large amount of liquid remains in the bottom of the cylinder. The problem with the maintenance of condensate was investigated by Katz et al. [3]. A thorough review of basic fin tubes is provided by Briggs and Rose and Marto [22,23]. Rudy and Webb [26] tested the maintenance of condensate under dynamic and static conditions using R-11 and n-pentane cylinders of different types. They observed no major difference in condensate maintenance under the required conditions. Yau et al. [21] experimented with many rectangular blade tubes using R-113, ethylene glycol, and water. Important features of tubes were changed while others were kept constant for all tubes. It was found that condensate maintenance critically declined using strips. The first precise model was proposed by Honda et al. [5] to predict the condensate maintenance of the balance tube, with subsequent steps introduced into the hypothetical model to increase strain and thickness of condensate equally. The steps are as follows:
- Condensate meniscus must be in connection with the tip of the cylinder.
- Spread arch span of the condensate Should be much smaller than the circumference.
- Fin stature using balance separation have more smaller abilities when compared with the balance tip to that of the range rover.
- Longitudinal flow has an endless range at the cylinder base.
Numerous methodologies have been used to develop related models, such as those of Owen et al. [39], Rudy and Webb [26], with work by Masuda and Rose [40] describing condensate occurring in the center balances of the cylinder. Briggs [14] presented static fluid estimations for 12 stick-balance cylinders and 3 integral fin tubes. Ethylene glycol, R-l 13, and water were used as the fluid. Stick tallying and photographic strategy techniques were used for maintenance of the static fluid. Briggs and Ali [12] used the same techniques and fluids to perform experiments observing the most extreme weakness to be ±5%. Honda et al. [2] developed heat exchangers on three basic types of fin tubes and 3D saw-toothed cylinder which operated on R-113 and methanol as fluid. Yau et al. [21] applied steam to 13 even-blade tubes [3]. The influence of blade space on heat exchange elevation was observed by flexibly varying the balance scattering from 0.5 m to 20.0 m.
Condensation is an integral part of an industrial plant. The fluid is condensed by removal of heat; the heat removal process must be precise and efficient for the cycle to operate. The efficiency of condensation depends on the geometry and the working parameters of the condenser surface and fins. For this purpose, fin design and retention angles can be studied. Research has been performed on retention angles along with bare liquids, with experimentation focusing on finding the results for mixtures with different types of tubes (dimensional parameters). When mixtures are used in Marangoni condensations in technological applications, the study of mixtures is further explored to provide retention angle estimates. Condensers are used in applications for renewable energy. Recycling energy is a priority in industry, increasing the value of applying condensation principles in renewable energy processes. Sustainability leads to an improved environment and eliminates or lessens the requirement of fuels for power generation. In sum, this drives progress of condensation process technology used in the renewable energy cycle.
2. Experimental Setup and Instrumentation
The schematic arrangement for the experimental setup is shown in the Figure 1, comprising the following parts;
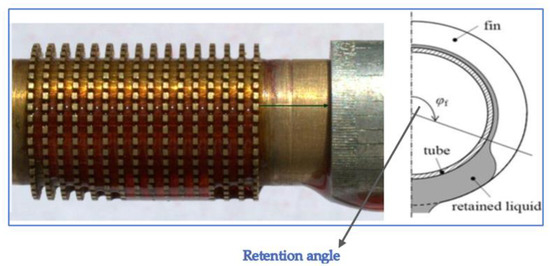
Figure 1.
Schematic diagram of horizontal pin-fin tubes.
- Wind tunnel with adjustable damper
- Anemometer
- Two digital cameras
- Glass window
- Drainage collector bowl
- Test tubes
- Fluid reservoir and test fluids.
- ➢
- Wind Tunnel
A vertical wind tunnel as shown in Figure 2 was used to simulate vapor velocity. A manual damper was used to control the air velocity. Alongside changing the position of the handle, air velocity was also changed with 4 m/s increments within a range of 0–20 m/s.
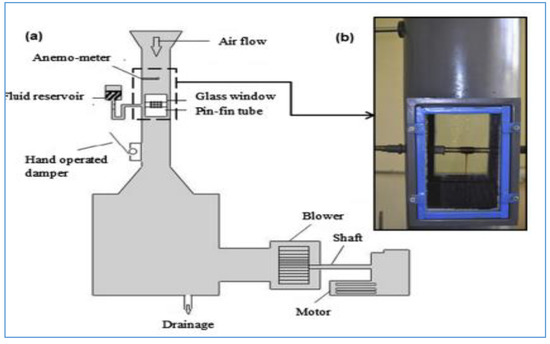
Figure 2.
Experimental setup. (a) Schematic, (b) Test section.
- ➢
- Anemometer
A hot-wire anemometer-handled thermometer was used over the test tube to calculate the air velocity accurately having 0–20 m/s velocity range along with 0 m/s velocity resolution, temperature range of 0–50 along with 0.1 temperature resolution and accuracy of readings.
- ➢
- Digital Cameras
Two high-quality Nikon D3100 cameras recorded the phenomenon. Cameras operated in time duration and shutter mode to capture the phenomenon after every 1/200 s for optimum quality of images. Bidirectional images were captured for the flooding phenomenon on tubes using the cameras; these images were then enhanced to measure the retention angle.
- ➢
- Drainage Control
A bowl was used to collect the drainage. Test tubes were observed at a minimal flow rate where drops could barely fall on a tilted plate. The drops were then guided into a mini-channel to collect liquid. The other end collected condensate.
- ➢
- Test Tubes
A total of 4 pin-fin tubes with varying circumferential pin thickness were tested. These were divided into 2 main groups,
- Circumferential thickness varied for retention angle (ɸf),
- (ɸf) suitably to be measured for water & water-propanol mixture ratio.
Fin tubes were made with tiny holes on the upper side of tubes to circulate condensation with one end closed and the other connected to liquid (see Figure 3; for dimensions see Table 1).
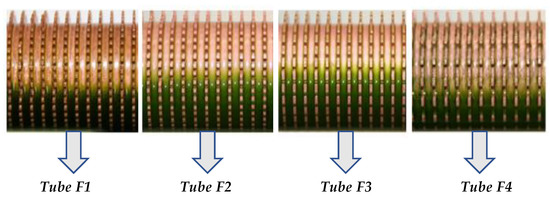
Figure 3.
Pin-fin tubes with variable circumferential parameters.

Table 1.
Dimensions of Test Tubes (mm).
The terms F1, F2, F3, F4 were used for tubes having different geometrical parameters used in the experimentation [13]. A plastic reservoir was used to provide a continuous flow for simulating condensate using two test fluids: water and water-propanol mixtures were used with the addition of red dye.
3. Methodology of Data Reduction
Retention angle was measured using several tubes with different mixture ratios, maintaining a range of velocity (from 0 to 20 m/s) along with the concentration ratio (0.00% to 0.10% by mass). Outcomes for water (0% propanol) were also related to the available results of M. Abubakar et al. [13].
3.1. Measurement of Condensate Retention
Vapor velocities for free convection to 19 m/s were attained by the wind tunnel. To calculate the retention angle pin-fin [21] tubes were used along with the photographic method. After setting up the apparatus, the concentration ratio was used at the given velocity range. Velocity variations were attained with the help of a damper. A dye was used for visibility enhancement.
3.2. Photographic Method
Cameras captured the flooding phenomenon. For this setting, several photographs were taken after every 20 s at 20 m/s velocity and 0.1% concentration. The flooding point was recorded. The average height was measured from the lower point to the point of retention angle, and calculated using Equation (2);
This relation was extracted from the experimental research article by Ali, H. M and M. Abubakar [13]. It provides the mathematical procedure to convert linear dimensions to angular measurement, as in the study of fins.
3.3. Results Validation and Comparison for Tubes
The experimental results were analyzed applying the relation derived by Abubakar and Ali [13] (Schematic is shown in Figure 4). The trend showed a minor variation for low velocity. Following this comparison, experiments were performed for different mixture concentrations (see Table 2).
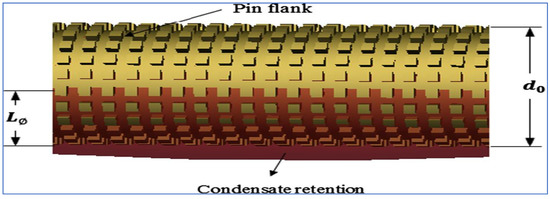
Figure 4.
Photographic parameters Lɸ & do for pin-fin tube.
Table 2.
Trends for different circumferential thickness with mixtures used in the experiments.
Results estimation according to the above table showed a relative increase in the retention angle for different mixtures used in the experiments. It can be seen from the table that a sharp trend was observed under several conditions. From this, the optimal conditions for obtaining the higher efficiencies for water and water-propanol mixtures can be inferred. It is apparent that, for higher thickness fin-tubes, water-propanol mixtures show an increasing trend, best suited to these conditions.
4. Results and Discussions
4.1. Validation
Experimentation was performed to check the validation of equipment. M. Abubakar [13] performed experimentation and used the Honda et al. [2] equation to compare pin-fin tubes and integral fin-tube apparatus with the Honda results. The presented results were also evaluated using the Honda et al. [2] equation; the results exhibited a strong alignment with the Honda equation. In Figure 5, the trend line represents the retention angle for the Honda et al. [2] equation, and square boxes represent data points. As inferred from the trends, the present data validates the Honda et al. position. The validation encouraged us to extend experimentation for different mediums. An experimentation is made for studying the effects of ratios of mixtures in comparison with water in validation with the Honda et al. equation.
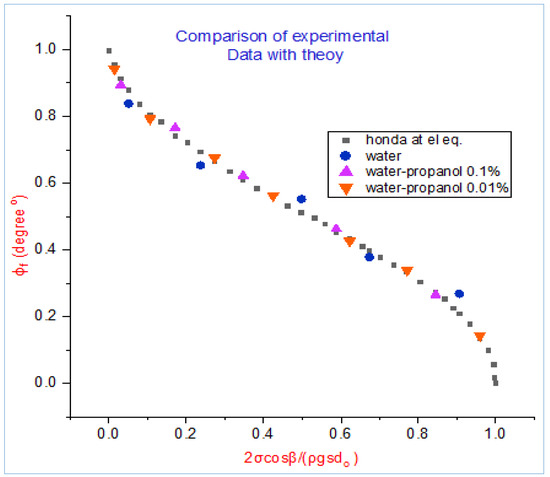
Figure 5.
Comparison of present data with Honda et al. [2] equation.
The theoretical relation for the Honda et al. Equation is
In the above Figure 5 the theoretical data points were evaluated using the Honda et al. equation. These data points were then compared with experimental data points to infer the trend of the results and to assess the validity of the experimental data.
The trend gave confidence in the research method used to find the changes in retention angles by varying the circumferential thickness of the horizontal pin-fin tubes.
4.2. Effect of Vapor Velocity on Retention Angle on Test Tubes
- ➢
- Results for test tubes using water as fluid
F1, having a minimum thickness of about 0.5 mm, showed a maximum retention angle when velocity approached zero. As velocity increased, the retention angle also increased for four tubes which implies that velocity was directly proportional to the angle. It can be concluded that vapor shear has an important role in the pin-fin tube upper half [13]. By increasing velocity, vapor shear increased and, as a result, the retention angle also increased. For F1 (min. circumference) the retention angle increased with increasing velocity from 0° to 40°. Similarly, for F4 (max. circumference thickness) the retention angle increased as the velocity increased from 0 to 20 m/s. As thickness increases the distance between two pin decreases, so more liquid will be trapped between pins. As seen in the results, the liquid trapped was more visible for F4 resulting in a decrease of the retention angle due to capillary action. It can clearly be observed that, for water, the trend showed a sharp increase in retention angle above a certain value of velocity, with a similar trend observed for water-propanol mixtures. (Table 3 for geometries of tubes)
Table 3.
Geometries of tubes.
The experimental model used for evaluating results of retention angles for Tubes F1, F2 and F3 is given as
The relation for calculating retention angle according to the parameters to be varied is given above.
where,
Circumferential thickness is given as
In this comparison for tube F1, the circumferential thickness is taken as 0.5 mm
- ➢
- Results for test tubes using water-propanol mixture as test fluid
The figures show the effect of vapor velocity for tubes of different circumferences with water-propanol as the test fluid. When a 0.1% mass ratio of propanol was added to water then the viscosity of the fluid mixture was changed which increased the retention angle. For 0.1% of propanol, the retention angle increased from 24° to 49° for F1 and 10° to 40° for F4. A sudden increment was observed for all tubes when the propanol ratio was increased from 0% to 0.01%, by comparing Figure 6, Figure 7 and Figure 8. As viscosity was gradually increased by increasing the concentration of propanol, a small amount of liquid was trapped between fins. By increasing the propanol ratio to 0.02%, the retention angle was also increased. The retention angle showed a direct relationship with the improved propanol ratio.
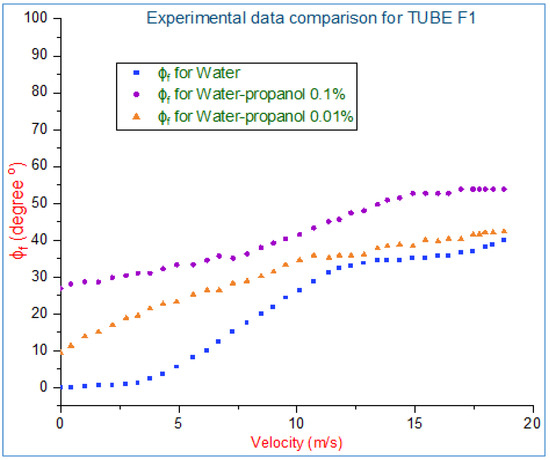
Figure 6.
Experimental data comparison for tube F1 with tc = 0.5 mm.
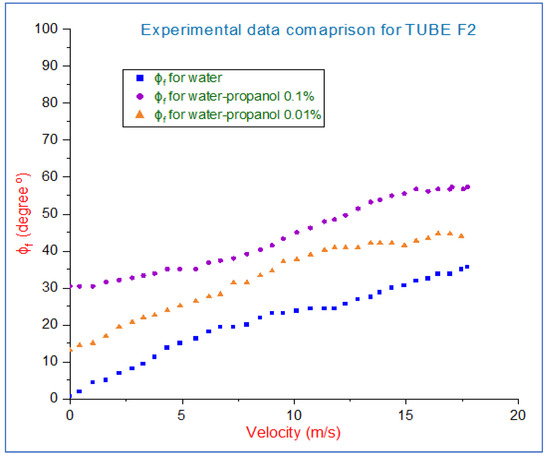
Figure 7.
Experimental data comparison for tube F2 with tc = 1.0 mm.
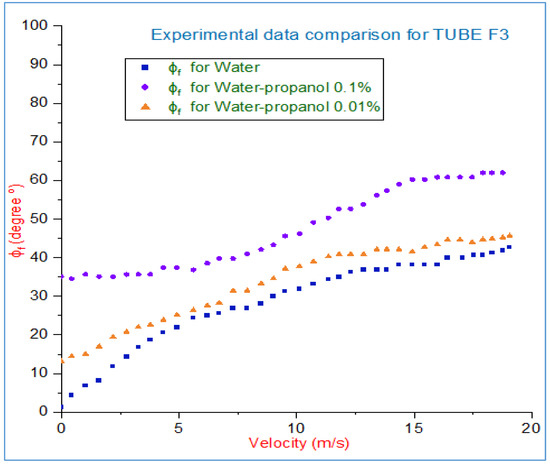
Figure 8.
Experimental data comparison for tube F3 with tc = 1.5 mm.
It was observed that a sharp increase in retention angle for propanol ratios of 0% to 0.05% occurred, but for increments of 0.05% to 0.1%, the increase occurring in retention was less than that for 0–0.05% ratios. For 0.05–0.1% ratios, the retention angle increased only 1°, but for an increment of 0.01% from 0%, the retention angle varied by 10° at zero velocity.
In this comparison for tube F2, the circumferential thickness was taken as 1.0 mm.
The figures show that for high velocities the concentration ratio increases by 0.1% with a very small change in retention angle. For concentrations ranging from 0.05% to 0.1%, higher retention angles were achieved. Tube F1 had more increment in velocity compared to F2, F3 and F4 for this concentration range. For velocity changes from 12 m/s to 20 m/s, the increment in retention angle was small for low circumferential thickness but negligible for large circumferential thickness tubes.
From this discussion, it can be concluded that velocity affects the retention angle. To obtain optimum retention angle for varying pin thickness, the velocity must be 12 m/s. At velocities higher than 12 m/s, there was no significant increment in retention angle.
In this comparison for tube F3, the circumferential thickness was taken as 1.5 mm.
The results obtained are for water and water-propanol mixtures.
It was observed that to obtain the results for water-propanol mixtures, it was necessary to find the observation for water alone. A trend for water used as a condensate medium was estimated and the results were then merged with the experimental data to increase the credibility of the results.
Although several trends were evident for tubes with varying thicknesses, the retention angle measurements for tubes at various velocities had their own characteristics. The starting points for different mixtures were not the same for the same velocity. This was due to the mixture properties of different fluids. The graph shows major changes for water and water-propanol mixture at 0.1%. For 0.01% and a thickness of 1.5 mm the trend is less distinctive (Figure 9).
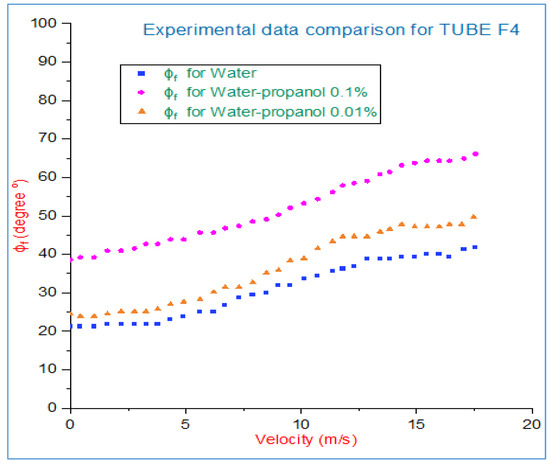
Figure 9.
Experimental data comparison for tube F4 with tc = 2.0 mm.
4.3. Effects of Different Geometrical Parameters on the Measurement of Retention Angles
To obtain optimal results, the circumferential thickness tc of pin-fin tubes [4] was varied from a minimum value to a prominent maximum value for concentrations ranging from 0% to 0.05% and 0.05% to 0.1%. Photographs were taken from various directions to collect the observations. Other parameters, such as do, dr and H were kept constant according to standardized values for the best optimization possible. For tube F1 (min. circumference tc = 0.5), the retention angle increased with increasing velocity from 0° to 40°. Similarly, for tube F4 (max. circumference tc = 2.0), the retention angle increased as the velocity increased from 0 to 20 m/s. As thickness (t) increases the distance between two pins decreases, more liquid will be trapped between pins. As seen from the results, the liquid trapped was more visible for tube F4 which resulted in a decrease of retention angle due to capillary action.
4.4. Standard Deviations and Error Estimations for the Data Extracted from the Experiments
The retention angles for free convection using mathematical relation Equation (1), usually fell within a mean deviation of 0.15. Error bars for 5% were used to examine the differences. This deviation occurred for higher values of circumferential thickness of the pin-fin tubes. This estimation is not specified for the type of parameter used but can be generally represented as a range for many applications of different mixtures and parameters. In this experiment, the standard deviation accounted for the average reading and measurements taken by the photographic method for lower and higher values of circumferential thickness. Figure depicts the average comparison for the estimated results [4].
- ➢
- Result evaluations for error estimations.
The error estimations are shown (Figure 10), based on three groups of photographic readings. The standard deviation was calculated and it was found that errors appeared for readings having large values of retention angles over a concentration range of 0.05% to 0.1%. However, fewer errors occurred within the range of close values of retention angles for water-propanol mixtures ranging from 0% to 0.05%. The standard deviation is shown with the error bars in the modified data chart. Consistent with the above discussion, it can be inferred from the graph that for lower values of circumferential thickness, the retention angle readings are more precise. This means that the result values do not deviate much from each other. However, at larger values of circumferential thickness, the values of retention angles start deviating from each other and show an impacting scattered behavior.
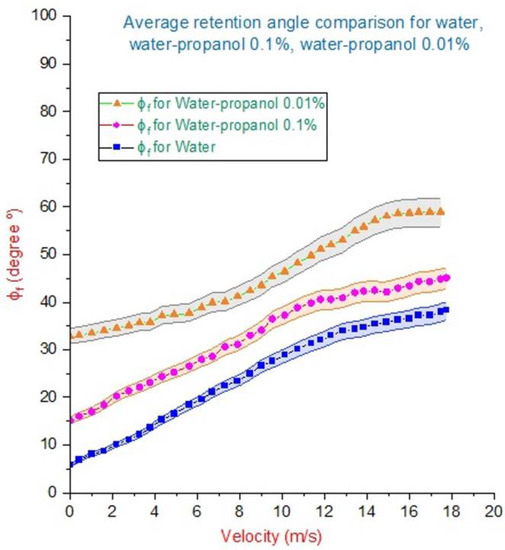
Figure 10.
Error estimates for average values of ∅_f using different mixtures.
4.5. Effect of Concentration on Retention Angle on Test Tubes
The retention angle was not only affected by velocity but also by the concentration ratio of propanol in a water-propanol mixture. The effect was investigated [13] at velocity ranges from 0 m/s to 20 m/s. At first, the concentration ratio was kept at 0.01% and the velocity varied from 0 m/s to 20 m/s with 4 m/s increments for each tube, and results for retention angle were obtained.
- ➢
- Results for test tubes for varying concentration of solution using water-propanol as test fluid
A sharp trend in retention angle was observed for concentration ratios of 0.01% to 0.05% compared to concentration ratios of 0.05% to 0.1%. For a concentration ratio of 0.1%, the curve of retention angle tended to increase. At a concentration ratio of 0.05%, the retention angle was 68°, but for concentration ratios from 0.05% to 0.1%, the retention angle increased to 20° with a total of 70° [2]. Tubes F1 and F2 had more increments compared to tubes F3 and F4 at high velocity and increasing concentration ratio due to small pin thickness. After investigating both parameters at velocity 12 m/s and 0.04% concentration ratio, optimum values were obtained. By increasing these two parameters further, no significant changes occurred.
5. Conclusions
Results of vapor velocity and water-propanol concentration ratio were obtained for four pin-fin tubes to investigate the effect on retention angle by considering the same circumferential spacing and pin height, varying circumferential pin thickness. Velocity ranges were from 0 m/s to 20 m/s. Water-propanol mixtures 0% to 0.1% by mass as test fluid were used. From the results obtained, the following conclusions are drawn: With an initial retention angle of 90°, an increase occurred with a rise in velocity due to vapor shear/frictional drag which pushed condensate downward as the velocity was increased. The retention angle decreased as the circumferential pin-fins thickness increased due to the trapping of water between the fins. By increasing the thickness of pin-fins, the gap between two pins became smaller, which caused the trapping of water and, as a result, the retention angle decreased. With an increase in propanol concentration, the retention angle increased. Tube F1 had a higher rationale even for zero velocity and zero concentration of propanol. For any tube, a vapor velocity of 12 m/s and concentration ratio of 0.04% was the optimal combination to achieve valuable improvement in retention angle. With increase of propanol concentration from 0% to 0.04%, the increase in retention angle was greater compared to 0.04% to 0.1%. For velocities ranging from 0 to 12 m/s, the increase in retention angle was dominant.
Author Contributions
Experimentation, H.M.H.; Conceptualization, H.M.A.; Supervision, H.M.A.; Editing and review, M.U. All authors have read and agreed to the published version of the manuscript.
Funding
This research received no external funding.
Data Availability Statement
Data will be provided on request.
Acknowledgments
Hafiz Muhamad Ali is thankful for the support of the Deanship of Scientific Research through SR201004 at King Fahd University of Petroleum and Minerals, Dhahran, 31261, Saudi Arabia.
Conflicts of Interest
Authors declare no conflict of interest on the publication of this work.
Nomenclature
| Ad | surface area of a plain tube having diameter d (m2) |
| Af | fin flank surface area (m2) |
| Ao | outside area of plain tube (m2) |
| Ar | constant used in equation (m2) |
| A | empirical constant |
| Bf | empirical constant used in equation |
| Bs | empirical constant used in equation |
| Bt | empirical constant used in equation |
| B | longitudinal fin spacing (m) |
| N | empirical constant used in equation |
| D | diameter of plain tube (m) |
| H | pin or fin height (m) |
| hfg | specific enthalpy of vaporization (kJ/kg) |
| k | thermal conductivity of material (kJ/kg-oK) |
| ṁ | mass flow rate of the condensate (kg/s) |
| Nud | Nusselt number defined for the flooded region |
| P | pressure exerted (N/m2) |
| q | heat flux (W/m2) |
| R | pin or fin root radius (m) |
| Re | Reynold’s number |
| Ro | pin or fin tip of radius (m) |
| rb | curvature radius of the condensate at the bottom of fin (m) |
| rt | curvature radius of the condensate at the tip of fin (m) |
| s | longitudinal spacing in between the fin or pin (m) |
| sc | circumferential pin spacing (m) |
| T | absolute temperature (OK) |
| Twf | fin root average temperature for flood region (OK) |
| Twu | fin root average temperature for un-flood region (OK) |
| L | longitudinal thickness (pin-fin) (m) |
| tc | circumferential pin thickness (m) |
| V | volume of the condensate (m3) |
| Y | function of geometric parameter |
Greek Letters
| α | heat transfer coefficient (kJ/OK) |
| ξ | active area enhancement ratio for fin or pin (m2) |
| ξ(ϕ) | function used in equation |
| μ | dynamic viscosity of the liquid (kg/m-s) |
| ρ | density of the condensate (kg/m3) |
| ρv | density of vapor (g/mL) |
| ηu | pin or fin efficiency for un-flooded region |
| σ | surface tension of the liquid (N/m) |
| Øf | retention angle (o) |
| θ | half angle at fin tip (o) |
References
- Ali, H.M.; Briggs, A. Condensation heat transfer on pin-fin tubes: Effect of thermal conductivity and pin height. Appl. Therm. Eng. 2013, 60, 465–471. [Google Scholar] [CrossRef]
- Honda, H.; Nozu, S.; Mitsumori, K. Augmentation of condensation on horizontal finned tubes by attaching a porous drainage plate. In Proceedings of the ASME-JSME Thermal Engineering Joint Conference, Honolulu, Hawaii, 20–24 March 1983. [Google Scholar]
- Katz, D.; Hope, R. Project M, Liquid Retention on Finned Tubes; University of Michigan: Ann Arbor, MI, USA, 1946; p. 592. [Google Scholar]
- Ali, H.M.; Ali, A. Measurements and semi-empirical correlation for condensate retention on horizontal integral-fin tubes: Effect of vapour velocity. Appl. Therm. Eng. 2014, 71, 24–33. [Google Scholar] [CrossRef]
- Honda, H.; Nozu, S. A Prediction Method for Heat Transfer During Film Condensation on Hor-izontal Low Integral-Fin Tubes. J. Heat Transf. 1987, 109, 218–225. [Google Scholar] [CrossRef]
- Briggs, A.; Rose, J.W. An evaluation of models for condensation heat transfer on low-finned tubes. J. Enhanc. Heat Transf. 1999, 6. [Google Scholar] [CrossRef]
- Utaka, Y.; Wang, S.J.I.J.o.H.; Transfer, M. Characteristic curves and the promotion effect of ethanol addition on steam condensation heat transfer. Int. J. Heat Mass Transf. 2004, 47, 4507–4516. [Google Scholar] [CrossRef]
- Hijikata, K.; Fukasaku, Y.; Nakabeppu, O. Theoretical and Experimental Studies on the Pseudo-Dropwise Condensation of a Binary Vapor Mixture. J. Heat Transf. 1996, 118, 140–147. [Google Scholar] [CrossRef]
- Fuji, T.; Mitsukura, Y.; Moriya, T. A proposal of model-based alignment using swarm intelligence and condensation. In Proceedings of the 2011 International Symposium on Intelligent Signal Processing and Communications Systems (ISPACS), Chiang Mai, Thailand, 7–9 December 2011; pp. 1–6. [Google Scholar]
- Utaka, Y.; Okuda, S.; Tasaki, Y. Configuration of the micro-layer and characteristics of heat transfer in a narrow gap mini/micro-channel boiling system. Int. J. Heat Mass Transf. 2009, 52, 2205–2214. [Google Scholar] [CrossRef]
- Ali, H.M.; Briggs, A. An investigation of condensate retention on pin-fin tubes. Appl. Therm. Eng. 2014, 63, 503–510. [Google Scholar] [CrossRef]
- Ali, H.M.; Briggs, A. A semi-empirical model for free-convection condensation on horizontal pin–fin tubes. Int. J. Heat Mass Transf. 2015, 81, 157–166. [Google Scholar] [CrossRef]
- Ali, H.M.; Abubaker, M. Effect of vapour velocity on condensate retention on horizontal pin-fin tubes. Energy Convers. Manag. 2014, 86, 1001–1009. [Google Scholar] [CrossRef]
- Briggs, A. Liquid retention on three-dimensional pin-fin tubes. In Proceedings of the 2nd International Exergy, Energy and Environment Symposium, Kos, Greece, 3 July 2005. [Google Scholar]
- Briggs, A.; Wen, J.; Rose, J.W. Accurate Heat Transfer Measurements for Condensation on Horizontal, Integral-Fin Tubes. J. Heat Transf. 1992, 114, 719–726. [Google Scholar] [CrossRef]
- Dhavaleswarapu, H.K.; Chamarthy, P.; Garimella, S.V.; Murthy, J.Y. Experimental investigation of steady buoyant-thermocapillary convection near an evaporating meniscus. Phys. Fluids 2007, 19, 82103. [Google Scholar] [CrossRef] [Green Version]
- Buffone, C.; Sefiane, K. Investigation of thermocapillary convective patterns and their role in the enhancement of evaporation from pores. Int. J. Multiph. Flow 2004, 30, 1071–1091. [Google Scholar] [CrossRef]
- Buffone, C.; Sefiane, K. IR measurements of interfacial temperature during phase change in a confined environment. Exp. Therm. Fluid Sci. 2004, 29, 65–74. [Google Scholar] [CrossRef]
- Buffone, C.; Sefiane, K.; Christy, J.R.E. Experimental investigation of self-induced thermocapillary convection for an evaporating meniscus in capillary tubes using micro–particle image velocimetry. Phys. Fluids 2005, 17, 52104. [Google Scholar] [CrossRef]
- Fabien, G.; Antoni, M.; Sefiane, K. Use of IR Thermography to Investigate Heated Droplet Evaporation and Contact Line Dynamics. Langmuir 2011, 27, 6744–6752. [Google Scholar] [CrossRef] [PubMed]
- Yau, K.K.; Cooper, J.R.; Rose, J.W. Horizontal Plain and Low-Finned Condenser Tubes—Effect of Fin Spacing and Drainage Strips on Heat Transfer and Condensate Retention. J. Heat Transf. 1986, 108, 946–950. [Google Scholar] [CrossRef]
- Marto, P.J. An Evaluation of Film Condensation on Horizontal Integral-Fin Tubes. J. Heat Transf. 1988, 110, 1287–1305. [Google Scholar] [CrossRef]
- Park, K.-J.; Jung, D. Optimum fin density of low fin tubes for the condensers of building chillers with HCFC123. Energy Convers. Manag. 2008, 49, 2090–2094. [Google Scholar] [CrossRef]
- Briggs, A.; Rose, J. Effect of fin efficiency on a model for condensation heat transfer on a horizontal, integral-fin tube. Int. J. Heat Mass Transf. 1994, 37, 457–463. [Google Scholar] [CrossRef]
- Rose, J. An approximate equation for the vapour-side heat-transfer coefficient for condensation on low-finned tubes. Int. J. Heat Mass Transf. 1994, 37, 865–875. [Google Scholar] [CrossRef]
- Rudy, T.M.; Webb, R.L. An Analytical Model to Predict Condensate Retention on Horizontal Integral-Fin Tubes. J. Heat Transf. 1985, 107, 361–368. [Google Scholar] [CrossRef]
- Sukhatme, S.P.; Jagadish, B.S.; Prabhakaran, P. Film Condensation of R-11 Vapor on Single Horizontal Enhanced Condenser Tubes. J. Heat Transf. 1990, 112, 229–234. [Google Scholar] [CrossRef]
- Kumar, R.; Varma, H.; Mohanty, B.; Agrawal, K. Augmentation of heat transfer during filmwise condensation of steam and R-134a over single horizontal finned tubes. Int. J. Heat Mass Transf. 2002, 45, 201–211. [Google Scholar] [CrossRef]
- Briggs, A.J.H. Theoretical and experimental studies in shell-side condensation. In Proceedings of the 6th International Conference on Heat Transfer, Fluid Mechanics and Thermodynamics, Pretoria, South Africa, 30 June–2 July 2008. [Google Scholar]
- Sertkaya, A.; Altınısık, K.; Dincer, K. Experimental investigation of thermal performance of aluminum finned heat exchangers and open-cell aluminum foam heat exchangers. Exp. Therm. Fluid Sci. 2012, 36, 86–92. [Google Scholar] [CrossRef]
- Niezgoda-Żelaso, K.B.; Żelaso, K.J. Free and forced convection on the outer surface of vertical longitudinally finned tubes. Exp. Therm. Fluid Sci. 2014, 57, 145–156. [Google Scholar] [CrossRef]
- Chen, L.; Li, Z.; Guo, Z.-Y. Experimental investigation of plastic finned-tube heat exchangers, with emphasis on material thermal conductivity. Exp. Therm. Fluid Sci. 2009, 33, 922–928. [Google Scholar] [CrossRef]
- Briggs, A.; Rose, J.W. Condensation on Integral-Fin Tubes with Special Reference to Effects of Vapor Velocity. Heat Transf. Res. 2009, 40, 57–78. [Google Scholar] [CrossRef]
- Zhao, Z.; Li, Y.; Wang, L.; Zhu, K.; Xie, F. Experimental study on film condensation of superheated vapour on a horizontal tube. Exp. Therm. Fluid Sci. 2015, 61, 153–162. [Google Scholar] [CrossRef]
- Tong, P.; Fan, G.; Sun, Z.; Ding, M.; Su, J. An experimental investigation of pure steam and steam–air mixtures condensation outside a vertical pin-fin tube. Exp. Therm. Fluid Sci. 2015, 69, 141–148. [Google Scholar] [CrossRef]
- Mirokvich, V.V.; Missen, R.W. Non-filmwise condensation of binary vapors of miscible liquids. Can. J. Chem. Eng. 1961, 39, 86–87. [Google Scholar] [CrossRef]
- Rose, J. Surface Tension Effects and Enhancement of Condensation Heat Transfer. Chem. Eng. Res. Des. 2004, 82, 419–429. [Google Scholar] [CrossRef]
- Murase, T.; Wang, H.; Rose, J. Marangoni condensation of steam–ethanol mixtures on a horizontal tube. Int. J. Heat Mass Transf. 2007, 50, 3774–3779. [Google Scholar] [CrossRef]
- Owen, M.; Kröger, D.G. Contributors to increased fan inlet temperature at an air-cooled steam condenser. Appl. Therm. Eng. 2013, 50, 1149–1156. [Google Scholar] [CrossRef]
- Masuda, H.; Rose, J.W. Static configuration of liquid films on horizontal tubes with low radial fins: Implications for condensation heat transfer. Proc. R. Soc. London. Ser. A Math. Phys. Sci. 1987, 410, 125–139. [Google Scholar] [CrossRef]
Publisher’s Note: MDPI stays neutral with regard to jurisdictional claims in published maps and institutional affiliations. |
© 2022 by the authors. Licensee MDPI, Basel, Switzerland. This article is an open access article distributed under the terms and conditions of the Creative Commons Attribution (CC BY) license (https://creativecommons.org/licenses/by/4.0/).