
The Effect of Bacteria on Early Age Strength of CEM I and CEM II Cementitious Composites


Abstract
:1. Introduction

| Bacterial Status | Bacterial Strain | Bacterial Concentration | Cement Type | Max/Min % Change in Strength | Reference |
|---|---|---|---|---|---|
| Live | Shewanella | 105 cells/mL water | OPC 53 | +25% at 28 days | [12] |
| Shewanella | 105 cells/mL water | OPC 53 | +19% at 28 days | [13] | |
| Sporosarcina pasteurii | 7.6 × 10³ cells/mL concrete | CEM I | +19% at 28 days | [16] | |
| Arthrobacter crystallopoietes | 0.8 at OD600 | PC | −11.7% at 7 days | [20] | |
| Sporosarcinapasteurii | 0.8 at OD600 | PC | −17.3% at 28 days | [20] | |
| ACRN3 (ureolytic environmental isolate) | 106 cells/mL water | CPO 40 | −8.16% at 28 days | [21] | |
| ACRN5 (ureolytic environmental isolate) | 105 cells/mL water | CPO 40 | −8.7% at 28 days | [21] | |
| Bacillus cohnii | 105 cells/mL water | CEM II | −12% at 3 days | [19] | |
| Dead | Sporosarcina pasteurii and Pseudomonas aeruginosa | 3.8 × 10⁷ cells/mL concrete each | CEM I | +11% at 28 days | [16] |
| Bacillus cohnii | 107 cells/mL water | CEM II | +35% at 3 days | [19] |
2. Materials and Methods
2.1. Bacteria and Growth Conditions
2.2. Cement Mortar and Paste Sample Preparation
2.3. Experimental Methods
2.3.1. Flexural and Compressive Strength
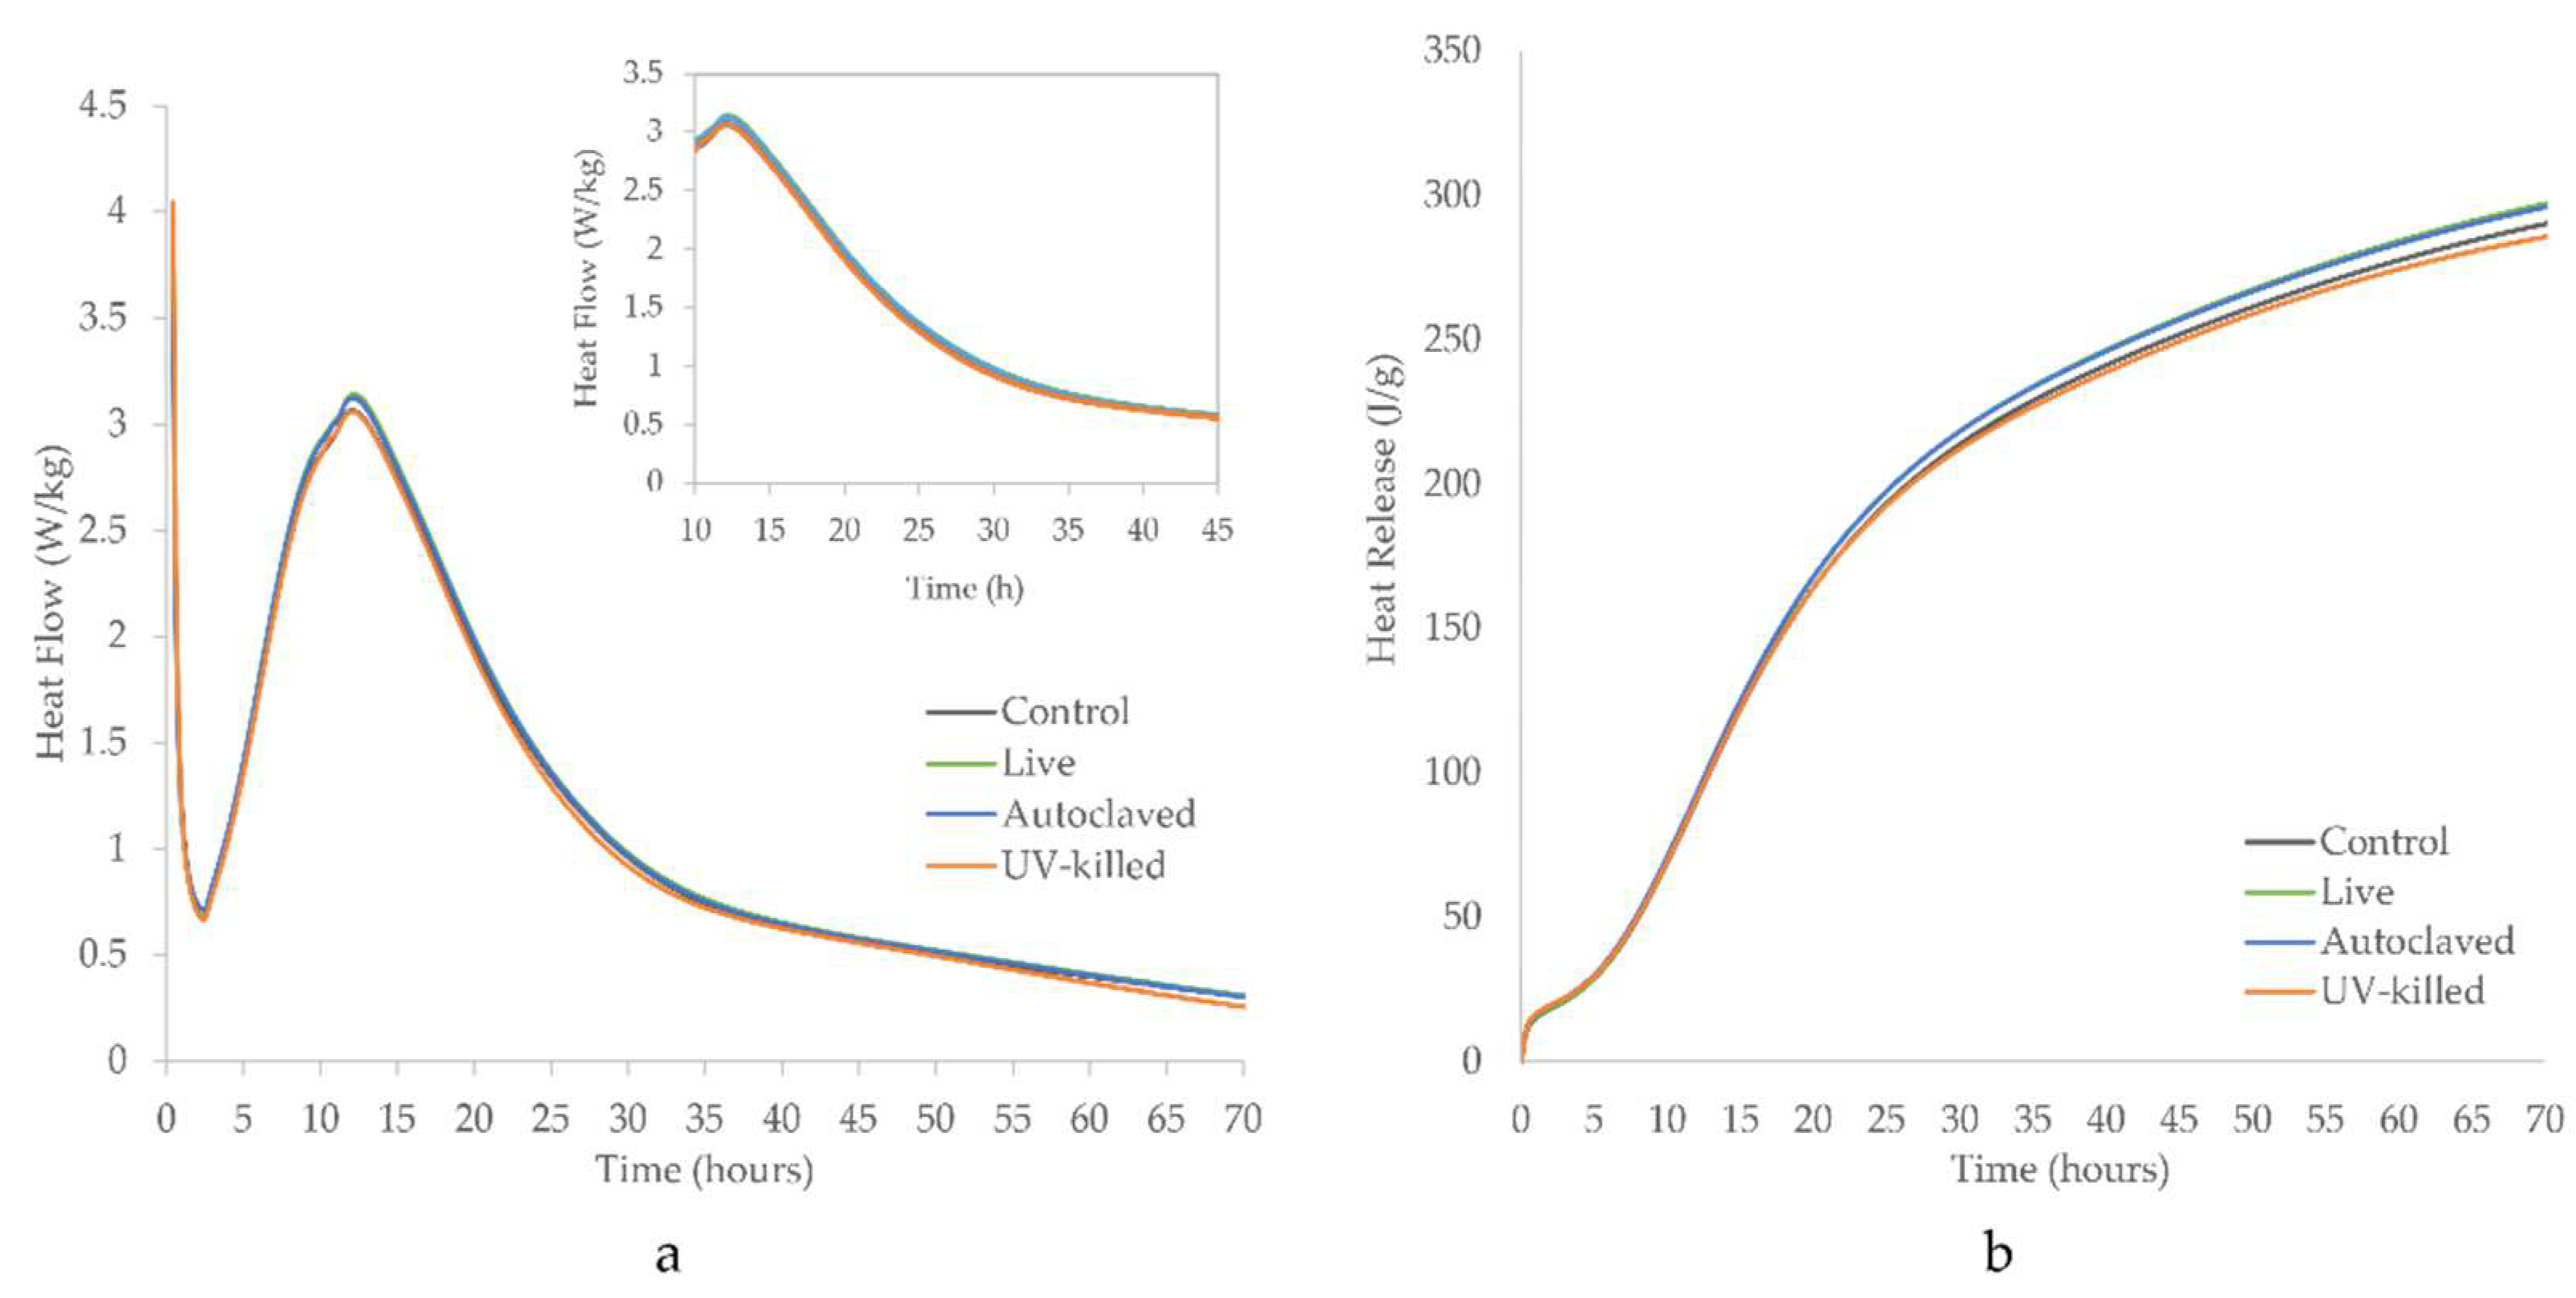
2.3.2. Calorimetry
2.3.3. Microscopic Analysis
2.3.4. Porosity Analysis
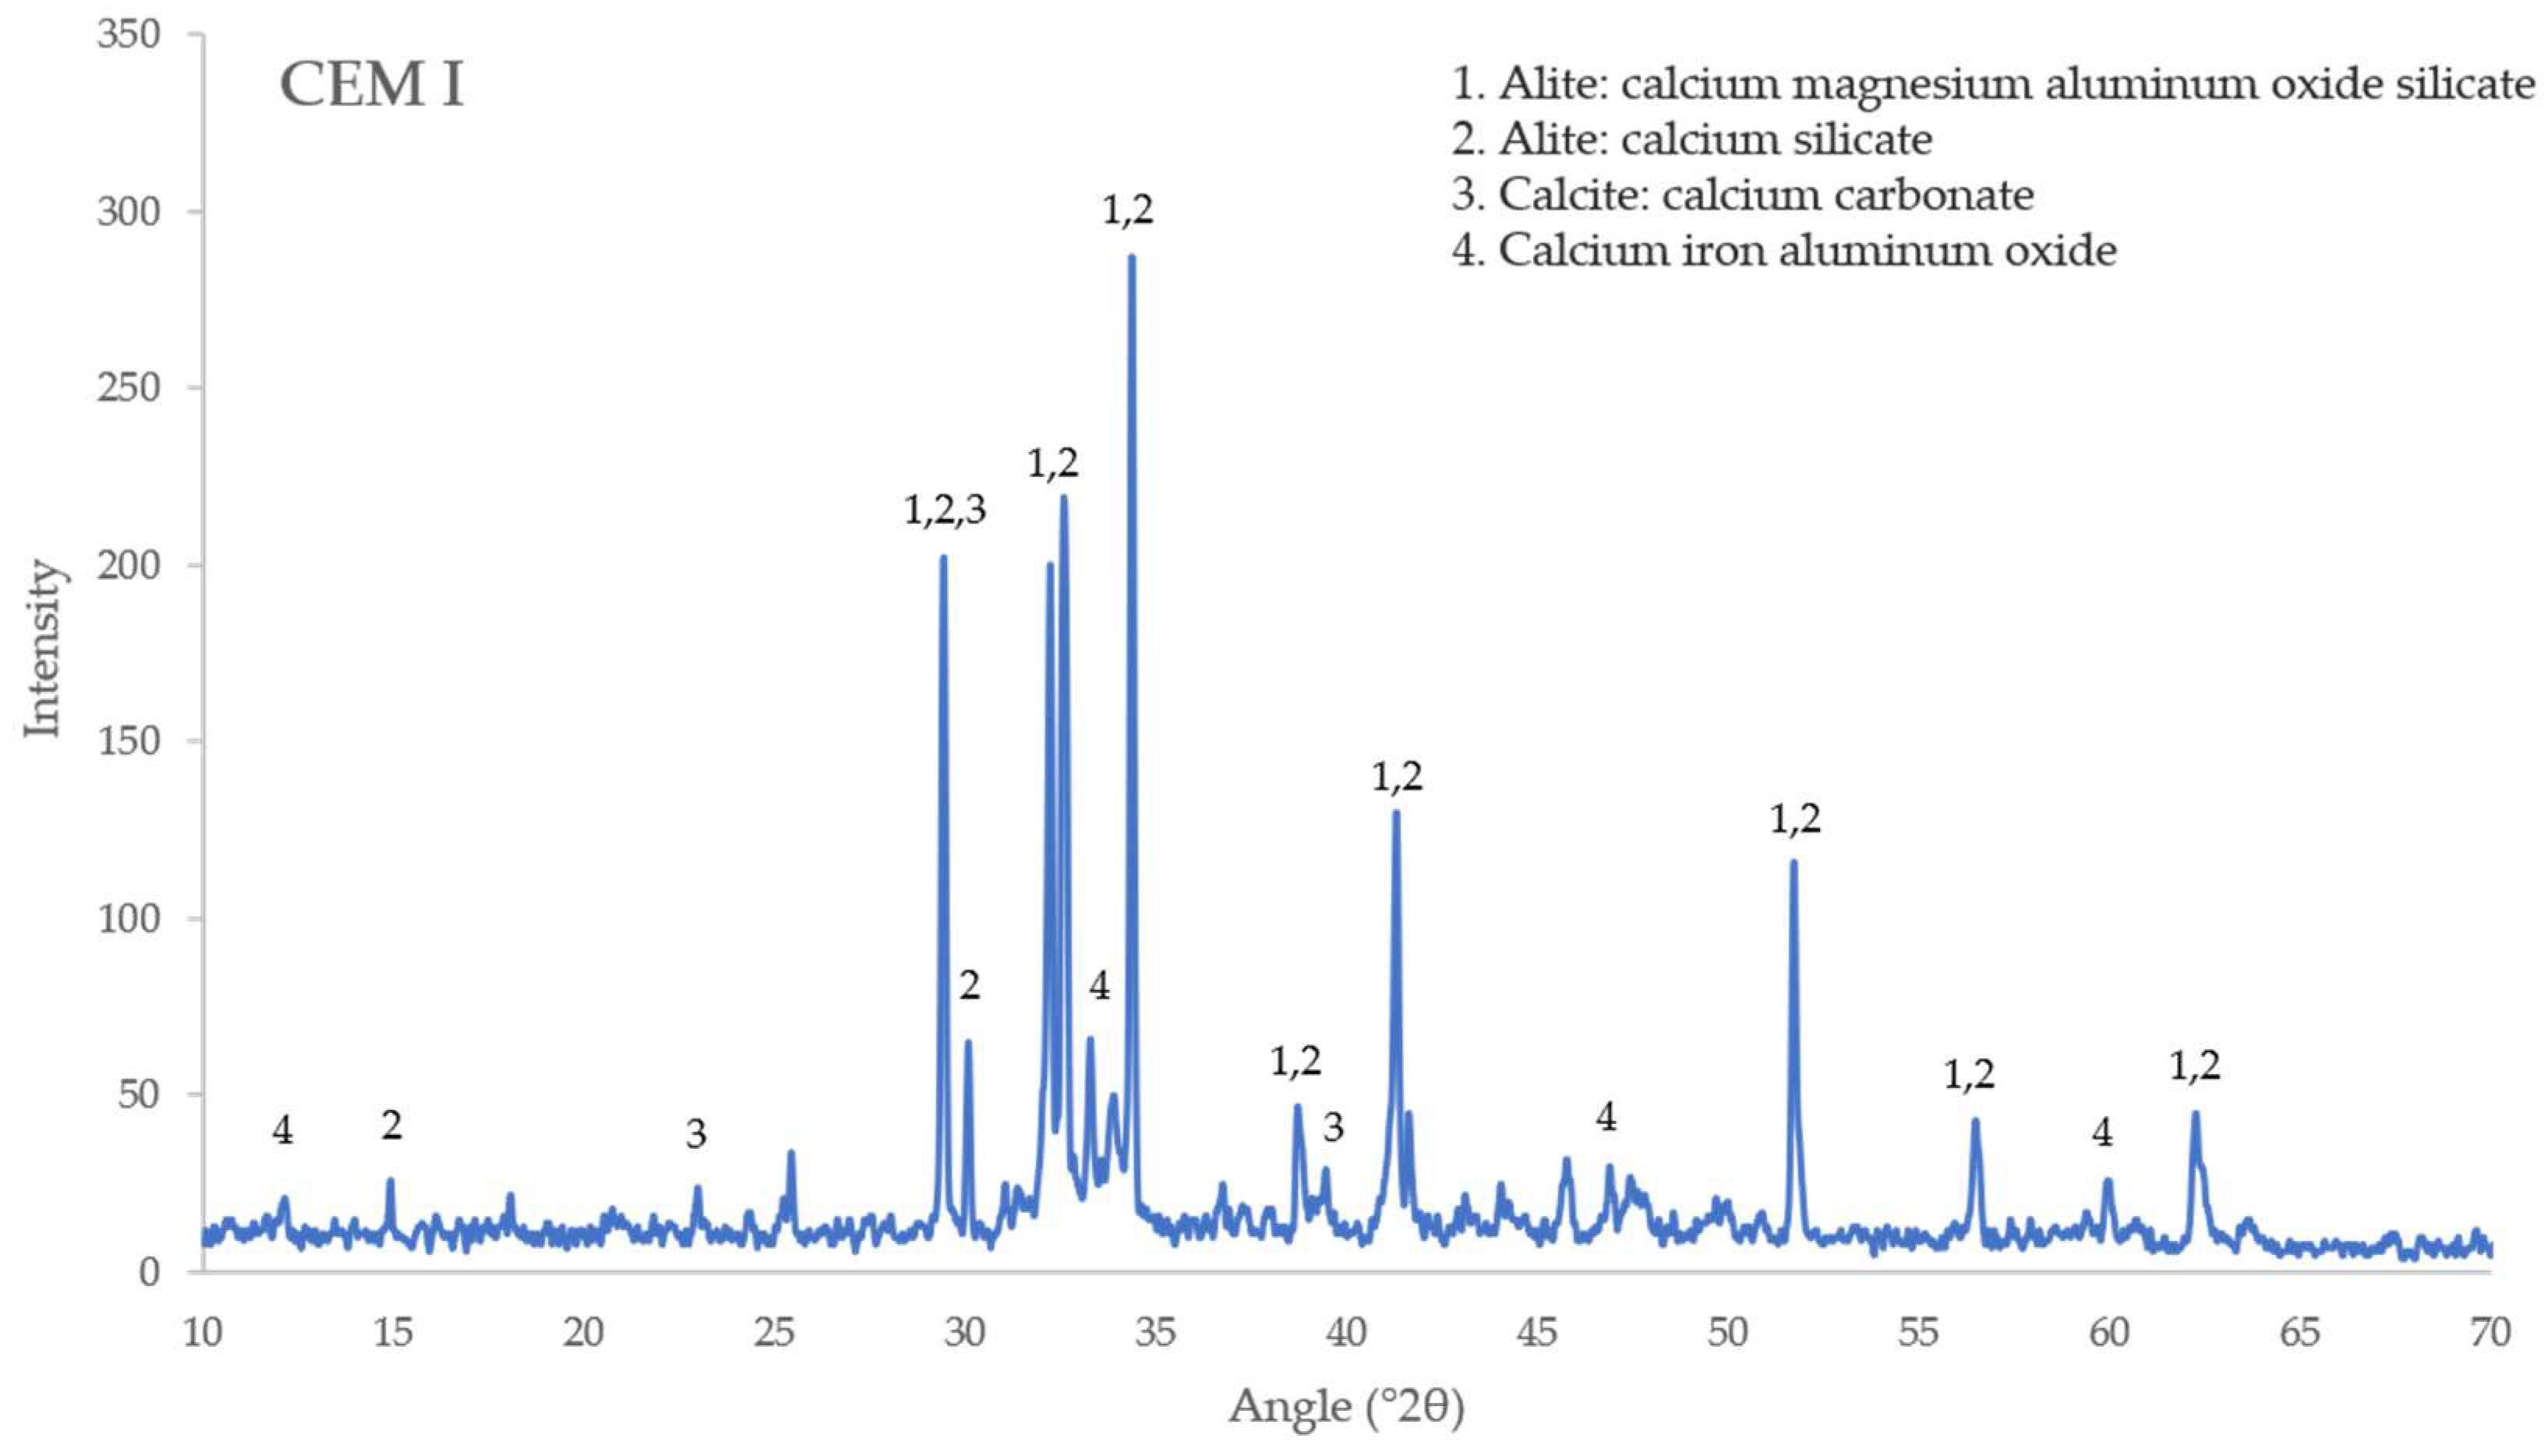
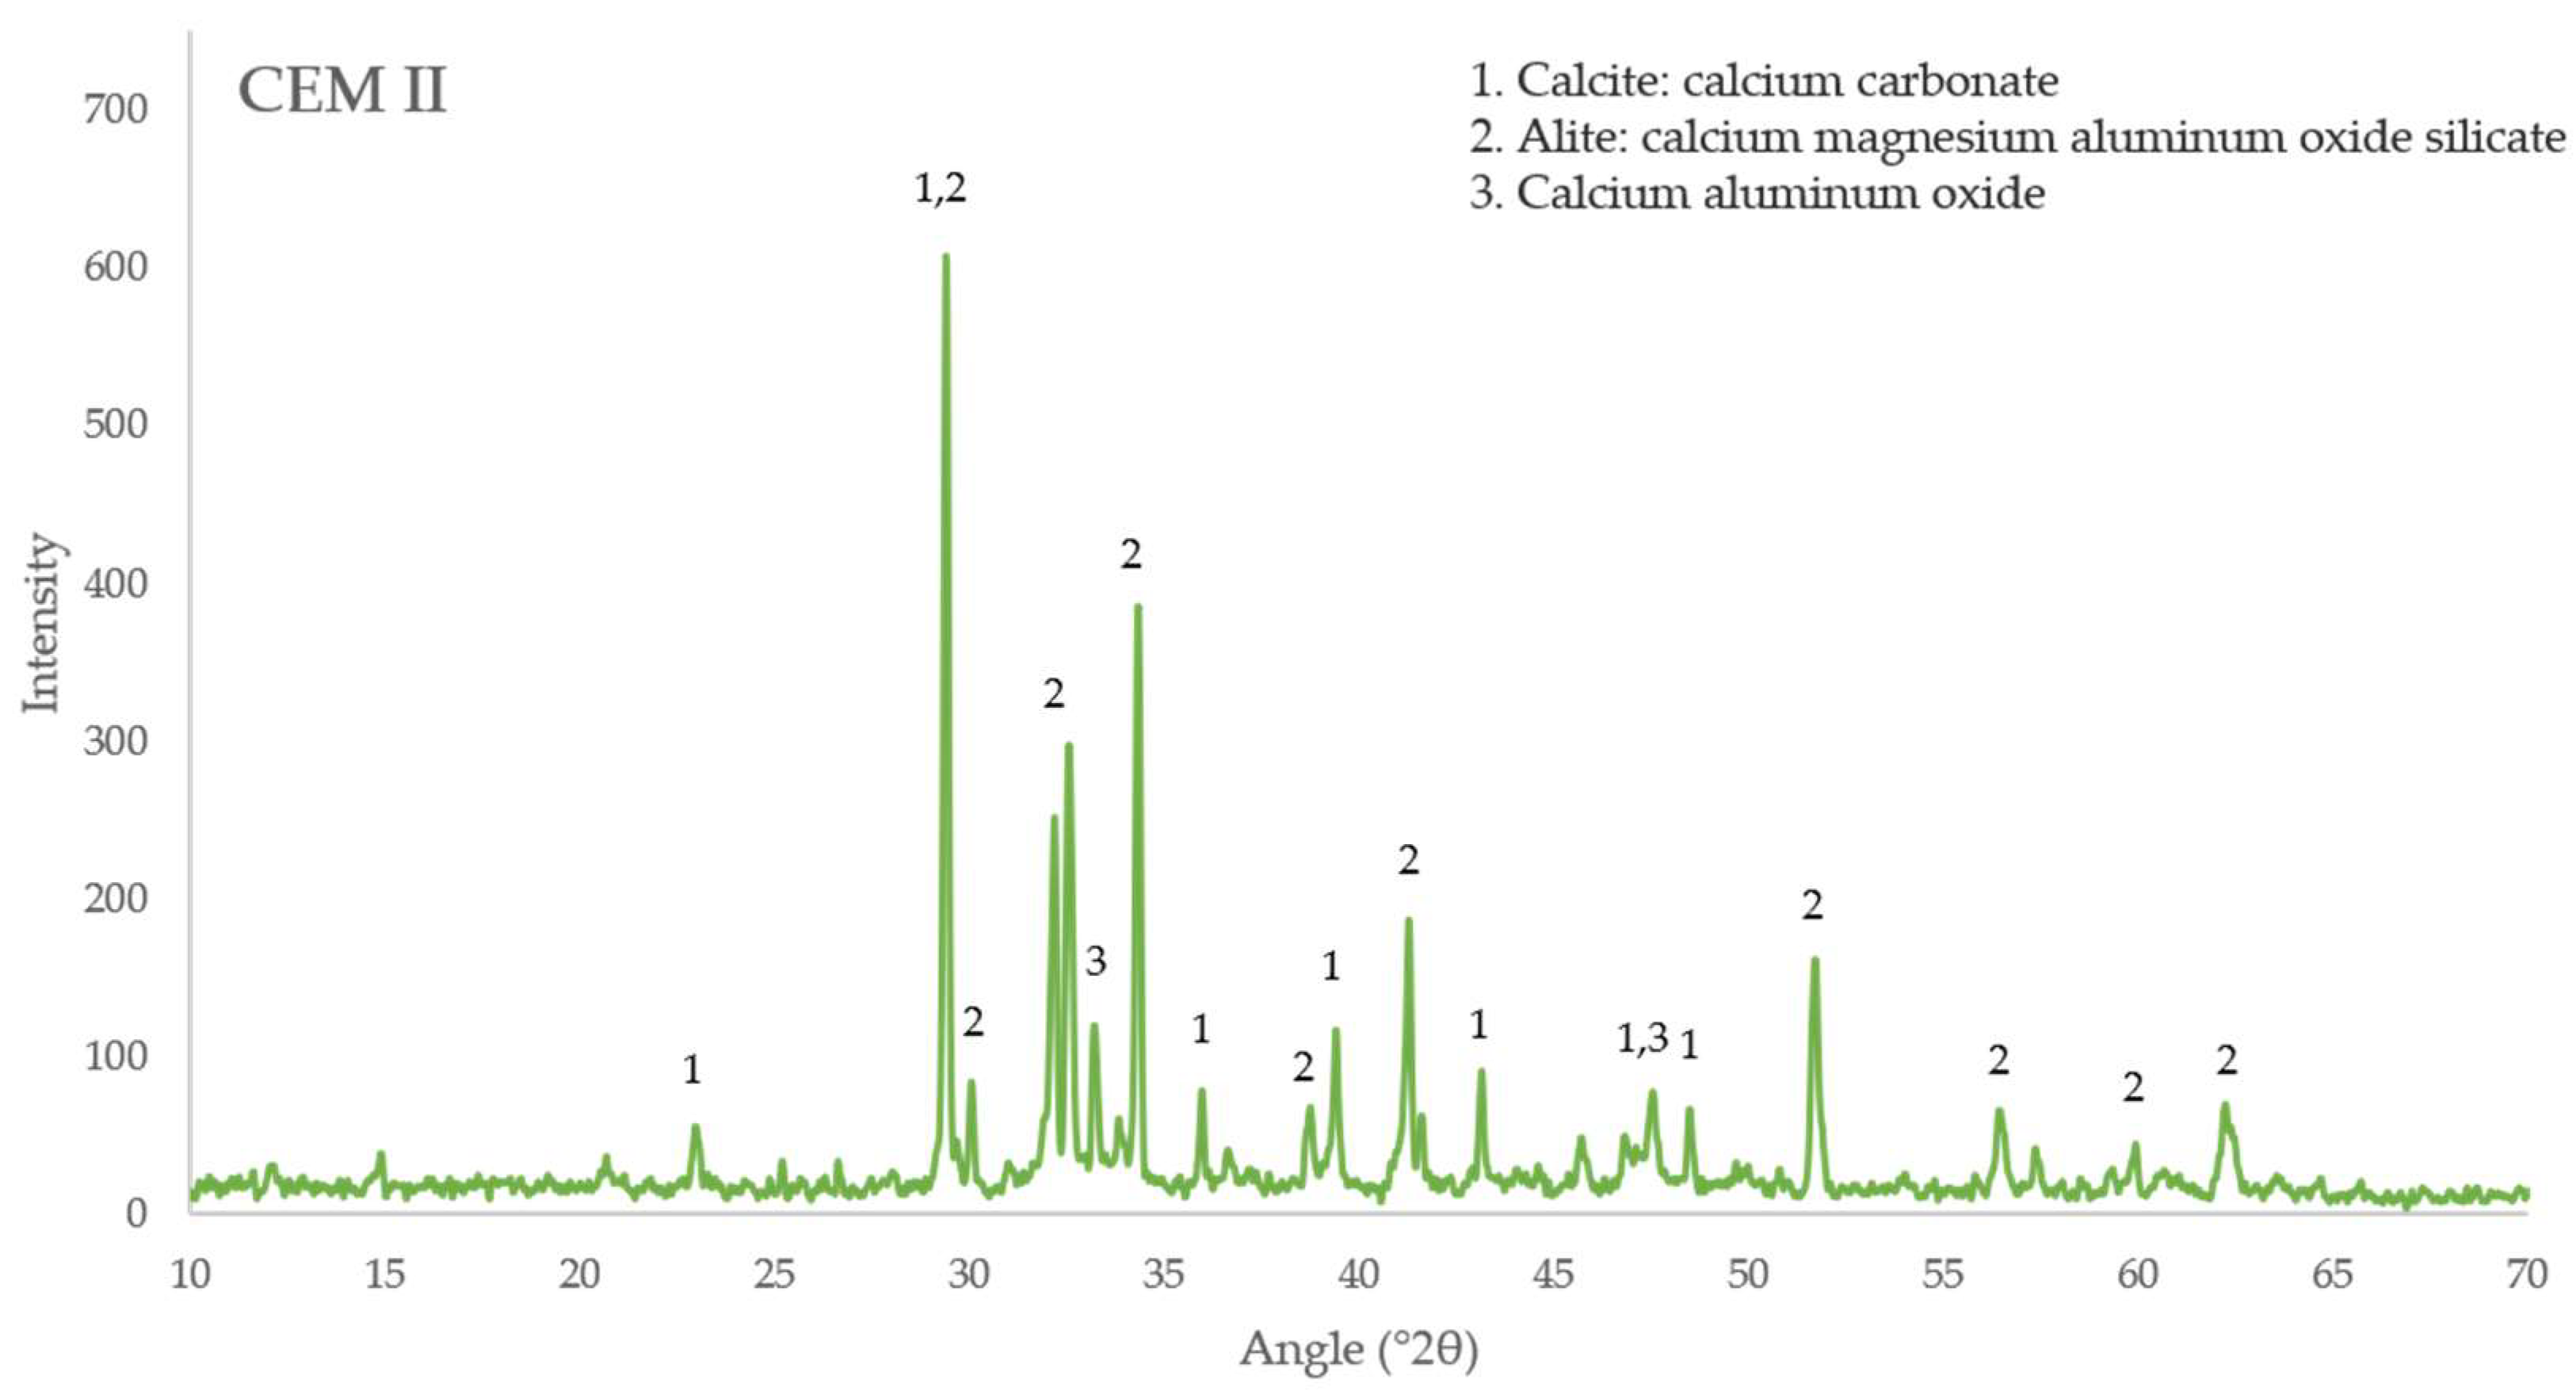
2.3.5. X-ray Diffraction Analysis
3. Results
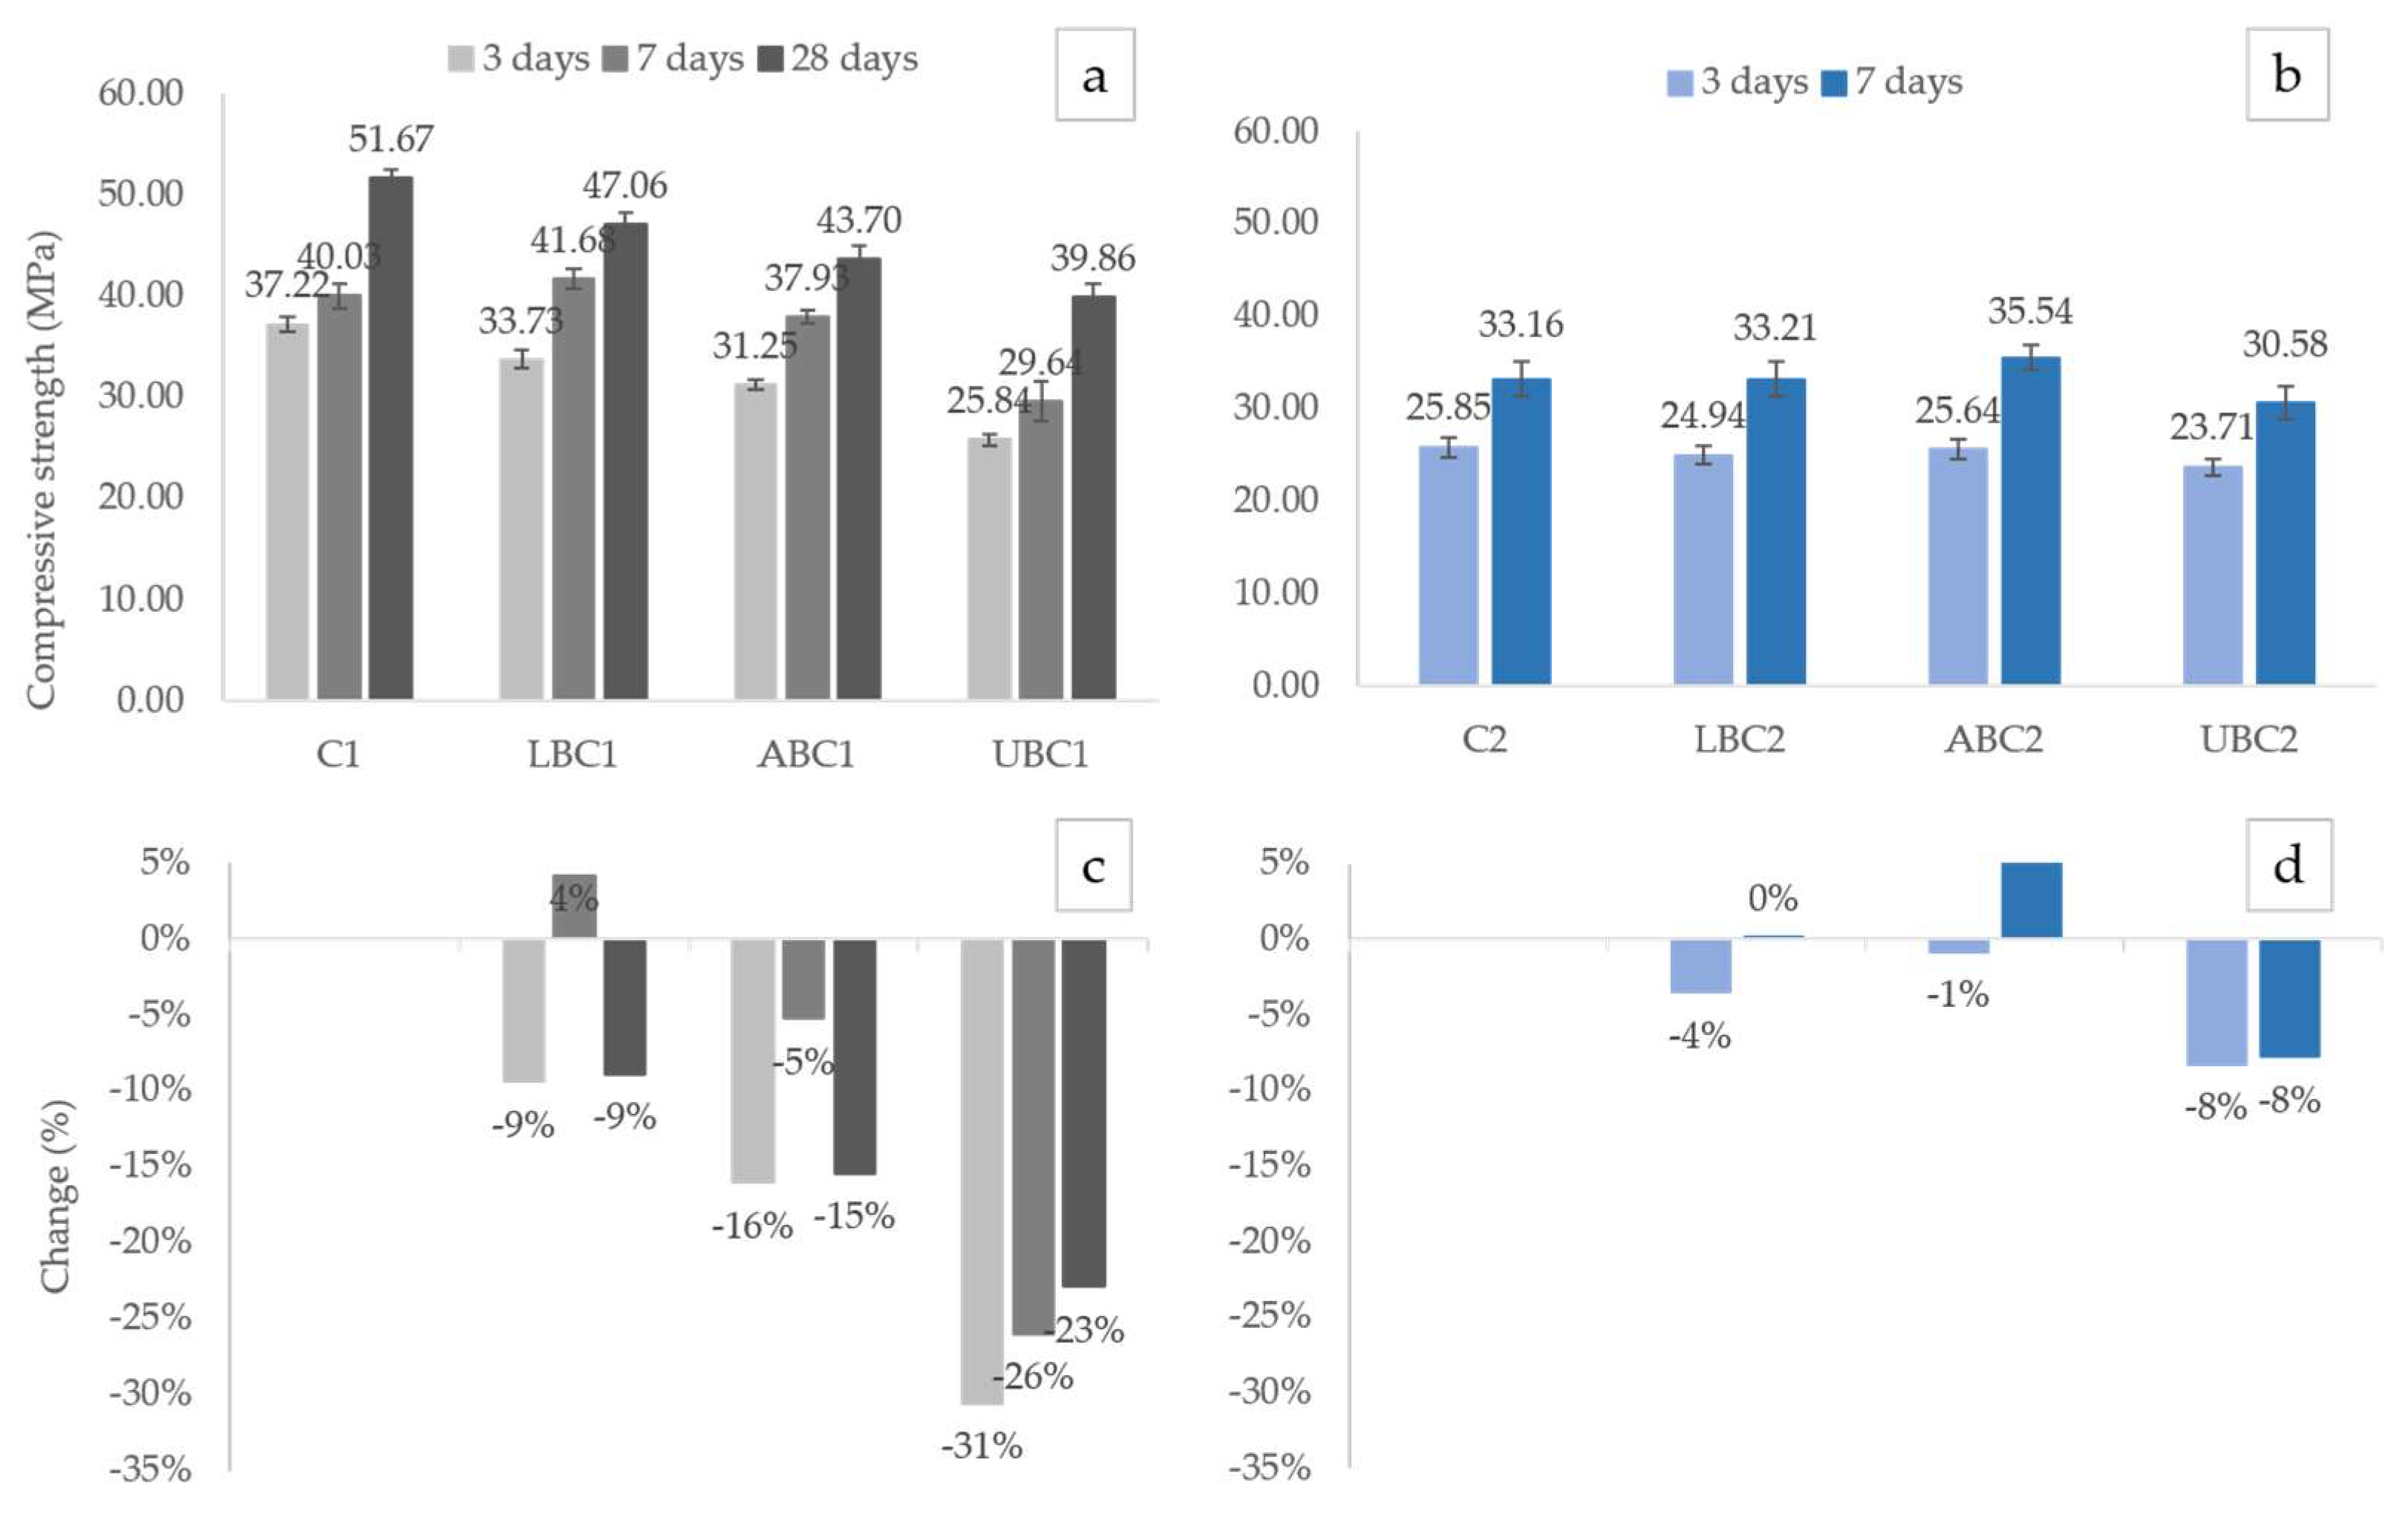
3.1. Flexural and Compressive Strength
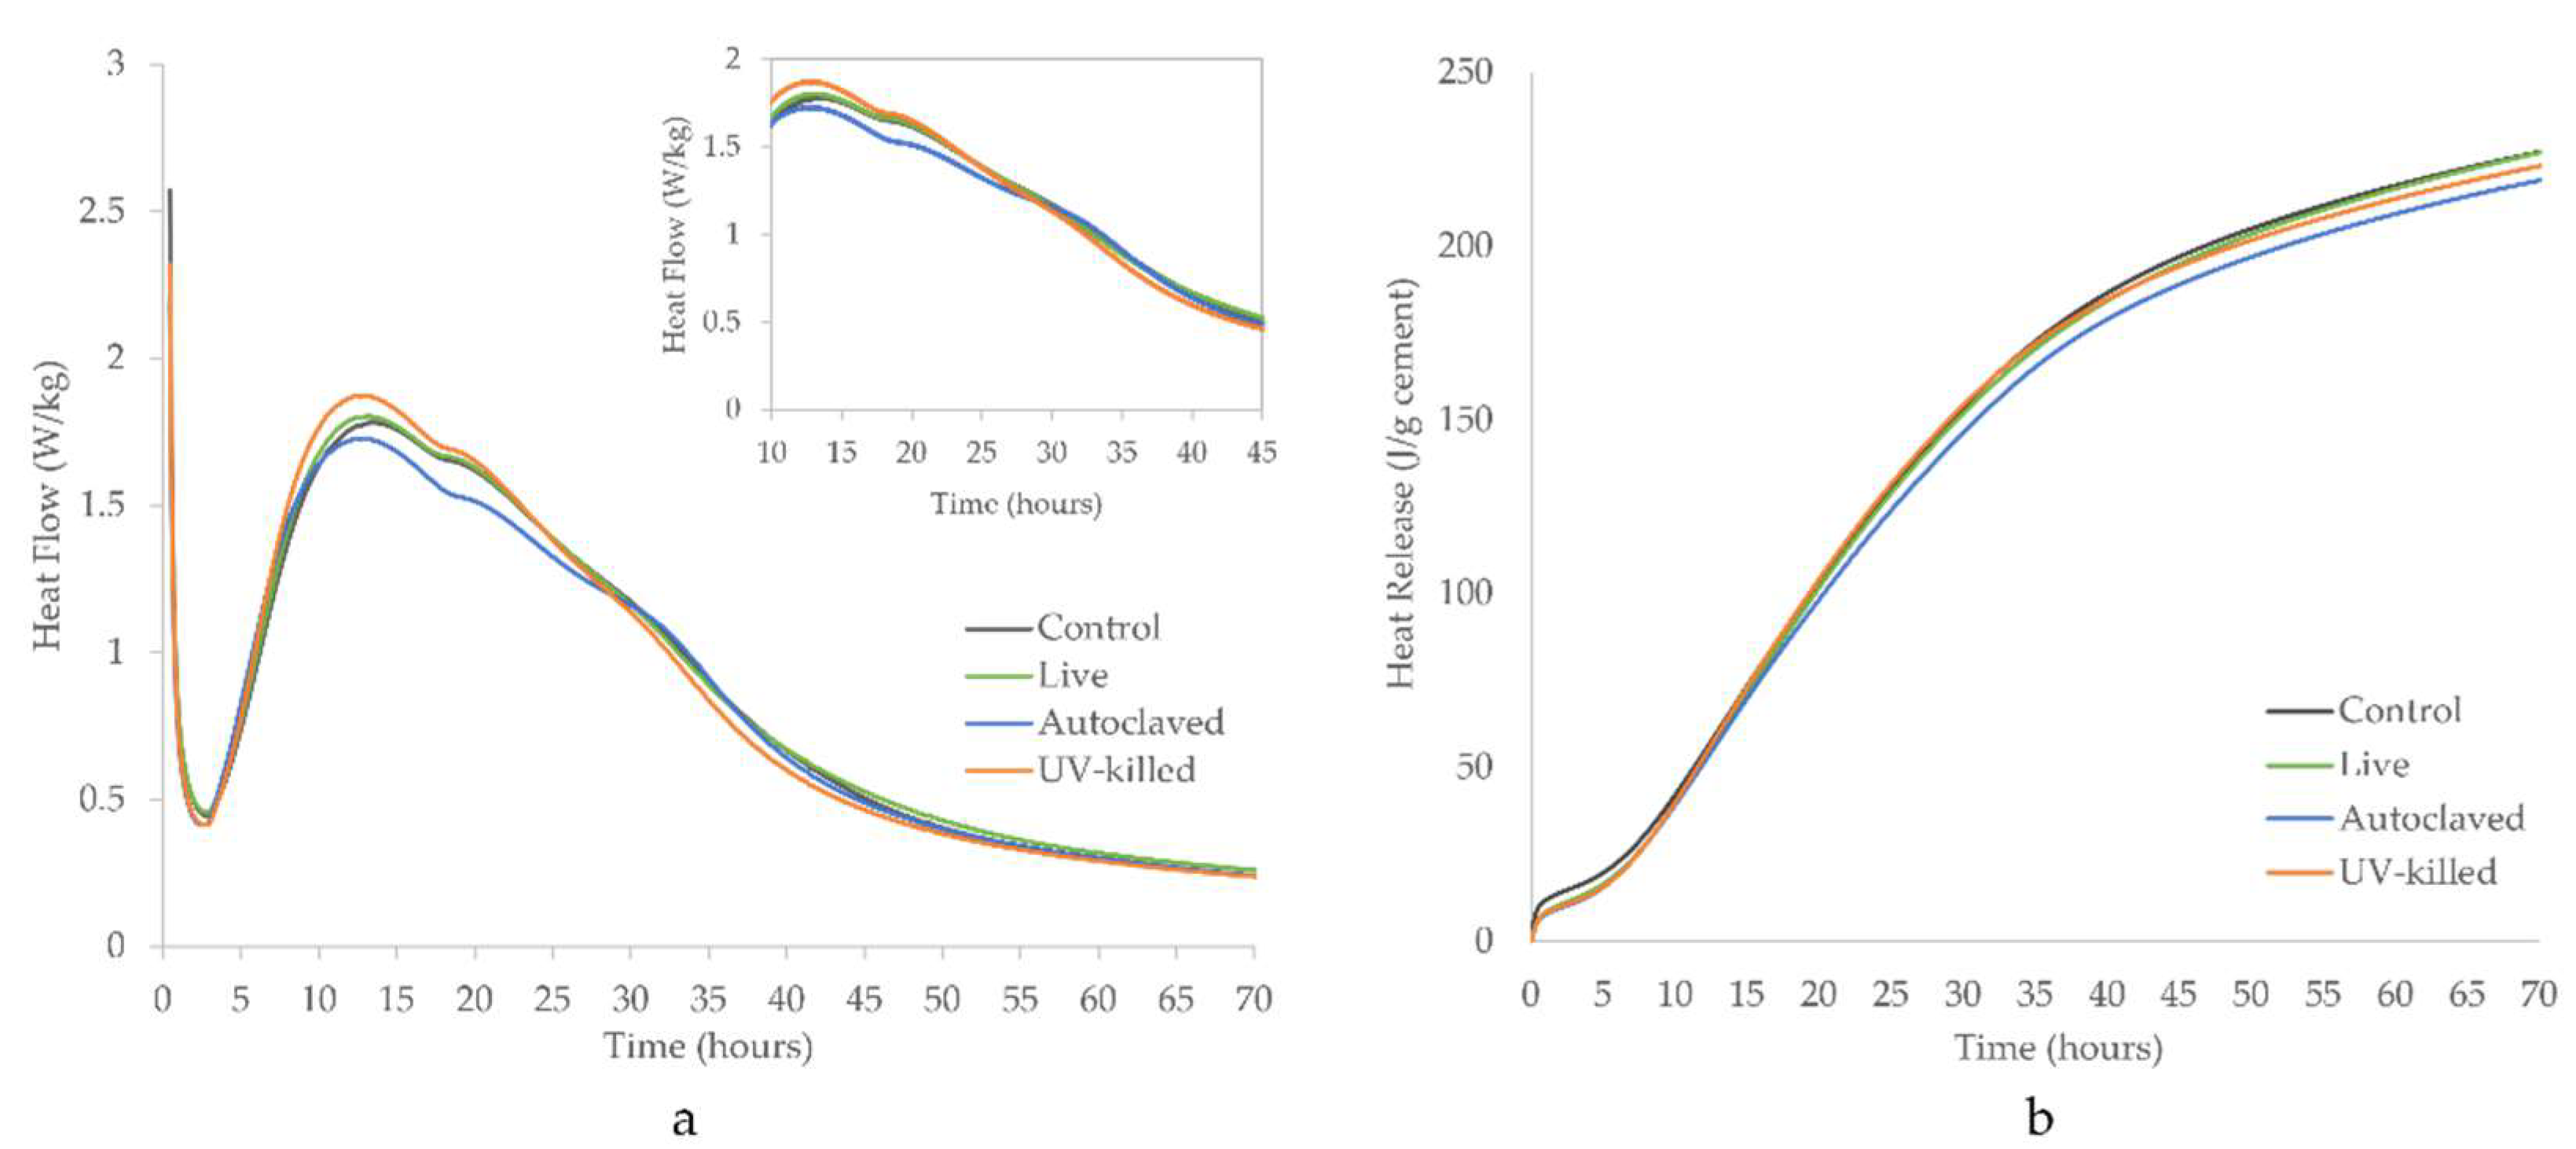
3.2. Hydration Rate
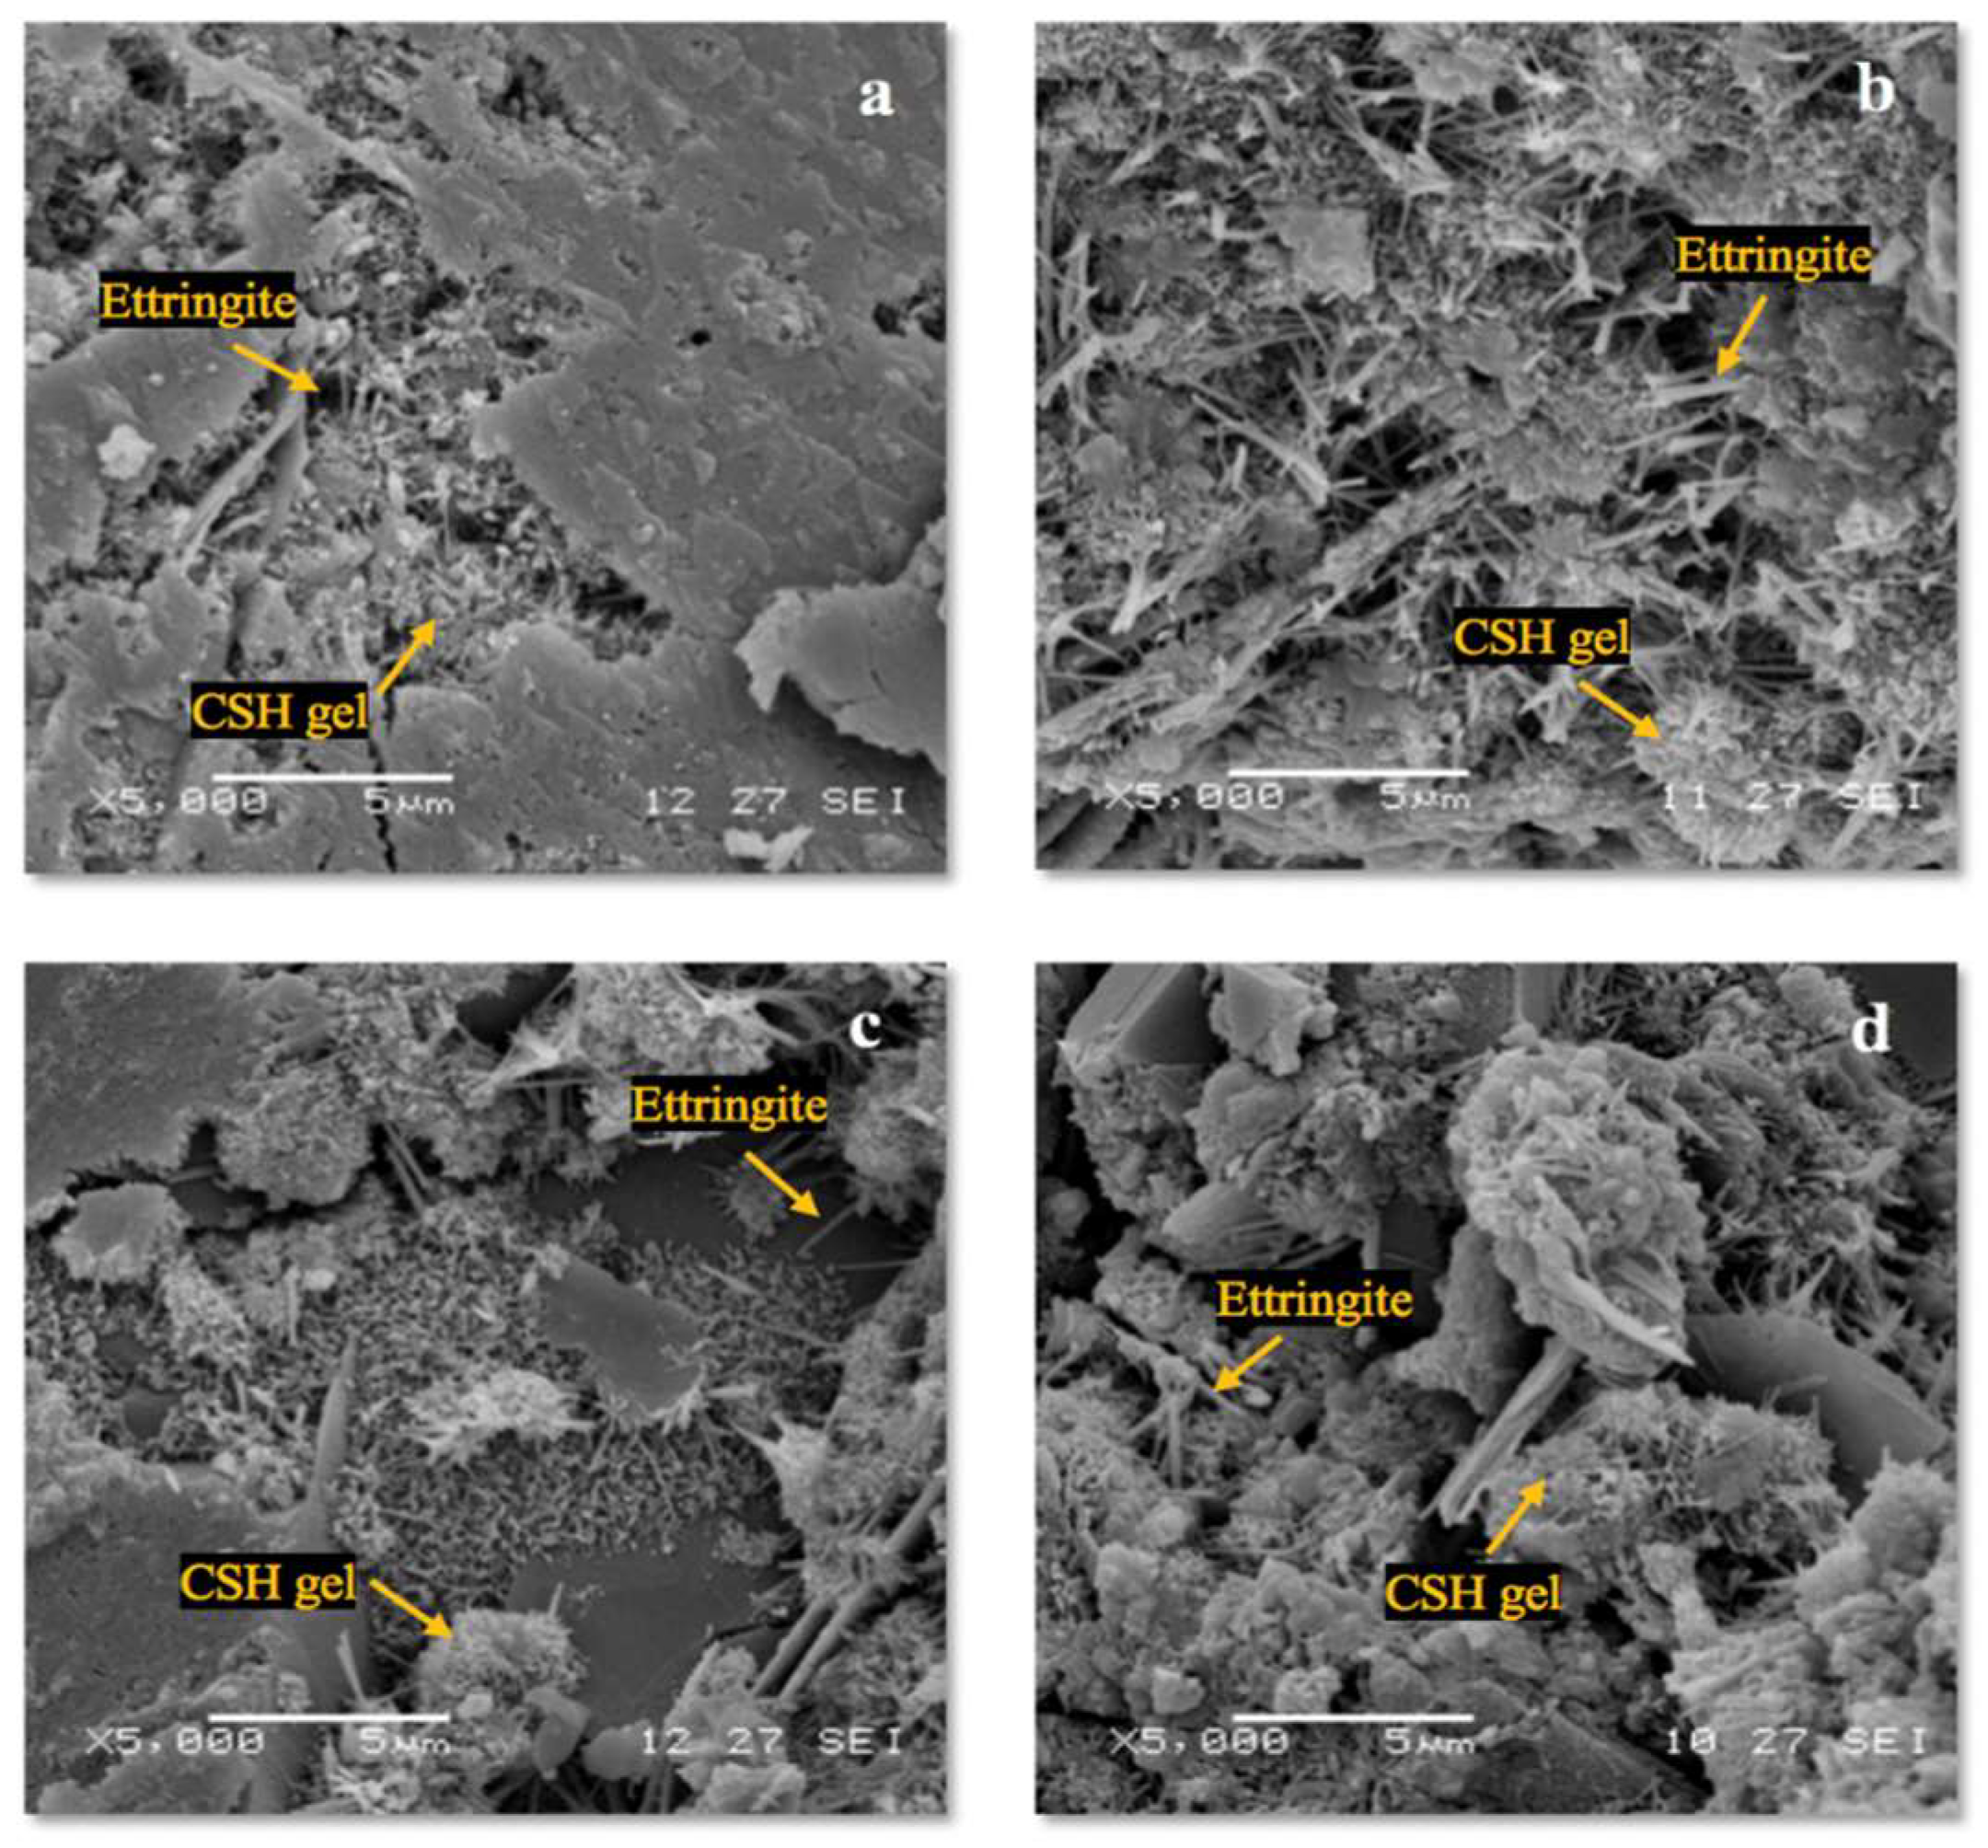
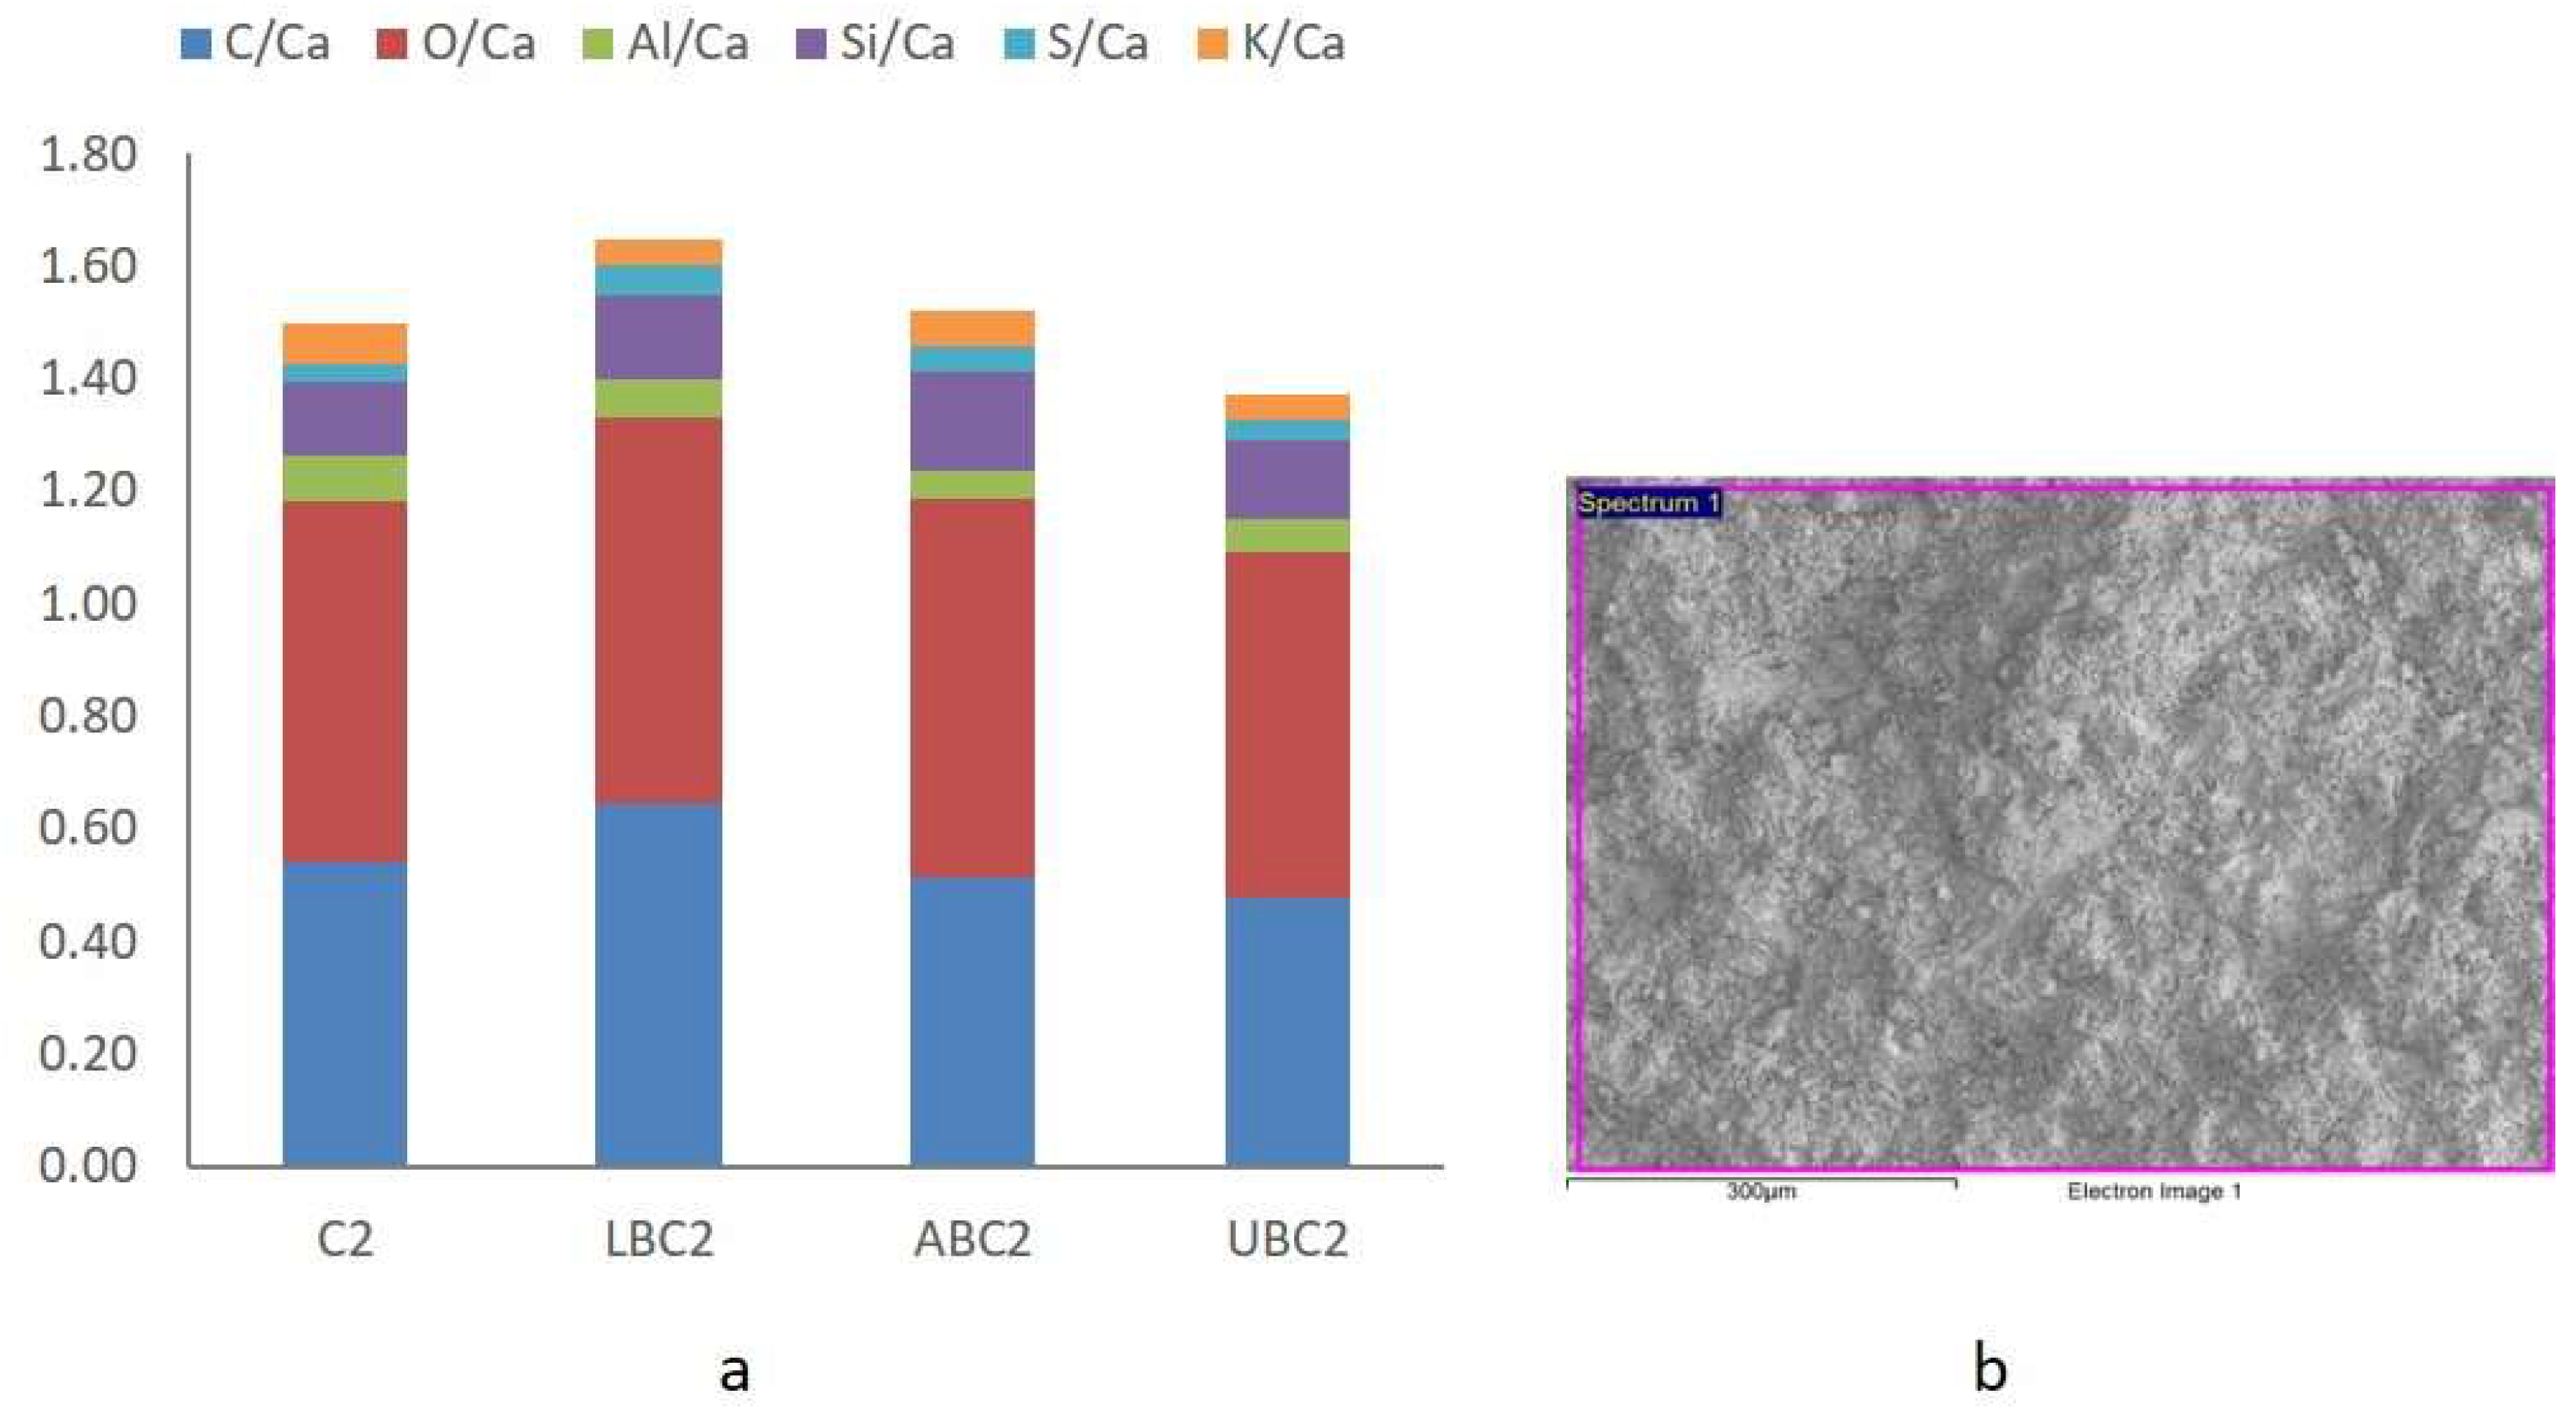
3.3. Microscopic Analysis
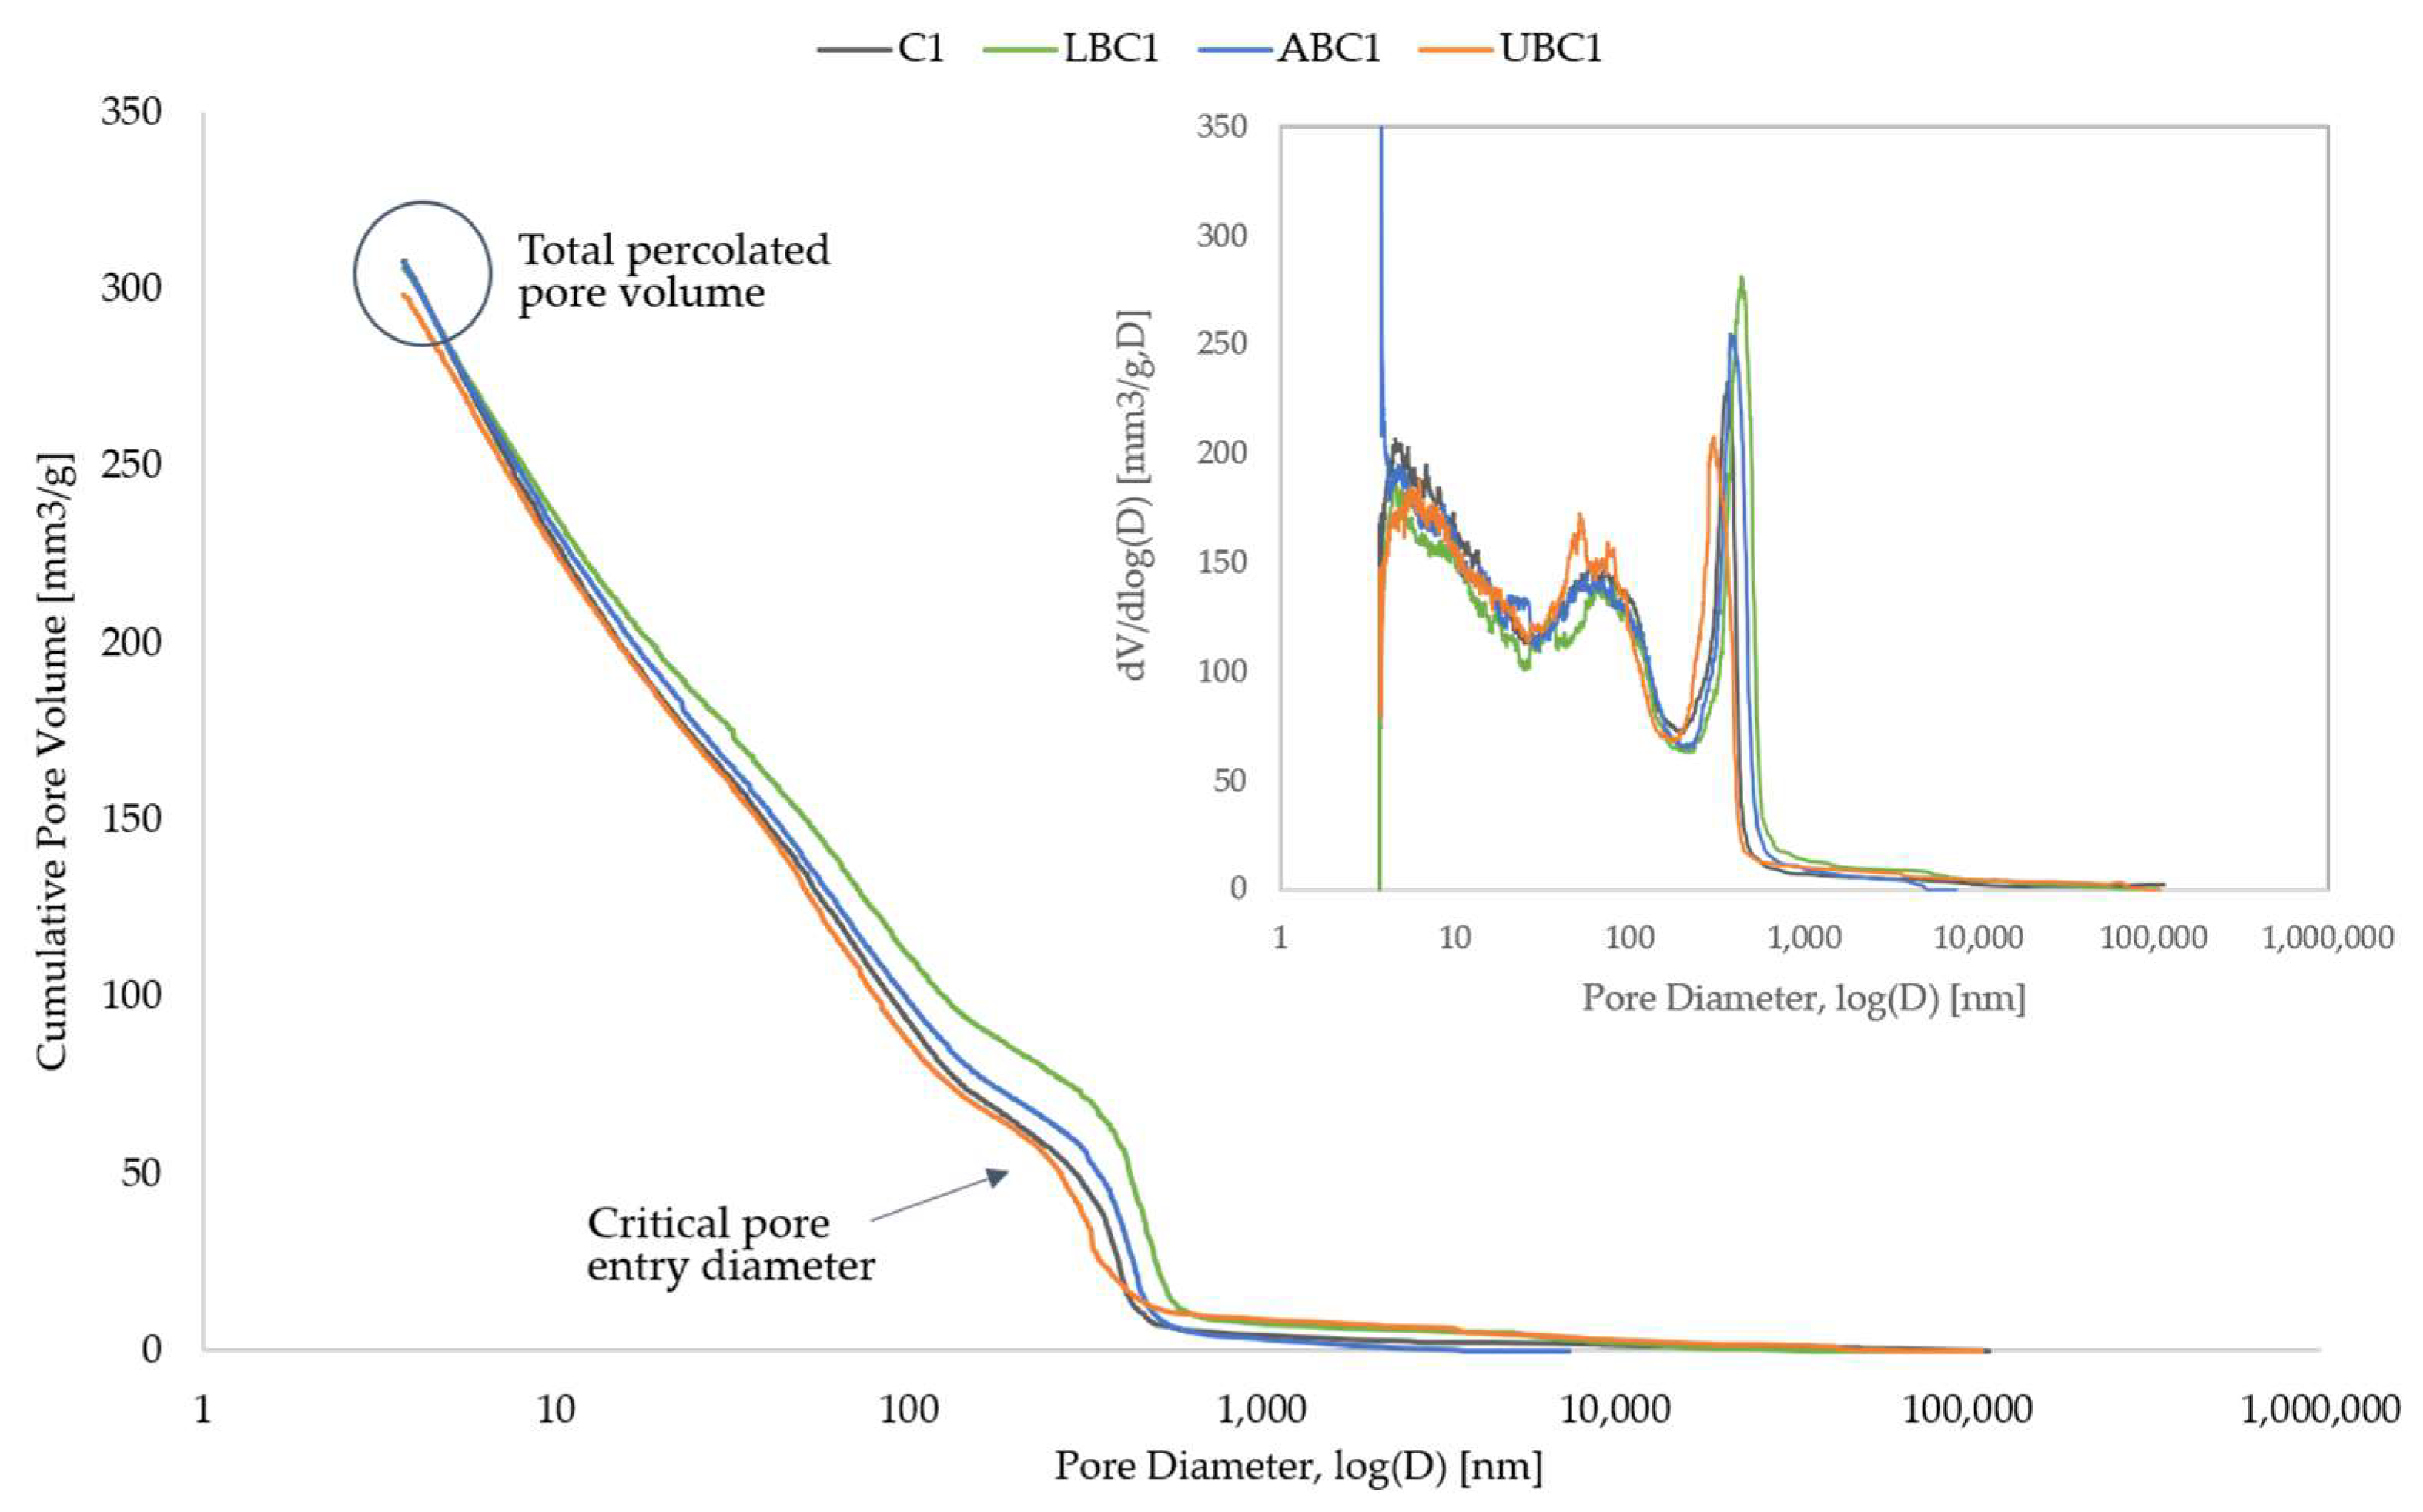
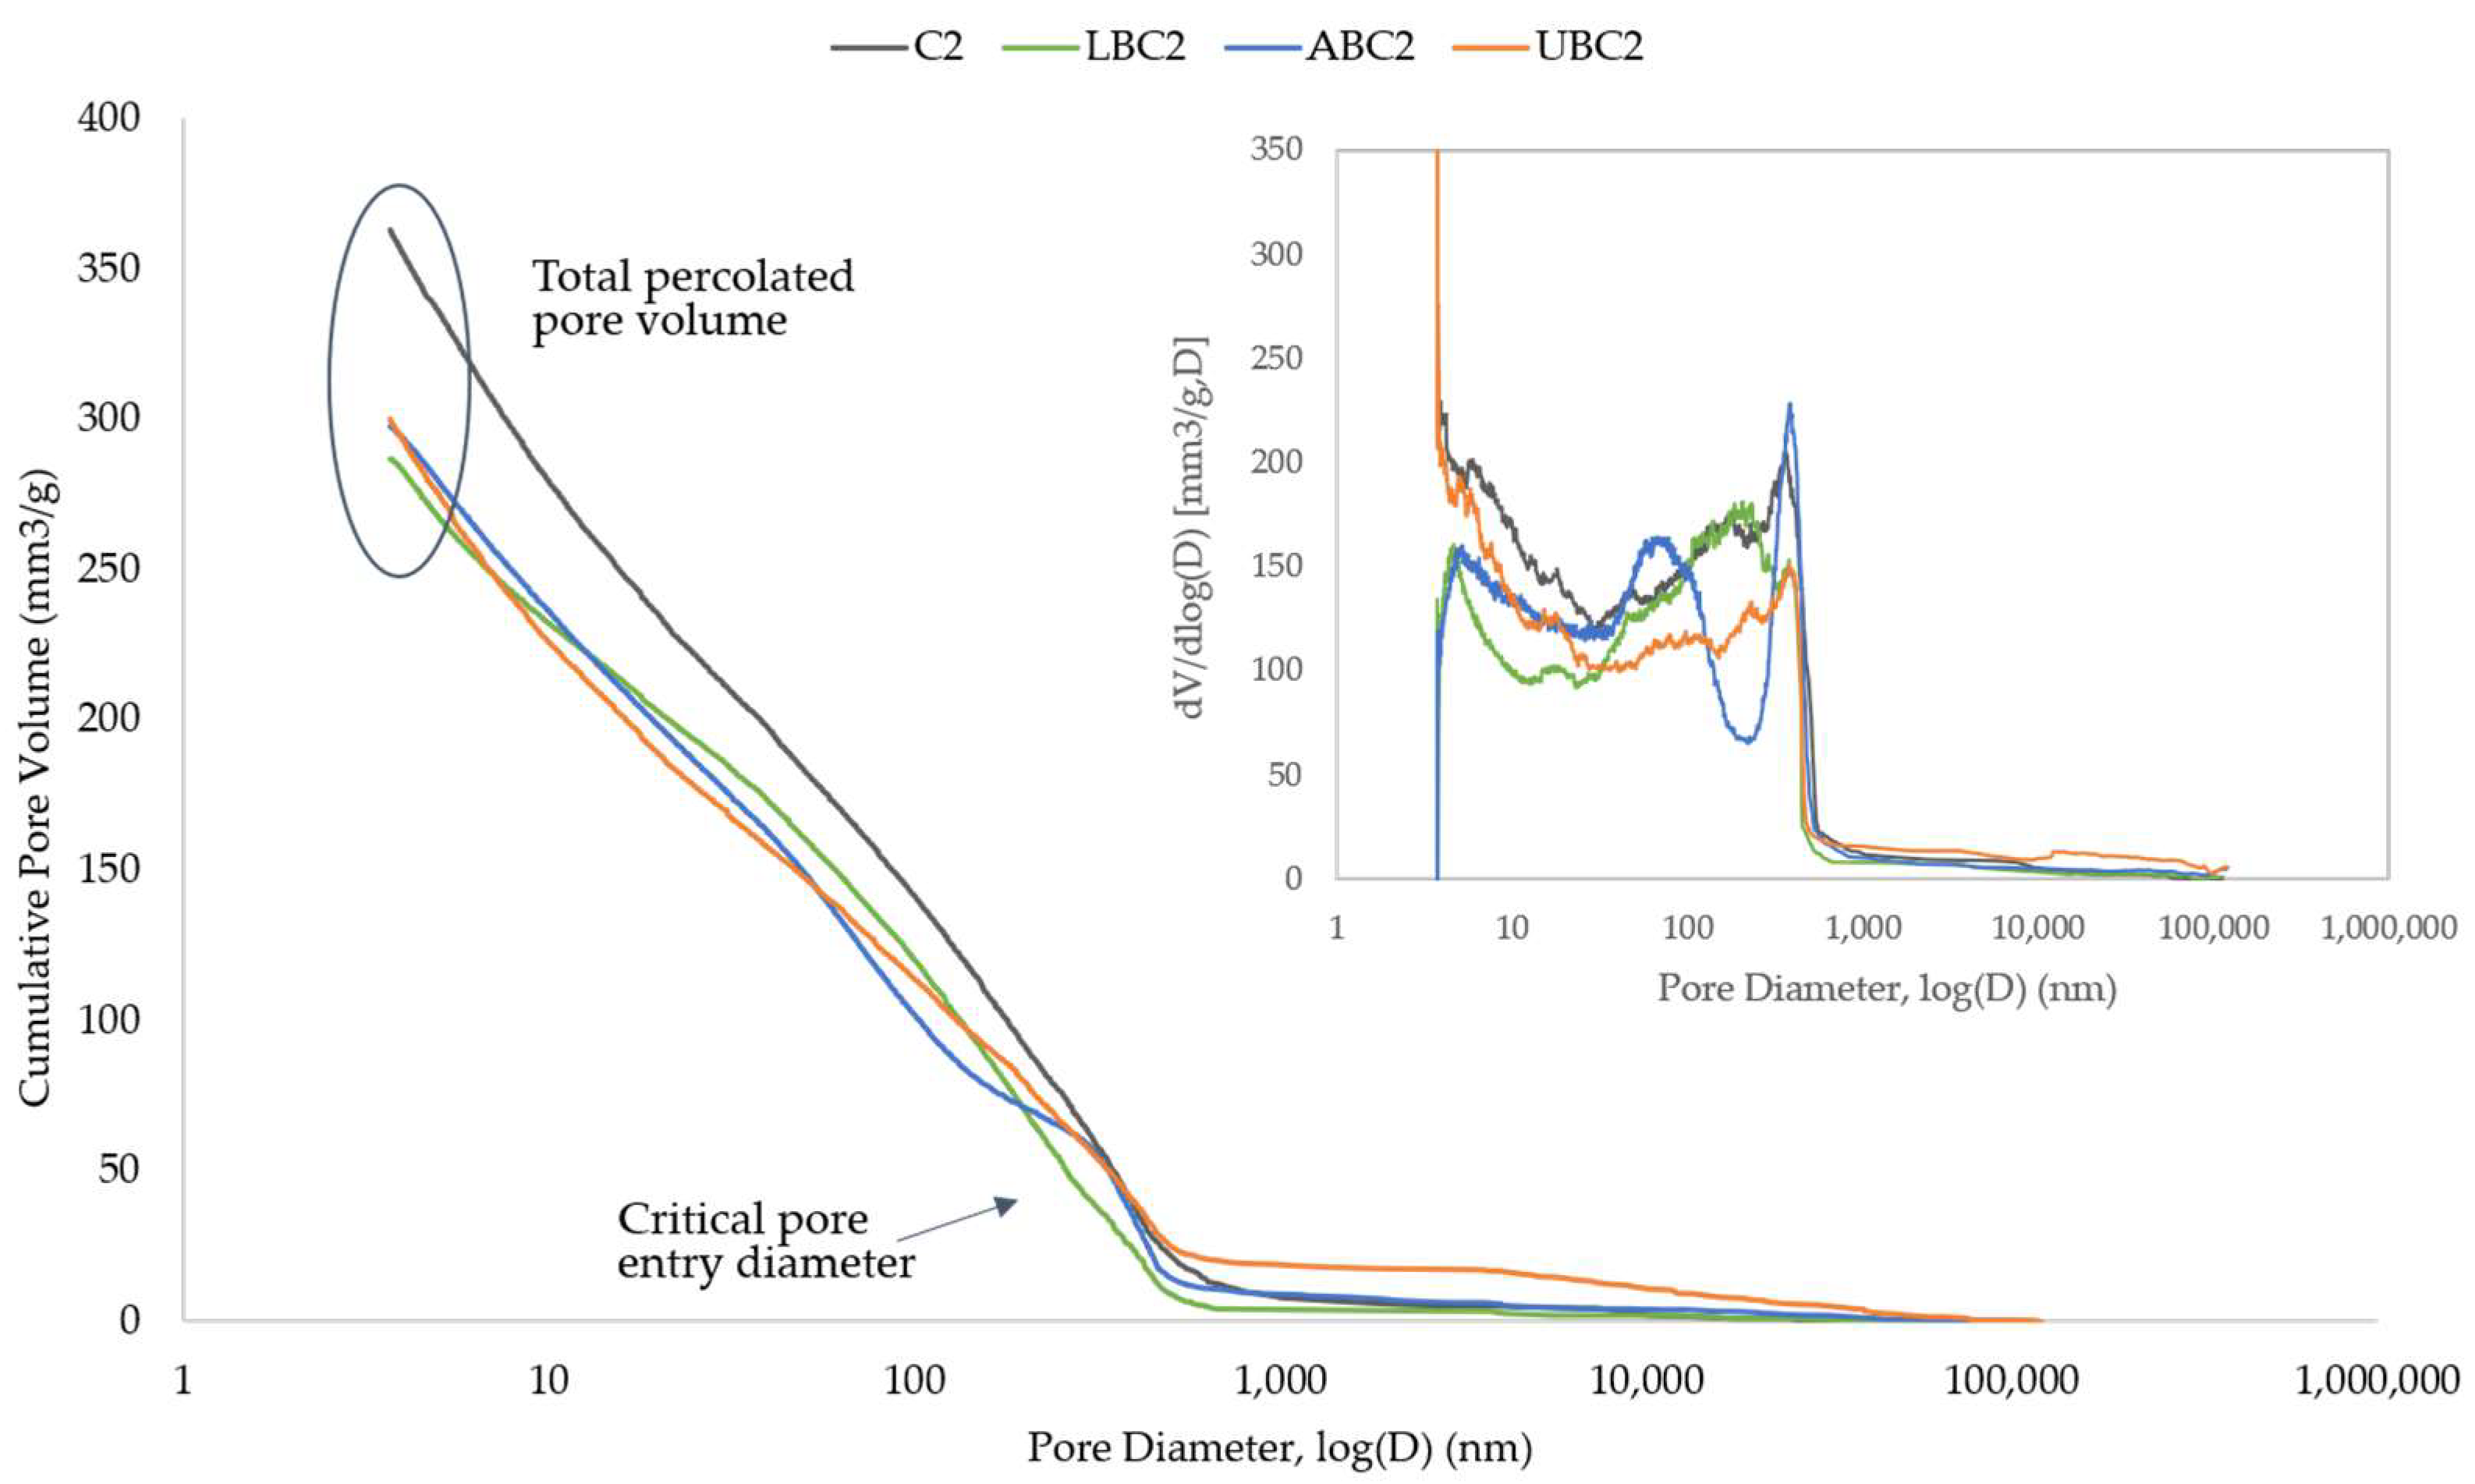
3.4. Porosity Analysis
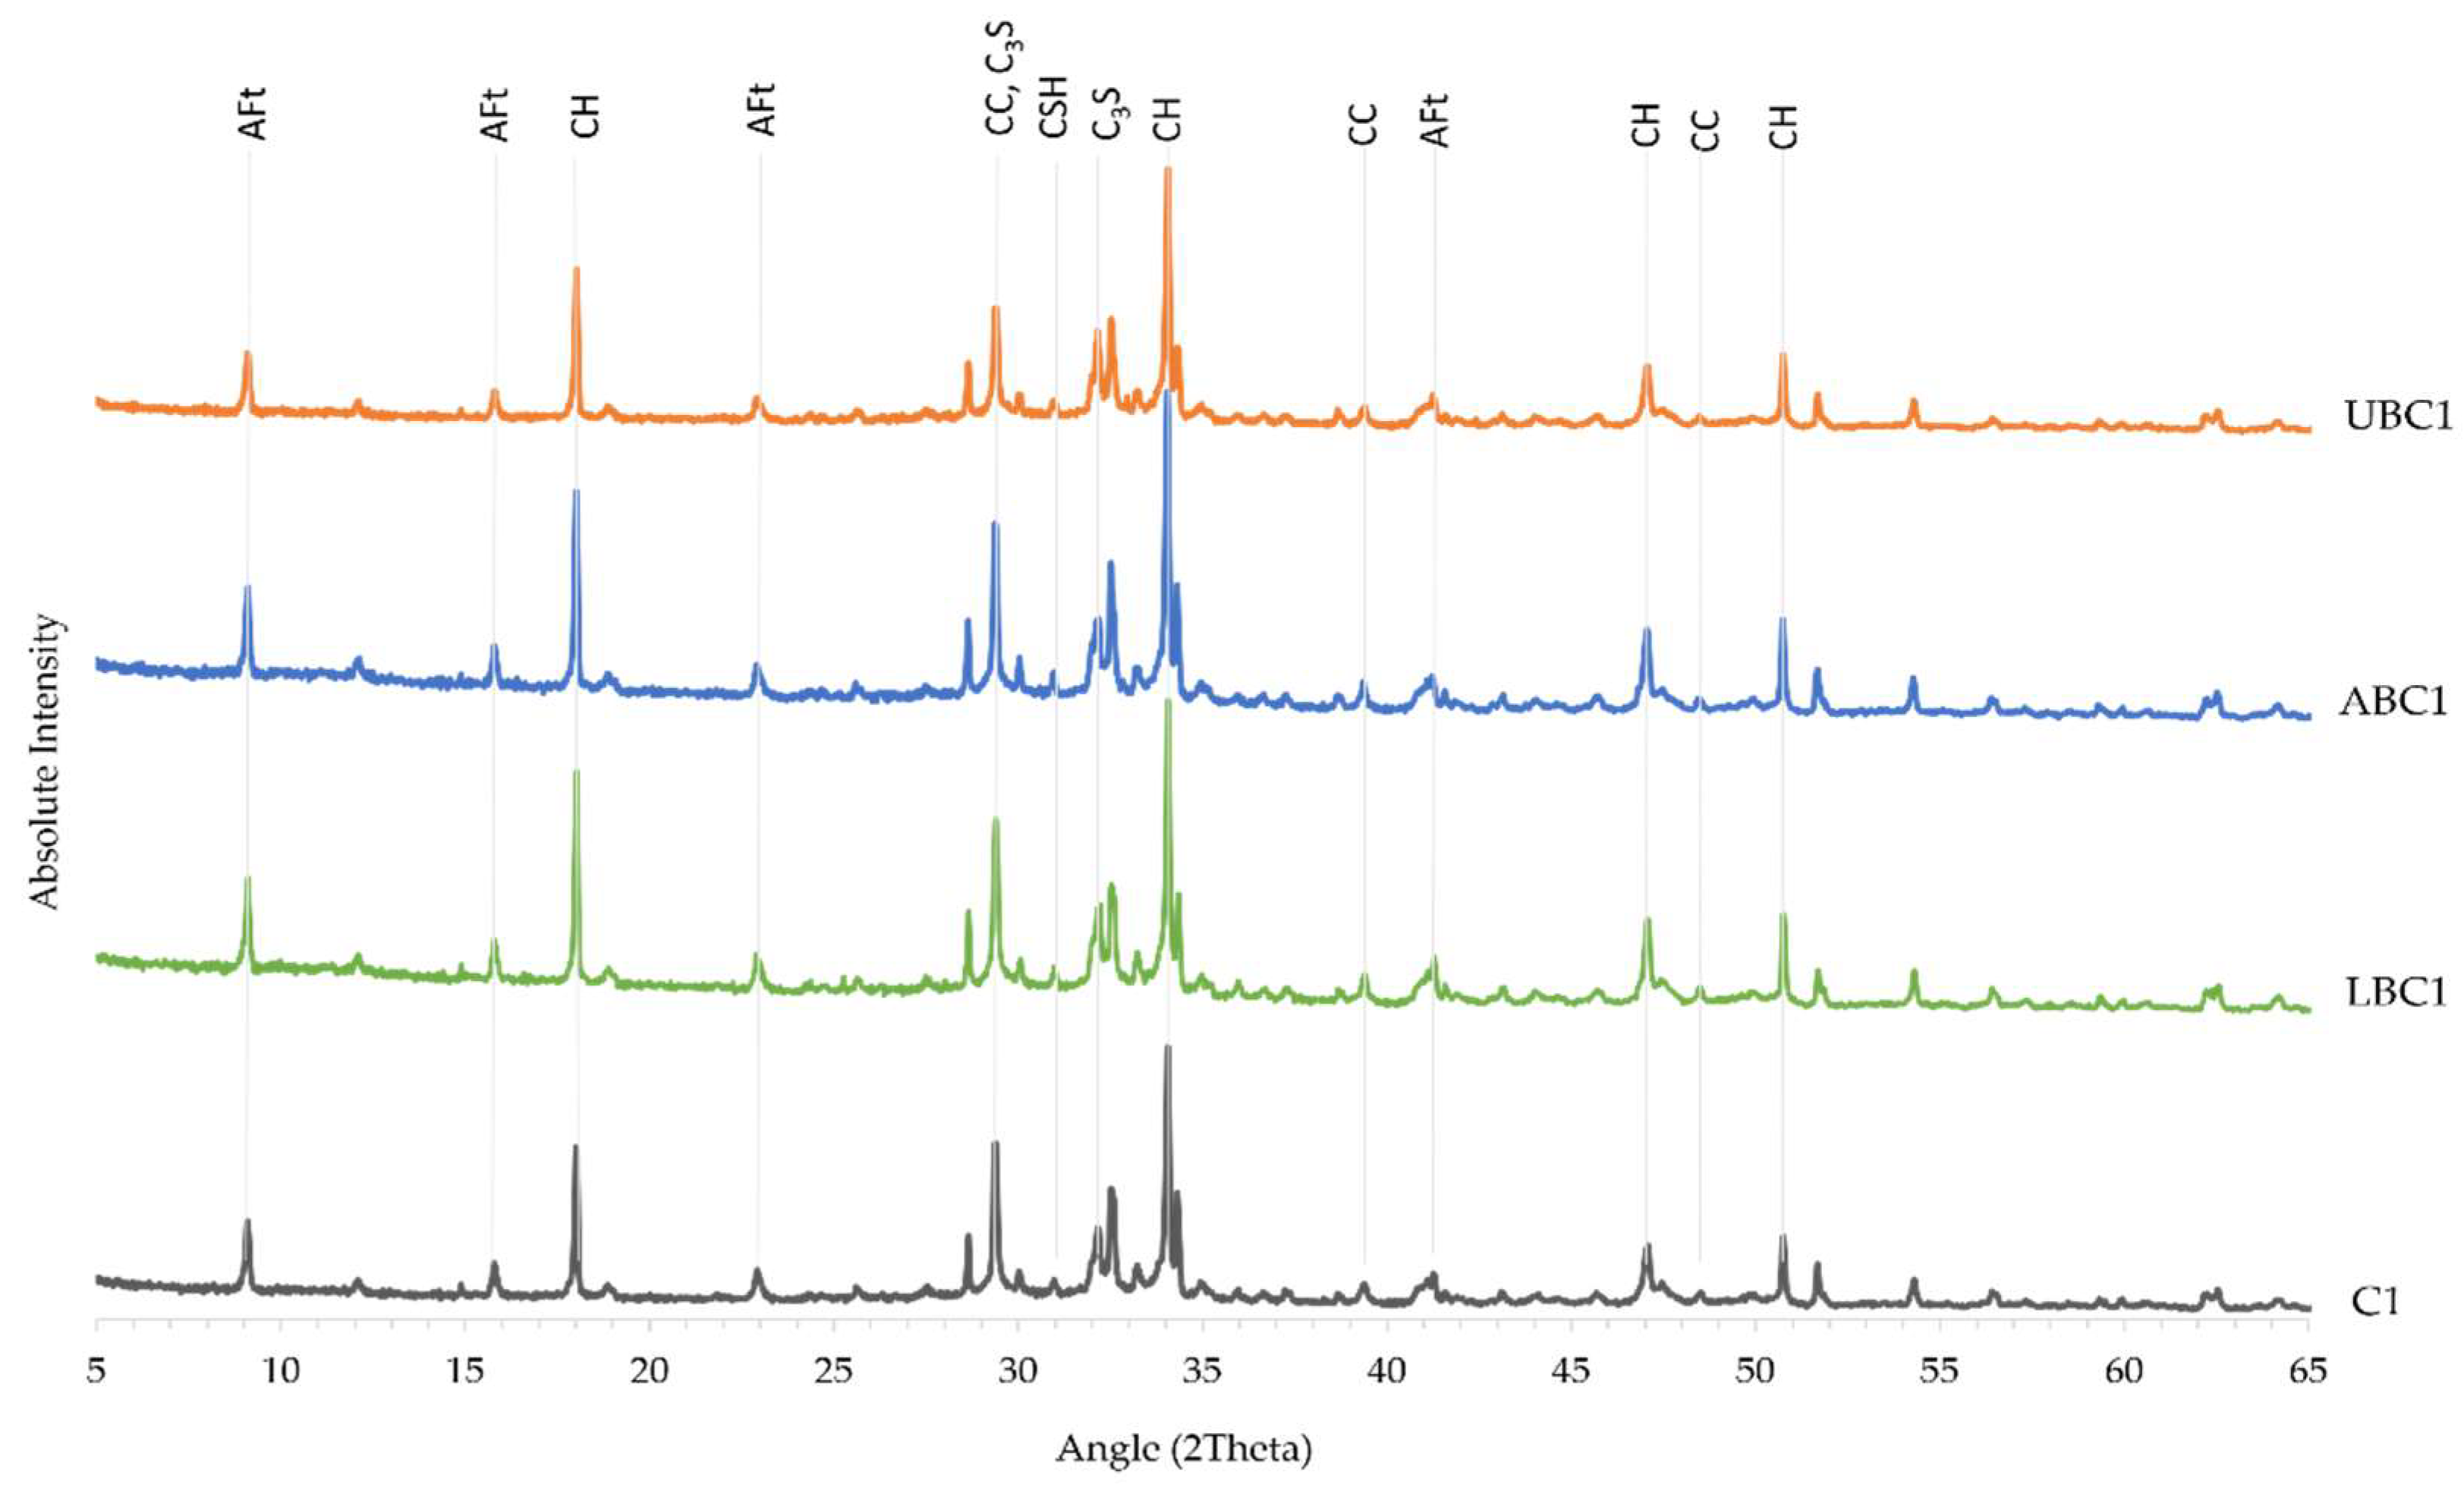
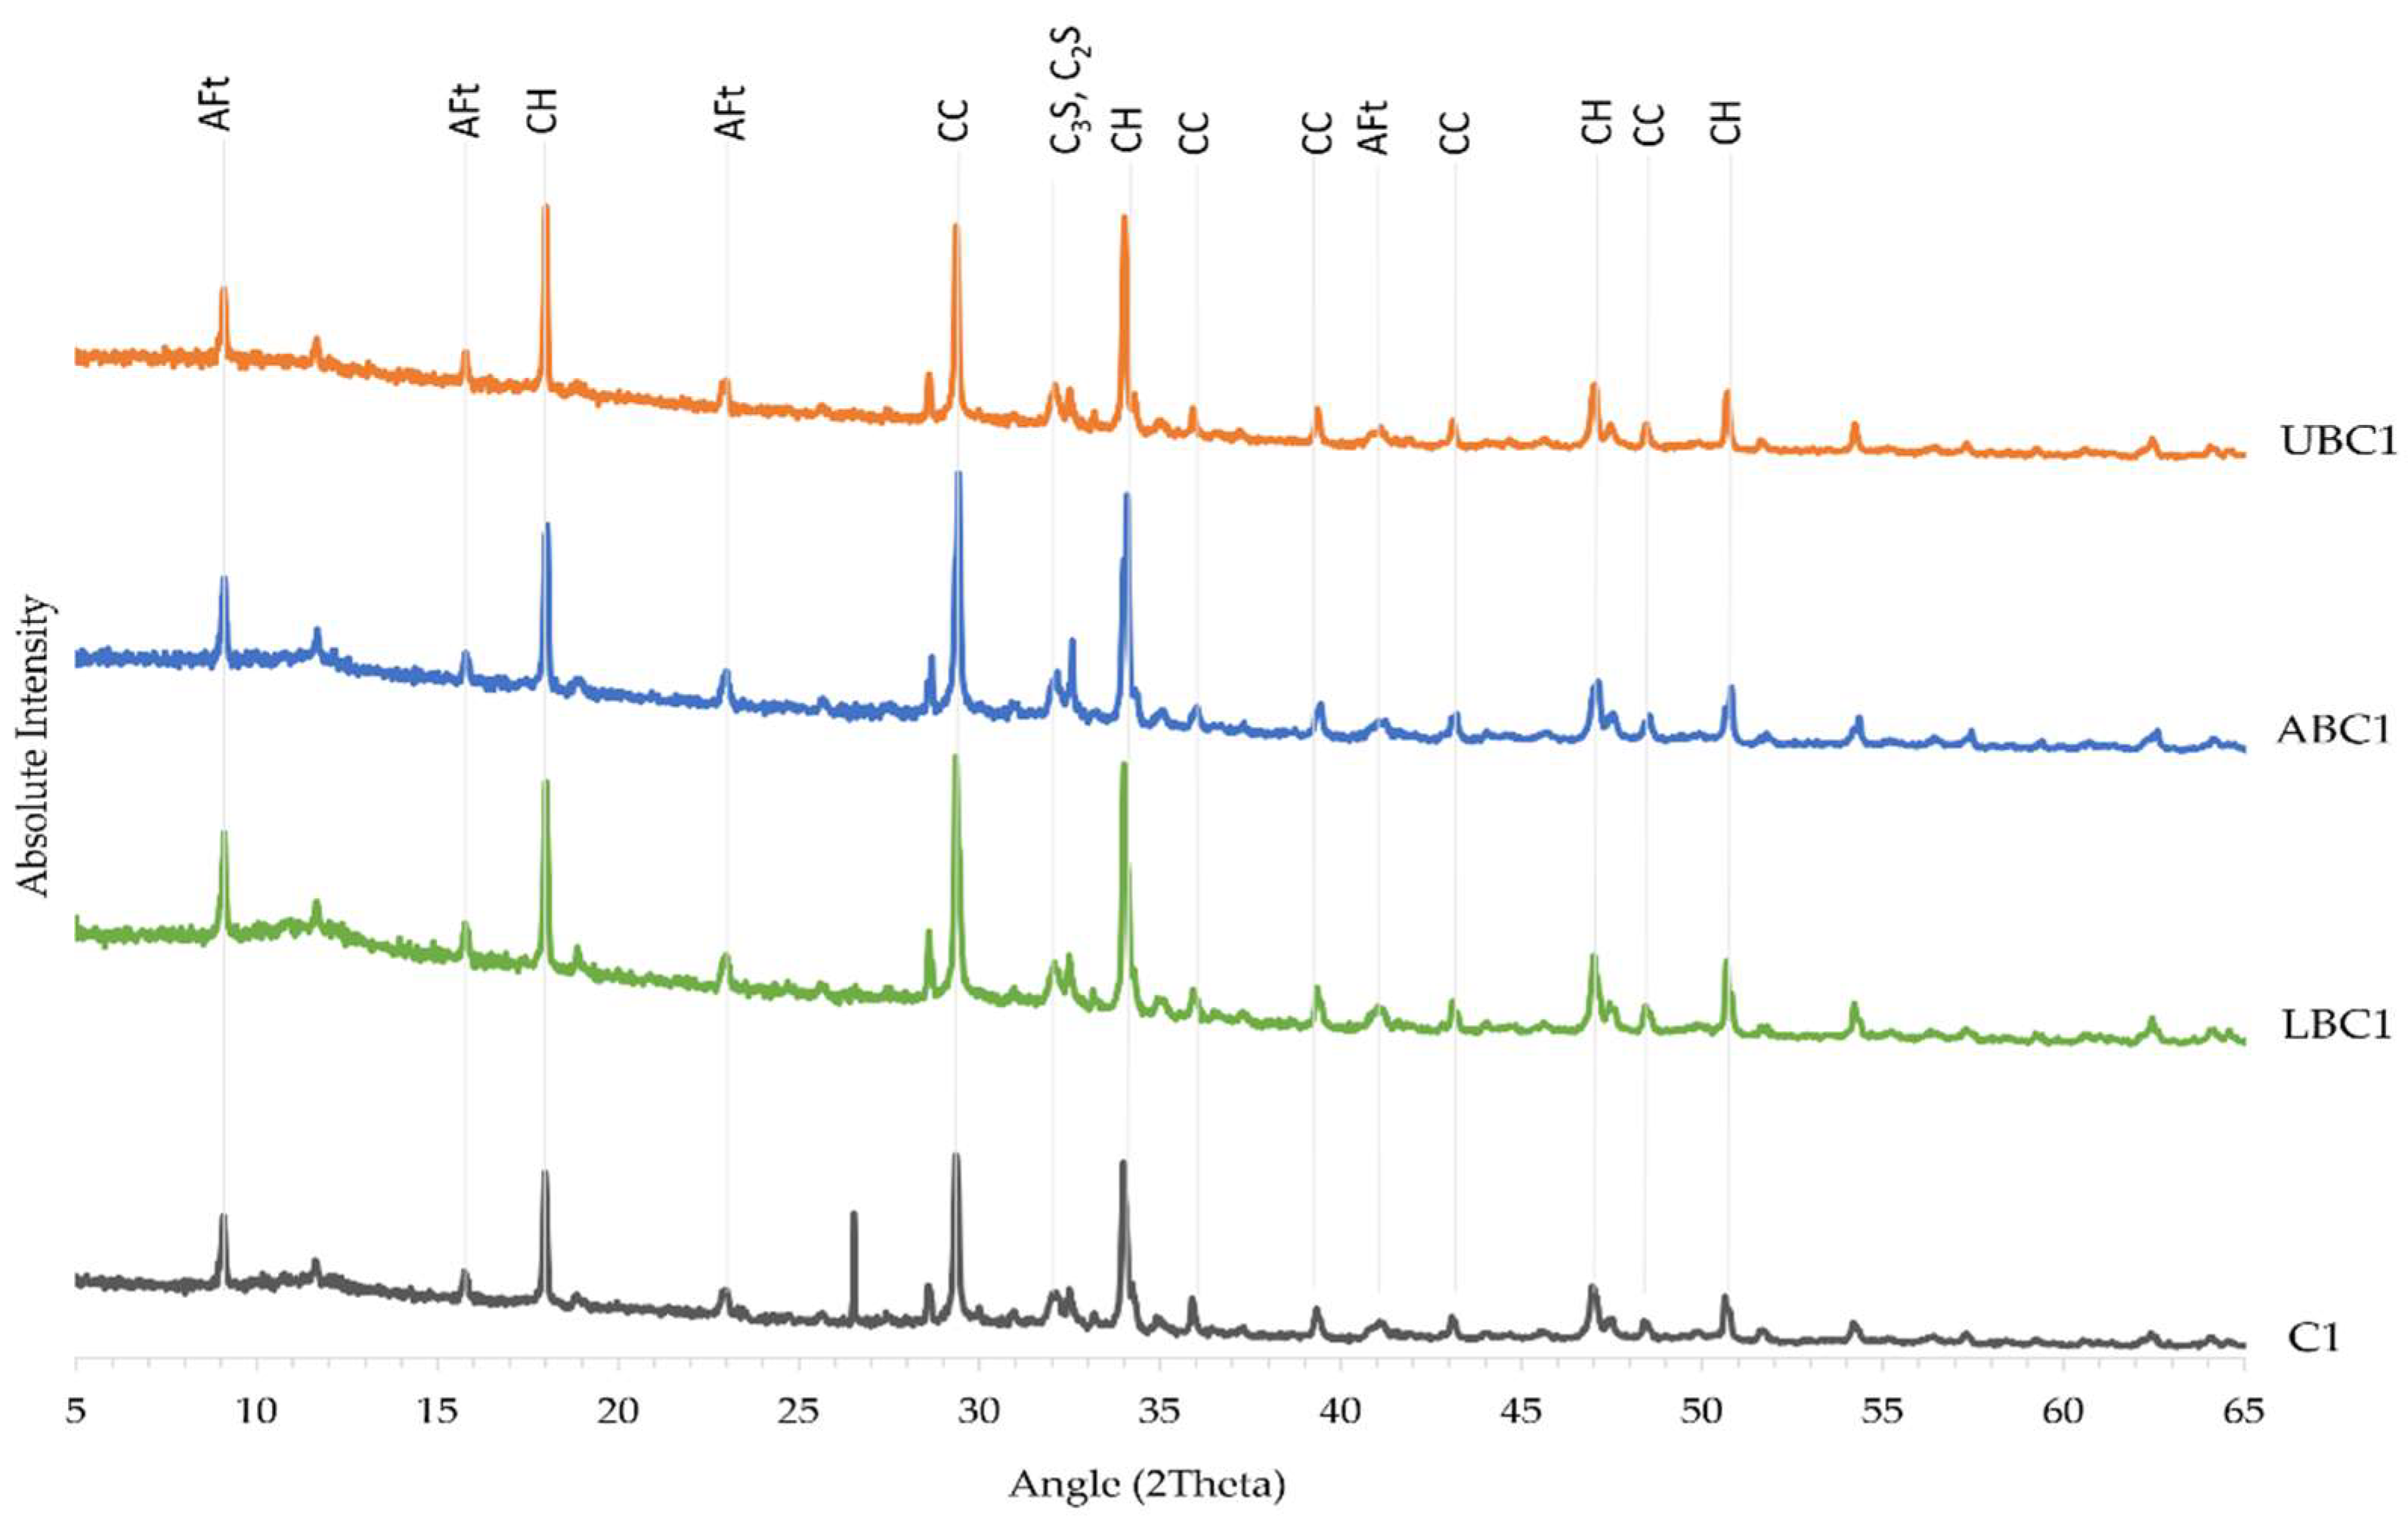
3.5. X-ray Diffraction Analysis
4. Discussion
4.1. Effect of Bacteria on the Strength of CEM I Specimens
4.1.1. Presence of Bacteria
4.1.2. Bacterial Status
4.2. Effect of Bacteria on the Strength of CEM II Specimens
4.2.1. Presence of Bacteria
4.2.2. Bacterial Status
5. Conclusions
Author Contributions
Funding
Data Availability Statement
Acknowledgments
Conflicts of Interest
References
- Habert, G.; Miller, S.A.; John, V.M.; Provis, J.L.; Favier, A.; Horvath, A.; Scrivener, K.L. Environmental impacts and decarbonization strategies in the cement and concrete industries. Nat. Rev. Earth Environ. 2020, 1, 559–573. [Google Scholar] [CrossRef]
- Benhelal, E.; Zahedi, G.; Shamsaei, E.; Bahadori, A. Global strategies and potentials to curb CO2 emissions in cement industry. J. Clean. Prod. 2013, 51, 142–161. [Google Scholar] [CrossRef]
- Leese, R.; Casey, D. MPA Cement Mineral Products Association Fact Sheet 18: Embodied CO2e of UK Cement, Additions and Cementitious Material. Fact Sheet 18. Available online: https://cement.mineralproducts.org/documents/Factsheet_18.pdf (accessed on 10 October 2021).
- Dhir, R.K.; Mccarthy, M.J.; Zhou, S.; Tittle, P.A.J. Role of cement content in specifications for concrete durability: Cement type influences. Proc. Inst. Civ. Eng. Struct. Build. 2004, 157, 113–127. [Google Scholar] [CrossRef]
- Concrete Society. Technical Report 74: Cementitious Materials: The Effect of Ggbs, Fly Ash, Silica Fume and Limestone Fines on the Properties of Concrete; Concrete Society: Camberley, UK, 2011. [Google Scholar]
- Su, Y.; Feng, J.; Jin, P.; Qian, C. Influence of bacterial self-healing agent on early age performance of cement-based materials. Constr. Build. Mater. 2019, 218, 224–234. [Google Scholar] [CrossRef]
- Chidara, R.; Nagulagama, R.; Yadav, S. Achievement of Early Compressive Strength in Concrete Using Sporosarcina pasteurii Bacteria as an Admixture. Adv. Civ. Eng. 2014, 2014, 435948. [Google Scholar]
- Hoffmann, T.D.; Reeksting, B.J.; Gebhard, S. Bacteria-induced mineral precipitation: A mechanistic review. Microbiology 2021, 167, 001049. [Google Scholar] [CrossRef]
- De Belie, N.; Wang, J.; Bundur, Z.B.; Paine, K. Bacteria-based concrete. In Eco-Efficient Repair and Rehabilitation of Concrete Infrastructures; Pacheco-Torgal, F., Melchers, R.E., Shi, X., De Belie, N., Tittelboom, K., Sáez, A., Eds.; Woodhead Publishing: Cambridge, UK, 2018; pp. 531–567. [Google Scholar]
- Justo-Reinoso, I.; Heath, A.; Gebhard, S.; Paine, K. Aerobic non-ureolytic bacteria-based self-healing cementitious composites: A comprehensive review. J. Build. Eng. 2021, 42, 102834. [Google Scholar] [CrossRef]
- Kim, H.; Son, H.M.; Seo, J.; Lee, H.K. Recent advances in microbial viability and self-healing performance in bacterial-based cementitious materials: A review. Constr. Build. Mater. 2021, 274, 122094. [Google Scholar] [CrossRef]
- Ghosh, P.; Mandal, S.; Pal, S.; Bandyopadhyaya, G.; Chattopadhyay, B.D. Development of bioconcrete material using an enrichment culture of novel thermophilic anaerobic bacteria. Indian J. Exp. Biol. 2006, 44, 336–339. [Google Scholar]
- Ghosh, P.; Mandal, S.; Chattopadhyay, B.D.; Pal, S. Use of microorganism to improve the strength of cement mortar. Cem. Concr. Res. 2005, 35, 1980–1983. [Google Scholar] [CrossRef]
- Jonkers, H.M.; Thijssen, A.; Muyzer, G.; Copuroglu, O.; Schlangen, E. Application of bacteria as self-healing agent for the development of sustainable concrete. Ecol. Eng. 2010, 36, 230–235. [Google Scholar] [CrossRef]
- Bundur, Z.B.; Amiri, A.; Ersan, Y.C.; Boon, N.; De Belie, N. Impact of air entraining admixtures on biogenic calcium carbonate precipitation and bacterial viability. Cem. Concr. Res. 2017, 98, 44–49. [Google Scholar] [CrossRef]
- Ramachandran, S.K.; Ramakrishnan, V.; Bang, S.S. Remediation of concrete using micro-organisms. ACI Mater. J. 2001, 98, 3–9. [Google Scholar]
- Pei, R.; Liu, J.; Wang, S.; Yang, M. Use of bacterial cell walls to improve the mechanical performance of concrete. Cem. Concr. Compos. 2013, 39, 122–130. [Google Scholar] [CrossRef]
- Chaurasia, L.; Bisht, V.; Singh, L.P.; Gupta, S. A novel approach of biomineralization for improving micro and macro-properties of concrete. Constr. Build. Mater. 2019, 195, 340–351. [Google Scholar] [CrossRef]
- Skevi, L.; Reeksting, B.J.; Hoffmann, T.D.; Gebhard, S.; Paine, K. Incorporation of bacteria in concrete: The case against MICP as a means for strength improvement. Cem. Concr. Compos. 2021, 120, 104056. [Google Scholar] [CrossRef]
- Park, S.J.; Park, Y.-M.; Chun, W.Y.; Kim, W.J.; Ghim, S.Y. Calcite-forming bacteria for compressive strength improvement in mortar. J. Microbiol. Biotechnol. 2010, 20, 782–788. [Google Scholar]
- Alonso, M.J.C.; Ortiz, C.E.L.; Perez, S.O.G.; Narayanasamy, R.; Fajardo San Miguel, G.d.J.; Hernández, H.H.; Balagurusamy, N. Improved strength and durability of concrete through metabolic activity of ureolytic bacteria. Environ. Sci. Pollut. Res. 2018, 25, 21451–21458. [Google Scholar] [CrossRef]
- BS EN 197-1:2011; Cement—Composition, Specifications and Conformity Criteria for Common Cements. British Standards Institution (BSI): London, UK, 2011.
- Calabria-Holley, J.; Paine, K.; Papatzani, S. Effects of nanosilica on the calcium silicate hydrates in Portland cement–fly ash systems. Adv. Cem. Res. 2015, 27, 187–200. [Google Scholar] [CrossRef] [Green Version]
- Chapin, F.S.; Matson, P.A.; Vitousek, P.M. Principles of Terrestrial Ecosystem Ecology, 2nd ed.; Springer: Berlin/Heidelberg, Germany, 2011; pp. 187–188. [Google Scholar]
- Liu, P.; Duan, W.; Wang, Q.; Li, X. The damage of outer membrane of Escherichia coli in the presence of TiO2 combined with UV light. Colloids Surf. B Biointerfaces 2010, 78, 171–176. [Google Scholar] [CrossRef]
- Miller, R.V.; Jeffrey, W.; Mitchell, D.; Elasri, M. Bacterial responses to ultraviolet light. ASM N. Am. Soc. Microbiol. 1999, 65, 535–541. [Google Scholar]
- Hossain, M.S.; Rahman, N.N.N.A.; Balakrishnan, V.; Rajion, Z.A.; Kadir, M.O.A. Mathematical modeling of Enterococcus faecalis, Escherichia coli, and Bacillus sphaericus inactivation in infectious clinical solid waste by using steam autoclaving and supercritical fluid carbon dioxide sterilization. Chem. Eng. J. 2015, 267, 221–234. [Google Scholar] [CrossRef]
- De Weerdt, K.; Plusquellec, G.; Belda Revert, A.; Geiker, M.R.; Lothenbach, B. Effect of carbonation on the pore solution of mortar. Cem. Concr. Res. 2019, 118, 38–56. [Google Scholar] [CrossRef]
- Thomas, J.J.; Jennings, H.M.; Chen, J.J. Influence of nucleation seeding on the hydration mechanisms of tricalcium silicate and cement. J. Phys. Chem. C 2009, 113, 4327–4334. [Google Scholar] [CrossRef] [Green Version]

| Sample | Cement (g) CEM I 52.5R or CEM II/A-L 32.5R | Water (mL) Tap Water | Sand (g) Standard Sand | Bacteria Concentration (cells/mL) Bacillus cohnii | Bacteria Status |
|---|---|---|---|---|---|
| C1 | 450 (CEM I) | 225 | 1350 | 0 | - |
| LBC1 | 450 (CEM I) | 225 | 1350 | 107 | Live |
| ABC1 | 450 (CEM I) | 225 | 1350 | 107 | Autoclave-killed |
| UBC1 | 450 (CEM I) | 225 | 1350 | 107 | UV-killed |
| C2 | 450 (CEM II) | 225 | 1350 | 0 | - |
| LBC2 | 450 (CEM II) | 225 | 1350 | 107 | Live |
| ABC2 | 450 (CEM II) | 225 | 1350 | 107 | Autoclave-killed |
| UBC2 | 450 (CEM II) | 225 | 1350 | 107 | UV-killed |
Publisher’s Note: MDPI stays neutral with regard to jurisdictional claims in published maps and institutional affiliations. |
© 2022 by the authors. Licensee MDPI, Basel, Switzerland. This article is an open access article distributed under the terms and conditions of the Creative Commons Attribution (CC BY) license (https://creativecommons.org/licenses/by/4.0/).
Share and Cite
Hui, T.Y.; Skevi, L.; Reeksting, B.; Gebhard, S.; Paine, K. The Effect of Bacteria on Early Age Strength of CEM I and CEM II Cementitious Composites. Sustainability 2022, 14, 773. https://doi.org/10.3390/su14020773
Hui TY, Skevi L, Reeksting B, Gebhard S, Paine K. The Effect of Bacteria on Early Age Strength of CEM I and CEM II Cementitious Composites. Sustainability. 2022; 14(2):773. https://doi.org/10.3390/su14020773
Chicago/Turabian StyleHui, Tsz Ying, Lorena Skevi, Bianca Reeksting, Susanne Gebhard, and Kevin Paine. 2022. "The Effect of Bacteria on Early Age Strength of CEM I and CEM II Cementitious Composites" Sustainability 14, no. 2: 773. https://doi.org/10.3390/su14020773
APA StyleHui, T. Y., Skevi, L., Reeksting, B., Gebhard, S., & Paine, K. (2022). The Effect of Bacteria on Early Age Strength of CEM I and CEM II Cementitious Composites. Sustainability, 14(2), 773. https://doi.org/10.3390/su14020773