
CO2 Emissions Forecast and Emissions Peak Analysis in Shanxi Province, China: An Application of the LEAP Model

Abstract
:1. Introduction
1.1. Motivation
1.2. Literature Review
1.3. Objectives
- (1)
- Forecast the CO2 emission trends in Shanxi Province from 2019 to 2035 under different scenarios and identify the conditions for achieving the goal of reaching the CO2 emissions peak in 2030.
- (2)
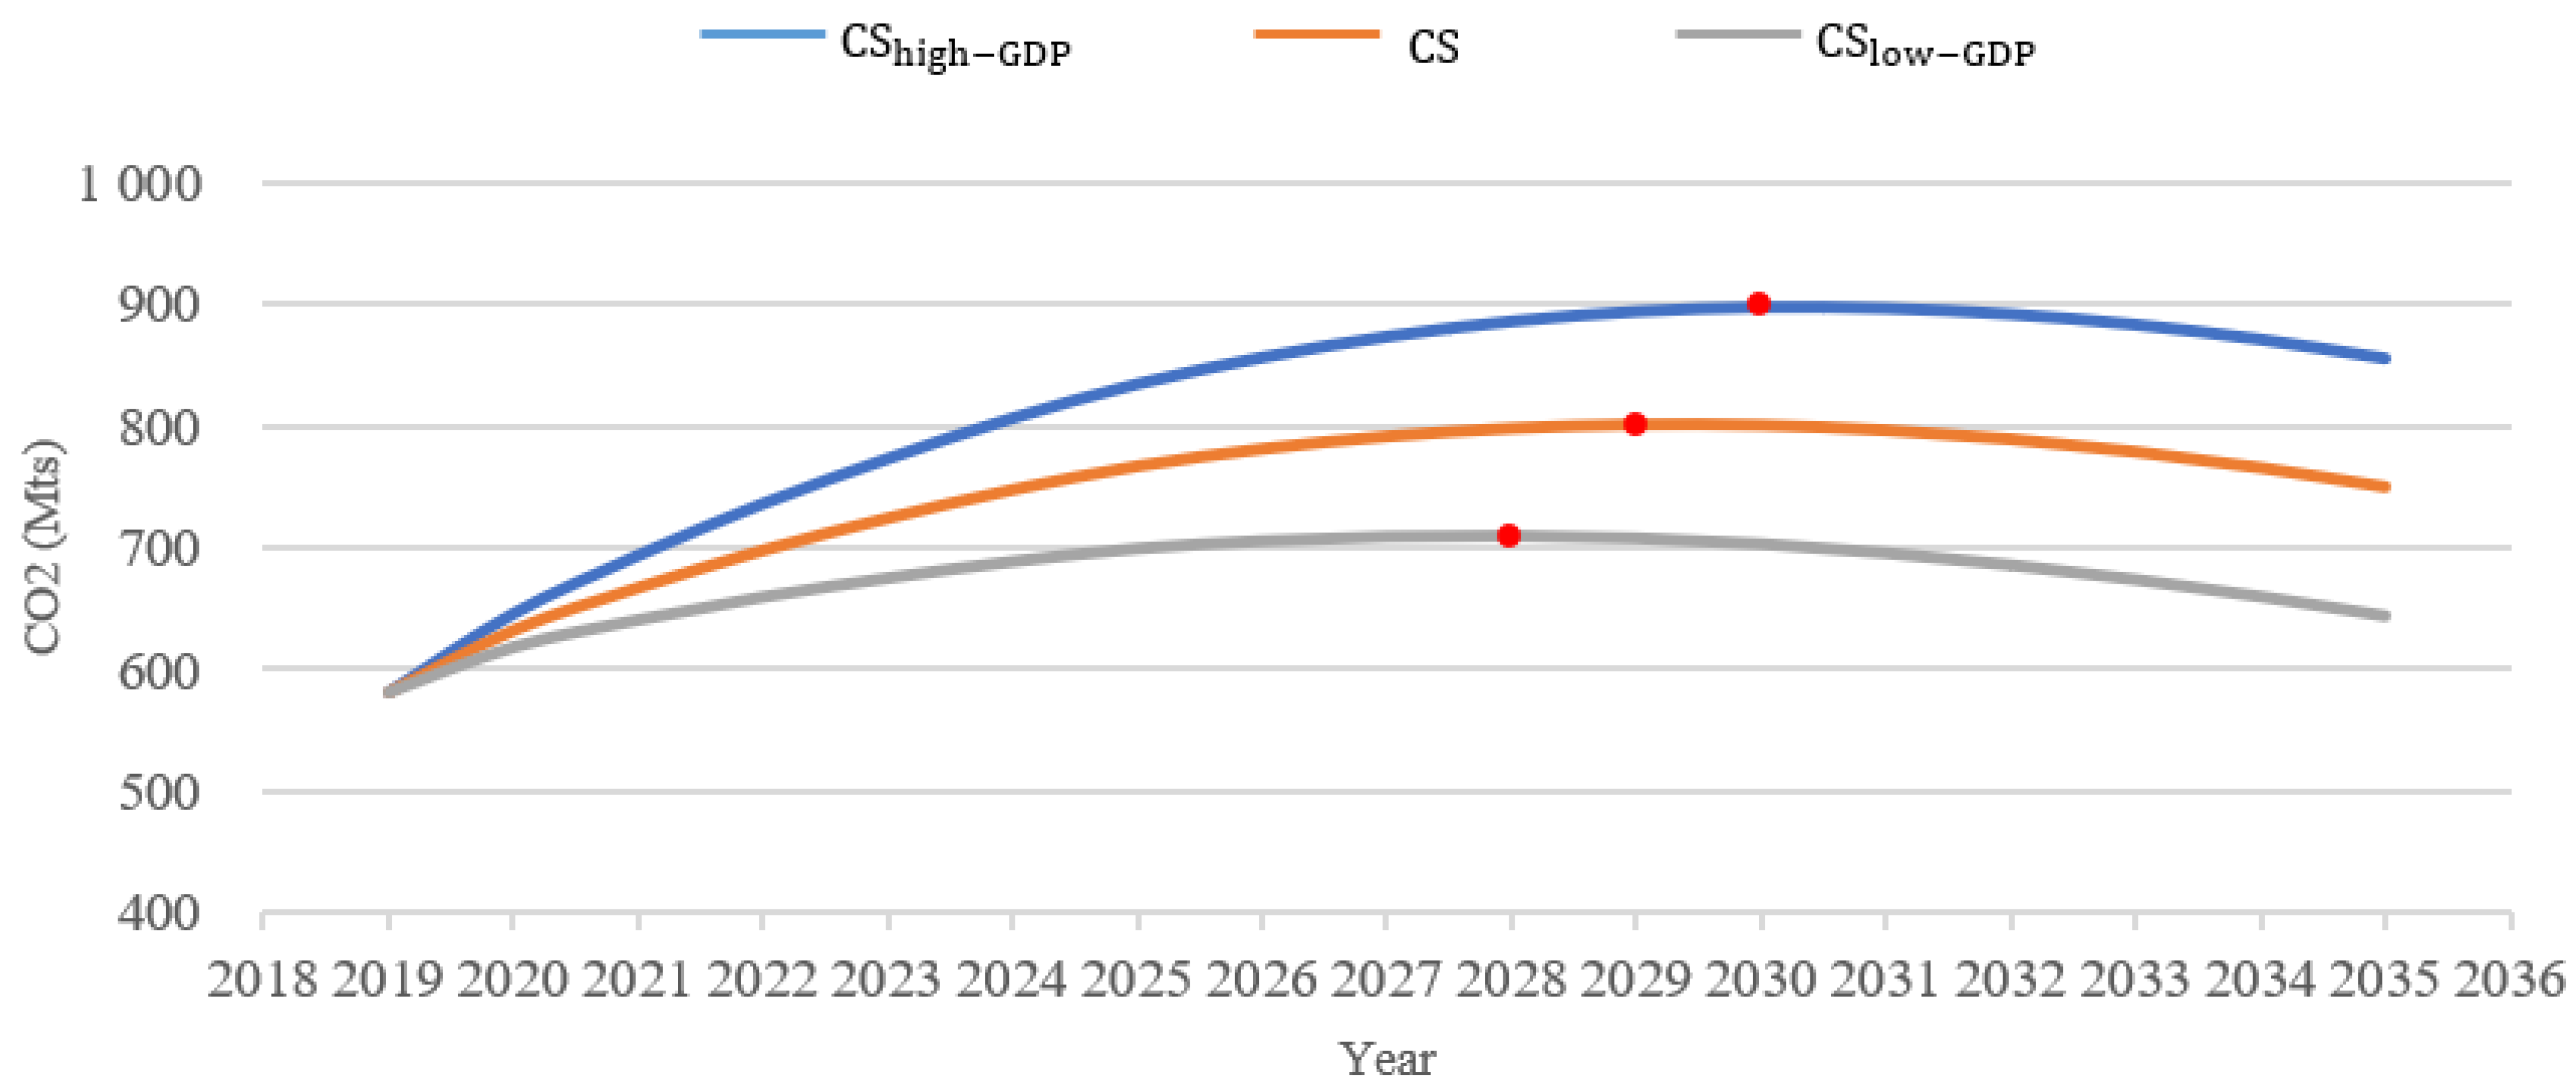
- Analyze the impacts of different levels of economic development, industrial structure, energy intensity, and power supply structure on the time of reaching CO2 emissions peak in Shanxi Province through sensitivity analysis.
- (3)
- Propose relevant proposals for emission reduction in Shanxi Province based on the results of the analysis described in (1) and (2).
2. Proposed Model
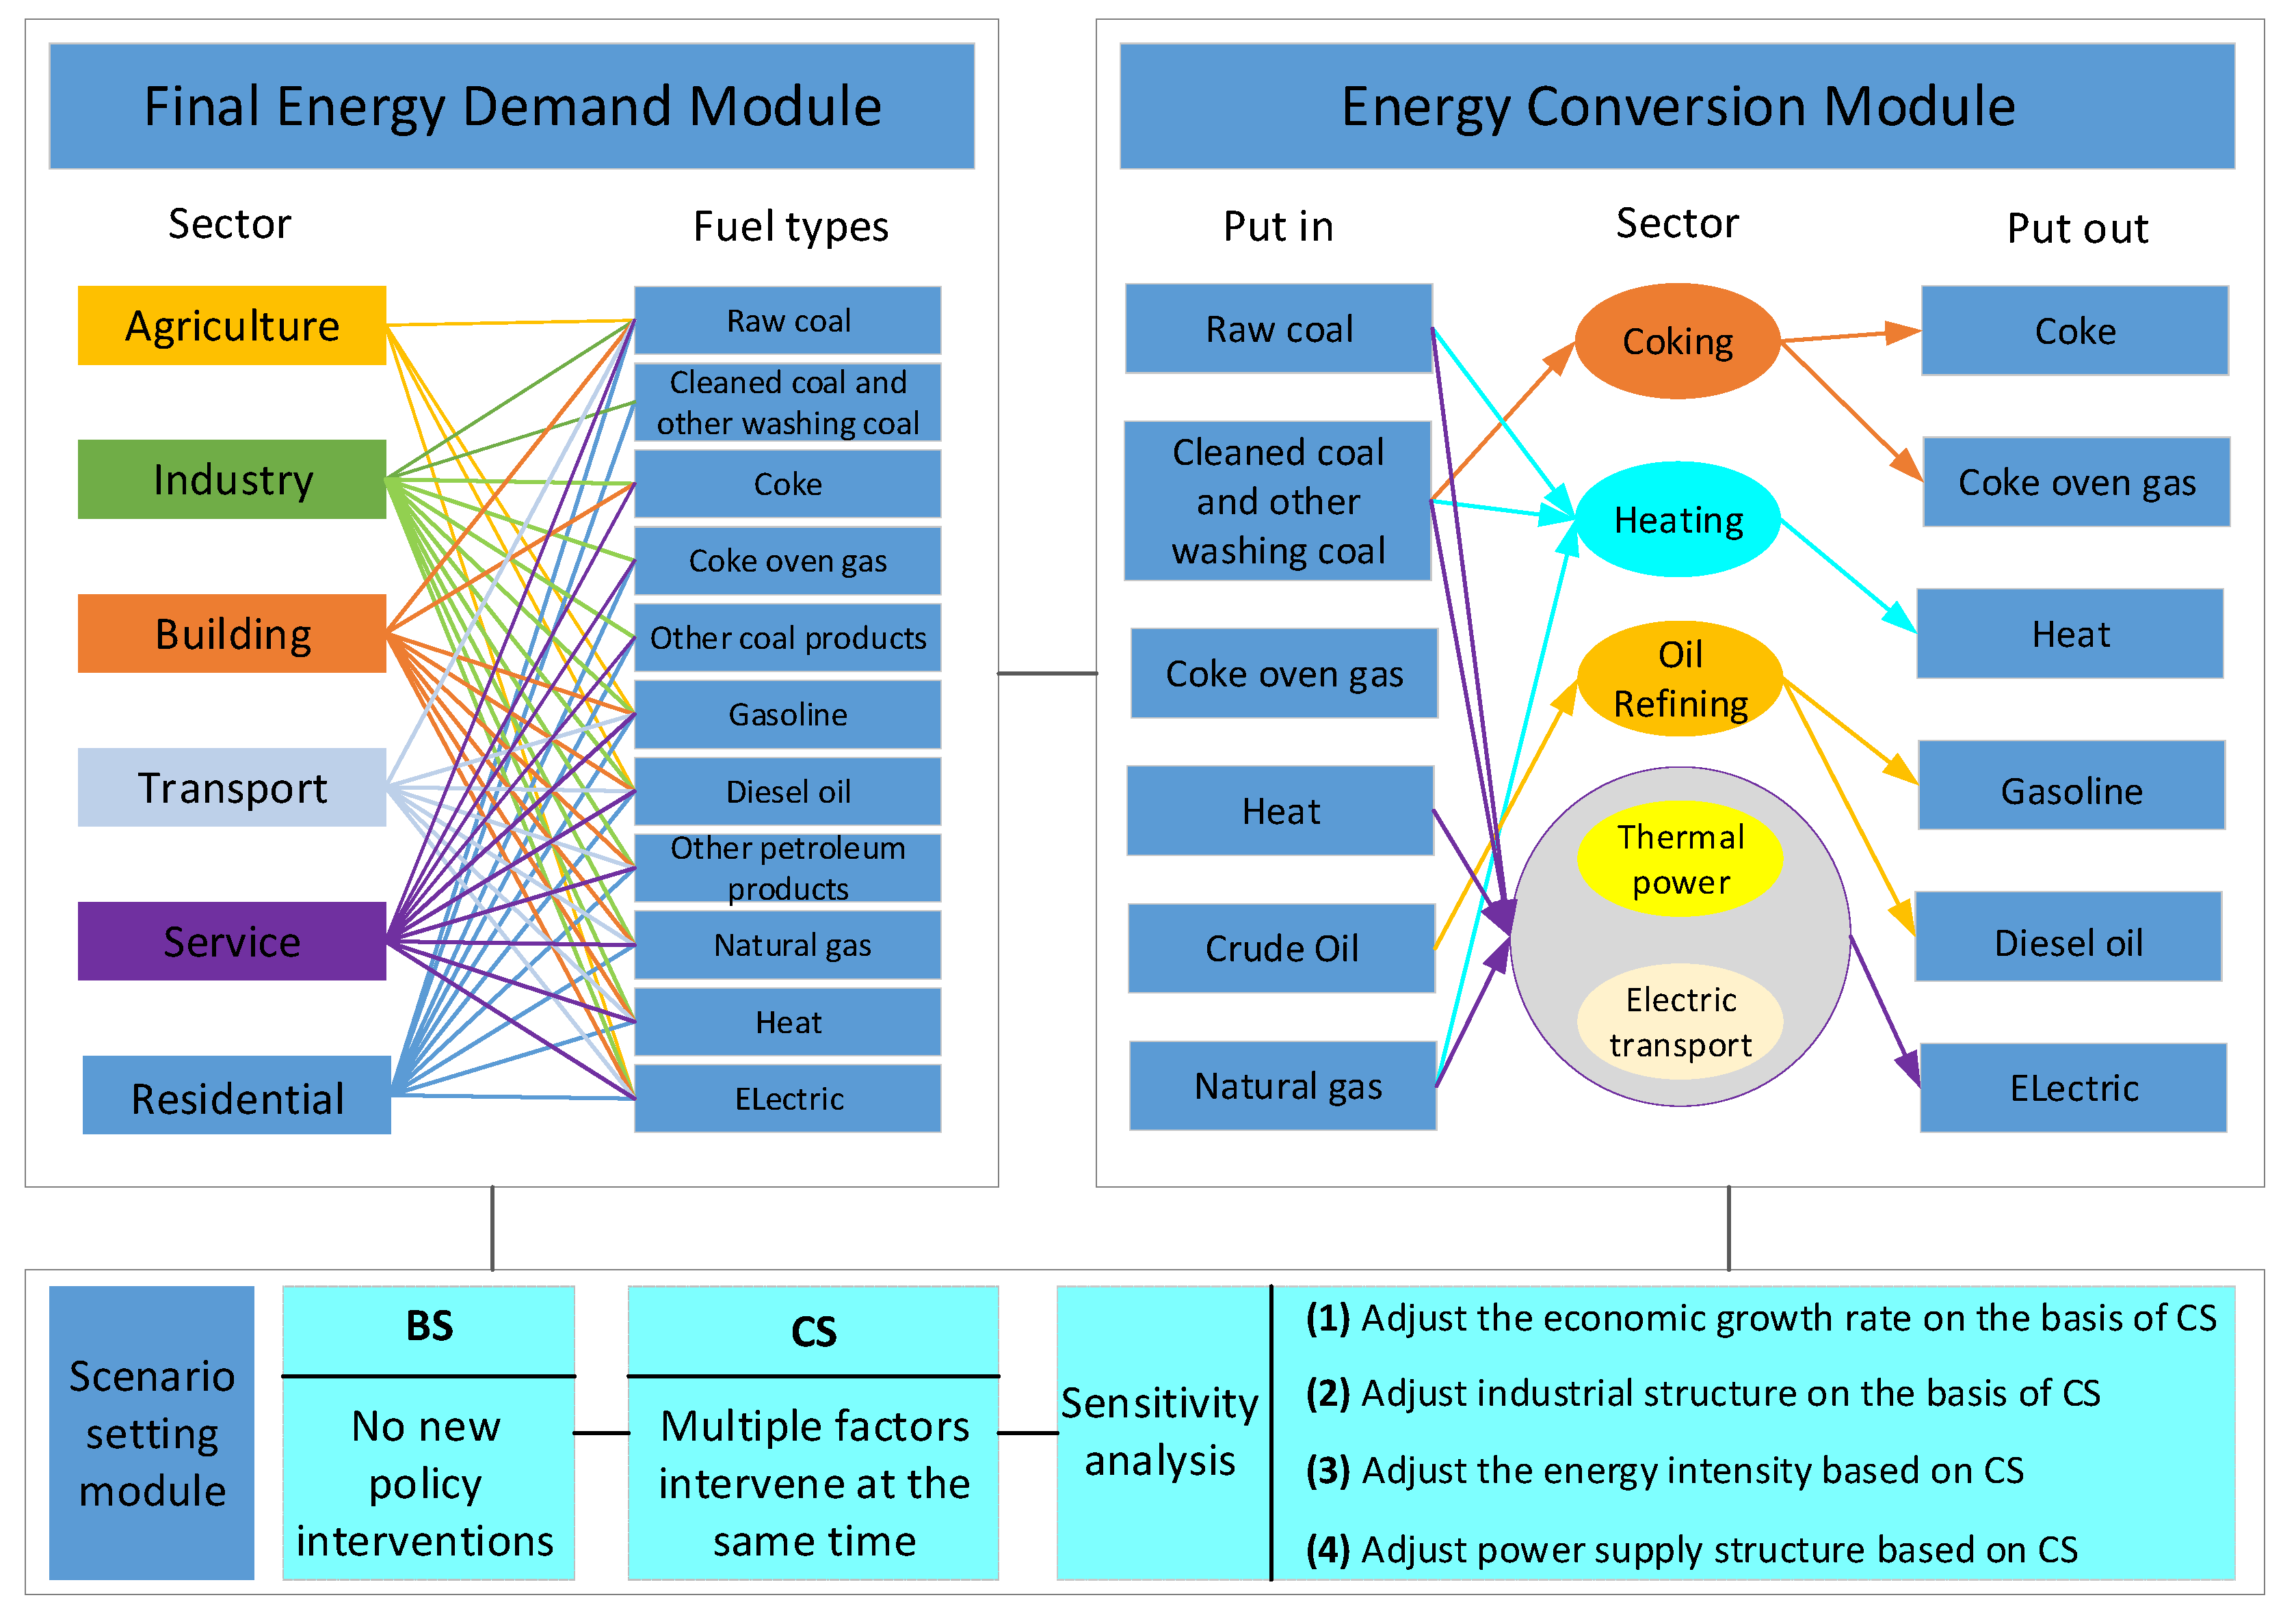
2.1. Framework
2.2. Data Sources
2.3. Scenario Setting
2.3.1. Base Scenario (BS)
2.3.2. Comprehensive Scenario (CS)
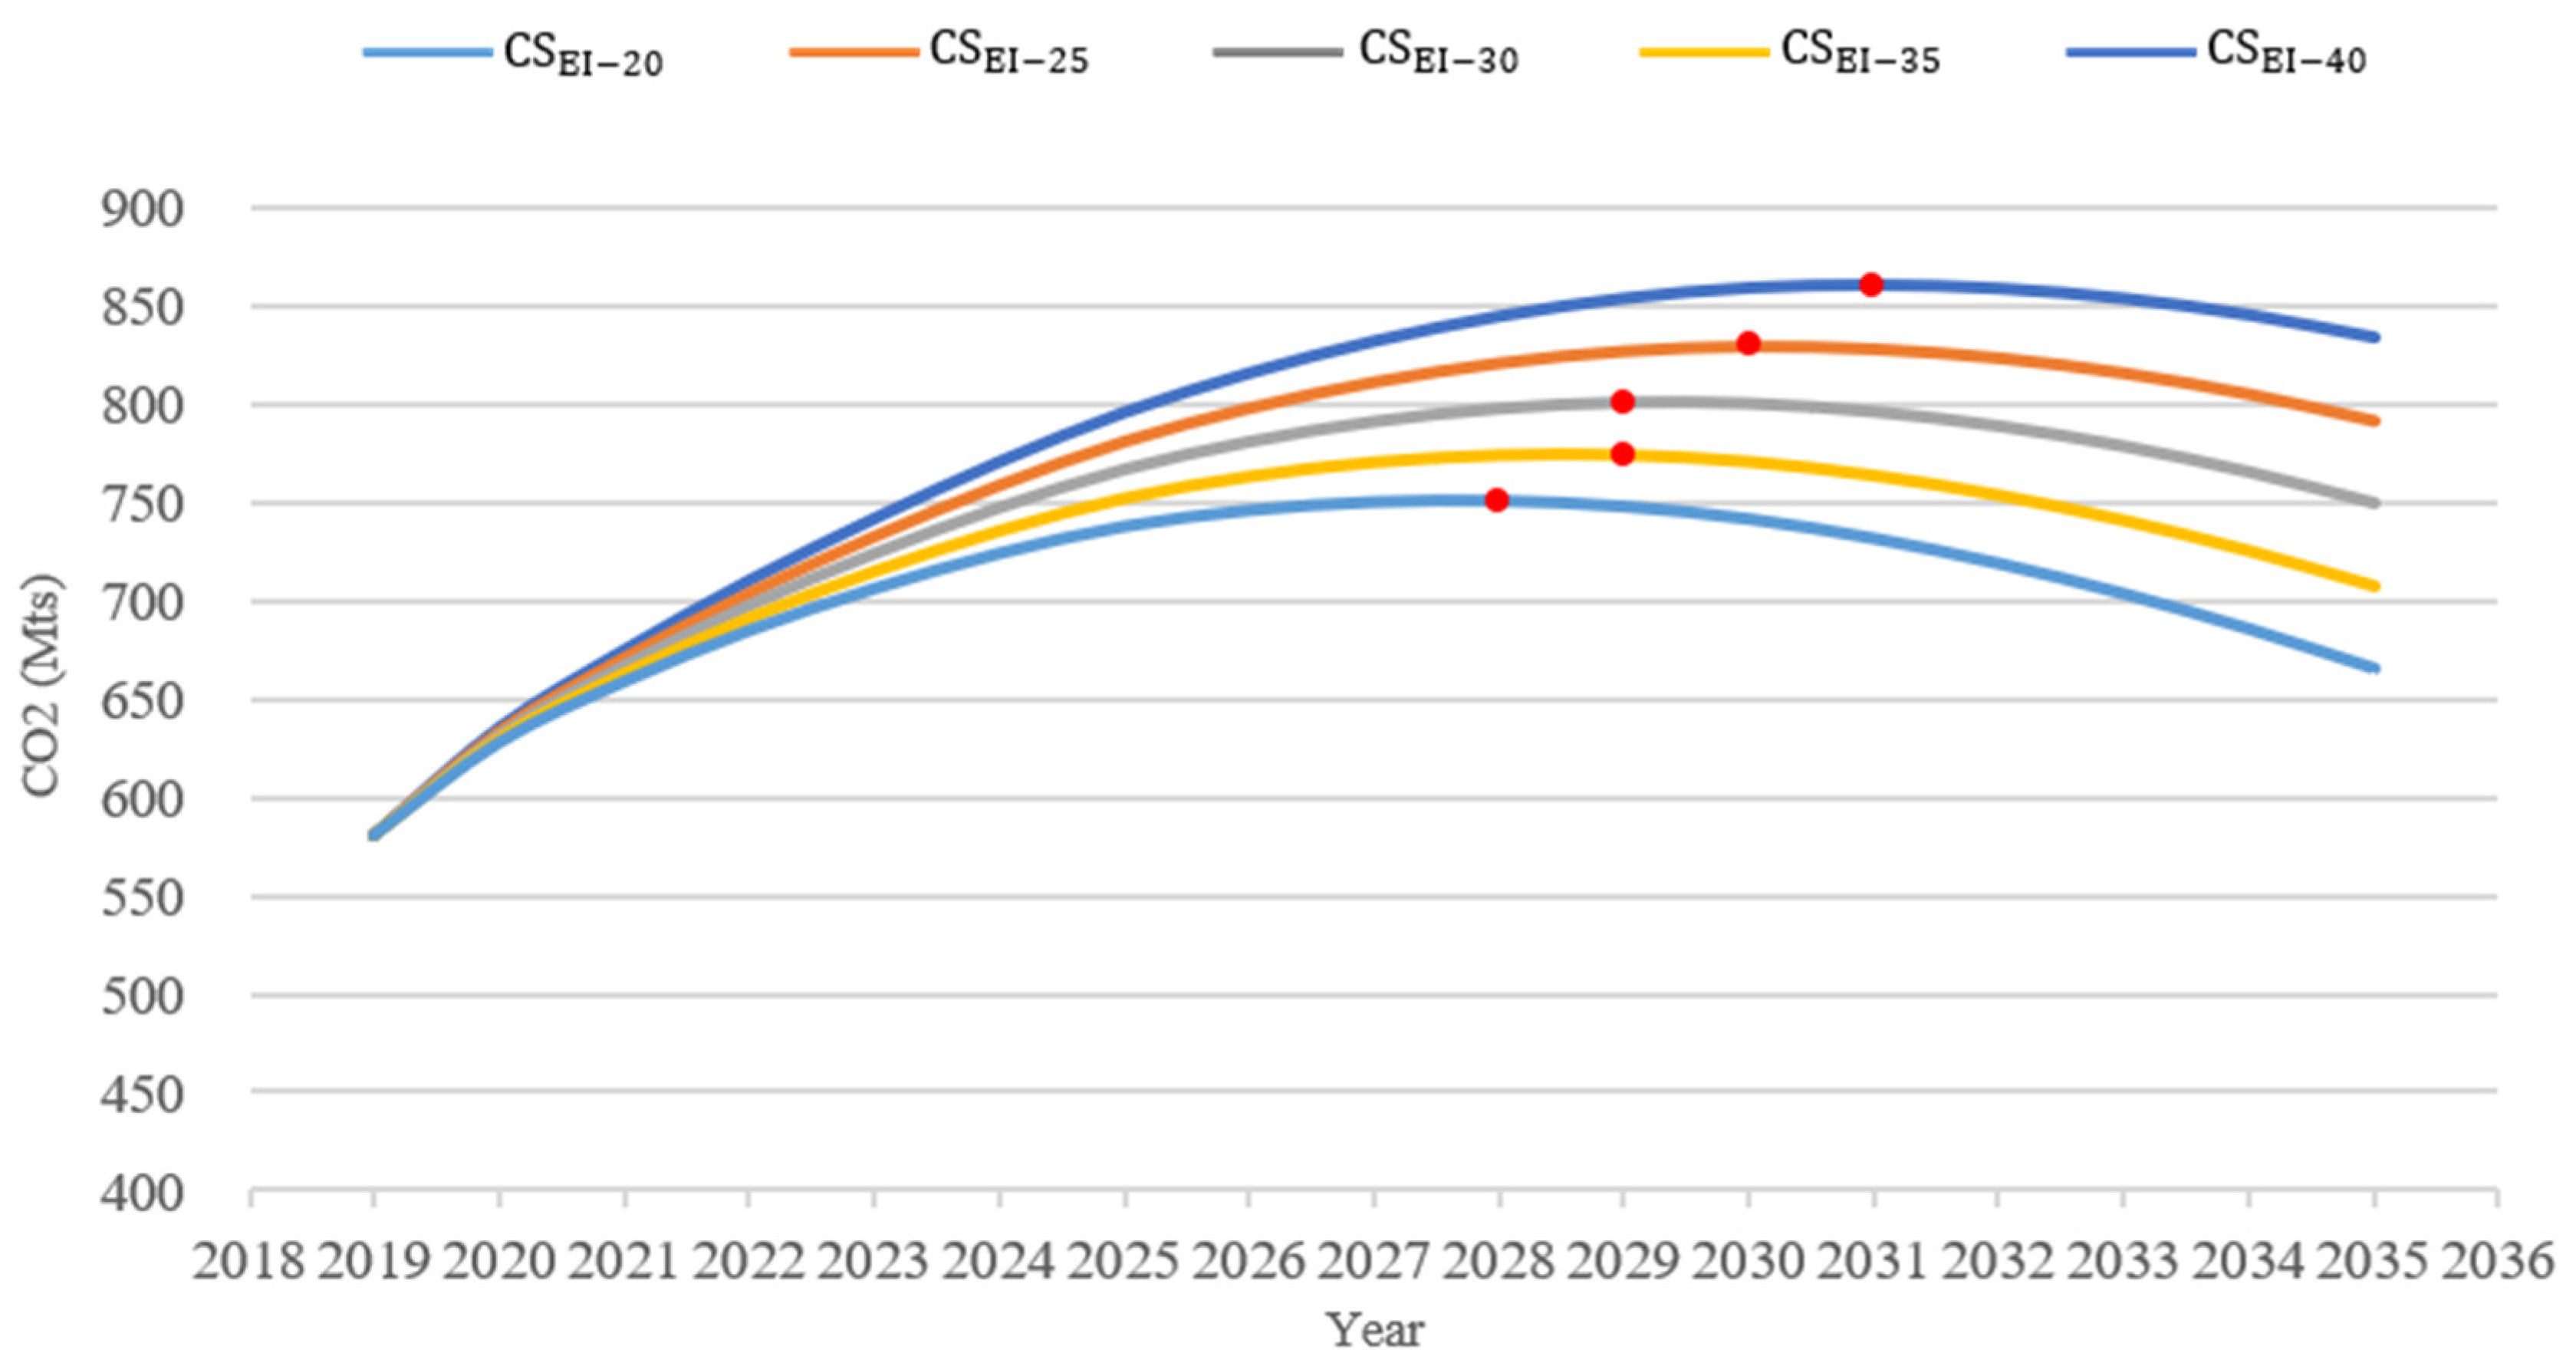
2.4. Sensitivity Analysis
3. Results
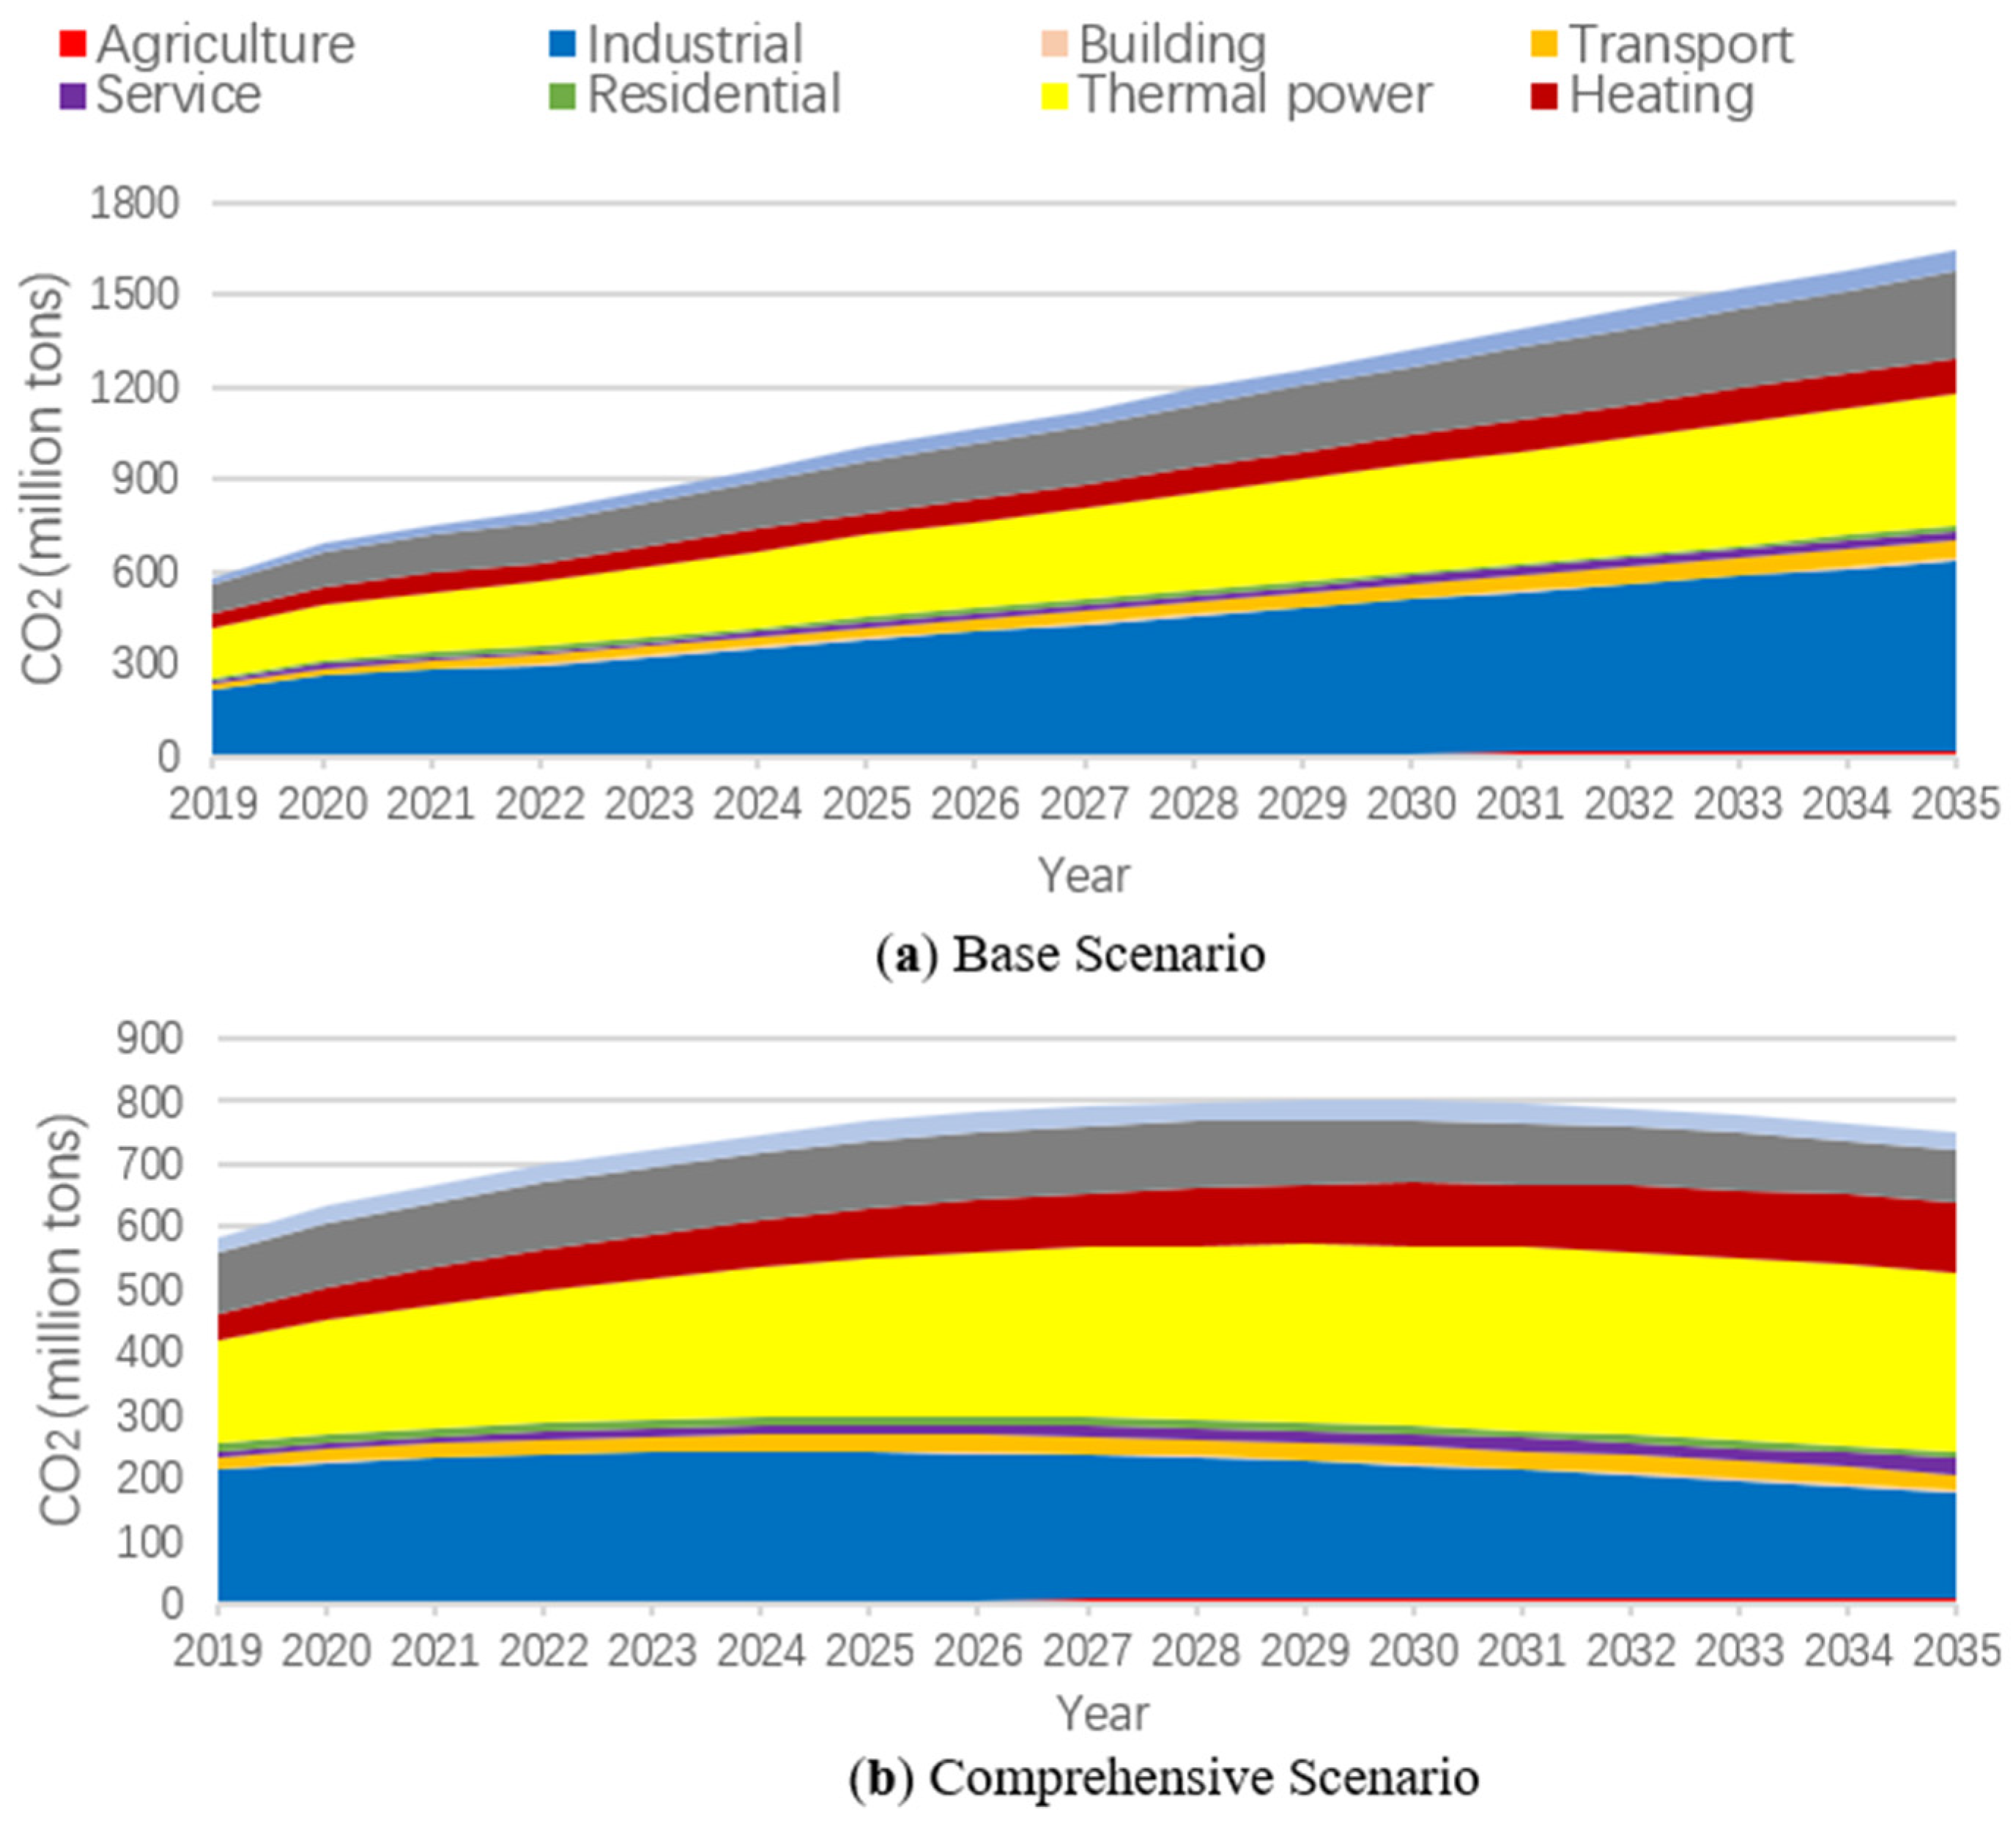
3.1. CO2 Emission Trends under the BS and CS
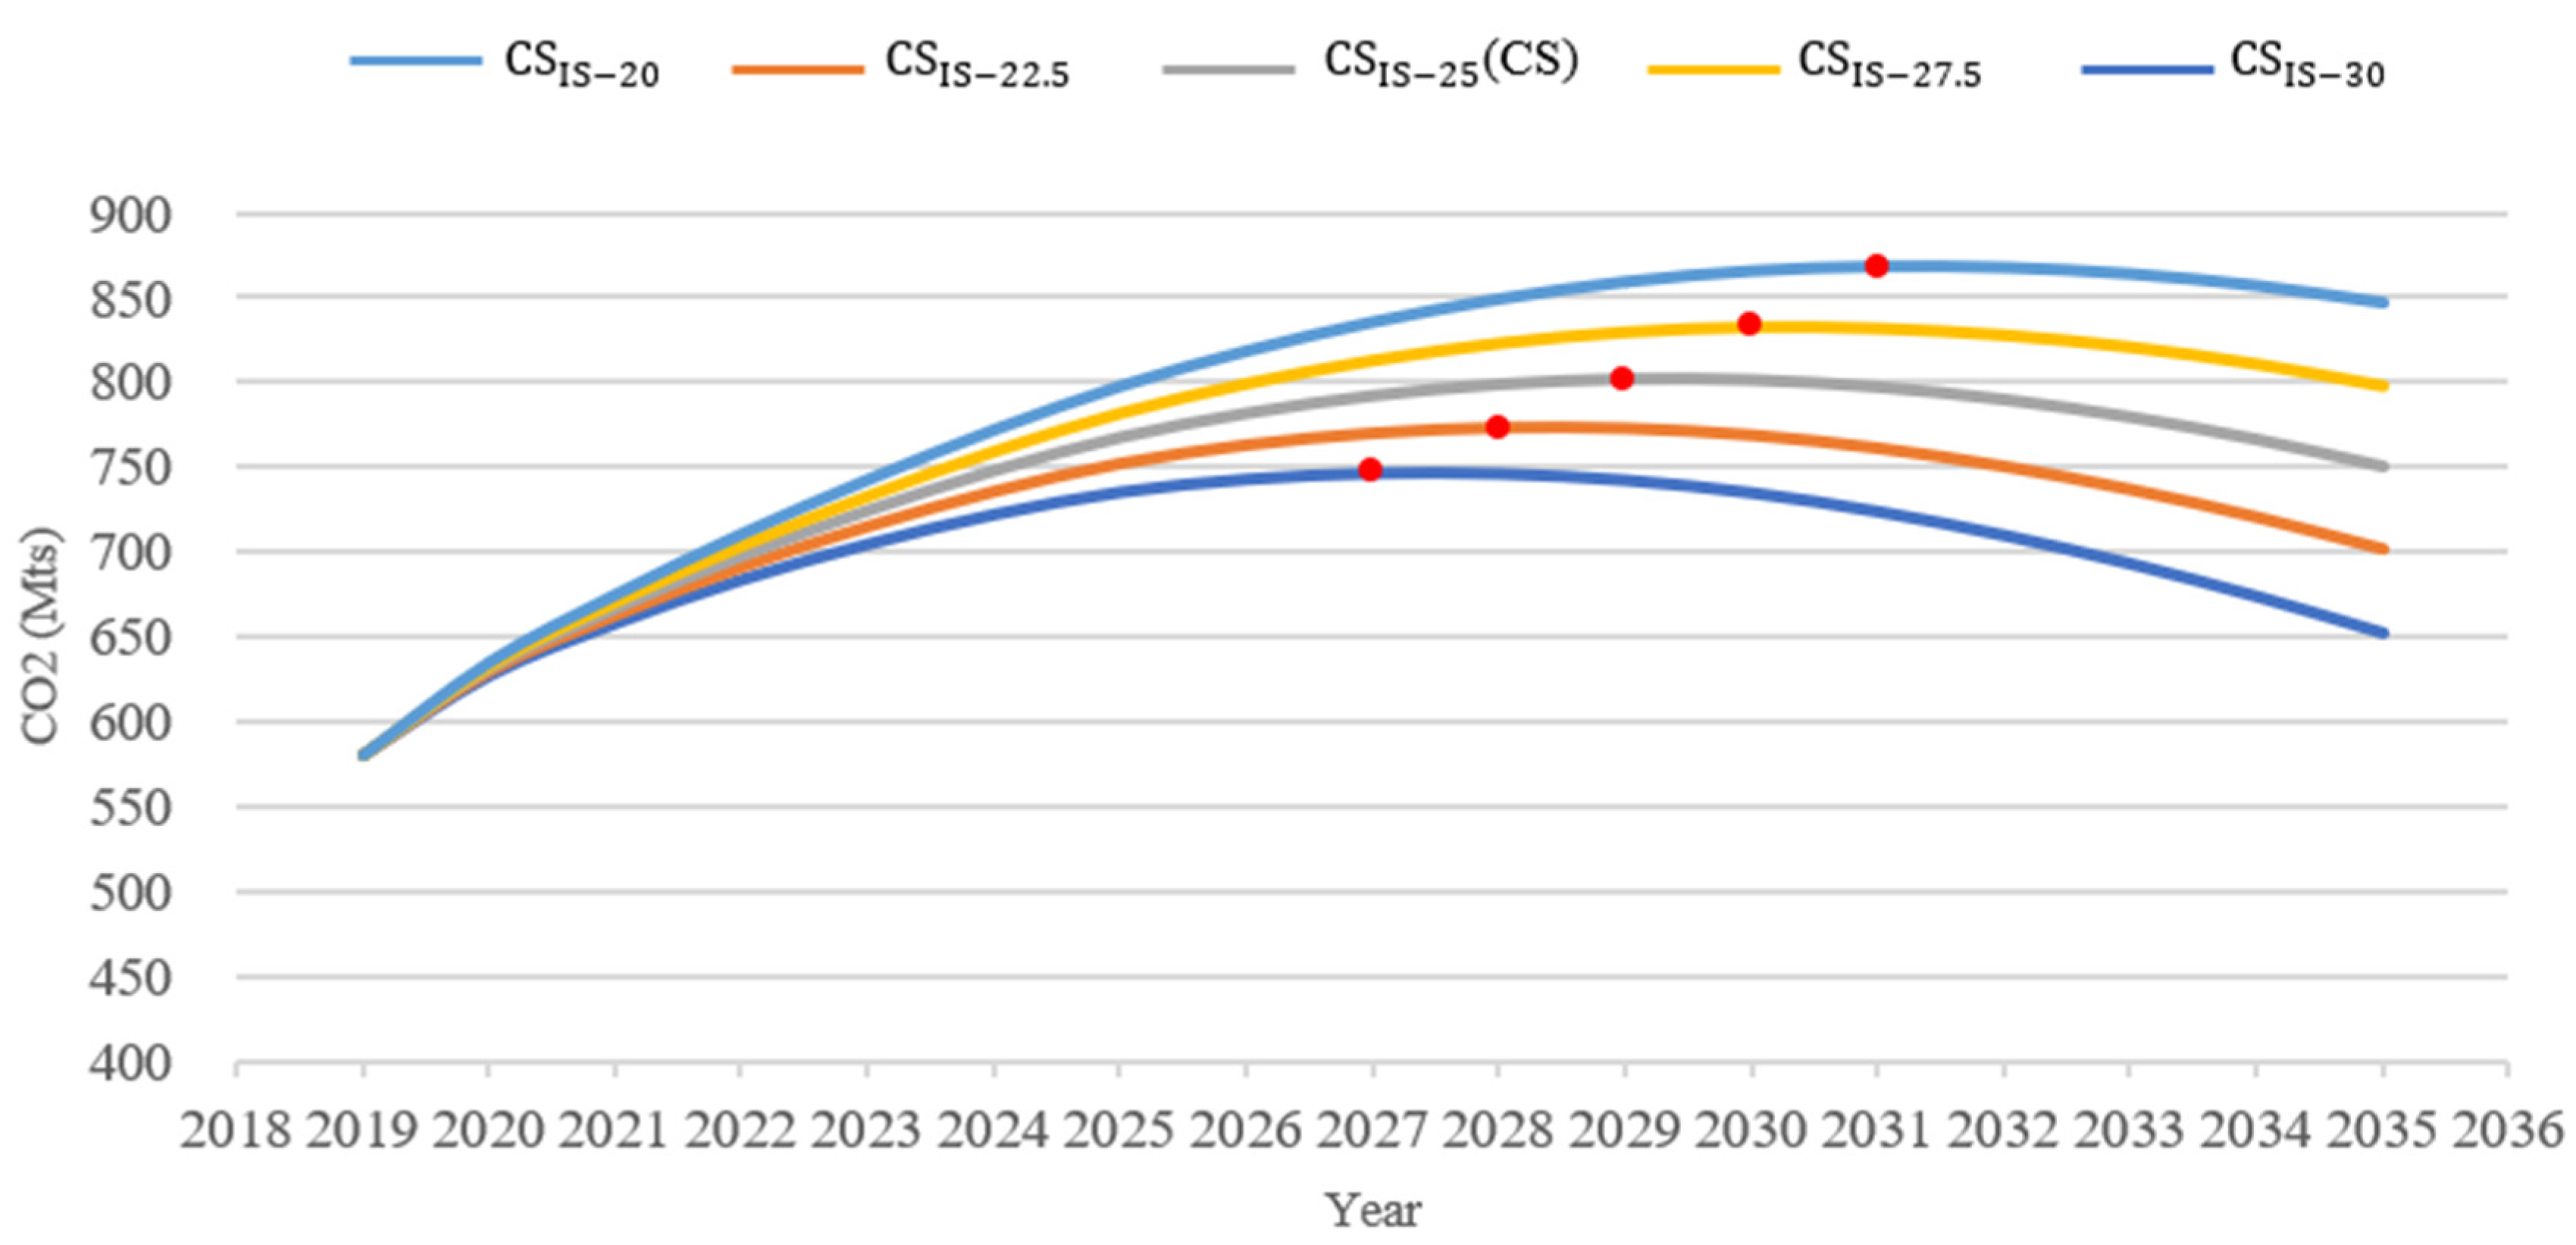
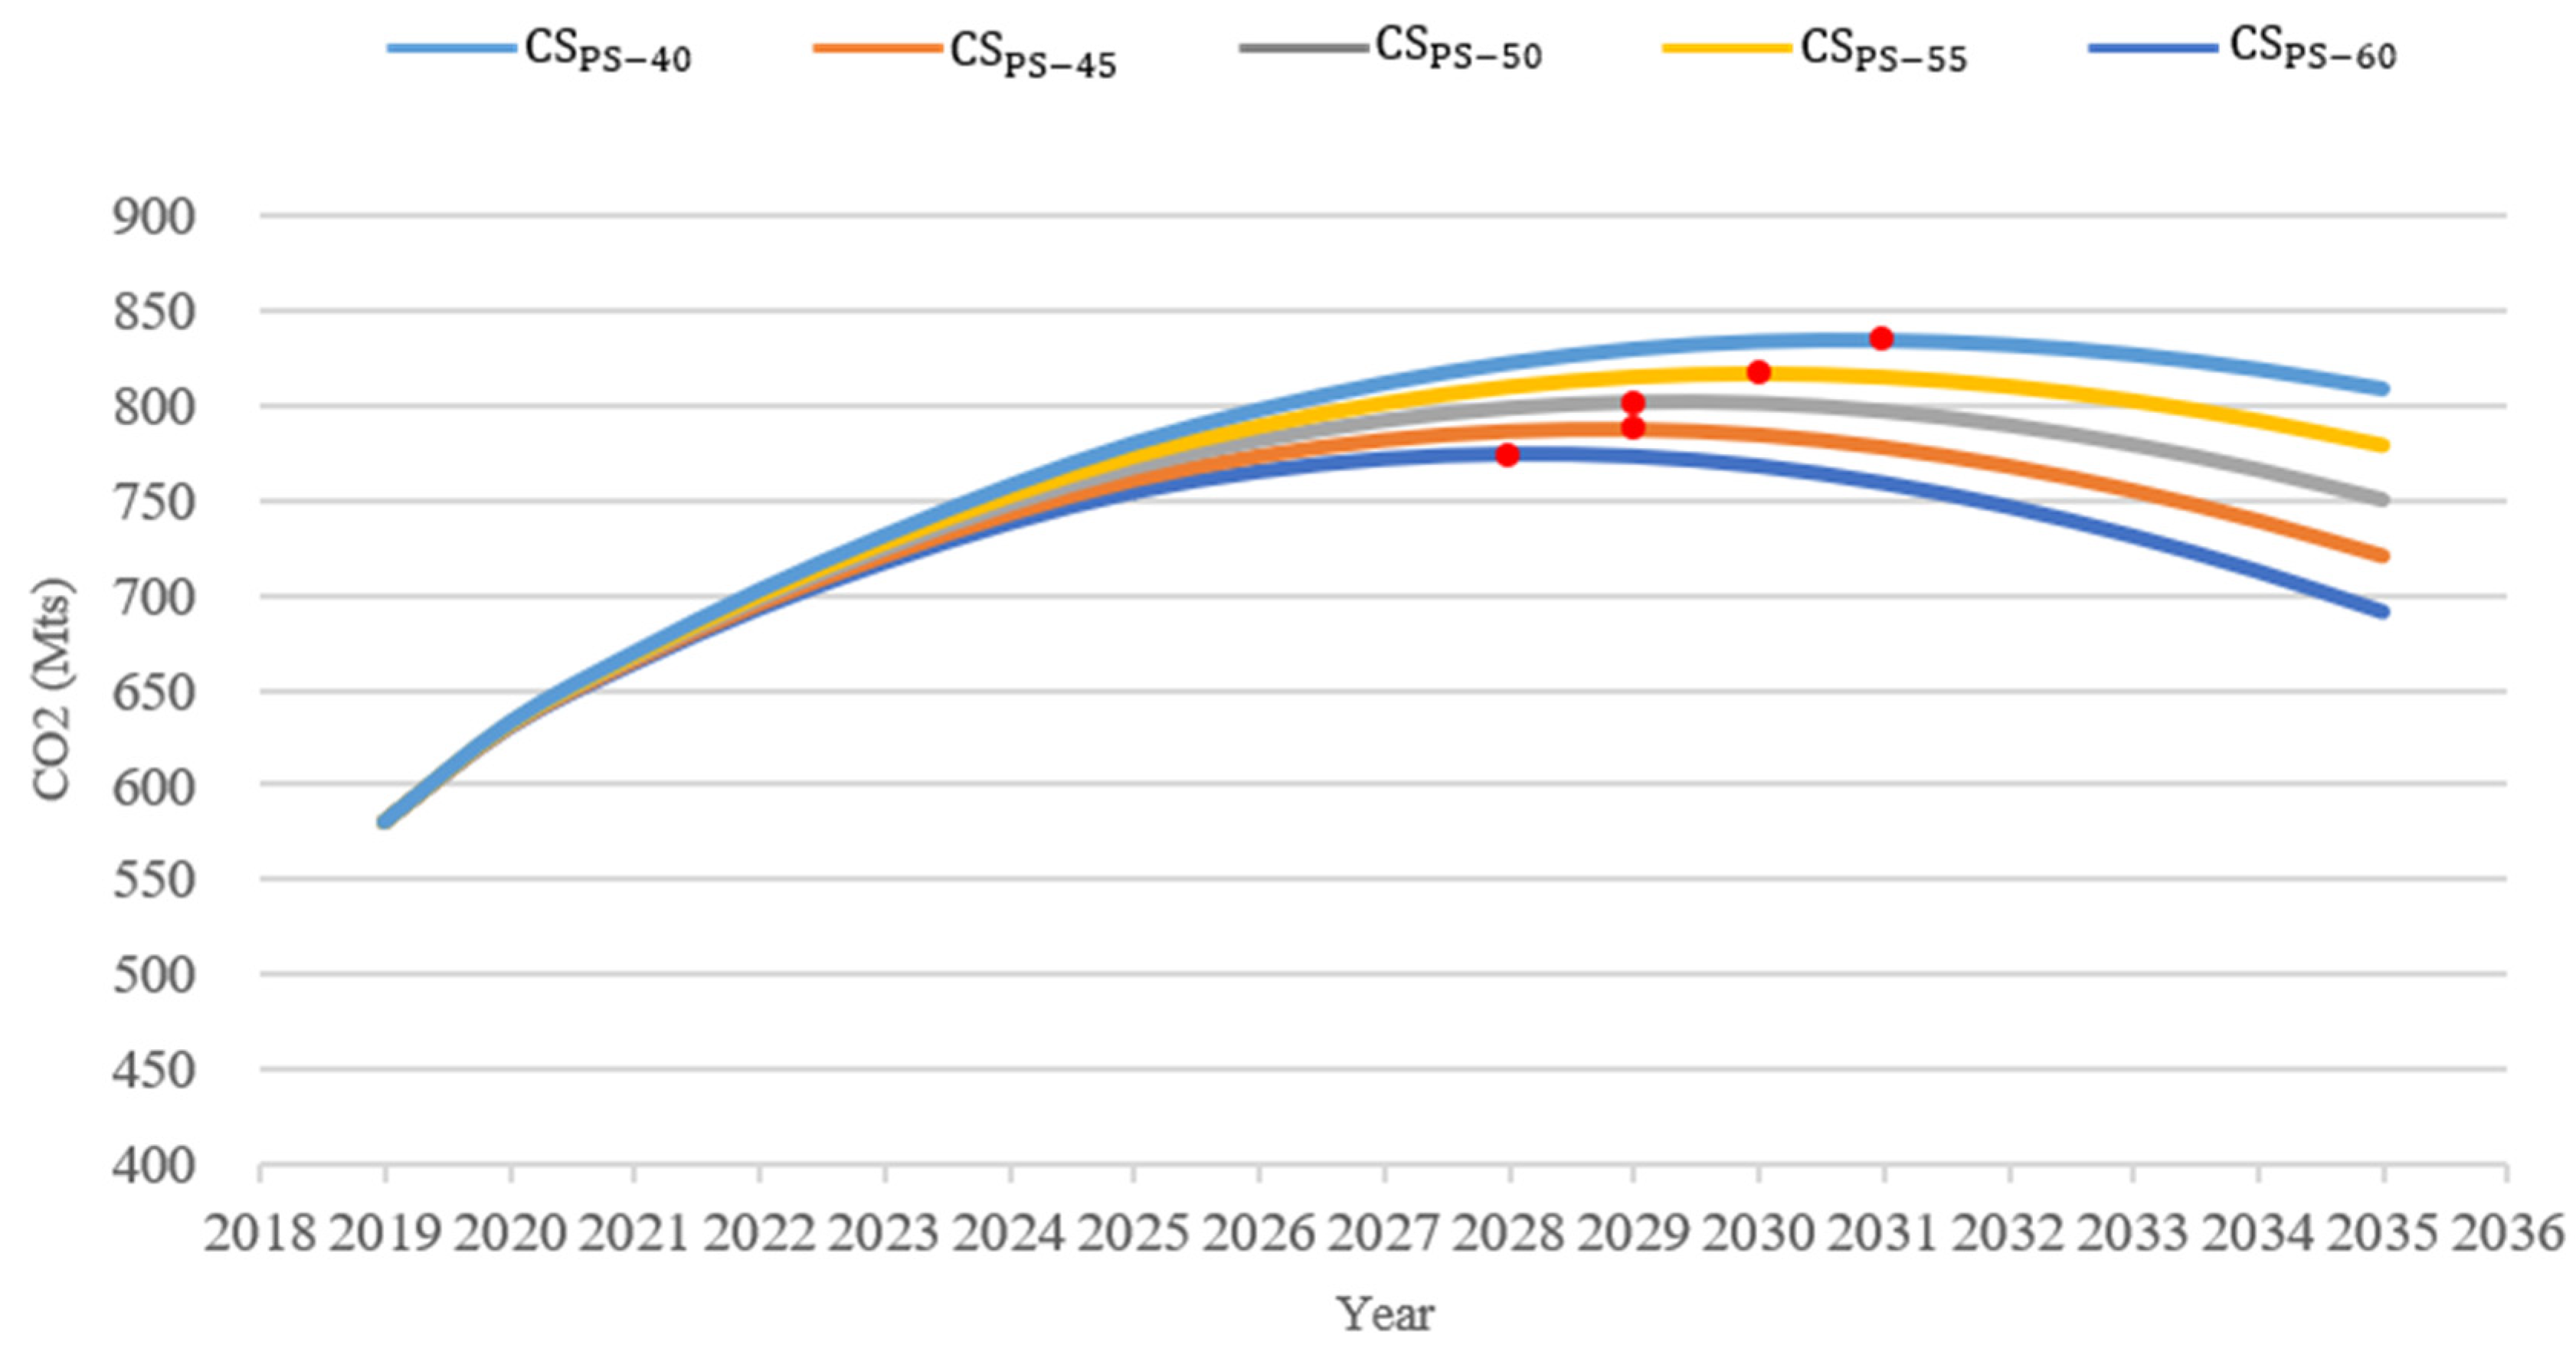
3.2. Sensitivity Analysis to Peak CO2 Emissions under the CS
4. Conclusions
Author Contributions
Funding
Acknowledgments
Conflicts of Interest
Abbreviations
| total CO2 emissions | |
| the CO2 emissions from the final energy demand | |
| the CO2 emissions from the energy conversion | |
| the level of activity in sector i | |
| the energy intensity of sector i | |
| the ratio of the demand for j energy in sector i to the total energy demand in sector i | |
| the CO2 emissions factor of fuel type j | |
| ETO | the production of energy conversion |
| f | the transformation efficiency |
| EF | the CO2 emissions factor |
| m | the energy conversion modules |
| j | the fuel type of consumption in energy transformation |
| t | the fuel type of production in energy transformation |
| Abbreviation of scenario name | |
| BS | Base Scenario |
| CS | Comprehensive Scenario |
| a scenario which assumed 1% increase in annual GDP per capita growth rate based on the comprehensive scenario | |
| a scenario which assumed 1% decrease in annual GDP per capita growth rate based on the comprehensive scenario | |
| a scenario which assumed a x% GDP share of the industrial sector in 2035 under the comprehensive scenario | |
| a scenario which assumed the energy intensity of the industrial and transport sectors in 2035 will be x% lower than that under the BS, other parameter settings are the same as Comprehensive scenario | |
| a scenario which assumed a x% installed capacity of thermal power in 2035, other parameter settings are the same as Comprehensive scenario | |
Appendix A
| Energy Consumption Structure by Sector (%) | Year | Raw Coal | Washed and Other Washed Coal | Coke | Coke Oven Gas | Other Coal Products | Gasoline | Diesel | Other Petroleum Products | Natural Gas | Heat | Electricity | |
| Agriculture | Base year | 2019 | 38.83 | 9.33 | 25.44 | 26.40 | |||||||
| BS | 2030 | 45.69 | 10.53 | 20.87 | 22.92 | ||||||||
| 2035 | 45.60 | 10.50 | 20.94 | 22.96 | |||||||||
| CS | 2030 | 32.76 | 7.73 | 13.45 | 46.06 | ||||||||
| 2035 | 30.00 | 7.00 | 8.00 | 55.00 | |||||||||
| Industrial | Base year | 2019 | 24.53 | 1.17 | 22.97 | 9.75 | 12.32 | 0.07 | 0.93 | 0.01 | 3.48 | 5.29 | 19.49 |
| BS | 2030 | 28.20 | 1.33 | 21.96 | 9.63 | 10.21 | 0.18 | 1.11 | 0.04 | 3.02 | 5.50 | 18.83 | |
| 2035 | 28.14 | 1.33 | 21.97 | 9.63 | 10.24 | 0.17 | 1.11 | 0.04 | 3.02 | 5.50 | 18.85 | ||
| CS | 2030 | 17.98 | 1.05 | 15.22 | 8.55 | 5.91 | 0.16 | 0.98 | 0.07 | 7.96 | 8.53 | 33.59 | |
| 2035 | 15.00 | 1.00 | 11.70 | 8.00 | 3.00 | 0.20 | 1.00 | 0.10 | 10.00 | 10.00 | 40.00 | ||
| Building | Base year | 2019 | 2.69 | 0.00 | 16.69 | 54.09 | 0.29 | 1.01 | 1.37 | 23.86 | |||
| BS | 2030 | 6.12 | 0.05 | 17.69 | 48.92 | 0.81 | 2.34 | 2.31 | 21.76 | ||||
| 2035 | 6.06 | 0.05 | 17.67 | 49.02 | 0.81 | 2.32 | 2.29 | 21.79 | |||||
| CS | 2030 | 4.28 | 0.00 | 12.09 | 30.65 | 0.78 | 9.94 | 3.87 | 38.39 | ||||
| 2035 | 5.00 | 0.00 | 10.00 | 20.00 | 1.00 | 14.00 | 5.00 | 45.00 | |||||
| Transport | Base year | 2019 | 0.62 | 20.86 | 47.15 | 6.45 | 12.87 | 2.53 | 9.52 | ||||
| BS | 2030 | 3.65 | 18.90 | 49.79 | 5.10 | 12.21 | 1.91 | 8.44 | |||||
| 2035 | 3.62 | 18.93 | 49.73 | 5.12 | 12.22 | 1.92 | 8.46 | ||||||
| CS | 2030 | 1.57 | 13.39 | 31.92 | 4.08 | 24.65 | 2.85 | 21.54 | |||||
| 2035 | 2.00 | 10.00 | 25.00 | 3.00 | 30.00 | 3.00 | 27.00 | ||||||
| Service | Base year | 2019 | 31.64 | 0.00 | 0.00 | 0.20 | 5.76 | 1.67 | 0.14 | 19.33 | 11.88 | 29.37 | |
| BS | 2030 | 38.53 | 0.10 | 0.13 | 0.41 | 5.18 | 1.81 | 0.08 | 14.02 | 14.16 | 25.59 | ||
| 2035 | 38.46 | 0.10 | 0.13 | 0.41 | 5.18 | 1.80 | 0.09 | 14.07 | 14.12 | 25.65 | |||
| CS | 2030 | 20.20 | 0.07 | 0.07 | 0.27 | 3.86 | 1.49 | 0.11 | 19.79 | 17.46 | 36.68 | ||
| 2035 | 15.00 | 0.10 | 0.10 | 0.30 | 3.00 | 1.40 | 0.10 | 20.00 | 20.00 | 40.00 | |||
| Residential | Base year | 2019 | 22.95 | 0.00 | 0.00 | 4.09 | 4.58 | 0.30 | 0.86 | 14.94 | 31.61 | 20.66 | |
| BS | 2030 | 25.59 | 4.75 | 0.26 | 3.22 | 4.74 | 0.27 | 0.79 | 13.69 | 27.40 | 19.29 | ||
| 2035 | 25.57 | 4.68 | 0.25 | 3.23 | 4.74 | 0.27 | 0.79 | 13.70 | 27.45 | 19.31 | |||
| CS | 2030 | 17.48 | 2.06 | 0.69 | 2.65 | 2.81 | 0.16 | 0.54 | 17.04 | 32.91 | 23.64 | ||
| 2035 | 15.00 | 3.00 | 1.00 | 2.00 | 2.00 | 0.10 | 0.40 | 18.00 | 33.50 | 25.00 | |||
References
- Kavari, G.; Tahani, M.; Mirhosseini, M. Wind shear effect on aerodynamic performance and energy production of horizontal axis wind turbines with developing blade element momentum theory. J. Clean. Prod. 2019, 219, 368–376. [Google Scholar] [CrossRef]
- Iqbal, W.; Tang, Y.M.; Chau, K.Y.; Irfan, M.; Mohsin, M. Nexus between air pollution and NCOV-2019 in China: Application of negative binomial regression analysis. Process Saf. Environ. Prot. 2021, 150, 557–565. [Google Scholar] [CrossRef]
- Rauf, A.; Ozturk, I.; Ahmad, F.; Shehzad, K.; Chandiao, A.A.; Irfan, M.; Abid, S.; Jinkai, L. Do Tourism Development, Energy Consumption and Transportation Demolish Sustainable Environments? Evidence from Chinese Provinces. Sustainability 2021, 13, 12361. [Google Scholar] [CrossRef]
- Irfan, M.; Elavarasan, R.M.; Hao, Y.; Feng, M.; Sailan, D. An assessment of consumers’ will-ingness to utilize solar energy in China: End users’ perspective. J. Clean. Prod. 2021, 292, 126008. Available online: https://www.sciencedirect.com/science/article/abs/pii/S0959652621002286 (accessed on 5 November 2021). [CrossRef]
- International Energy Agency (IEA). World Energy Outlook 2017. Available online: https://www.iea.org/weo2017/ (accessed on 5 November 2021).
- BP. World Bank Open Data. 2020. Available online: https://data.worldbank.org.cn/country/china?view=chart/ (accessed on 5 November 2021).
- Li, Y.; Yang, X.; Ran, Q.; Wu, H.; Irfan, M.; Ahmad, M. Energy structure, digital economy, and carbon emissions: Evidence from China. Environ. Sci. Pollut. Res. 2021, 28, 64606–64629. [Google Scholar] [CrossRef]
- State Council. Intensifying Action on Climate Change—China’s Country-Owned Contribution. 2015. Available online: https://huanbao.bjx.com.cn/news/20150701/636392.shtml (accessed on 5 November 2021).
- MICCTECH. The Historical Background, Significance and Change Path of China’s “Double Carbon” Goal. 2021. Available online: https://www.micctech.com/news-231.html (accessed on 5 November 2021).
- Carbon Guardian. 31 Provinces and Cities “Double Carbon” Goals and Planning Summary. 2021. Available online: https://baijiahao.baidu.com/s?id=1703826083851746879&wfr=spider&for=pc (accessed on 5 November 2021).
- China Carbon Emissions Trading Network. Analysis of the Current Situation of Carbon Dioxide Emissions and Intensity in China by Province. 2015. Available online: http://www.tanpaifang.com/tanguwen/2015/0404/43614.html (accessed on 5 November 2021).
- Ma, D. Evolution of economic development strategy in Shanxi Province since the founding of New China. J. Econ. Res. 2020, 11, 2. Available online: http://qikan.cqvip.com/Qikan/Article/Detail?id=7101542321 (accessed on 5 November 2021).
- CEADs. Emission Inventories for 30 Provinces. 2017. Available online: https://www.ceads.net.cn/data/province/ (accessed on 5 November 2021).
- Shanxi Development and Reform Commission. Shanxi Province, the Fourteenth Five-Year Plan for National Economic and Social Development and the Outline of the 2035 Vision. 2021. Available online: http://fgw.shanxi.gov.cn/fggz/wngz/fzgh2/202104/t20210416127485.shtml/ (accessed on 5 November 2021).
- Alajmi, R.G. Factors that impact greenhouse gas emissions in Saudi Arabia: Decomposition analysis using LMDI. Energy Policy 2021, 156, 112454. [Google Scholar] [CrossRef]
- Gu, S.; Fu, B.; Thriveni, T.; Fujita, T.; Ahn, J.W. Coupled LMDI and system dynamics model for estimating urban CO2 emission mitigation potential in Shanghai, China. J. Clean. Prod. 2019, 240, 118034. [Google Scholar] [CrossRef]
- Xiao, S.; Dong, H.; Geng, Y.; Fujii, M.; Pan, H. Greenhouse gas emission mitigation potential from municipal solid waste treatment: A combined SD-LMDI mode. Waste Manag. 2020, 120, 725–733. [Google Scholar] [CrossRef]
- Fang, D.; Hao, P.; Hao, J. Study of the influence mechanism of China’s electricity consumption based on multi-period ST-LMDI model. Energy 2019, 170, 730–743. [Google Scholar] [CrossRef]
- Liu, M.; Zhang, X.; Zhang, M.; Feng, Y.; Liu, Y.; Wen, J.; Liu, L. Influencing factors of carbon emissions in transportation industry based on CD function and LMDI decomposition model: China as an example. Environ. Impact Assess. Rev. 2021, 90, 106623. [Google Scholar] [CrossRef]
- Zhang, T.; Ma, Y.; Li, A. Cenario analysis and assessment of China’s nuclear power policy based on the Paris Agreement: A dynamic CGE model. Energy 2021, 228, 120541. [Google Scholar] [CrossRef]
- Xiao, B.; Niu, D.; Wu, H. Exploring the impact of determining factors behind CO2 emissions in China: A CGE appraisal. Sci. Total Environ. 2017, 581–582, 559–572. [Google Scholar] [CrossRef] [PubMed]
- Yang, D.; Liu, D.; Huang, A.; Lin, J.; Xu, L. Critical transformation pathways and so-cio-environmental benefits of energy substitution using a LEAP scenario modeling. Renew. Sustain. Energy Rev. 2021, 135, 110116. [Google Scholar] [CrossRef]
- Leo, S.D.; Caramuta, P.; Curci, P.; Cosmi, C. Regression analysis for energy demand projection: An application to TIMES-Basilicata and TIMES-Italy energy models. Energy 2020, 196, 117058. [Google Scholar] [CrossRef]
- Tash, A.; Ahanchian, M.; Fahl, U. Improved representation of investment decisions in the German energy supply sector: An optimization approach using the TIMES model. Energy Strategy Rev. 2019, 26, 100421. [Google Scholar] [CrossRef]
- Musonye, X.S.; Davíðsdóttir, B.; Kristjánsson, R.; Ásgeirsson, E.I.; Stefánsson, H. Environmental and techno-economic assessment of power system expansion for projected demand levels in Kenya using TIMES modeling framework. Energy Sustain. Dev. 2021, 63, 51–66. [Google Scholar] [CrossRef]
- Jaskólski, M. Modelling long-term technological transition of Polish power system using MARKAL: Emission trade impact. Energy Policy 2016, 97, 365–377. [Google Scholar] [CrossRef]
- Nieves, J.A.; Aristizabal, A.J.; Dyner, I.; Báez, O.; Ospina, D.H. Energy demand and green-house gas emissions analysis in Colombia: A LEAP model application. Energy 2019, 169, 380–397. [Google Scholar] [CrossRef]
- Hernández, K.D.; Fajardo, O.A. Estimation of industrial emissions in a Latin American megacity under power matrix scenarios projected to the year 2050 implementing the LEAP model. J. Clean. Prod. 2021, 303, 126921. [Google Scholar] [CrossRef]
- Emodi, N.V.; Emodi, C.C.; Murthy, G.P.; Emodi, A.S.A. Energy policy for low carbon development in Nigeria: A LEAP model application. Renew. Sustain. Energy Rev. 2017, 68, 247–261. [Google Scholar] [CrossRef]
- Yang, D.; Liu, B.; Ma, W.; Guo, Q.; Li, F.; Yang, D. Sectoral energy-carbon nexus and low-carbon policy alternatives: A case study of Ningbo, China. J. Clean. Prod. 2017, 156, 480–490. [Google Scholar] [CrossRef]
- Liang, M.; Wang, Y.; Wang, G. China’s low-carbon-city development with ETS: Forecast on the energy consumption and carbon emission of Chongqing. Energy Procedia 2014, 61, 2596–2599. [Google Scholar] [CrossRef] [Green Version]
- Dong, K.-Y.; Sun, R.-J.; Li, H.; Jiang, H.-D. A review of China’s energy consumption structure and outlook based on a long-range energy alternatives modeling tool. Pet. Sci. 2016, 14, 214–227. [Google Scholar] [CrossRef] [Green Version]
- Mirjat, N.H.; Uqaili, M.A.; Harijan, K.; Das Walasai, G.; Mondal, A.H.; Sahin, H. Long-term electricity demand forecast and supply side scenarios for Pakistan (2015–2050): A LEAP model application for policy analysis. Energy 2018, 165, 512–526. [Google Scholar] [CrossRef]
- Kumar, S.; Madlener, R. CO2 emission reduction potential assessment using renewable energy in India. Energy 2016, 97, 273–282. [Google Scholar] [CrossRef]
- Jiao, J.; Huang, Y.; Liao, C. Co-benefits of reducing CO2 and air pollutant emissions in the urban transport sector: A case of Guangzhou. Energy Sustain. Dev. 2020, 59, 131–143. [Google Scholar] [CrossRef]
- Katta, A.K.; Davis, M.; Subramanyam, V.; Dar, A.F.; Mondal, M.A.H.; Ahiduzzaman, M.; Kumar, A. Assessment of energy demand-based greenhouse gas mitigation options for Canada’s oil sands. J. Clean. Prod. 2019, 241, 118306. [Google Scholar] [CrossRef]
- Maduekwe, M.; Akpan, U.; Isihak, S. Road transport energy consumption and vehicular emissions in Lagos, Nigeria: An application of the LEAP model. Transp. Res. Interdiscip. Perspect. 2020, 6, 100172. [Google Scholar] [CrossRef]
- Zhang, X.; Chen, Y.; Jiang, P.; Liu, L.; Xu, X.; Xu, Y. Sectoral peak CO2 emission measurements and a long-term alternative CO2 mitigation roadmap: A case study of Yunnan, China. J. Clean. Prod. 2020, 247, 119171. [Google Scholar] [CrossRef]
- Shanxi Statistics Bureau. Shanxi Statistical Yearbook; China Statistic Bureau, China Statistics Press: Beijing, China, 2020. Available online: http://tjj.shanxi.gov.cn/ (accessed on 5 November 2021).
- China Statistic Bureau. China Energy Statistical Yearbook 2020; China Statistic Bureau, China Statistics Press: Beijing, China, 2020; Available online: https://www.yearbookchina.com/navibooklist-n3020013309-1.html/ (accessed on 5 November 2021).
- State Council. National Population Development Plan (2016–2030). 2017. Available online: http://www.gov.cn/xinwen/2017-01/25/content_5163528.htm (accessed on 5 November 2021).
- Global Energy Internet Development Cooperation Organization. China Energy and Electricity Development Planning Study 2030 and Outlook 2060. 2021. Available online: https://shupeidian.bjx.com.cn/html/20210319/1142781.shtml/ (accessed on 5 November 2021).
- Shanxi Statistic Bureau. Analysis of the Current Situation of Population Development in Shanxi Province in 2018. 2018. Available online: http://tjj.shanxi.gov.cn/sjjd/sjxx/201908/t20190806_102435.shtml/ (accessed on 5 November 2021).
- Ren, F.; Long, D. Carbon emission forecasting and scenario analysis in Guangdong Province based on optimized Fast Learning Network. J. Clean. Prod. 2021, 317, 128408. [Google Scholar] [CrossRef]


| Parameter Settings | Base Year | BS | CS | ||
|---|---|---|---|---|---|
| 2019 | 2030 | 2035 | 2030 | 2035 | |
| GDP per capita (RMB 10,000) | 4.58 | 10.26 | 12.94 | 10.26 | 12.94 |
| Resident population (million) | 37.21 | 37.56 | 37.36 | 37.56 | 37.36 |
| Energy intensity for sectors | 2019 | 2030 | 2035 | 2030 | 2035 |
| Agricultural | 0.26 | 0.29 | 0.29 | 0.29 | 0.29 |
| Industrial | 1.63 | 1.78 | 1.78 | 1.36 | 1.24 |
| Building | 0.15 | 0.15 | 0.15 | 0.15 | 0.15 |
| Transport | 1.02 | 1.03 | 1.03 | 0.82 | 0.72 |
| Services | 0.09 | 0.10 | 0.10 | 0.10 | 0.10 |
| Residential | 0.34 | 0.33 | 0.33 | 0.33 | 0.33 |
| GDP share (%) for sectors | 2019 | 2030 | 2035 | 2030 | 2035 |
| Agricultural | 5.14 | 5.28 | 5.28 | 4.36 | 4.00 |
| Industrial | 38.58 | 37.21 | 37.23 | 29.24 | 25.00 |
| Building | 5.26 | 5.81 | 5.80 | 5.08 | 5.00 |
| Transport | 5.91 | 6.40 | 6.40 | 5.97 | 6.00 |
| Services | 45.11 | 45.30 | 45.29 | 55.35 | 60.00 |
| Sector GDP Ratio (%) | 2019 | 2030 | 2035 | ||||||||
|---|---|---|---|---|---|---|---|---|---|---|---|
| Base Year | |||||||||||
| Agriculture | 5.1 | 4.4 | 4.4 | 4.4 | 4.4 | 4.4 | 4.0 | 4.0 | 4.0 | 4.0 | 4.0 |
| Industrial | 38.6 | 25.8 | 27.5 | 29.2 | 31.0 | 32.7 | 20.0 | 22.5 | 25.0 | 27.5 | 30.0 |
| Building | 5.3 | 5.1 | 5.1 | 5.1 | 5.1 | 5.1 | 5.0 | 5.0 | 5.0 | 5.0 | 5.0 |
| Transport | 5.9 | 6.0 | 6.0 | 6.0 | 6.0 | 6.0 | 6.0 | 6.0 | 6.0 | 6.0 | 6.0 |
| Service | 45.1 | 58.8 | 57.1 | 55.3 | 53.6 | 51.9 | 65.0 | 62.5 | 60.0 | 57.5 | 55.0 |
Publisher’s Note: MDPI stays neutral with regard to jurisdictional claims in published maps and institutional affiliations. |
© 2022 by the authors. Licensee MDPI, Basel, Switzerland. This article is an open access article distributed under the terms and conditions of the Creative Commons Attribution (CC BY) license (https://creativecommons.org/licenses/by/4.0/).
Share and Cite
Zou, X.; Wang, R.; Hu, G.; Rong, Z.; Li, J. CO2 Emissions Forecast and Emissions Peak Analysis in Shanxi Province, China: An Application of the LEAP Model. Sustainability 2022, 14, 637. https://doi.org/10.3390/su14020637
Zou X, Wang R, Hu G, Rong Z, Li J. CO2 Emissions Forecast and Emissions Peak Analysis in Shanxi Province, China: An Application of the LEAP Model. Sustainability. 2022; 14(2):637. https://doi.org/10.3390/su14020637
Chicago/Turabian StyleZou, Xin, Renfeng Wang, Guohui Hu, Zhuang Rong, and Jiaxuan Li. 2022. "CO2 Emissions Forecast and Emissions Peak Analysis in Shanxi Province, China: An Application of the LEAP Model" Sustainability 14, no. 2: 637. https://doi.org/10.3390/su14020637
APA StyleZou, X., Wang, R., Hu, G., Rong, Z., & Li, J. (2022). CO2 Emissions Forecast and Emissions Peak Analysis in Shanxi Province, China: An Application of the LEAP Model. Sustainability, 14(2), 637. https://doi.org/10.3390/su14020637